
Abstract
Background:
A 9-grid scheme has been integrated into the foot and ankle literature to help clinicians and researchers localize osteochondral lesions of the talus (OLTs). We hypothesized that fellowship-trained orthopedic foot and ankle surgeons would have a high rate of intra/inter-observer reliability when localizing OLTs, therefore validating the scheme.
Methods:
We queried our institution’s foot and ankle radiographic database for magnetic resonance images with OLTs. Each MRI was reviewed by the senior author, and 2 key images (widest OLT diameter) from each tangential view were copied and combined onto one slide. Fifty consecutive deidentified images of ankles were then sent to 4 practicing fellowship-trained foot and ankle surgeons. Each was asked to identify which zone the OLT was localized within. A radiologist’s report served as the control. Statistical analyses were performed using Cohen and Fleiss kappa tests.
Results:
The reviewers demonstrated majority consensus on 45/50 images with substantial agreement for zones 4 and 6. The interobserver reliability was moderate with a κ = 0.55. The mean intraobserver reliability was substantial, with a κ = 0.79. A musculoskeletal radiologist determined there were 3 lesions in zone 7, 18 lesions in zone 4, and 29 lesions in zone 6.
Conclusion:
This study is the first to critically evaluate the 9-grid scheme and its reliability among orthopedic foot and ankle surgeons. Our study found that the 9-grid scheme is an accurate method of localization for OLTs with high intra- and moderate interobserver reliability between surgeons.
Level of Evidence:
Level IV, retrospective diagnostic study.
Introduction
Osteochondral lesions of the talus (OLTs) are a difficult pathology to diagnose and effectively treat. With an estimated incidence of 27 per 100 000 person-years, these lesions are not uncommon. 17 The etiology of OLTs is primarily due to damage of the talar articular surface and the subchondral bone. They occur most commonly secondary to trauma when the ankle is sprained or fractured, forcing the articular surface of the talus into either the tibia or fibula. Less commonly, nontraumatic OLTs have been described following subchondral vascular occlusion, microtrauma, genetic susceptibility, and chronic ankle instability. 7,14 It has classically been described that OLTs occurring on the lateral talus are a result of more traumatic events, whereas medial lesions are a result of more degenerative processes. 6,7,24
Patients with OLTs will often complain of pain in the ankle on weightbearing, swelling, decreased range of motion, a sensation of stiffness, catching, locking, and instability. All of these may limit a patient’s activity level, leading them to seek medical care. There are effective nonoperative and operative treatments. 10,14,21 However, imaging is essential in determining the location and stage of the lesion. After imaging, an effective treatment plan can be developed for either conservative or operative management. Operative options are extensive and are determined by the OLT stage, size, location, and surgeon preference. 21,23,27,29
Traditionally, radiography was used to identify OLTs but fell short in detecting smaller lesions and evaluating the articular cartilage. 1,13,16,25 Mintz et al 15 found that by using magnetic resonance image (MRI) instead of radiography they were able to correctly classify all OLTs with a specificity of 100% using an arthroscopic based scoring system. There are numerous staging systems in place to assess for subchondral compression, cystic lesion development, and fragment displacement based on different imaging modalities. 2,8,15,19 However, the gold standard for staging still remains intraoperative arthroscopic grading. 20 Most papers use medial/lateral and anterior/posterior when describing location, but there is no accepted mechanism to effectively localize the lesion with consistency. 28 Elias et al 6 proposed a 9-grid scoring system to help surgeons with preoperative planning, locating the lesion intraoperatively, and following their response to therapy. This method is gaining popularity with surgeons from the International Consensus Meeting on Cartilage Repair of the Ankle, stating there was a strong consensus for its utility within the orthopedic community. 26 Furthermore, it has been used in both basic science and clinical research. 12,18 However, there has been no study to evaluate its validity within the literature.
The purpose of this study was to validate the 9-grid localization scheme on MRIs put forth by Elias et al 6 for OLTs. We hypothesized that this system would display high intraobserver and interobserver reliability between fellowship-trained orthopedic foot and ankle surgeons and substantiate the widespread use of the 9-grid scheme. Furthermore, fellowship-trained surgeons would be able to accurately identify and localize OLTs using only 6 key T2-weighted MRIs, allowing this model to be used for training and education.
Methods
We queried our institution’s orthopedic foot and ankle database for ankle MRI examinations, which included OLTs. The database was generated by the senior author’s practice from 2014 through 2020, and the subcategory “Medium to large surgically treated OLTs” was selected. This category only included OLTs that went on to have arthroscopic cartilage procedures performed, including bone marrow stimulation or cartilage allograft, Bio-cartilage (Arthrex, Naples, FL), and DeNovo (Zimmer, Warsaw, IN). The database did not include OLTs that were associated with acute fractures, osteonecrosis, and chronic degenerative reciprocal tibial lesions. The retrospective nature of the database blinded the process to the procedure performed, etiology, and demographics. The database included approximately 250 MRI examinations with reports that included OLT verification by a musculoskeletal radiologist using either a 1.5-tesla (T) or 3-T standard protocol at our institution. In order to mitigate selection bias, the MRI examinations were selected chronologically. Inclusion within the aforementioned database consisted of 1 or more lesions on the articular surface of the talar dome as described by Hepple et al. 8 Studies were excluded because of poor image quality secondary to motion, implant artifact, skeletal immaturity, or incomplete studies. All plain radiographs, computed tomography (CT), and MRI arthrograms were also excluded from the study.
Fifty MRI examinations were selected for review and inclusion within the study. Our predetermined study protocol included only 6 T2 images, 2 from each of the sagittal, coronal, and axial planes. The senior author identified the center of the OLT on each plane using our PACS system. The image and 1 contiguous slice in either direction containing more of the lesion was selected, and specifically the most superficial axial image and 1 distal contiguous slice. These 6 images were then placed on a standard blank PowerPoint (Microsoft Corp, Redmond, WA) slide with no measurement scale or means of measurement provided (Figure 1). The slides were then randomized, numbered, and sent to 4 practicing fellowship-trained orthopedic foot and ankle surgeons. The 4 reviewers (2 academic and 2 community-based) were asked to independently determine the grid square (surface location) they felt the OLT was mostly located in and would most appropriately be recorded or charted in their practice. The grid scheme, as described by Elias et al, 6 divides the talar dome into a 3-column by 3-row grid scheme (9 zones) to localize the location of OLTs (Figure 2). The reviewers were blinded to the database and all inclusion and exclusion criteria. Reviewers independently returned their grid locations for each lesion in a spreadsheet. The senior author then randomized the images and sent them back for a second evaluation 2 weeks later to serve as an intraobserver measure. Our institution’s musculoskeletal radiologists assessed each ankle using a full MRI series with both T1- and T2-weighted images. Their report, which included the OLT grid zone, served as the gold standard control group.

T2-weighted MRIs demonstrating an OLT in the (A, B) coronal, (C, D) sagittal, and (E, F) axial planes. Each reviewer used these 6 key images to determine the OLT grid square location. MRI, magnetic resonance image; OLT, osteochondral lesion of the talus.

T2-weighted MRI demonstrating the 9-zone grid scheme of the talar dome, with zone 6 central-lateral and zone 4 central-medial. MRI, magnetic resonance imaging.
Fleiss and Cohen kappa were calculated to measure the intra- and interobserver reliability of localizing a lesion on MRI using the grid scheme proposed by Elias et al. 6 The quality of the agreement was calculated as 0.41 to 0.60 as moderate agreement, 0.61 to 0.80 as substantial agreement, and 0.81 to 1 as almost perfect agreement based on Landis and Koch. 11 All data were analyzed using SPSS version 26 (IBM Corp, Armonk, NY) with an α level of P < .05.
Results
The foot and ankle surgeons demonstrated a majority consensus on 45/50 images with substantial agreement for zone 4 and 6 with kappa values of 0.61 and 0.62, respectively (Table 1). Fleiss kappa was run to determine if there was agreement between the raters on localizing OLTs on MRI. There was moderate agreement between the raters, κ = 0.55 (Table 2). Cohen kappa was run to determine intraobserver reliability for individual observers. The mean intraobserver reliability was substantial, κ = 0.79 (Table 2). All kappa statistics were significant with P < .05. Two musculoskeletal radiologists determined there were 3 lesions in zone 7, 18 lesions in zone 4, and 29 lesions in zone 6. The accuracy of the raters as compared to the musculoskeletal radiologists’ read ranged from 62%, 70%, 76%, and 82%, with a group majority consensus accuracy of 80% (36/45, excluding the 5 images where there was no major consensus).
Interobserver Reliability Between the 4 Raters for Specific Locations of Osteochondral Lesions of the Talus.
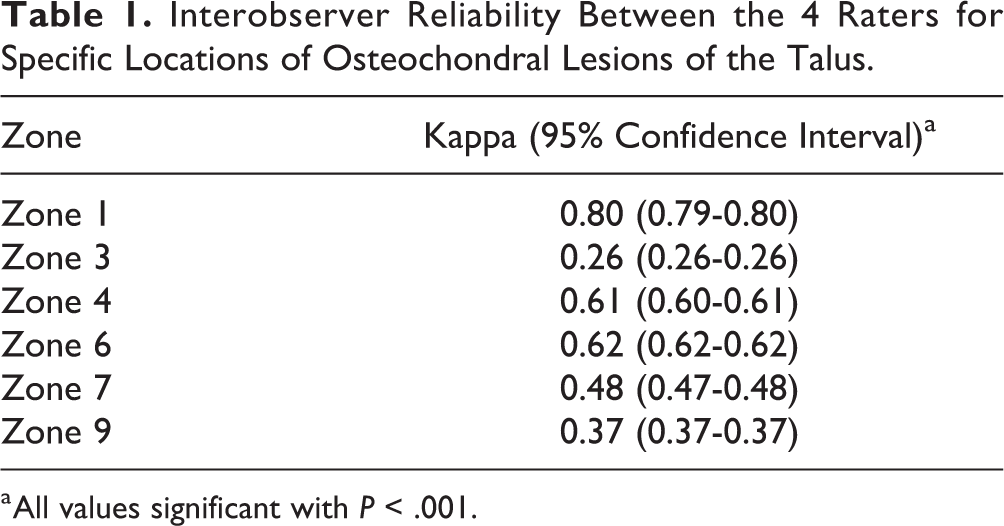
a All values significant with P < .001.
Interobserver and Intraobserver Reliabilities for Locating Osteochondral Lesions of the Talus Using a Novel Nine Zone Grid.
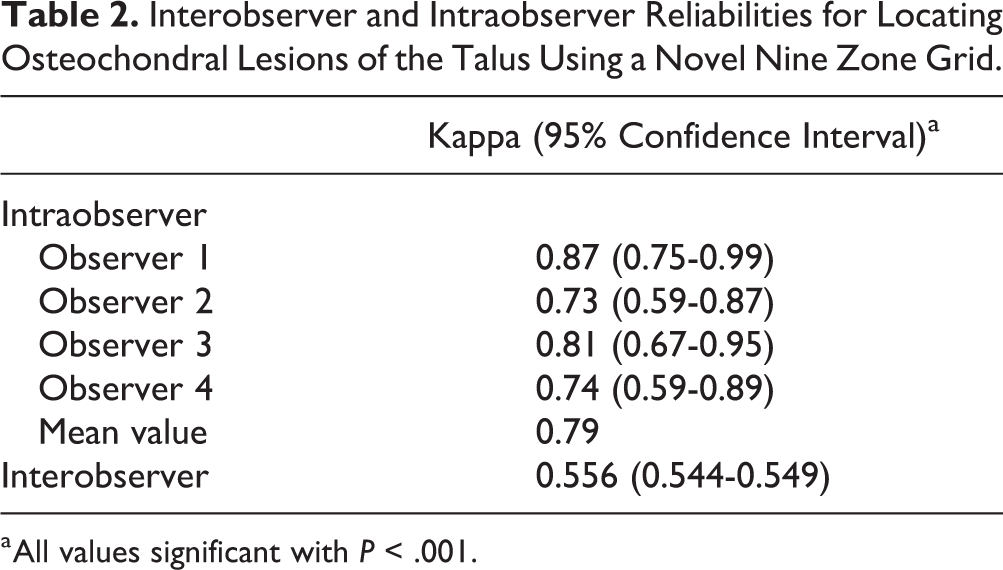
a All values significant with P < .001.
Discussion
To our knowledge, this is the first study to validate mapping OLTs using the 9-grid scheme proposed by Elias et al. 6 Our goal was to validate this grid system for use by fellowship-trained orthopedic foot and ankle surgeons using only 6 key MRIs taken from a complete MRI examination of the ankle. The hope of this study is to ease preoperative diagnosis, mapping, and communication between team members, while adding validity and consistency to the body of literature. There was a group consensus on 45 of the 50 OLTs with an accuracy of 80% compared with the radiologist’s report, illustrating that 6 key images from an MRI examination are sufficient to identify the location of an OLT. Nonetheless, more research needs to be done to determine the number of images and appropriate images to allow this technique to be perfected for future studies and educational purposes.
Studies have used the 9-grid scheme to determine the prevalence of different OLT locations, and there is strong consensus among the orthopedic community for this grid scheme. 6,18,26 Our study further supports the literature that kappa values can be used in the orthopedic and radiology communities to validate radiographic analysis of different osseous or cartilaginous lesions in the extremities. 3,5,9 Furthermore, many studies have found MRI accurate and superior to other imaging studies when diagnosing OLTs as this imaging modality is better at evaluating the overlying cartilage. 15,22 When analyzing our data, we found moderate agreement between the 4 foot and ankle surgeons. Although still statistically significant, one possibility for this less than perfect agreement could be due to the raters having to choose between 2 grid locations because of larger lesions that involved multiple peripheral grid locations. For lesions spanning more than 1 zone, Elias et al 6 described an approach where raters could either decide to pick where the center is or where most of the lesion is located leading to more subjectivity and discrepancies. Moreover, the position of the ankle in resting plantarflexion during MRI acquisition may change the central axis of the talar dome in both sagittal and axial planes, resulting in different zone allocation by different interpreting surgeons. Another potential confounder was the presence of discrete subchondral edema or bone cysts in a zone different from the zone of overlying cartilage delamination, which might have guided the surgeons to one zone vs the other.
However, when looking at individual locations, there is substantial agreement when it comes to the orthopedic surgeons rating OLTs in zone 4 or 6. Historically, most lesions were thought to be located in the anterolateral or posteromedial talar dome. 2,7 Two recent studies have challenged this belief by illustrating that most lesions occur in the centromedial and centrolateral talar dome. 6,18 Our results further support these 2 studies as most of the lesions in our study were in zones 4 and 6. A postulated reason for these locations is that the equatorial region of the talar dome is the major weightbearing portion of the bone. As a result, the 9-grid system provides a simplistic, yet inclusive, framework to accurately localize the most common lesions located in these centromedial and centrolateral zones. Therefore, our results show promise for this grid system, with raters having substantial agreement for lesions located in the most common grid locations.
Elias et al 6 first proposed the use of the 9-grid scoring system as an important factor in preoperative planning. The surgeon must be able to review an MRI in the office and, taken together with the history and physical examination, come up with the best course of action. Intraoperatively the surgeon needs to be able to refer to the affected grid in order to determine patient positioning and the surgical approach, either open or arthroscopic. 4 The need for an accurate localization also translates to postoperative management as the surgeon must be able to evaluate the patient’s response to treatment. Having a system in place where a surgeon can consistently document specific location in a practical way is necessary for proper management. For the 9-grid scoring system to be of benefit, it is imperative this system is validated and translatable to fellow surgeons. Our study shows substantial intraobserver agreement with a kappa of 0.79 across all 4 fellowship-trained foot and ankle specialists providing more evidence for the benefit of the 9-grid scoring system. A possible explanation for the improved reliability as compared to interobserver reliability is that foot and ankle surgeons were more likely to be consistent when localizing a large lesion to a single zone. With further training and a clearer consensus on how to localize large lesions, this system will likely improve among surgeons and continue to serve as an easy and practical tool.
Our study is not without limitation, the most significant of which is that the reviewers were limited to only 6 key T2 images with no ability to measure or adjust contrast. Although this is a limitation, it was intentional to facilitate 4 independent reviews from surgeons with various academic and community-based practices. All the OLT images were also from within a surgical database indicating statistical bias to zone 6 and 4. 6,18 The key images were also selected by the senior author using best judgement to capture the location. We also were under the assumption that the radiologists correctly identified the lesions to use as a comparison for accuracy, as we were blinded to the surgical information of the database. Our inherent limitations serve to facilitate the strengths, which included 4 independent reviewers who were able to demonstrate moderate significant reliability using only 6 images. On a second review, the reviewers’ intrarater reliability was classified as substantial, again emphasizing the utility and reproducibility of the grid scheme. We also acknowledge that future studies may consider using the complete MRI examination, an educational refresher course prior to localizing the OLTs, and comparing MRI examination with arthroscopic localization.
Conclusion
There was a majority consensus on 45 of the 50 OLT images with substantial intraobserver reliability. These results demonstrate the reliability and utility of the 9-grid scheme to localize OLTs. The grid scheme had inherent flaws localizing larger peripheral lesions that meld grid lines. Nonetheless, we strongly feel the 9-grid scheme is valid, and this study should stand as a validation trial, thus furthering its incorporation into practice and research standards.
Supplemental Material
Supplemental Material, FAO944925-ICMJE - Validation of 9-Grid Scheme for Localizing Osteochondral Lesions of the Talus
Supplemental Material, FAO944925-ICMJE for Validation of 9-Grid Scheme for Localizing Osteochondral Lesions of the Talus by Kevin D. Martin, Trevor J. McBride, Dylan P. Horan, Amgad Haleem, Jeannie Huh, Adam Groth and Laura K. Dawson in Foot & Ankle Orthopaedics
Footnotes
Ethical Approval
Ethical approval was not sought for the present study because all images were taken from a deidentified database and all reviewers were blinded to all patient characteristics.
Declaration of Conflicting Interests
The author(s) declared no potential conflicts of interest with respect to the research, authorship, and/or publication of this article. ICMJE forms for all authors are available online.
Funding
The author(s) received no financial support for the research, authorship, and/or publication of this article.
References
Supplementary Material
Please find the following supplemental material available below.
For Open Access articles published under a Creative Commons License, all supplemental material carries the same license as the article it is associated with.
For non-Open Access articles published, all supplemental material carries a non-exclusive license, and permission requests for re-use of supplemental material or any part of supplemental material shall be sent directly to the copyright owner as specified in the copyright notice associated with the article.