
Abstract
Robust and well-established techniques for the quantification and characterization of extracellular vesicles (EVs) are a crucial need for the utilization of EVs as potential diagnostic and therapeutic tools. Current bulk analysis techniques such as proteomics and Western blot suffer from low resolution in the detection of small changes in target marker expression levels, exemplified by the heterogeneity of EVs. Microscopy-based techniques can provide valuable information from individual EVs; however, they are time-consuming and statistically less powerful than other techniques. Flow cytometry has been successfully employed for the quantification and characterization of individual EVs within larger populations. However, traditional flow cytometry is not highly suited for the examination of smaller, submicron particles. Here we demonstrate the accurate and precise quantification of nanoparticles such as EVs using the Virus Counter 3100 (VC3100) platform, a fluorescence-based technique that uses the principles of flow cytometry with critical enhancements to enable the effective detection of smaller particles. This approach can detect nanoparticles precisely with no evidence of inaccurate concentration measurement from masking effects associated with traditional nanoparticle tracking analysis (NTA). Fluorescently labeled EVs from different sources were successfully quantified using the VC3100 without a postlabeling washing step. Moreover, protein profiling and characterization of individual EVs were achieved and have been shown to determine the expression level of target protein markers.
Keywords
Introduction
Almost all cell types release phospholipid bilayer-enclosed vesicles called extracellular vesicles (EVs) into their environments.1,2 EVs are present in a variety of biological fluids, such as plasma, serum, saliva, and urine, as well as cell-conditioned media. 3 EVs range in size from 30 to 1000 nm and carry proteins, nucleic acids, and lipids.1,2,4 EVs can be classified into three subtypes based on their biogenesis: (1) exosomes that are formed from multivesicular bodies and are released by the fusion of multivesicular bodies with the plasma membrane; (2) microvesicles produced by direct outward budding from the plasma membrane; and (3) apoptotic bodies that are shed by cells undergoing apoptosis.2,3,5
Over the past decades, interest in EVs as diagnostic and therapeutic tools has been expanding due to their demonstrated roles in physiological and pathological processes.1,6 EVs play an important role in cell–cell communication using different signaling pathways, such as transferring bioactive cargo into recipient cells and in their interaction with the recipient cell ligands.5,7,8 As a result, many studies have stressed the therapeutic potential of EVs as drug delivery vehicles and vaccines, as they are advantageous in both modified and unmodified states, compared with the synthetic delivery vehicles.8–10 Furthermore, circulating EVs have been shown to be involved in the establishment and maintenance of the tumor environment by promotion of cancer cell expansion, suppression of immune function, potentiation of metastasis, and induction of cancer cell angiogenesis.11–14
Several studies have reported elevated EV release when cells are subjected to stress, activation, and stimulation, as well as disease states such as cardiovascular disease, cancer, sepsis, and autoimmune diseases.8,11,15 EVs in biological fluids have been proposed as novel biomarkers for the noninvasive detection and monitoring of diseases.2,11,16 Therefore, precise quantification and biomarker profiling of EVs are essential to enable their potential as diagnostic and therapeutic tools.
EVs are highly heterogeneous with respect to size, cells of origin, composition, and surface protein expression.17–19 Due to their small size and heterogeneity, quantitative and qualitative analysis of EVs remains challenging using bulk analysis techniques such as proteomics, lipidomics, and Western blot. For example, bulk analysis techniques are incapable of detecting small changes to target markers. Moreover, the detected differences in the target expression may be related to the number of EVs tested.17,20–23 A preferred alternative would be the quantification and characterization of EVs on a single-particle basis. Visualization-based techniques such as electron microscopy (EM) and atomic force microscopy (AFM) have been used to characterize EVs.24–26 However, these techniques are time-consuming and are not sufficiently statistically powerful.17,18,23 Nanoparticle tracking analysis (NTA) is the most widely used technique for determining the size and concentration of EVs.27–29 Nevertheless, NTA as a scattering-based technique is less accurate and precise with heterogeneous sample populations such as EVs and is incapable of discriminating contaminants such as protein aggregates from true individual EVs.23,30–32 In recent years, high-resolution flow cytometry has been developed to detect nano-sized particles.21,22,33 However, the scattering-based analysis by flow cytometry can lead to incorrect measurements due to the confounding issues of coincidence and swarm detection caused by the simultaneous presence of multiple EVs within the analysis window.21,32 Additionally, the small size of EVs and their low refractive indices (RIs) make their detection from the high background instrument noise challenging.23,31,34
Fluorescent-based detection of EVs using flow cytometry has been employed to better resolve EVs from the background noise and is independent of size and RI.16,35 However, the unincorporated fluorescent dyes postlabeling can contribute to the background noise and consequently adversely affect the signal-to-noise ratios.33,35,36 Therefore, a sensitive, reliable, and high-throughput technique is needed to precisely quantify and characterize EVs.
The Virus Counter 3100 (VC3100) platform is a powerful, automated, and fluorescence-based technique originally developed explicitly for the quantification and characterization of viruses.37,38 As viruses and EVs share many common features, we were interested in determining if the VC3100 could be adapted to the study of EVs. 39 Here, we demonstrate that the VC3100 can be used for accurate quantification and biomarker profiling of EVs in an assay that does not require washing to remove unbound fluorescent reagents. We compare the performance of the VC3100 and NTA and find that the VC3100 is not prone to small-particle masking by larger particles as we observe with NTA analysis. We further studied the effect of coincidence and swarm detection on the measured concentration to verify the analysis of individual nanoparticles. We also showed that EVs from different sources can be reliably analyzed using this dedicated flow cytometry approach.
Materials and Methods
Virus Counter 3100
VC3100 was built for the detection of viruses. It uses the principle of hydrodynamic focusing to align particles in a narrow core for interrogation by laser light. The emitted light from fluorescent particles passing the laser spot is captured in photomultiplier tubes and time-stamped (
VC3100 Measurements of Nanoparticles
For each test, 300 µL of the prepared nanoparticles samples (Thermo Fisher) was run through the flow cell of the VC3100 instrument equipped with a 532 nm laser line. Three independent replicates of each sample were tested for 60 s each.
NTA Measurements of Nanoparticles
For each analysis run, 300 µL of the prepared samples was injected into the sample chamber of an NS300 instrument (NanoSight, Amesbury, UK) equipped with a 532 nm laser line. Three measurements of each sample were performed for 30 s each. Three independent replicates of each sample were tested. For the “Blur,” “Minimum expected particle size,” and “Minimal track lengths,” the stock auto adjustment settings provided with the instrument software were employed. The camera level (13) and detection threshold (5) were kept constant between measurements. For data capturing and analysis, the NTA software (NanoSight NTA 3.2) was used.
Serial Dilution Experiments
Threefold serially diluted samples of 50, 100, and 200 nm polystyrene (PS) nanoparticles were prepared in the concentration range of 5 × 10⁷ to 5 × 10⁹ for NTA and 5 × 10⁵ to 5 × 10⁹ for VC3100. For each sample, three independent replicates with a total volume of 300 µL were tested.
Mixture of Nanoparticle Experiments
Stocks samples with the same concentrations of 50, 100, and 200 nm PS nanoparticles (Thermo Fisher) were made. Different ratios of mixtures of nanoparticles were subsequently added together in phosphate-buffered saline (PBS) with the final concentration of 300 µL. For example, 50 µL of 50, 100, and 200 nm nanoparticles (same concentrations) was added to 150 µL of PBS.
EV Samples
Lyophilized exosome standards from biofluids (plasma, serum, urine, and saliva) of healthy donors and exosomes derived from conditioned cell culture medium (HEK293 and mouse cell line B16F10) were used from HansaBioMed (Estonia). One milliliter of deionized water was added to 100 µg of lyophilized standard to a final protein concentration of 0.1 µg/µL. The exosome samples were then resuspended by repeated pipetting. The reconstituted standards were mixed by vortex for 60 s. Following a brief centrifugation step, the samples were then aliquoted into polypropylene vials and stored at −20° C for up to 6 months.
CellMask Orange Labeling
CellMask orange (CMO) plasma membrane stain (5 mg/mL) was purchased from Thermo Fisher. The CMO stock was diluted 1000× to a final concentration of 5 µg/mL. Ten microliters of EVs from stock (2.5 × 10¹¹) was added to 10 µL of 1000× diluted CMO (5 µg/mL) and was incubated for 30 min. Ten microliters of the labeled EVs was then added to 290 µL of PBS and analyzed on the VC3100.
Detergent Treatment Experiments
Five microliters of CMO dye (1000× or 5 µg/mL) was added to 10 µL of EVs (5 × 10⁹) from different sources of EVs. After 30 min of incubation at room temperature, 85 µL of PBS was added. Four microliters of CMO-labeled EVs were treated with 5 µL of 10% Triton-X100 or PBS as the untreated control for use on ice. After an hour of incubation on ice, 5 µL of the untreated and detergent treated samples was added to 195 µL of PBS and then measured by the VC3100.
Immunofluorescent Labeling of EVs
PE-conjugated CD9 (clone MEM-61), PE-conjugated CD63 (clone H5C6), PE-conjugated CD81 (clone JS-81), and PE-conjugated mouse IgG1, k (clone MG1), were all purchased from Novus Biologicals (Littleton, CO). Five microliters of 50 µg/mL PE-conjugated antibodies against CD9, CD63, CD81, and the isotype control was added to 10 µL of EVs (2 × 10¹⁰). The mixture was incubated for 2 h at 37 °C and was diluted 100× prior to the analysis on the VC3100.
Statistical Analysis
GraphPad Prism version 8.0 (GraphPad Software, La Jolla, CA) was used for all statistical analyses. Paired two-tailed Student t tests were performed to determine the significance of the differences in the measured concentrations. Differences with p values below 0.05 were considered statistically significant.
Results
Performance of VC3100 in the Detection of PS Nanoparticles
A guideline was recently published as a framework for the standardized reporting of EV flow cytometry experiments. 40 As recommended by the guideline, serial dilution of the samples is a requisite assay control to establish individual nanoparticle detection on an instrument. Serial dilutions of 200, 100, and 50 nm PS nanoparticles were measured in the VC3100. The serial dilution plots of PS nanoparticles could be defined by three regions ( Fig. 1 ): (1) the linear region—the nanoparticle samples maintain a linear count consistent with the dilution factor, indicating the detection of single PS nanoparticles by the VC3100 in this region; (2) the coincidence region—the nanoparticle counts are no longer linear in relation to the dilution factor and reach a plateau; in this region, two or more nanoparticles are present in front of the laser and are counted as one event, leading to an underestimation of the sample concentrations; and (3) the swarm region—the sample concentrations are high enough such that a large number of particles enter the laser spot simultaneously. As a result, the baseline values failed to restore the PBS to control levels. This resulted in consistently elevated baseline values. At high sample concentrations, the core stream was saturated with nanoparticles, leading to a reduction in the measured concentration by the VC3100. These results demonstrate that the VC3100 is capable of individual nanoparticle detection both by its ability to demonstrate a linear correlation with dilution and the fact that the signal is saturable.
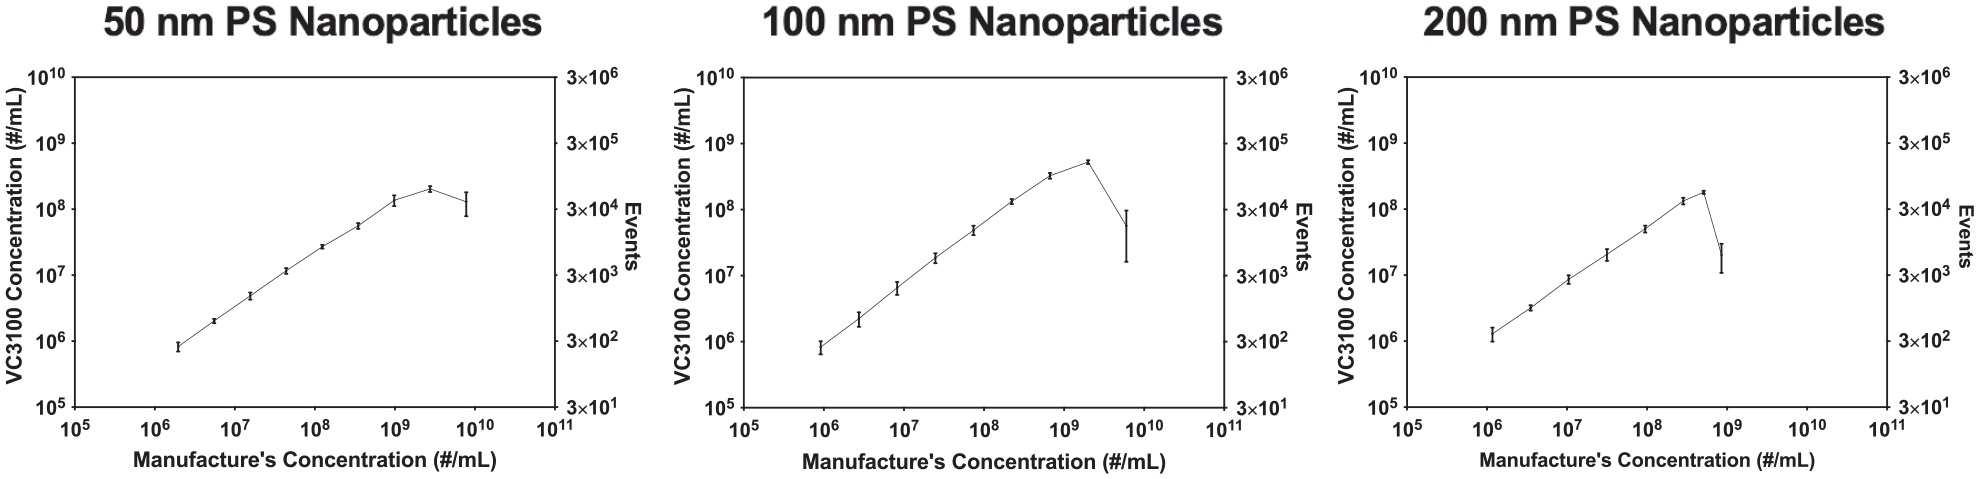
Serial dilution of 50, 100, and 200 nm PS nanoparticles to evaluate the performance of VC3100 in the linear and saturable enumeration of individual nanoparticles.
Performance Evaluation of NTA and VC3100 for Accurate Quantification of Nanoparticles in Polydisperse Samples
NTA is the most widely used technique in the EV field for the enumeration and sizing of nanoparticles in suspension. We evaluated and compared the performance of NTA and VC3100 for precise measurements of nanoparticles. Since NTA is a scattering-based technique, the RI of the nanoparticles plays an important role in the brightness of measured nanoparticles. Nanoparticles with a higher RI (1.59), such as PS nanoparticles, lead to a stronger scattering signal. Therefore, it is essential to use suitable reference materials with RIs similar to those of EVs to compare the performances of different techniques. We used silica nanoparticles with an RI of 1.46 as the reference nanoparticles provide the most appropriate surrogate of EVs (RI = 1.4).41–43 The size distribution of the nanoparticles was first characterized by scanning electron microscopy (SEM) and NTA (
In addition to the RI, the brightness of the scattering particles in NTA depends on the nanoparticles’ size. The scattering intensity of nanoparticles is proportional to the sixth power of their diameter.29,44 Therefore, for nanoparticles with equal RIs, smaller particles scatter less light and are harder to detect compared with larger ones (
The performance of NTA for measuring the concentration of polydisperse samples was evaluated. Mixtures of 200/100, 100/50, and 200/50 nm at 1:1 ratios were first measured using the same instrument settings. In all three samples, the NTA failed to accurately measure the concentration of smaller nanoparticles in the mixture ( Fig. 2 ). This is due to a phenomenon that is referred to as the “masking effect.” The intense light scattering of larger nanoparticles makes the smaller nanoparticles more challenging to detect and prevents some of them from being tracked by the software ( Fig. 2a–c ).27,43,45 This masking effect was significant in the mixtures with 50 nm nanoparticles ( Fig. 2a,b,d ). Quantitative analysis of the concentrations individually and combined illustrated the inaccuracy in the resulting concentration measurements ( Fig. 2e ). In fact, the 50 nm nanoparticles were barely detected in the 200/50 nm mixture. In the next iteration, a mixture of 50/100/200 nm nanoparticles with a 1:1:1 ratio was measured using the same instrument settings. The masking effect was observed again, and 50 nm nanoparticles were barely detectable in the mixture of three different size nanoparticles by NTA ( Fig. 2d ).
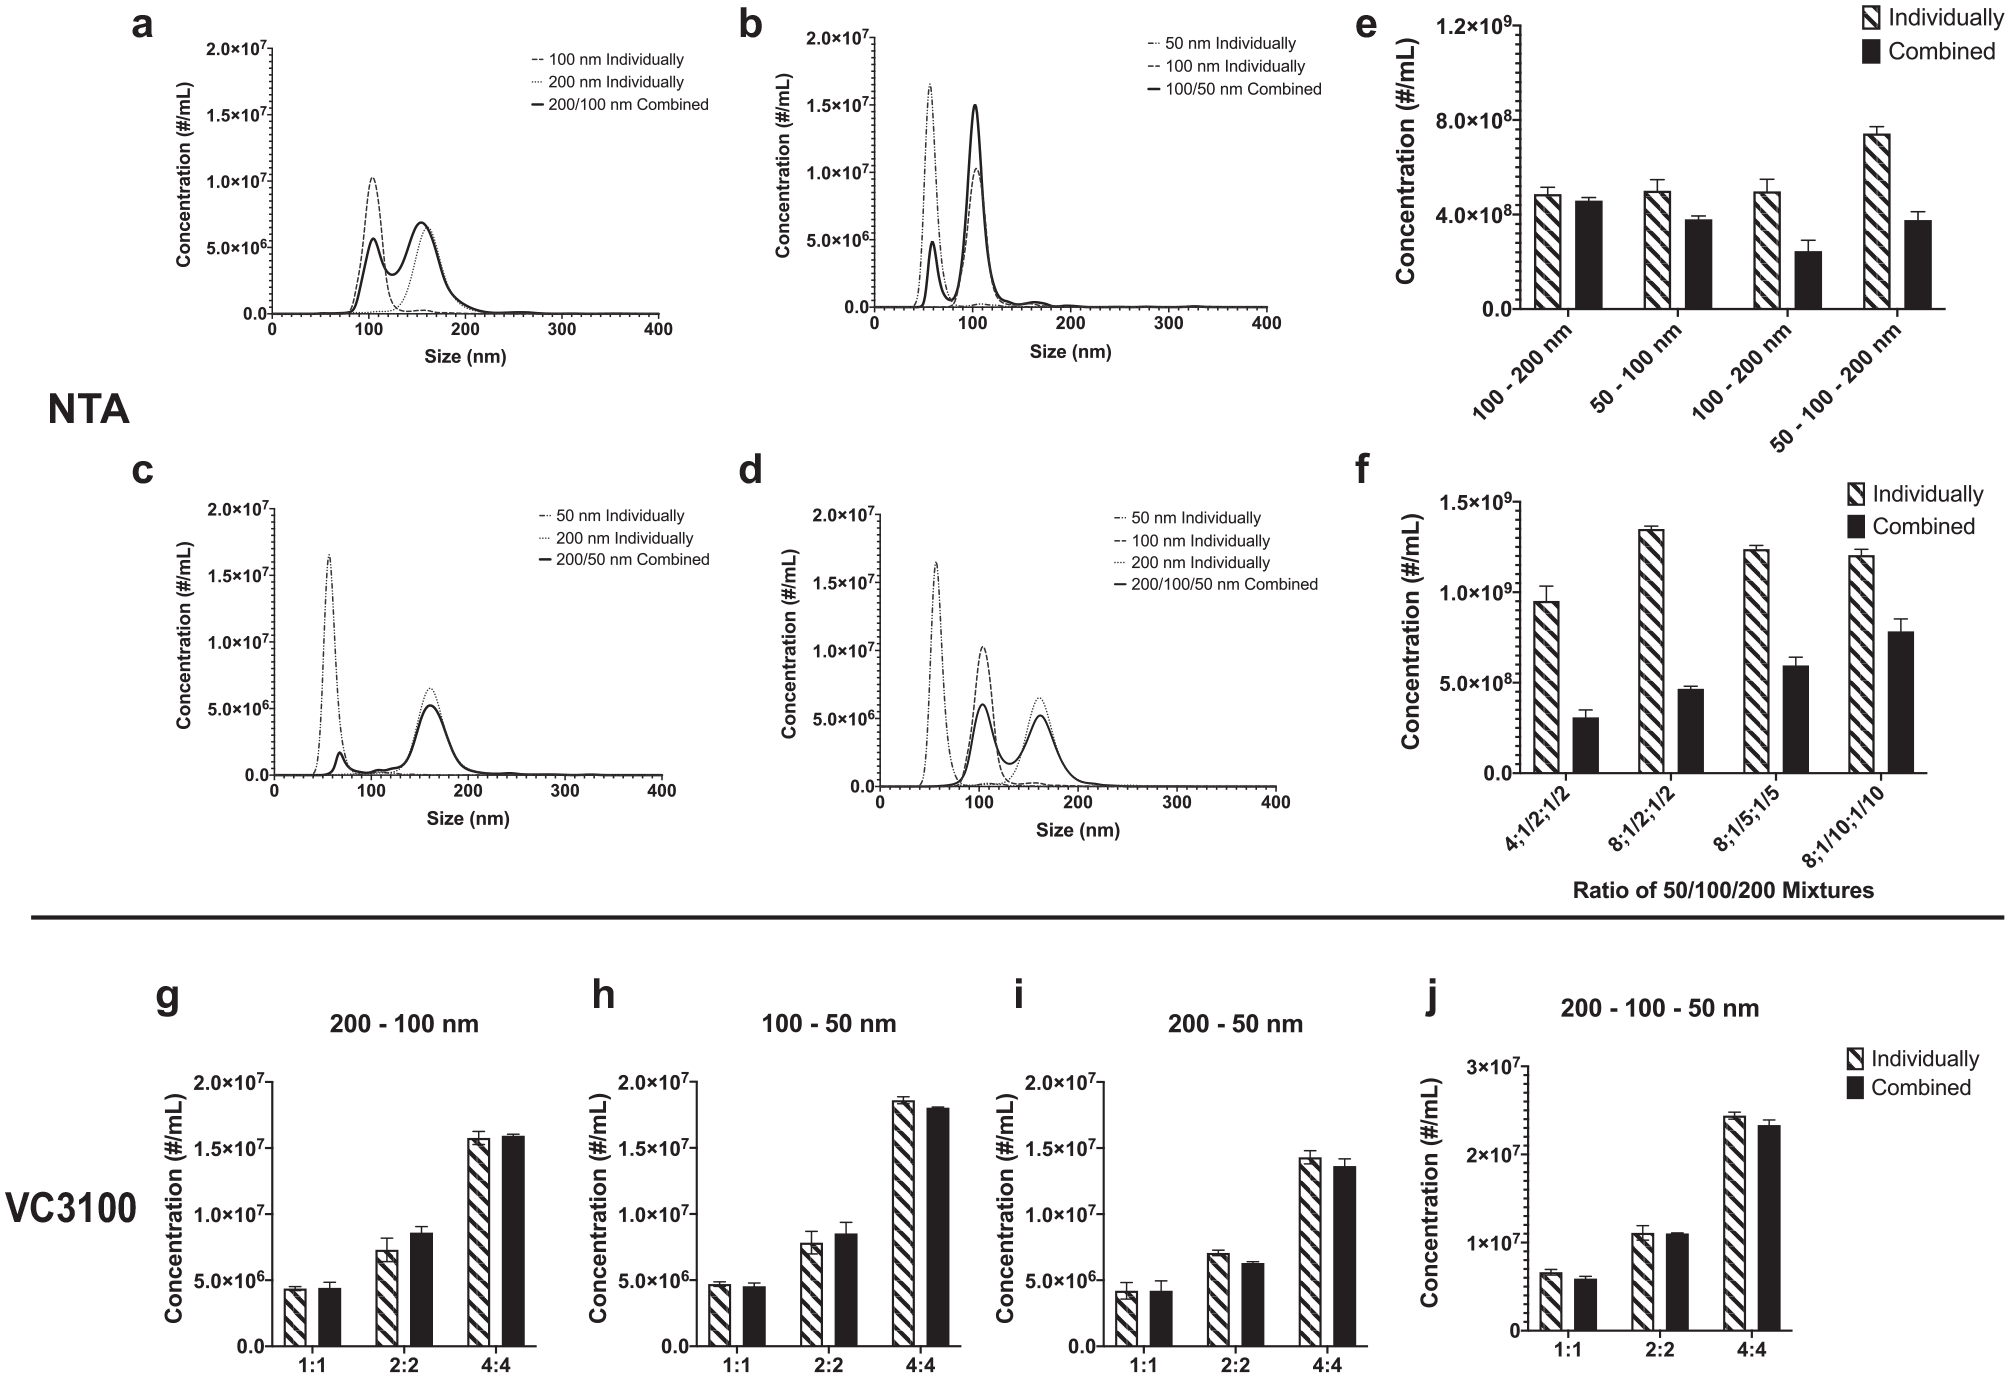
Performance comparison of NTA and VC3100 for accurate quantification of nanoparticles in polydisperse samples. NTA plots of mixtures with a 1:1 ratio of (
We hypothesized that if the reason for masking was the presence of larger nanoparticles, by increasing the ratio of 50 nm nanoparticles to 100 and 200 nm particles, the masking effect should be less significant. To test this hypothesis, the ratio of nanoparticles in the mixture was systematically changed, and the samples were measured by NTA. The concentration of 50 nm nanoparticles was increased while the concentrations of 100 and 200 nm nanoparticles were systematically decreased. By increasing the ratio of 50 nm to 100 and 200 nm nanoparticles, signals from 50 nm nanoparticles increased and, at high ratios, approached the expected concentration values (
Similar to NTA, the performance of the VC3100 for the concentration measurements of polydisperse samples was also evaluated. Initially, mixtures of two different size nanoparticles with different ratios were first tested. In all samples tested, the concentrations in polydisperse samples demonstrated an accurate enumeration of particles within different mixed ratios ( Fig. 2g–i ). Subsequently, samples with 50, 100, and 200 nm nanoparticles in four separate ratios were tested on the VC3100. The concentration analysis of samples individually and combined showed no evidence of underestimation of the concentration ( Fig. 2j ). In aggregate, and in contrast to NTA, measurements using the VC3100 did not appear to be affected by the masking effect. These data support the VC3100 as a powerful platform for the more accurate quantification of nanoparticles in polydisperse samples.
Quantification of EVs by VC3100
In this study, commercially available purified EV samples derived from the urine of healthy donors were purchased and tested. As the VC3100 is a fluorescence-based technique, quantification can only be achieved by labeling EVs with a fluorescent dye compatible with the system. Urinary EVs were labeled by CMO, a lipophilic dye that labels the lipid membrane of EVs and was analyzed on the VC3100 in a no-wash assay. In this assay, with proper controls, CMO-labeled urinary EVs were successfully quantified by the VC3100 without conducting a washing step. To confirm the detection of individual vesicles, the EV samples were serially diluted and their concentrations were measured using the VC3100. Similar to PS nanoparticles, a linear count consistent with the dilution was observed, indicating the successful enumeration of individual EVs ( Fig. 3a ). For concentrations near the upper detection limit of the VC3100, the sample counts were lower than predicted due to coincidence. Finally, in the swarm region, the measured concentration of EVs dropped when the core stream was saturated with EVs, as expected ( Fig. 3a ).
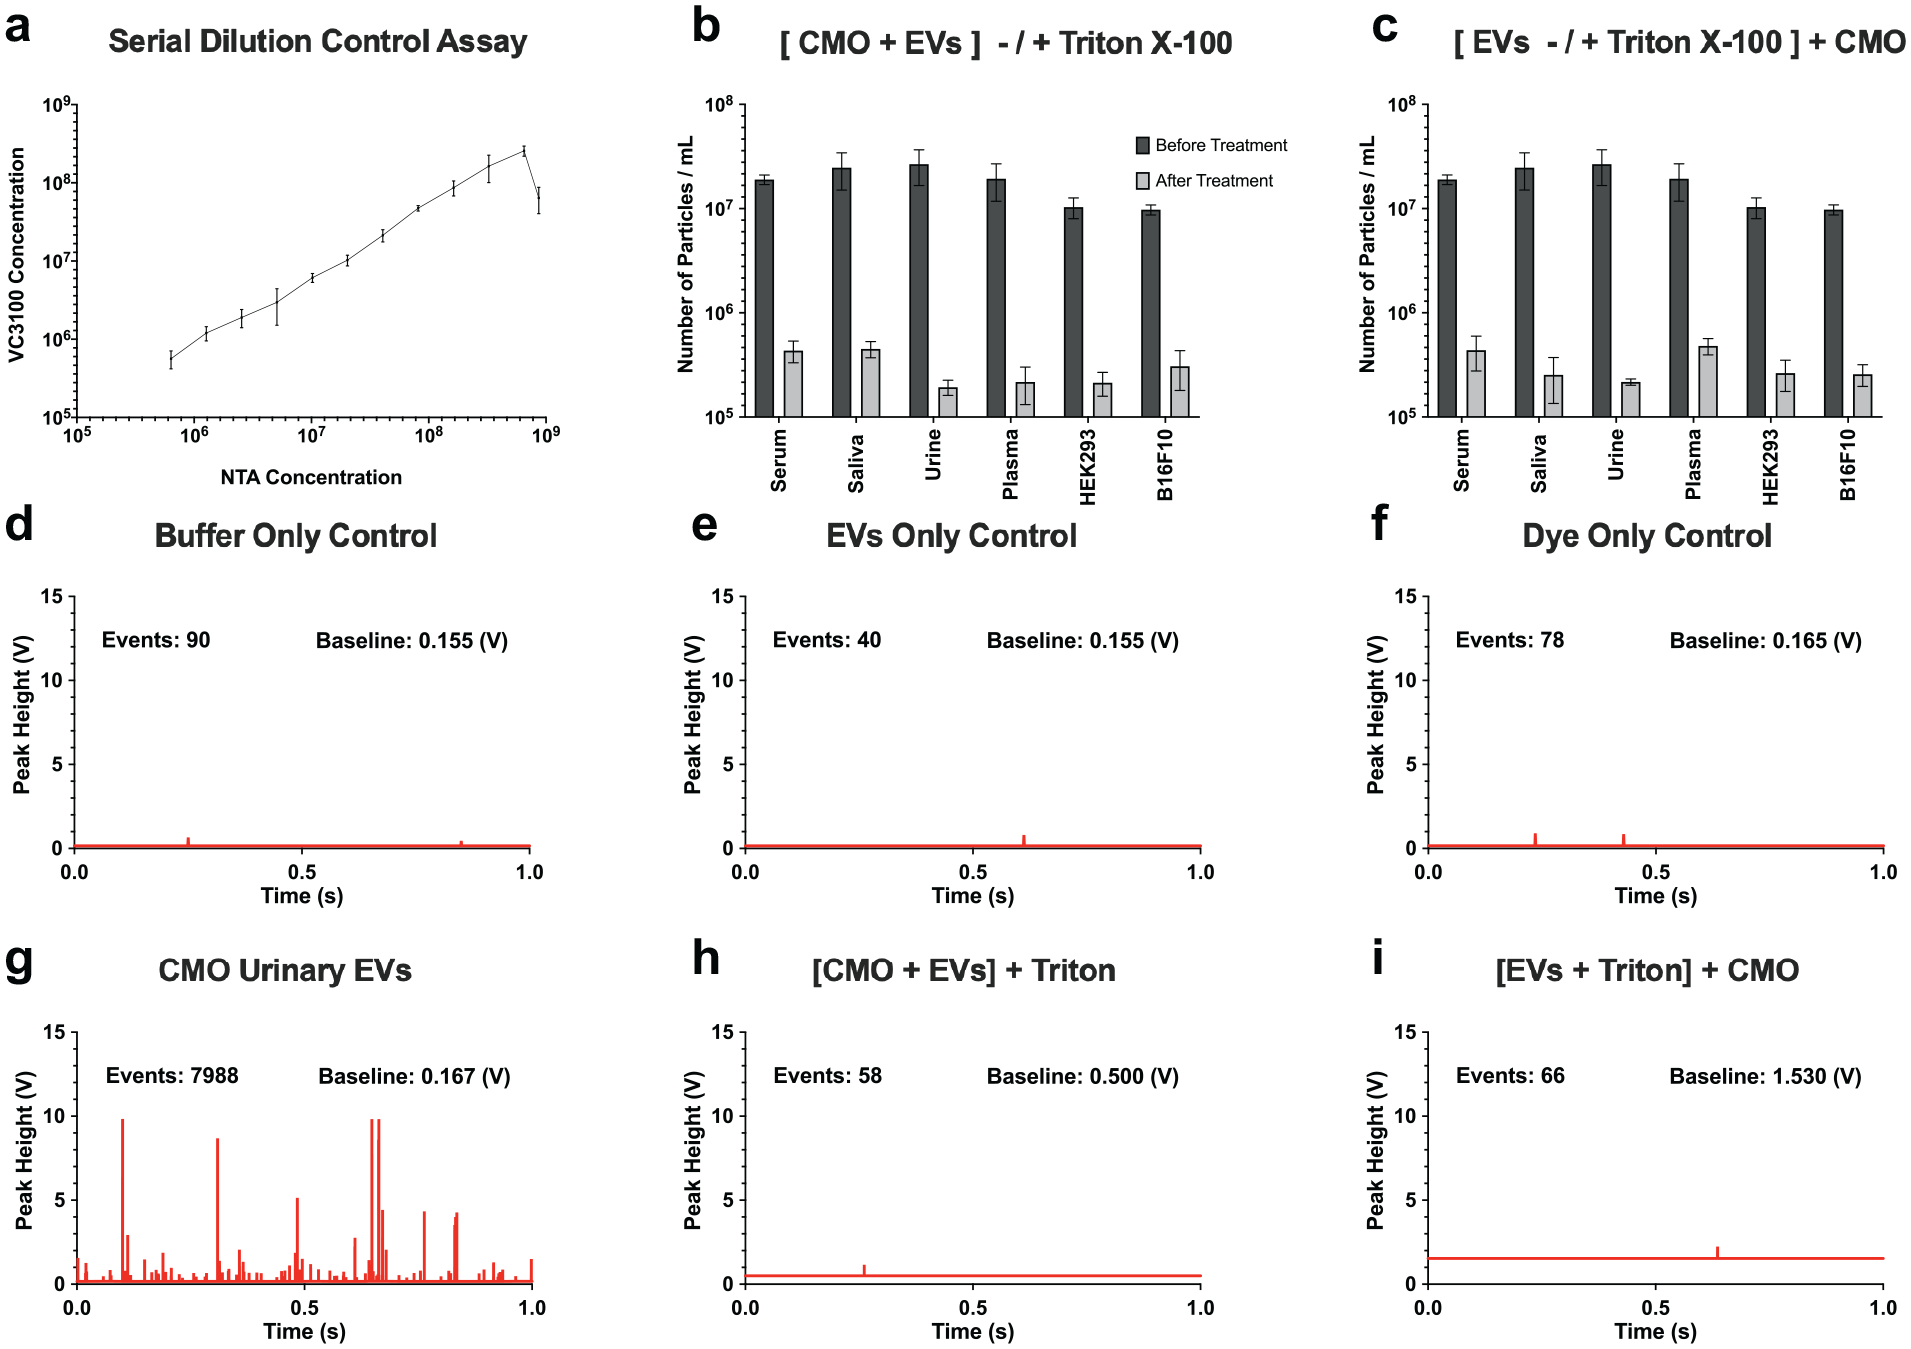
Quantification of EVs from different sources by the VC3100. (
Furthermore, while counts did generally correlate between the two techniques, the VC3100-measured concentrations of CMO-labeled EVs in the linear region were 50%–60% of the NTA concentrations of unlabeled EVs ( Fig. 3a ). It is important to note that scattering-based measurements by NTA will track non-EV particles as positive events since NTA cannot distinguish between EVs and non-EV contaminants in the samples. Additionally, particles can be counted more than once by NTA when the software loses tracking of some particles detected during the analysis. Therefore, as NTA-measured concentrations appear to be prone to artifacts such as the masking effect, the presence of non-EV particles, and the counting of a single particle multiple times, the two techniques may not be expected to correlate ideally.
Next, the utility of the VC3100 for measuring EVs from different sources was evaluated. Purified EVs were derived from urine, serum, saliva, plasma, HEK293-conditioned medium, and the B16F10 mouse cell line. EVs from different sources of EVs were successfully quantified by the VC3100 (
Fig. 3b
). As suggested by “MIFlowCyt-EV: A Framework for Standardized Reporting of Extracellular Vesicle Flow Cytometry Experiment,” published in 2020,
40
different assay controls were examined to support the hypothesis of single-vesicle detection. Isolated EV samples from different sources can be contaminated with non-EV complexes and have the potential to be labeled and counted as positive EV events. Therefore, Triton X-100 was used to lyse their phospholipid membranes to determine whether the measured events were membrane-enclosed vesicles or other non-EV complexes. Here, CMO-labeled EVs were lysed with 1% Triton X-100 and measured by the VC3100. For all sources of EVs tested, the number of detected events dropped to the lower detection limit of the VC3100, supporting the hypothesis that intact membrane-enclosed vesicles were being enumerated prior to the treatment (
Fig. 3b
To evaluate the possibility of confounding membrane fragments with intact EVs, unlabeled EVs were also treated by Triton-X100 and then labeled with CMO ( Fig. 3c ). Similarly, the number of detected events decreased to the same level as the controls, which demonstrated that the VC3100 could only detect intact CMO-labeled EVs. The peak histograms from 1 s of the measurements are illustrated for the buffer only ( Fig. 3d ), EVs only ( Fig. 3e ), CMO dye only ( Fig. 3f ), CMO urinary EV sample ( Fig. 3g ), Triton X-100-treated CMO-labeled EVs ( Fig. 3h ), and CMO-labeled Triton X-100 EVs ( Fig. 3i ).
Protein Profiling of Individual EVs by VC3100
In addition to quantification of EVs by CMO labeling, they can be further characterized using fluorochrome-conjugated antibodies. This allows identification of the marker expression level and analysis of different subsets of EVs. Purified urinary EVs were labeled using phycoerythrin (PE)-conjugated monoclonal antibodies against three different tetraspanins, CD9, CD63, and CD81, as common exosome markers. As previously proposed, control experiments such as buffer only, unlabeled EVs, and PE-conjugated antibodies only (
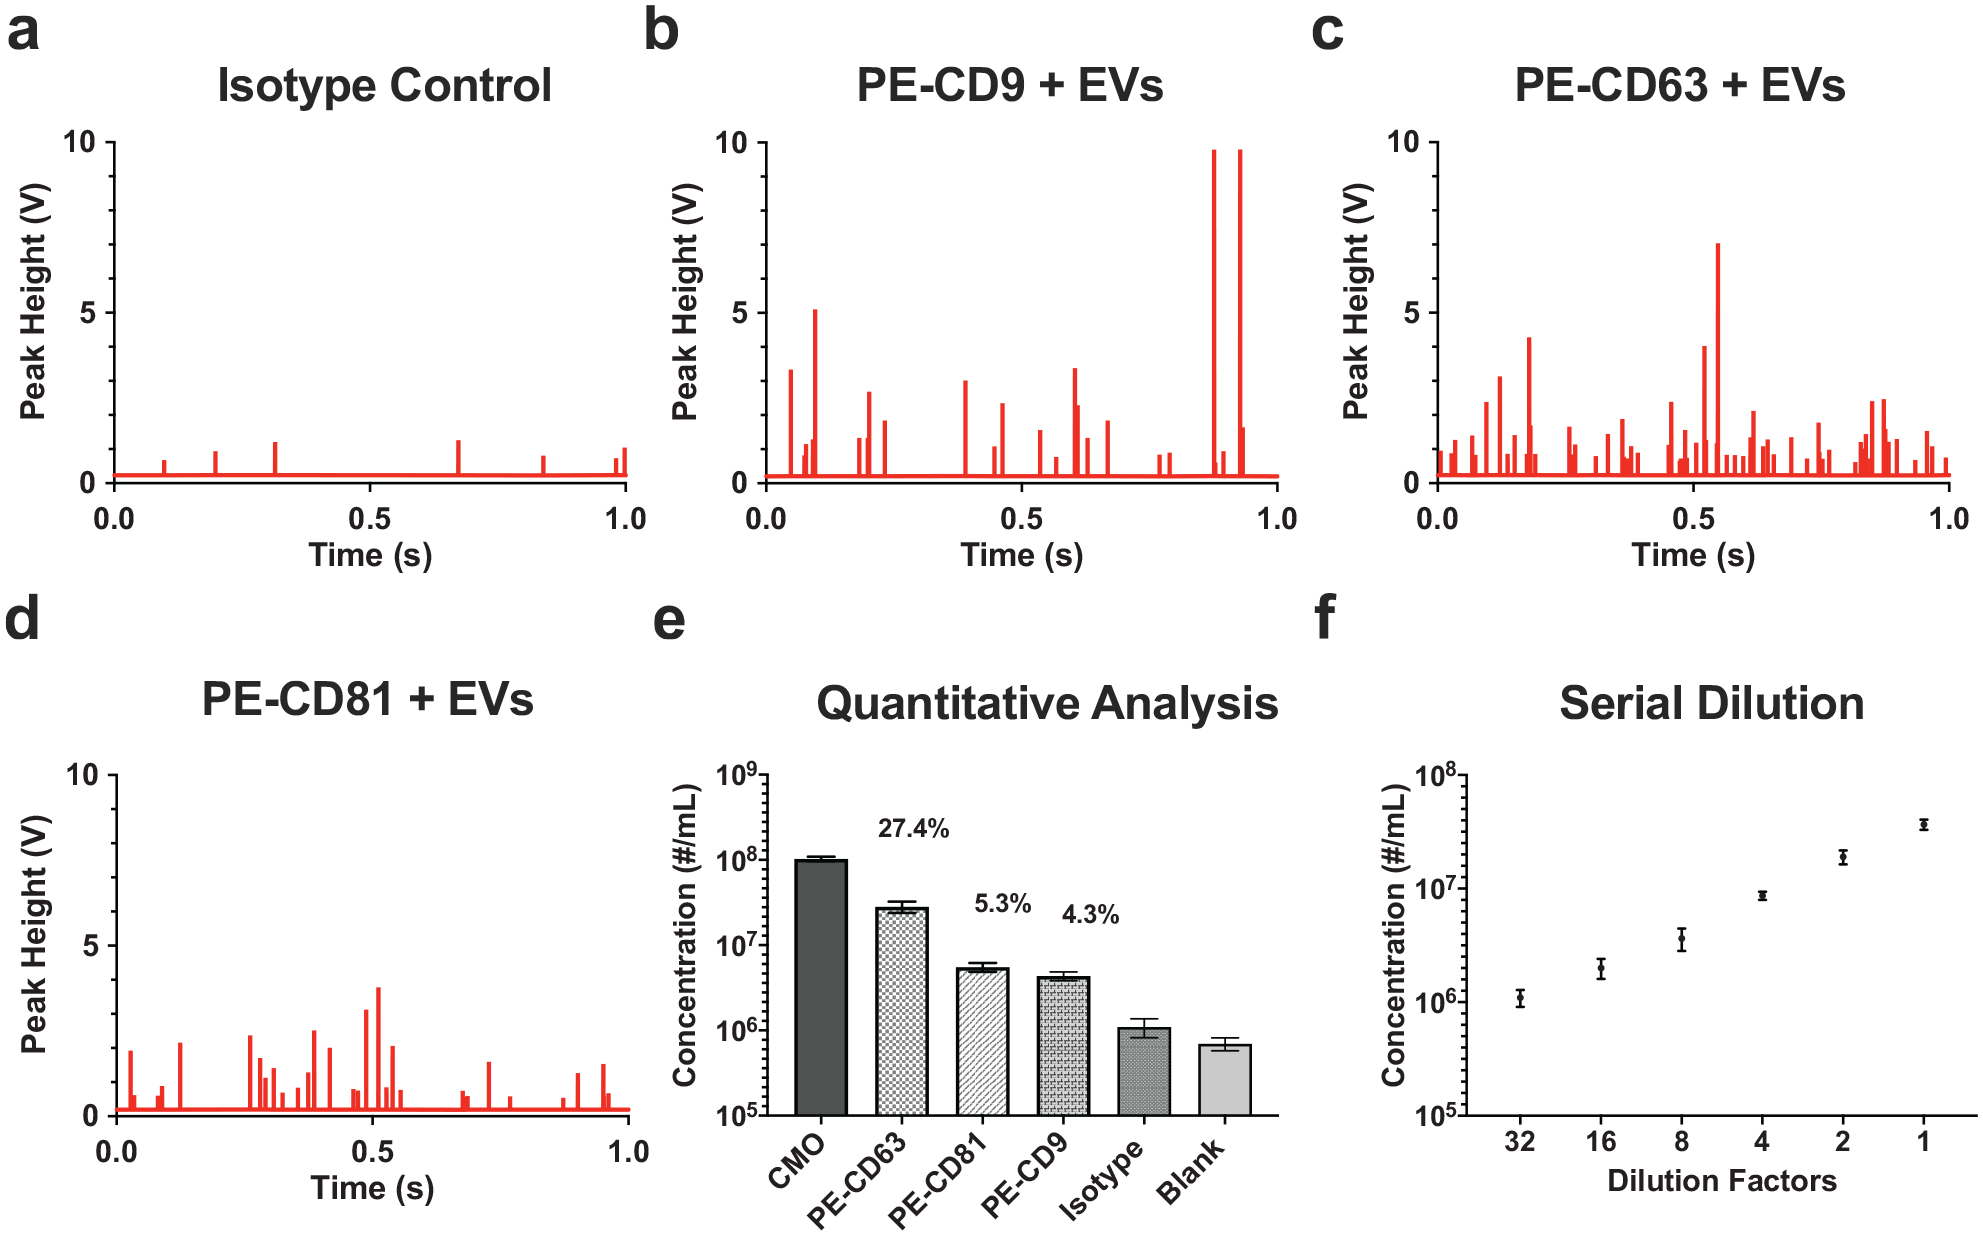
Protein profiling of EVs by VC3100. Peak histogram of (
Discussion
Flow cytometry-based approaches hydrodynamically focus the sample flow in the center of sheath fluid to allow particles to pass the laser spot one by one. However, at high concentrations, two or more nanoparticles can pass the laser spot spontaneously, especially when the sample concentrations are unknown. As a result, the signals are detected as a single event and separate events are no longer distinguishable. This phenomenon is known as coincidence or swarm, which leads to inaccurate concentration measurements and is one of the main challenges in flow cytometry approaches for quantifying and analyzing nanoparticles.16,35,36 In order to study this phenomenon, serial dilution has been proposed as the appropriate control assay. 40 We evaluated the possibility of random coincidence and swarm detection in the VC3100 using 200, 100, and 50 nm PS nanoparticles. We found that event counts were proportional to the dilution factors in the linear region (5 × 10⁵ to 5 × 10⁸ particles/mL), suggesting the detection of individual nanoparticles. However, as the sample concentrations approached the upper detection limit of the VC3100, random coincidence was observed due to the presence of two or more nanoparticles in front of the laser, leading to underestimation of the concentration measurements. For even higher concentrations of nanoparticles, the core stream was saturated with nanoparticles and elevated baseline values were observed. This led to a drop in the concentration of the samples and caused inaccurate measurements ( Fig. 1 ). Therefore, serial dilution is an important and necessary control assay for confirming the detection of individual nanoparticles in flow cytometry-based approaches.
NTA has been extensively used in the EV field for determining the size and concentration of nanoparticles. NTA uses laser light scattering microscopy with a charge-coupled device (CCD) camera. In short, after introducing the sample into the system, the movement of particles is recorded from scattered light. The scattering centers of the particles are tracked simultaneously but individually by the software. Based on the Brownian motion of the particles, the diffusion coefficient of each tracked particle is calculated. Using the Stokes–Einstein equation, the software calculates and reports the size of tracked particles, assuming they are spherical. The concentration of nanoparticles in the sample is reported based on the number of tracked particles in the recorded video.27,43,45
We compared the performance of NTA with VC3100 using reference nanoparticles. PS nanoparticles are commonly used as the reference material for EVs in comparison studies as well as for calibration in flow cytometry. However, because EVs have an RI of 1.4, it has been suggested that silica nanoparticles with an RI of 1.46 may be better-suited reference materials as an alternative to PS nanoparticles (RI = 1.59).41–43 Therefore, 200 and 100 nm silica nanoparticles were used as the reference nanoparticles. It is important to mention that 50 nm PS nanoparticles were used due to the challenges in manufacturing silica nanoparticles smaller than 100 nm.
Different parameters need to be adjusted to optimize the detection of nanoparticles using NTA. These parameters can be divided into video recording and tracking analysis categories. The camera level is one of the video recording parameters that can be adjusted by the operator. This defines the sensitivity of the camera. The detection threshold is adjusted after the recording and before analysis. This establishes the minimum intensity required to validate the detected event as a particle. In other words, the detection threshold separates the signal from the noise.29,44 The effect of the camera level on the detection of nanoparticles was systematically evaluated. Adjustment of the camera level did not have any significant effect on the detection of 200 and 100 nm nanoparticles. However, 50 nm nanoparticles were not detected by NTA when the camera level was decreased to 10 (
We evaluated the performance of NTA for accurate measurements of nanoparticles in polydisperse samples using mixtures of 200, 100, and 50 nm nanoparticles. We found that NTA measurements are affected by the masking effect caused by the presence of larger nanoparticles in polydisperse samples, leading to inaccurate measurements. In all samples tested, 50 nm nanoparticles were not accurately detected by NTA due to the masking effect caused by the presence of larger nanoparticles in polydisperse samples (
As the VC3100 is a fluorescence-based technique, quantification can only be achieved by labeling EVs with a fluorescent dye compatible with the system. Fluorescent dyes can be categorized into three types: lipid membrane dyes, luminal dyes, and protein labeling dyes. Lipid membrane dyes such as the PKH family have been extensively used as a generic marker in the field for uptake, biodistribution, and characterization studies.26,46,47 However, in recent years, a couple of studies have shown artifacts such as the formation of PKH nanoparticles that are indistinguishable in terms of size and fluorescent intensity from PKH-labeled EVs, which can lead to false-positive signals.33,46 In addition, it has recently been shown that PKH labeling can affect the physical properties of EVs and result in an increase in the size of labeled EVs, which may affect the uptake, biodistribution, and characterization results. 48 CMO is a lipophilic dye that has been used for labeling EVs, and it fluoresces when inserted into a lipid membrane. Carnell-Morris et al. showed that CMO dye can be used for the analysis of EVs by NTA using the instrument’s fluorescence mode. 49 The authors further found that CMO does not affect the size of EVs compared with unlabeled EVs by NTA and, unlike the PKH family, does form micelles.
In recent years, several studies have utilized high-sensitivity fluorescent-based flow cytometry for analyzing EVs. However, one of the biggest challenges in the fluorescence mode is the contribution of light from unbound dyes to the background signal, which can decrease the signal-to-noise ratio.33,35,36 Therefore, flow cytometry analysis of EVs typically requires a postlabeling washing step to remove the unbound dyes for accurate analysis. Different techniques such as ultracentrifugation, 46 density gradient,16,35 size exclusion chromatography, 33 and filtration50,51 can be used for removing the excess dye from fluorescently labeled EV samples. However, the washing steps are time-consuming and expensive and can cause sample loss and aggregation of EVs. 32
CMO-labeled EVs derived from different sources such as plasma, urine, saliva, serum, HEK293-conditioned media, and B16F10 mouse cell line were successfully quantified by the VC3100 with no washing assay. In order to confirm the detection of individual EVs, different control assays were performed, such as serial dilution of CMO-labeled EVs. Control samples such as buffer only, CMO dye only, and unlabeled EVs only showed a concentration below the lower limit of the VC3100. Detergent treatment control is another important assay to confirm the detection of membrane-enclosed vesicles. CMO-labeled EVs were treated by 1% Triton-X100 and measured by the VC3100. The number of detected events for EV samples from all sources tested significantly dropped after the treatment, confirming that the lipid membrane particles were detected before the treatment (
Specific subtypes of EVs may play important roles in distinct functions. For instance, surface proteins of EVs such as tetraspanins (CD9, CD63, and CD81) are involved in the uptake of EVs by the recipient cell, their protection from phagocytosis, and their circulation clearance. However, since EVs are highly heterogenous in size and surface proteins, changes in the expression level of a specific marker could be easily masked in bulk analysis.18,20 Therefore, a fast, specific, reliable technique is required for protein profiling of EVs in diagnostic and therapeutic applications.
The fluorescent intensity due to surface marker labeling depends on (1) the expression level of the target proteins, (2) the efficiency of the labeling process, and (3) the light source excitation strength and fluorescent dye quantum yield.52–55 Successful protein profiling of urinary EVs labeled with PE-conjugated tetraspanins (CD9, CD63, and CD81) was further observed by the VC3100 with necessary control assays such as the isotype control. This result suggests that the VC3100 can be used for accurate and standardized quantification and phenotype analysis of EVs as an important factor for biomarker profiling and therapeutic applications. In summary, this study has determined that the VC3100 is a highly reliable and sensitive tool for the robust quantification and characterization of EVs (
Conclusion
The missing element in current solutions used to enumerate and characterize EVs lies in the fact that there is no one platform that provides the holistic data required for full characterization. This would include the combined attributes of pan-enumeration of EVs or exosomes, the differential sizing and enumeration of those subpopulations within different preparations of EVs, multiparametric phenotypic analysis, measures of cargo, and, finally, controls to exclude cell fragments. Expanded probes and especially measures of cargo may represent the most pressing needs. Achieving this requires surmounting the challenges that are presented by the small size and heterogeneity of EVs. In this study, we tested the capability of a flow cytometry-based nanoparticle analyzer, VC3100, in the combined areas of enumeration of particles as small as 50 nm (in the absence of scatter) and compatibility with polydisperse samples, compared with the gold standard in the field, NTA. We expanded on this to include a pan-EV stain as well as a phenotypic measure of some of the more common exosome markers. First, the detection and enumeration of individual nanoparticles (50–200 nm) was confirmed by studying serially diluted samples. Appropriate sample dilution was shown to be critical to avoid coincidence and the swarm detection caused by high sample concentration. The performance of the VC3100 was then compared with that of NTA, and the former successfully demonstrated accurate quantification of nanoparticles in polydisperse samples such as EVs. NTA demonstrated issues for accurate measurements of mixture samples due to the masking effect of smaller nanoparticles from the presence of larger ones. In other studies, EVs from six different sources were fluorescently labeled by CMO and were successfully quantified by the VC3100 without a postlabeling washing step. Additionally, the expression levels of tetraspanins (CD9, CD63, and CD81) were effectively measured using the VC3100. Future work with alternative probes could potentially label cargo as well as surface antigens using this methodology. These results suggest that the VC3100 is an emerging technology that may be further refined to provide information on sizing, to expand on the number of parameters simultaneously measured, to ultimately emerge as a technology capable of simultaneously addressing a number of desired parameters.
Supplemental Material
Supplemental_Materials – Supplemental material for An Emerging Fluorescence-Based Technique for Quantification and Protein Profiling of Extracellular Vesicles
Supplemental material, Supplemental_Materials for An Emerging Fluorescence-Based Technique for Quantification and Protein Profiling of Extracellular Vesicles by Mehdi Dehghani, Rebecca K. Montange, Michael W. Olszowy and David Pollard in SLAS Technology
Footnotes
Acknowledgements
The authors wish to thank the Sartorius, Arvada, Colorado, Virus Analytics Team for providing technical advice and support.
Supplemental material is available online with this article.
Declaration of Conflicting Interests
The authors declared no potential conflicts of interest with respect to the research, authorship, and/or publication of this article.
Funding
The authors received no financial support for the research, authorship, and/or publication of this article.
References
Supplementary Material
Please find the following supplemental material available below.
For Open Access articles published under a Creative Commons License, all supplemental material carries the same license as the article it is associated with.
For non-Open Access articles published, all supplemental material carries a non-exclusive license, and permission requests for re-use of supplemental material or any part of supplemental material shall be sent directly to the copyright owner as specified in the copyright notice associated with the article.