
Abstract
Comprehensive analysis of tumor heterogeneity requires robust methods for the isolation and analysis of single cells from patient samples. An ideal approach would be fully compatible with downstream analytic methods, such as advanced genomic testing. These endpoints necessitate the use of live cells at high purity. A multitude of microfluidic circulating tumor cell (CTC) enrichment technologies exist, but many of those perform bulk sample enrichment and are not, on their own, capable of single-cell interrogation. To address this, we developed an affordable semiautomated single-cell aspirator (SASCA) to further enrich rare-cell populations from a specialized microwell array, per their phenotypic markers. Immobilization of cells within microwells, integrated with a real-time image processing software, facilitates the detection and precise isolation of targeted cells that have been optimally seeded into the microwells. Here, we demonstrate the platform capabilities through the aspiration of target cells from an impure background population, where we obtain purity levels of 90%–100% and demonstrate the enrichment of the target population with high-quality RNA extraction. A range of low cell numbers were aspirated using SASCA before undergoing whole transcriptome and genome analysis, exhibiting the ability to obtain endpoints from low-template inputs. Lastly, CTCs from patients with castration-resistant prostate cancer were isolated with this platform and the utility of this method was confirmed for rare-cell isolation. SASCA satisfies a need for an affordable option to isolate single cells or highly purified subpopulations of cells to probe complex mechanisms driving disease progression and resistance in patients with cancer.
Introduction
Rare-cell populations can have a tremendous influence in disease development, progression, and resistance. Isolation and analysis of rare cells offers a method to study the pertinent cell-to-cell heterogeneity that may harbor drivers of disease progression or treatment resistance.1,2 However, rare cells (e.g., circulating tumor cells [CTCs]) are generally difficult to isolate at high purity. 3 The lab-on-a-chip (LOC) field has produced many iterations of rare-cell enrichment devices, leveraging both physical and biological phenomena. 4 However, the majority of these platforms are bulk enrichment techniques, and significant levels of background or contaminating cells remain after isolation. While these methods can provide an averaged measure of cells found in the entire sample, the presence of contaminating cells can directly alter results and interpretation.5,6 Moreover, devices that excel in cell yield/recovery often perform poorly in cell purity, 7 establishing a need for methods that provide high rare-cell purity to avoid the bias of contaminating cells and enable meaningful clinical analysis. Furthermore, we envision that if widely accessible methods or technologies were available that could maintain cell viability and integrate with a range of existing LOC technologies, then a multitude of clinically relevant endpoints could be studied.
As mentioned previously, CTCs are an important example of a rare-cell population of interest, as demonstrated by the wealth of CTC enrichment microdevices developed in recent years. Moreover, CTCs have been shown to contain clinically relevant information with regard to cancer progression and therapeutic resistance.8–10 CTCs are found in peripheral blood at a frequency of ~1 in 108 to 1010 peripheral blood cells,11,12 and those isolated from patients with prostate cancer have been shown to exhibit high degrees of heterogeneity. 13 This heterogeneity extends to a range of molecular alterations including genomic, transcriptomic, and proteomic differences in both solid tumor biopsies and CTCs from liquid biopsies.14,15 For example, single-cell RNASeq of prostate cancer CTCs identified intra- and interpatient heterogeneity in the expression of androgen receptor (AR) splice variants, which is known to confer resistance to AR-targeted therapies. 16 Accordingly, there is a critical need to understand the molecular alterations that account for, and may drive, cancer progression to develop improved biomarkers and therapeutic modalities for patients with advanced disease. To do so, there is a need for a system that works in tandem with bulk LOC enrichment devices that can retrieve purified, live CTC populations while maintaining requisite cell viability that enables robust downstream single-cell interrogation.
For many years single-cell studies have been accomplished using cell micromanipulators (CMMs), which integrate directly with microscopes to interrogate cells of interest from a larger population.17–19 These studies—and many that followed—used manually operated CMMs. Manual micromanipulators have been essential for advances in neuroscience, 20 microbial science, 21 and in vitro fertilization. 22 Unfortunately, such manual models can be cumbersome, requiring a practiced hand to operate accurately. The inefficiency of these models results in low sample throughput. To mitigate the issues with slow throughput, companies have recently developed fully automated CMM technologies. Automated platforms that have already been used to isolate CTCs include the AVISO CellCelector and the RareCyte CyteFinder/CytePicker.23,24 Being fully automated, these technologies present major advantages in sample processing and throughput, but these benefits come at a steep price—they can be as much as 100 times more expensive than manual CMMs. In order to make advanced molecular analysis of CTCs more accessible to researchers, a less expensive, high-throughput, single-cell manipulation technique is needed to couple with upstream bulk enrichment technologies.
To address the need for an affordable yet robust CMM platform, we have developed a semiautomated system for purifying rare-cell populations. This system is designed to work in tandem with various upstream LOC bulk enrichment technologies with a fabrication cost of less than $3000 (
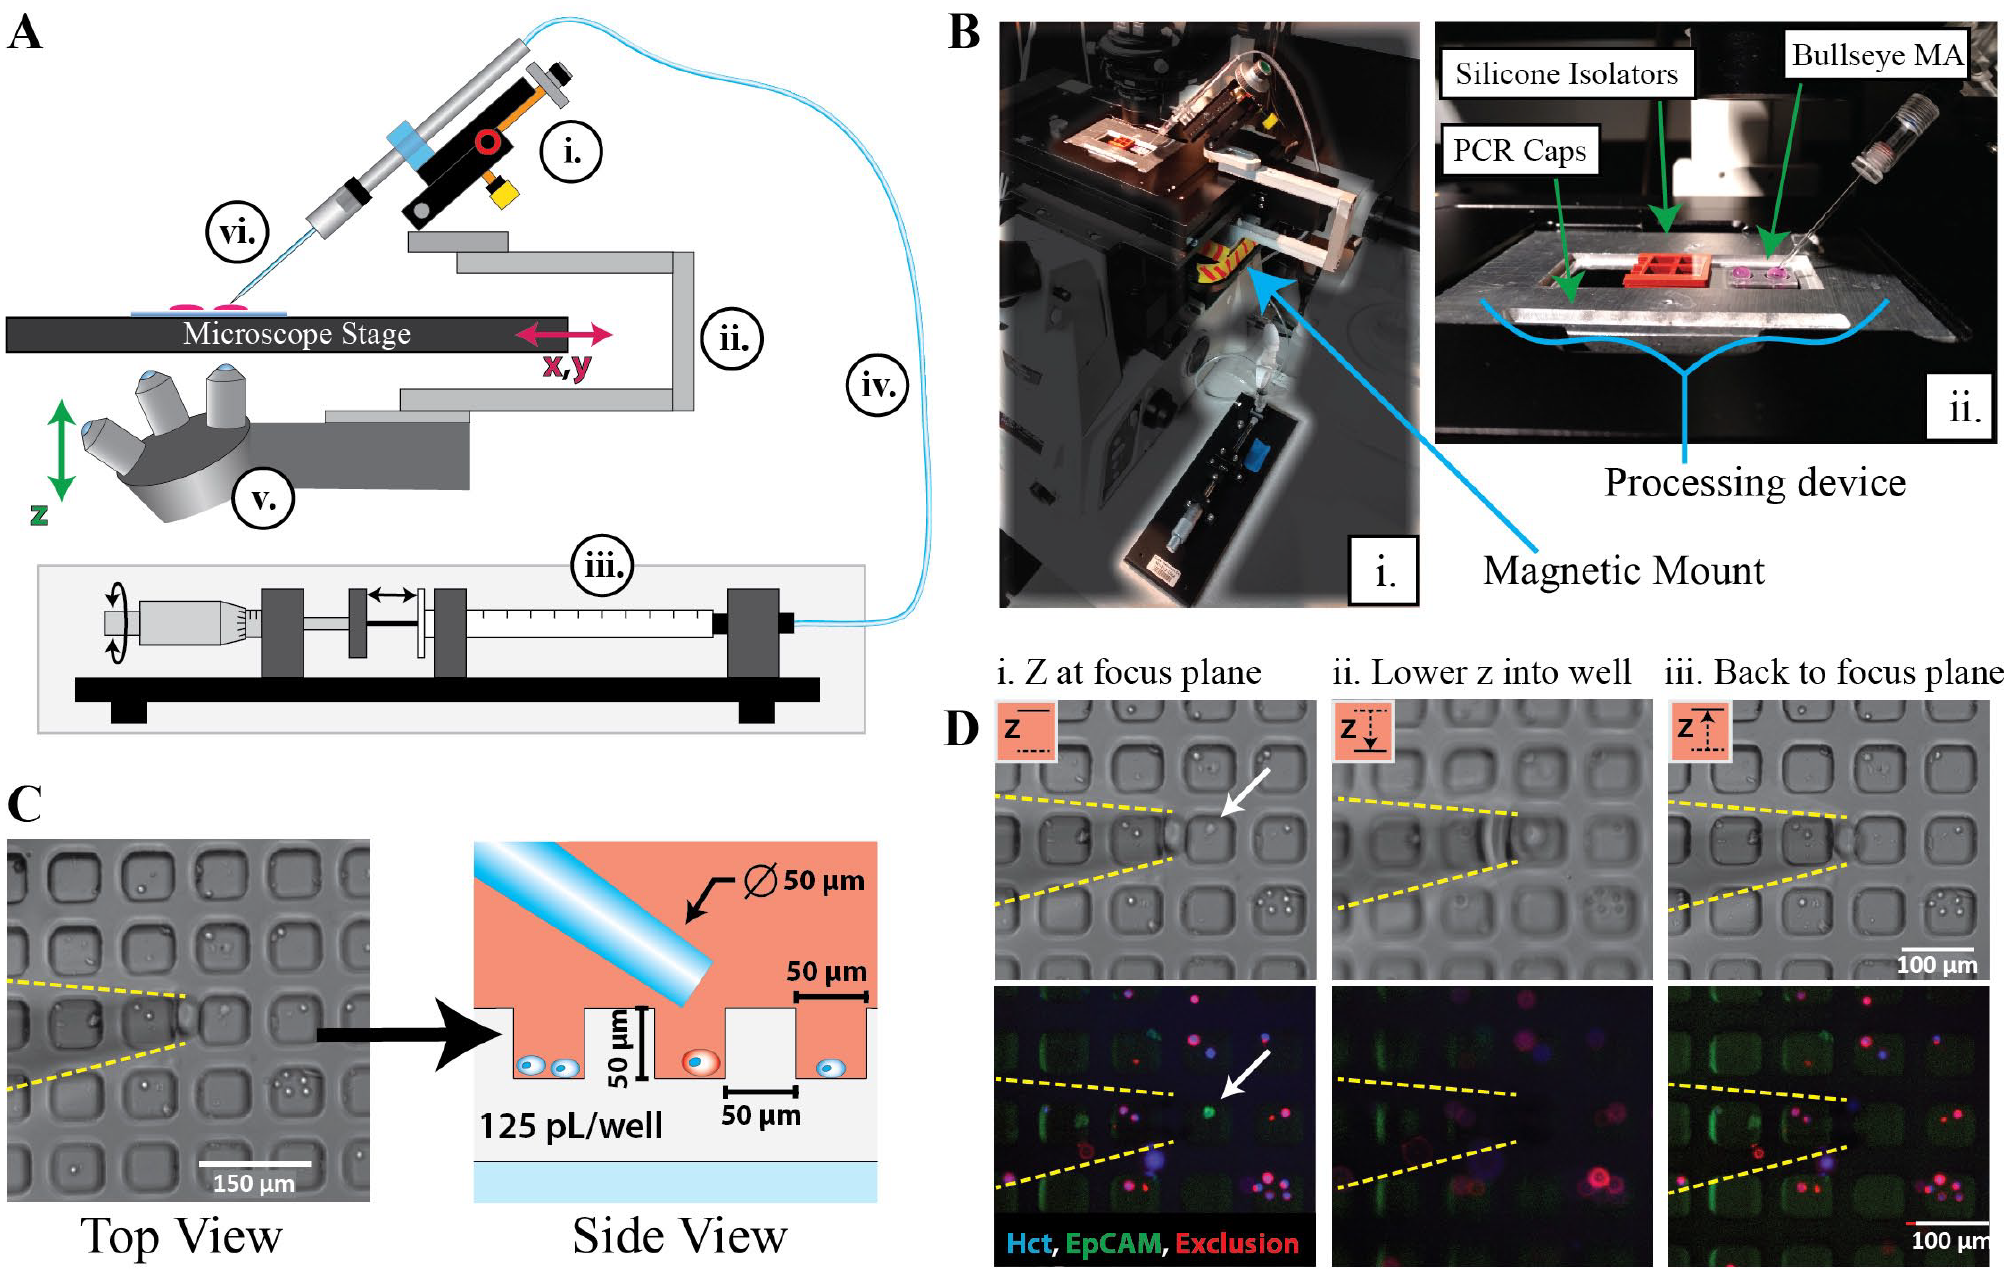
Technology Integration—the SASCA platform is engineered to integrate with inverted microscopes. (
For years microwell arrays (MAs) have been used in microfluidics to isolate individual cells for various single-cell assays. Previous applications have included single-cell PCR, cytokine secretion, and natural killer cell interactions.25–27 For the SASCA, sample cells are evenly distributed in a polydimethylsiloxane (PDMS) MA to immobilize and contain the cells, thereby enabling robust single-cell selection and negating the worry of accidental contaminant aspiration as seen with some glass slide setups (
We further improved our final purity by matching experimental results with a Pólya-Aeppli probability distribution to optimize our microwell seeding method and developed a custom software that incorporates real-time detection and localization of target cell subpopulations. To isolate a cell in a MA that has been identified using the software, the SASCA leverages the microscope’s own mechanisms to navigate the MA in an automated fashion. These components contribute to improved objectivity of target cell selection, throughput, and sample purity. In this study we tested the efficacy of the SASCA platform in rare-cell purification through the collection of CTCs from the blood of patients with prostate cancer, showing that high-throughput phenotypic analysis of such samples can be accomplished at an affordable price.
Materials and Methods
Semiautomated Single-Cell Aspirator
The single-cell aspirator presented in this study is an assemblage of commercially available items and custom engineered parts. A four-axis mechanical CMM (MX130R; Siskiyou, Grants Pass, OR) was used to hold a glass micropipette (50 µm tip inner diameter, MGM 1C-50; FIVEphoton Biochemicals, San Diego, CA) and perform initial pipette alignments. The CMM was bolted to an aluminum mounting cantilever that was custom machined (dimensions listed in
Microwell Arrays
MAs were fabricated out of PDMS (Dow SYLGARD 184, Midland, MI) using soft lithography replica molding techniques.29,30 A mold for the MA was fabricated using established SU-8 photolithography techniques 31 and placed in a plastic petri dish. Using a standard 1:10 ratio of cross-linking agent to prepolymer, we mixed and de-gassed a PDMS solution before pouring it over the molds. The PDMS was cured at 70 °C for 4 h and allowed to cool for at least 1 h before removal from the mold. Finally, before they were ready for use, the MAs were cleaned using a Soxhlet extractor filled with 70% EtOH.
SASCA Media
During the single-cell aspiration process, two specialized solutions were used interchangeably to prevent cell adhesion and maintain cell viability. In initial experiments, a specific SASCA media was developed using Dulbecco’s modified Eagle’s medium (DMEM) with 4.5 mg/mL glucose, 0.1% bovine serum albumin (BSA; A9056; Sigma-Aldrich, St. Louis, MO), 0.1% Pluronic F-127 (P2443; Sigma-Aldrich), and 10 mM HEPES buffer (15630-080; Gibco, Grand Island, New York). Pluronic F-127 was specifically used because it has been shown to inhibit cell adhesion in biomedical research.32–34 We also found a commercially available phosphate-buffered saline (PBS) blocking buffer (SuperBlock; Thermo Fisher, Waltham, MA) to be a suitable SASCA media replacement when performing cell line nucleic acid extraction experiments.
Microwell Loading
MAs were placed on precleaned microscope slides (12-550-15; Fisherbrand, Hampton, NH) before being loaded. Due to the hydrophobicity of PDMS, the microwells do not spontaneously fill with media. To promote microwell filling, the empty bull’s-eye MAs were placed in a vacuum chamber for 30 min as previously described. 35 Immediately following PDMS gas evacuation, 60 µL of either SASCA media or SuperBlock buffer was pipetted onto each bull’s-eye—within the inner edge of the “moat”—and allowed to fill for 15 min. After the microwells had filled, the samples were added.
The volume of the patient samples following initial enrichment could vary from 50 to 80 µL, which was near the maximum volume a bull’s-eye could contain within the inner rim of its moat, 35 so before adding the sample to its respective bull’s-eye(s), 50 µL of the initial 60 µL of liquid used to fill the device was removed. Leaving behind 10 µL ensures that the wells remain filled and covered with a thin film of media; if this film is allowed to evaporate, the wells will not refill without requiring an additional vacuum chamber treatment. Next, the sample is pipetted onto its respective bull’s-eye MA, being careful not to spill into the moat and risk losing cells.
Once the sample is seeded, the MA device is placed in a covered omni-tray and left in a darkened chamber for the cells to settle into the microwells. The cells were allowed to settle for approximately 15 min, but no less than 11 min because the theoretical settling velocity of cells (2.8 cm/h) suggests that a cell at the top of a 5 mm tall liquid droplet requires almost 11 min to reach the bottom. 36 After the cells are fully settled, the moat is filled with 10 µL of media or buffer, merging with the sample droplet and pinning it within the outer bounds of the bull’s-eye moat. The moat-filling step is critical for subsequent bright-field imaging.
Cell Seeding Simulations
To quantify how different protocols for cell collection might influence final sample purity, we simulated the process of cell seeding and collection. After performing a virtual cell seeding to randomly distribute 250 target cells with different levels of background cells, microwells with target cells were collected in two ways. Using a “naive” approach, we collect each microwell that is encountered containing target cells. Using an optimized or “ranked” approach, we visit microwells in order of decreasing purity. In both cases, collection proceeds until 50 target cells are collected. The simulation was rerun 60 times for each level of initial sample purity using R statistical software. Collected/final sample purities (each containing 50 target cells and a variable number of background cells) were then calculated. Final purities using the naive and targeted (i.e. ranked) approach were then compared.
Automated Microscopy and Target Cell Identification
The SASCA system was mounted to a Nikon Eclipse Ti-E inverted fluorescence microscope (Nikon USA, Melville, NY), and images were acquired using a 10× objective (CFI Plan Fluor series; Nikon) in bright-field and three fluorescence channels: 390 nm (Hoechst), 560 nm (EpCAM), and 648 nm (Exclusion). To identify target cells, a montage of tile images was acquired across the entire bull’s-eye MA and analyzed using custom software written in MATLAB (The MathWorks, Natick, MA). This process was fully automated and performed in real time during image acquisition in order to minimize the time spent prior to the aspiration of cells. When a new tile of the montage is acquired, the software recognizes it as it appears in the monitored folder. Once recognized, the tile is processed and scanned for cells. It should be noted that while the real-time image processing program created for this platform was written in MATLAB, it runs independently of MATLAB software, so users do not need to purchase and install additional software to run the program.
The analysis algorithm involves distinct processes specific to the different image channels. All cells were detected based on fluorescence intensity using the Hoechst channel. The mask of detected nuclei was combined with that of microwells detected in the bright-field channel in order to restrict interest to cells lying within microwells. Fluorescence images for EpCAM and Exclusion were background subtracted, and then the mean fluorescence intensity (MFI) within detected cells was calculated. After processing all MA images, a plot of EpCAM versus Exclusion MFI for all cells was displayed in a graphical user interface (GUI) and thresholds were manually set on this plot to define the target and exclusion cell staining profiles. Cells that were EpCAM+/Exclusion− were considered to be CTCs, while peripheral blood mononuclear cells (PBMCs) were defined as EpCAM−/Exclusion+. For the subsequent image-guided aspiration, a list of CTC locations was generated and imported into the imaging software as a multipoint list. By clicking through each point on this list, the microscope stage automatically locates to the specific cell coordinates, allowing the user to quickly navigate a sample.
In some experiments where cell recovery was being characterized, the bull’s-eye MA was again imaged following aspiration to confirm removal of all target cells, and the collected cells were separately imaged to evaluate target cell purity. However, this follow-up imaging step was not performed during experiments where nucleic acid endpoints were the focus, as maintaining cell viability was prioritized. In transcriptomic experiments the cells were aspirated and immediately dispensed into lysis buffer to protect molecular integrity.
Cell Aspiration from Microwell
The following steps were used to ensure successful cell aspiration from microwells. With the tip positioned above the target microwell (
Dispensing Cells
Aspirated cells can be dispensed into a droplet of buffer in various fluid containers. Specifically, in this study cells were dispensed into situation-specific buffers held within either a silicone isolator well array (JTR10S-A-2.0; Grace Bio-Labs, Bend, OR) or a clear, flat-bottom PCR strip cap. The buffers used in this study included the SASCA media, SuperBlock buffer, and lysis buffer (RLT Plus + βME). The volumes of the buffers used also depended on the specific endpoint (i.e., cell imaging and quantification, and RNA or DNA extraction). The silicone isolators were placed adjacent to MAs on the glass slide, and PCR strip caps were placed proximal to the slide on the sample processing device. This limits the time spent between aspirating and dispensing cells, promoting maintenance of cell viability. Silicone isolators were used for imaging and quantifying aspirated cells to characterize target cell recovery and final purity, with each well containing 35 µL of SASCA media. For the purposes of mRNA extraction, isolators were filled with lysis buffer. Alternatively, for whole genome amplification (WGA), cells were dispensed into inverted PCR caps containing 1–4 µL of PBS. Cell transfer to the caps was visually confirmed by keeping the micropipette tip in focus while imaging in real time as cells were dispensed using the microsyringe pump. Tubes were then placed on the caps, reoriented to the upright position, and briefly centrifuged before continuing with the WGA protocol.
Cell Culture
The prostate cancer cell line 22Rv1 (ATCC CRL-2505, Old Town Manassas, VA) was a gift from Scott Dehm at the University of Minnesota. Monocytic cell line THP-1 (ATCC TIB-202) was a gift from Fotios Asimakopoulos at the University of Wisconsin. Prostate cancer line LAPC4 was a gift from Doug McNeel at the University of Wisconsin. Prostate cancer cell line C4-2B was a gift from Felix Feng at the University of California, San Francisco. LAPC4 cells were cultured in DMEM media (Corning Cellgro, Corning, NY) supplemented with 20% fetal bovine serum (Gibco). Remaining cell lines were cultured in RPMI 1640 medium (Corning Cellgro) supplemented with 10% fetal bovine serum. All media included 2% penicillin-streptomycin (HyClone, South Logan, UT). THP-1 medium was also supplemented with 1% Gibco GlutaMAX (LifeTech Carlsbad, CA).
Cell Preparation
Cells were isolated by trypsin digestion and washed with 1× PBS + 0.1% BSA. 22Rv1 cells were stained with anti-EpCAM (phycoerythrin; VU-1D9; Abcam, Cambridge, UK) and THP-1 cells were stained with anti-human CD45 (AlexaFluor 647; BioLegend, San Diego, CA). Both cell lines were also incubated with Hoechst 33342 (Life Technologies) to visualize nuclei.
Blood Processing and Cell Isolation
Whole blood was collected from patients with metastatic prostate cancer. The study was approved by the University of Wisconsin Institutional Review Board and patients supplied written informed consent. PBMCs were isolated using a Ficoll-Pacque Plus (GE Healthcare, Chicago, IL) gradient before undergoing CD45 depletion (MACS; Miltenyi Biotec, Bergisch Gladbach, Germany). The VERSA13,37,38 platform was used to capture CTCs with an anti-EpCAM antibody (R&D, Minneapolis, MN) and stain for extracellular markers EpCAM (phycoerythrin; VU-1D9; Abcam), CD45, CD34, and CD11b (AlexaFluor 647; BioLegend).
Reverse Transcription, Preamplification, and Quantitative RT-PCR
Preliminary mRNA extraction (see
Whole Genome Amplification
Cells isolated using the SASCA were dispensed directly into a droplet of PBS placed at the bottom of a PCR tube before undergoing lysis and WGA using a modified version of the Repli-G Single Cell Kit (Qiagen). Recommended modifications to the kit as listed in Sho et al. included a 30 min lysis period (as opposed to the 10 min recommended in the kit’s protocol) and division of the amplification step into 16 individual reactions. We adjusted this methodology to include the extended lysis period but reduced the number of parallel reactions to eight. Amplified genomic DNA underwent a preamplification step before undergoing qPCR as described above. The primers used are listed in
Results
SASCA Platform
Microscope Integration
The SASCA consists of three main parts: (1) the mechanical micromanipulator (
The unique mounting method implemented by the SASCA platform provides two significant advantages over traditional mounting techniques. First, this approach holds the aspirator stationary in the x-y directions relative to the microscope stage (
The second significant advantage of the SASCA’s unique mounting approach involves the movement of the aspirator tip in and out of target microwells. When a cell is being aspirated, the z-axis mounted CMM is moved up and down the z plane using the microscope’s objective focus knob (
Microwell Integration
MAs can be used to significantly aid single CTC isolation.23,41,42 Viscous forces at the microscale help to slow fluid flow within the microwells, thereby preventing cells from being dislodged or removed by exterior flows. In the context of single-cell aspiration, this allows the contents of one microwell to be aspirated without aspirating contaminants from adjacent wells (
To contain samples into finite arrays, a circular moat (250 µm deep) was fabricated around an array of ~2800 microwells, giving the MA a diameter of 6 mm. The moat provides a surface tension-driven barrier at the exterior edge of the sample. Unfortunately, refraction and interference near the periphery of the sample droplet resulted in dark regions in the bright-field channel, obfuscating the microwells (
Optimizing Microwell Seeding and Collection
When the MA is seeded with a heterogeneous suspension of cells, it is possible for multiple cells to settle into a single microwell, which can result in a mixed population of cells occupying the same well. Because sample purity is of the utmost importance, the goal of microwell seeding is to maximize the ability to isolate and collect the rare target cells while minimizing collection of contaminating background cells. To optimize this process, one must be able to predict/estimate how many cells will occupy each microwell. Traditionally, a Poisson distribution has been used to model microwell seeding;44,45 however, this model does not take into account the fact that cell suspensions are generally not monodisperse (i.e., some cells cluster with one another). To account for the presence of clusters, we used the closely related Pólya-Aeppli distribution instead.
The Pólya-Aeppli distribution is typically used to model the “Poisson delivery” of clusters of items where the number of items per cluster follows a geometric distribution. Two parameters define the Pólya-Aeppli distribution. The first parameter is identical to the standard Poisson parameter, λ (i.e., average number of clusters delivered to a microwell). The second parameter, p, defines the geometric distribution of cluster sizes (i.e., the number of cells observed in the different clusters). In this case, p = 1/(1 + average number of cells per cluster). Figure 2A illustrates how the probability distribution of cells per well shifts when settling objects are considered to be cell clusters (one to six cells per cluster) rather than a monodisperse suspension.
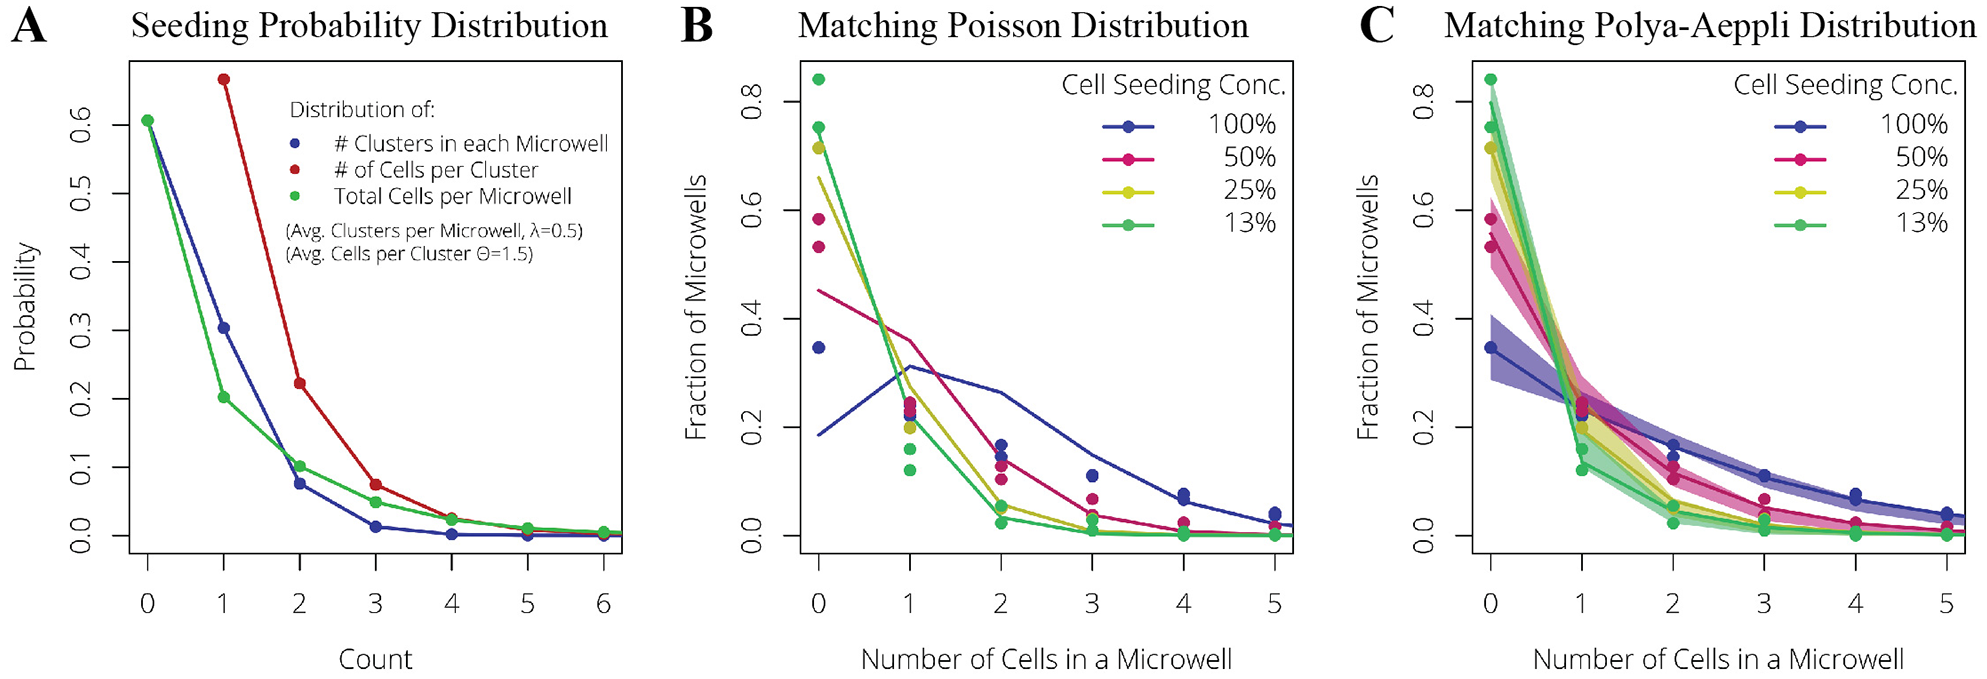
Optimizing cell seeding with probability distributions. (
To confirm that a Pólya-Aeppli distribution improves upon established microwell seeding models, experimental cell-count distributions were measured from MAs seeded at different densities. These experimental distributions were fitted with either a Poisson distribution (
Given that some microwells will contain 100% target cells (i.e., 100% purity) while others will contain differing numbers of contaminating cells (i.e., < 100% purity), we proposed to optimize the collection of seeded target cells by visiting microwells in order of decreasing purity. This ranked approach can be compared with a naive approach, which is defined as indiscriminately collecting cells from any microwell containing at least one target cell (i.e., in random order of purity). The value of a ranked approach can be seen in the simulations summarized in
Semiautomated Processing
After cells are seeded into microwells, target cells can be identified in two separate ways. With the manual image and capture (MIC) technique used above, the user scans through the microwell by eye, cycling through the fluorescent channels along the way to identify target cells. Once a target cell has been discovered, it is subsequently aspirated. This approach becomes tedious, even with the high maneuverability of the SASCA. In comparison, the automated image and manual capture (AIMC) method incorporates real-time image processing software into the workflow. The software prescans a sample for cells exhibiting phenotypes of interest. In less than 5 min, the program identifies potential targets, records and processes data on these targets, and outputs a list of discovered cells (and their locations) to assist the user in their decision-making process (
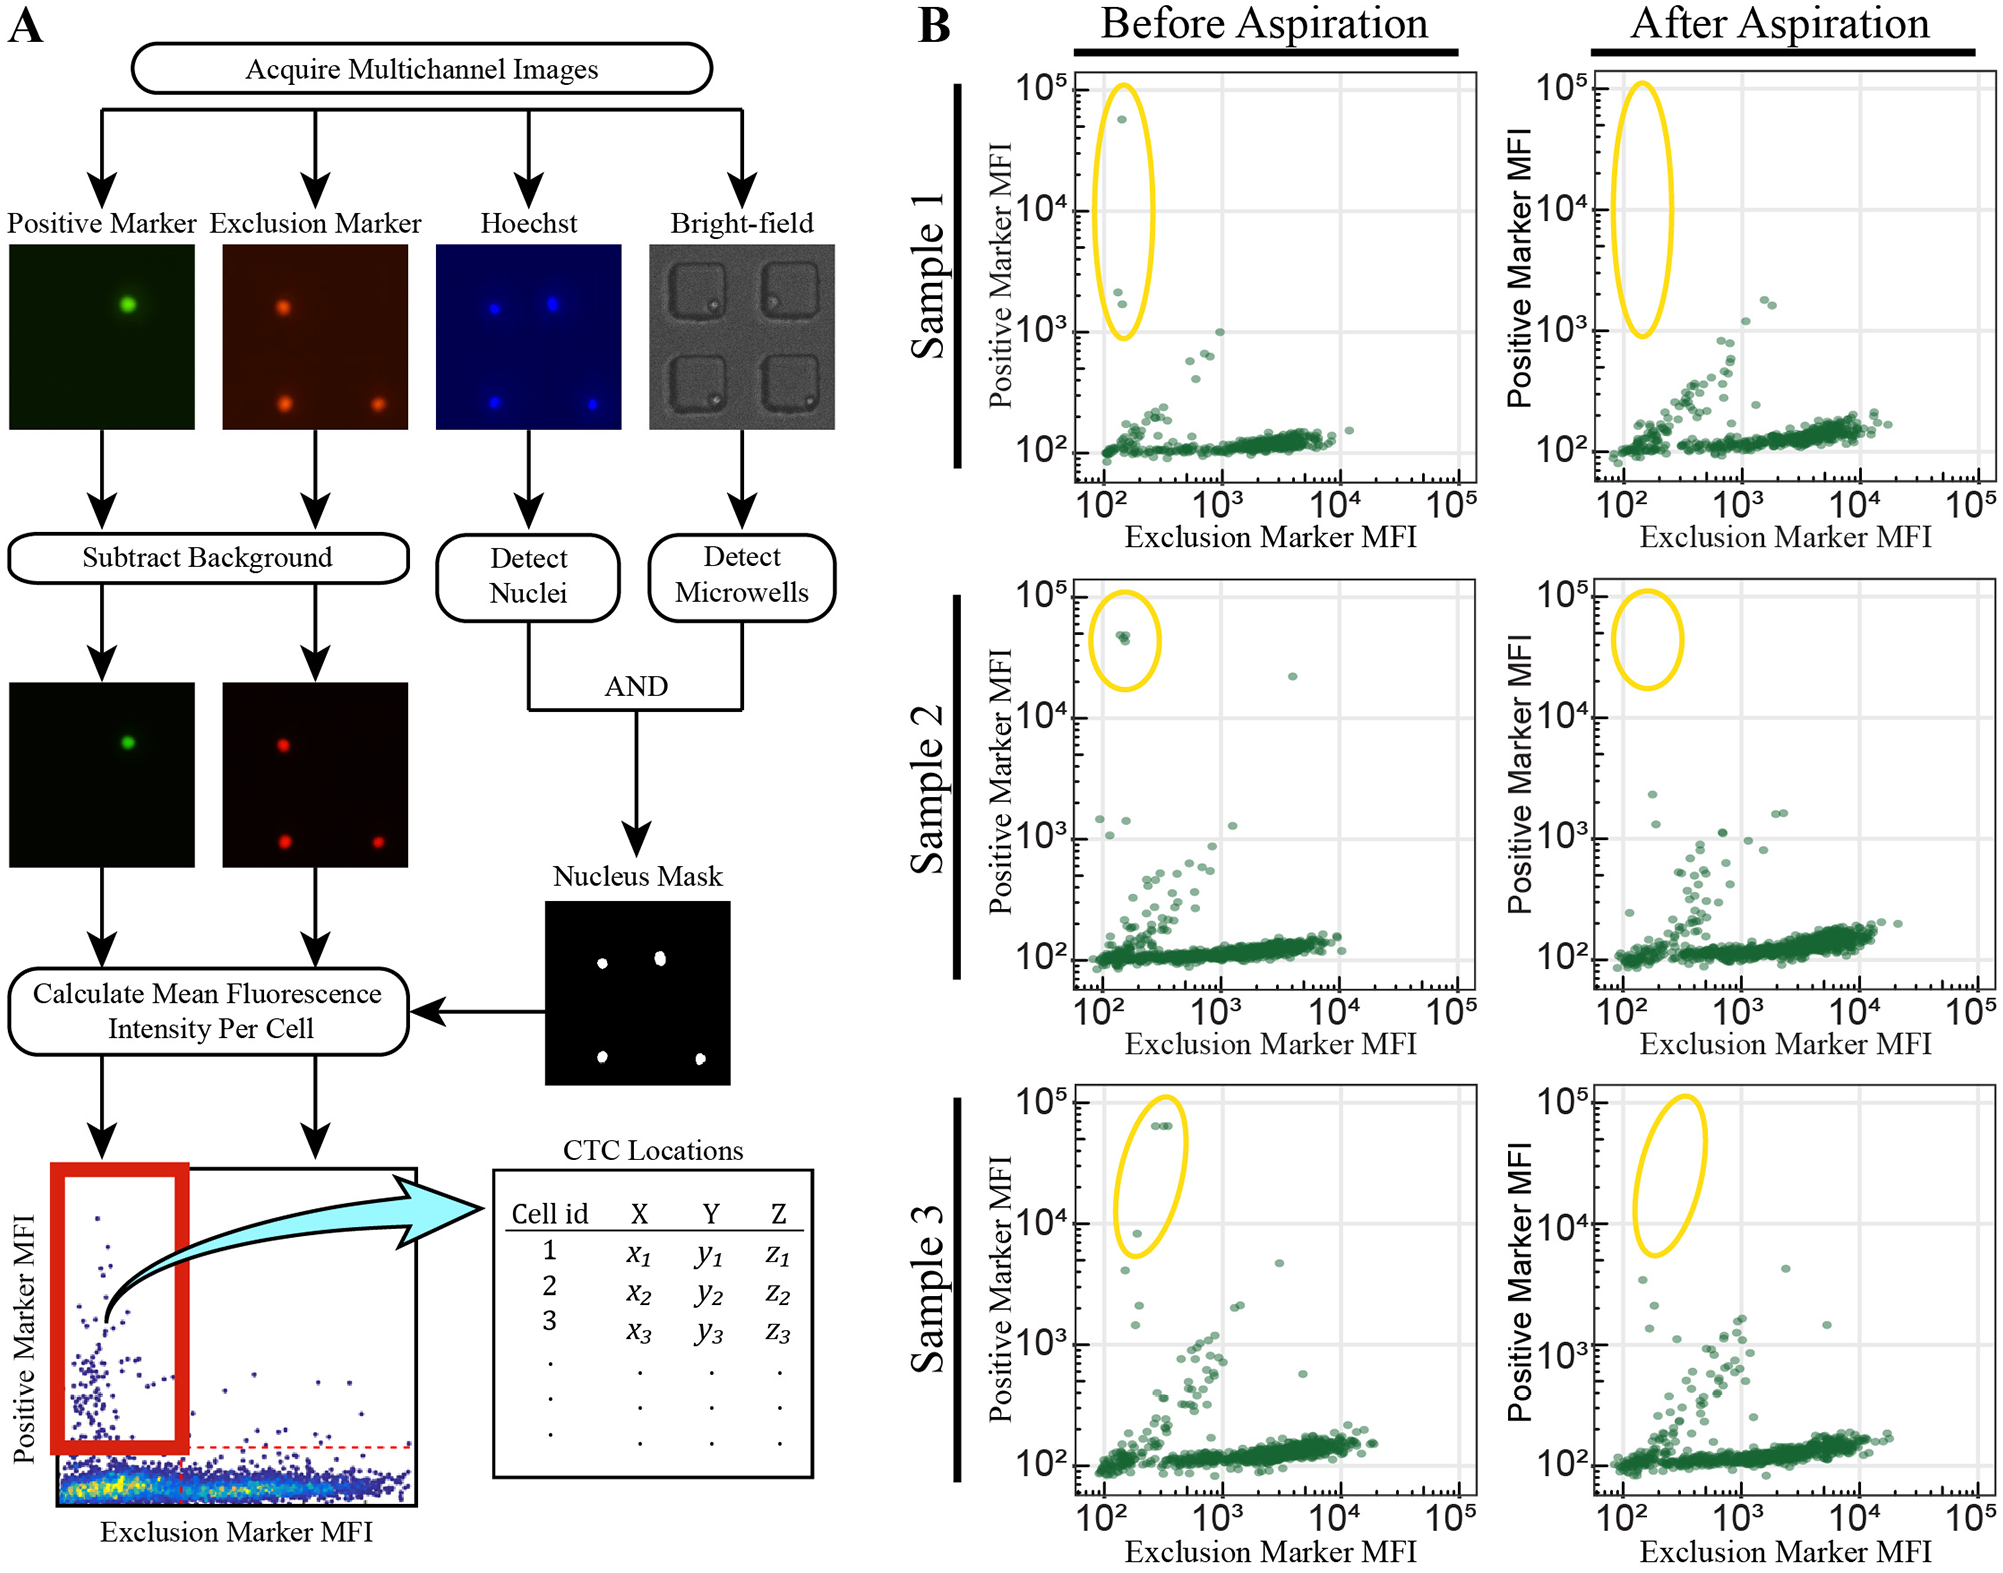
Semiautomated detection of CTCs. (
The coordinate list generated is loaded into the imaging software and used to quickly navigate from one point of interest to another. Once the cell of interest is identified, the user validates whether or not the cell should be targeted for aspiration. To confirm that this semiautomated identification and navigation can reliably collect rare populations of cells within a sample, heterogeneous mixtures of background and target cells were prepared at an initial concentration of approximately 1% target cells. This heterogeneous sample was seeded into three separate bull’s-eye MAs and processed using the AIMC technique. By collecting only cells that were identified as targets by the algorithm, it was shown that every target cell in each of the three samples was identified and collected (
The semiautomated method of identification and navigation increases processing speed without compromising cell recovery and final purity, allowing users to quickly scan through the samples in a directed fashion. The workflow for the SASCA is divided into three parts: upstream LOC bulk enrichment, SASCA cell purification, and downstream rare-cell interrogation (
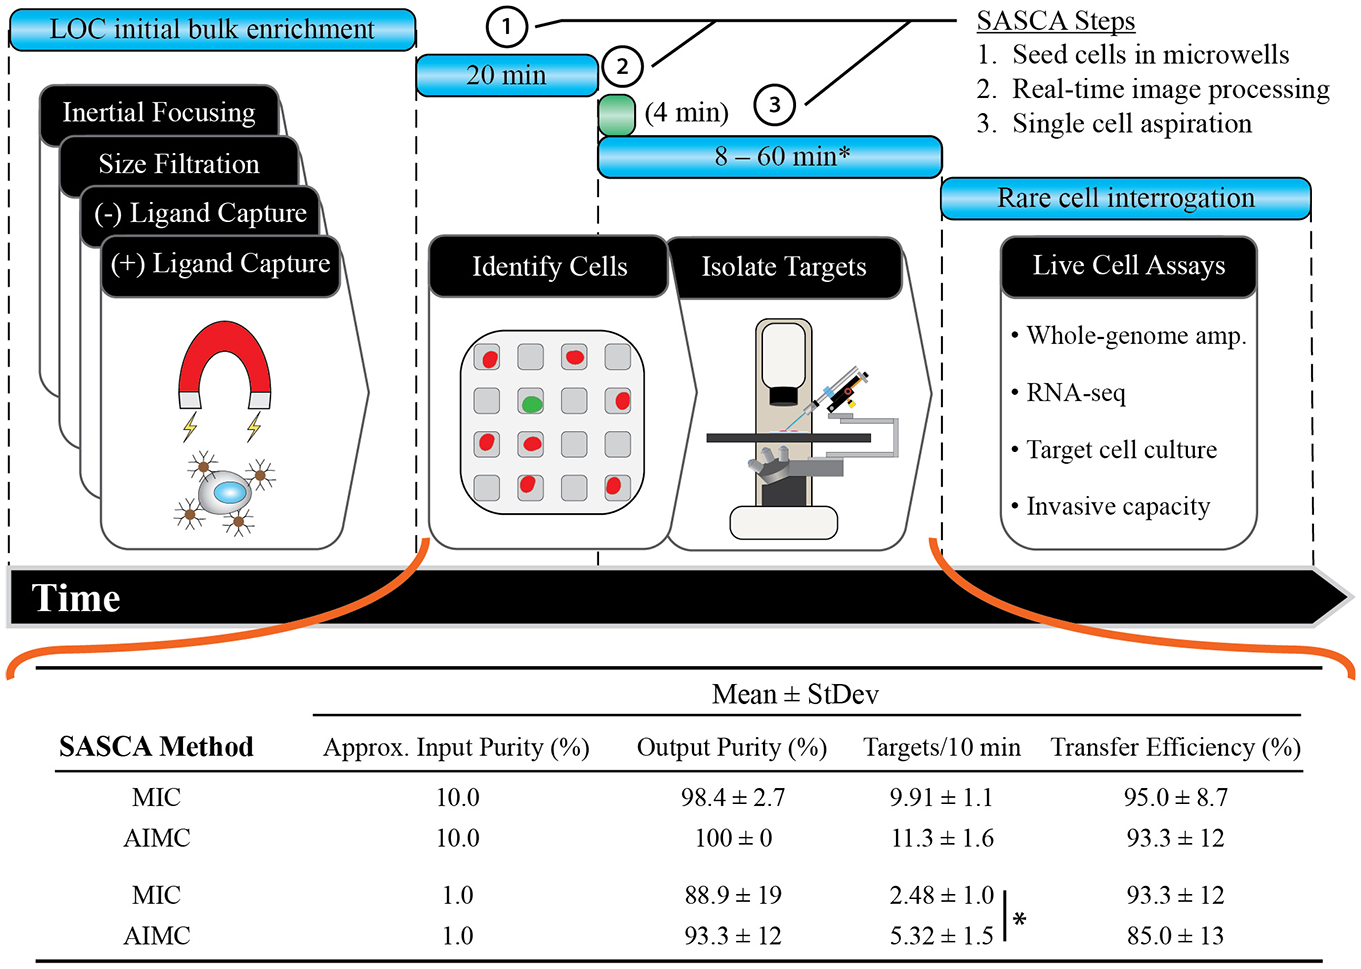
SASCA sample throughput. Top: The general SASCA workflow begins with the initial bulk enrichment of CTCs from whole blood using any variety of LOC enrichment techniques. Once the bulk sample is enriched, it is processed using the SASCA platform. The sample is seeded into a MA (20 min), the sample is imaged, cells are identified in real time (optional; 4 min), and targets are gently aspirated for downstream assays. Bottom: When comparing MIC and AIMC protocols, it was found that the AIMC protocol increased aspiration rate (*p = 0.03) while not sacrificing final purity or CTC transfer efficiency (n = 3).
To illustrate the improvement of aspiration with AIMC, heterogeneous cell mixtures were made with an initial target cell purity of approximately 1% and 10%. These ratios were chosen because they should be representative of sample purity after an initial bulk enrichment step is completed. Target cells were identified using either the MIC or AIMC method, before being aspirated, dispensed, and counted to quantify output purity and transfer efficiency. As shown in
Figure 4
, both methods provided highly pure samples (90%–100%), while very few cells were lost between aspirating and dispensing (85%–95% transfer efficiency). We observed increased output purity and speed of target isolation when using the AIMC method relative to the MIC. In fact, as impurity increased, aspiration speed increased as well (p = 0.03;
Aspiration Enriches qPCR Endpoint
To test the isolation capabilities of the SASCA, we focused on the enrichment of prostate cancer CTCs because they offer a heterogeneous system with a rare subpopulation of cells that have been shown to provide insight into disease progression and drug resistance. To evaluate the accuracy of the SASCA, we tested our ability to separate individual prostate cancer cell lines from a mixed cell sample based on phenotypic differences. To replicate a VERSA-enriched CTC sample, a human prostate cancer cell line (22Rv1) was spiked into samples of a human monocyte cell line, THP-1. We began by labeling the 22Rv1 cell line using anti-EpCAM-PE antibodies and the THP-1 cell line with anti-CD45-AlexaFluor 647 and mixing the cells at a ratio of 1:100. Pure samples of both 22Rv1 and THP-1 cells were also used as starting populations for aspiration to provide a pure cell benchmark. Each cell mixture was added to one or multiple bull’s-eye MAs to ensure at least 50 cells were available for aspirations at a distribution of 720 cells per MA. The 22Rv1 cells were aspirated using the SASCA with the MIC method, prior to implementation of the real-time imaging software. To quantify the accuracy of this process, the SASCA purified populations were imaged and manually identified as either a 22Rv1 target cell or THP-1 contaminant cell, as per their staining phenotype. Using this method, we achieved an output purity of 83.8% with the SASCA platform (
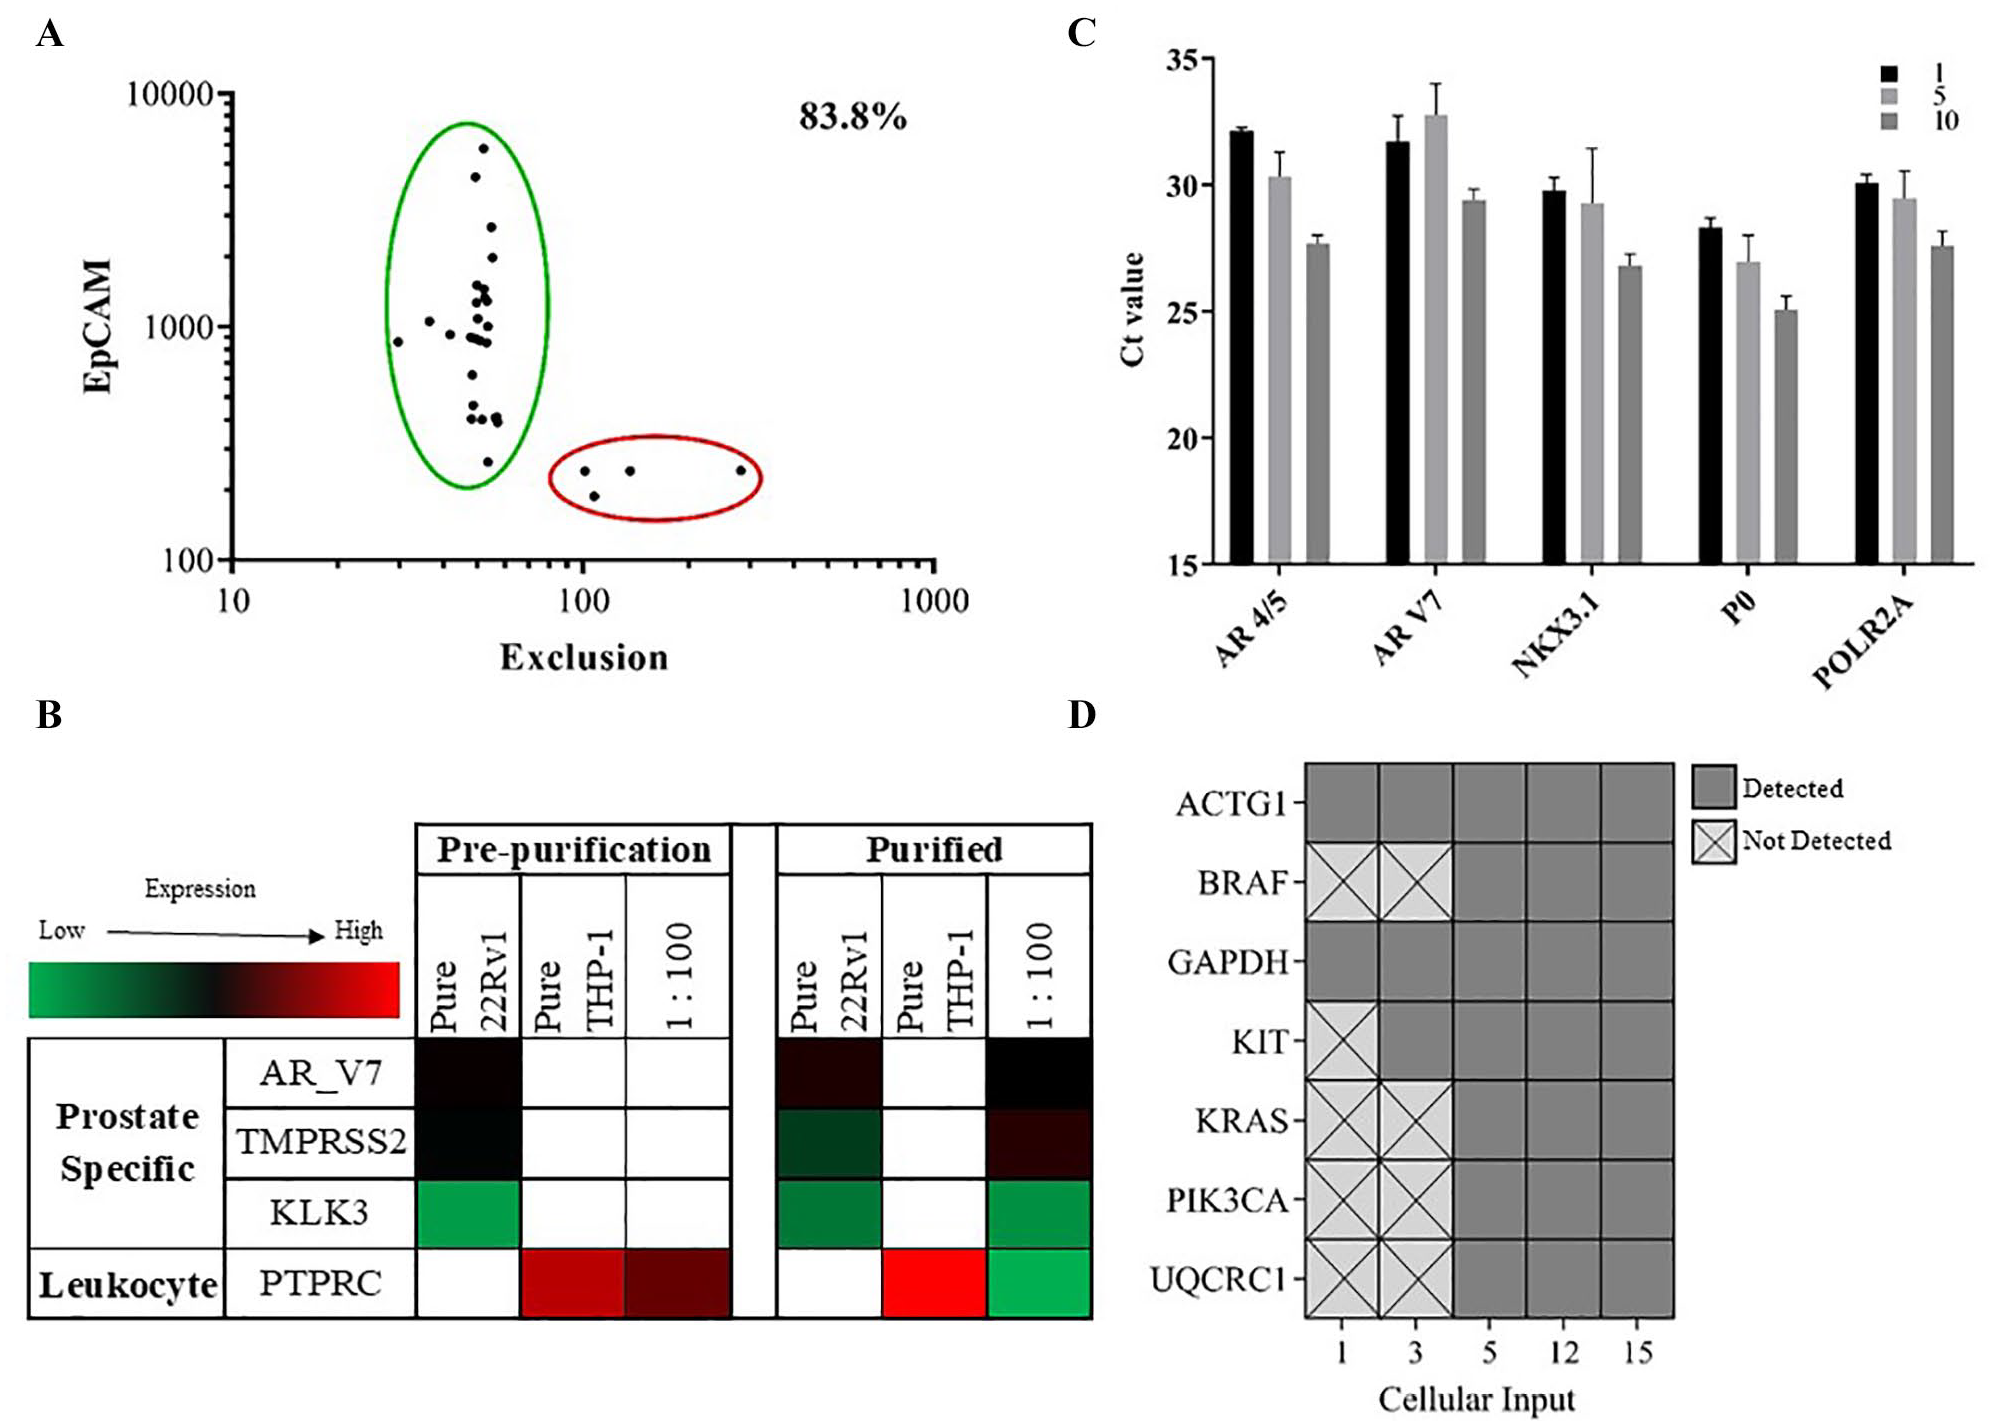
Cell line enrichment. (
RNA was isolated from the aspirated cells to evaluate enrichment of prostate specific transcripts. The chosen genes are all involved in AR signaling (AR splice variant AR_4/5, TMPRSS2, and the prostate specific antigen KLK3), the expression of which occurs in 22Rv1 cells but not THP-1 cells. Figure 5B represents the qPCR results from this experiment. As expected, pure 22Rv1 cells expressed prostate specific markers and THP-1 cells expressed high levels of leukocyte marker PTPRC (CD45) in both the prepurified and aspirated samples. Compared with the pure THP-1 population, we observed reduced expression of PTPRC in the aspirated prostate cancer sample. Additionally, all prostate specific markers showed increased expression in the aspirated sample, indicative of a highly enriched 22Rv1 population. Here, it is helpful to consider the composition of the initial cell mixture populations. Assuming an estimated 50 cells in each mixture prior to purification, only 0.5 cells would be found in a 1:100 mixture. This is reflected by the lack of expression of prostate specific markers. However, after purification with the aspirator, the expression of these markers is significantly improved. This corresponds to a greater concentration of 22Rv1 cells in the final population of cells, indicating that the aspirator successfully enriched the target 22Rv1 population. Though we demonstrate our ability to precisely identify and isolate rare-cell subpopulations, we further optimized the aspiration by automating the image processing software and applying the AIMC technique to isolate target cells from heterogeneous cell mixtures, with the aim of increasing purity and decreasing sample acquisition time.
Molecular Analysis of Low Cell Numbers
To determine the minimum number of cells necessary for obtaining transcriptomic and genomic endpoints, we captured defined numbers of cells with the SASCA platform before subjecting them to downstream analysis. First, the prostate cancer cell line C4-2B was used to assess mRNA extraction and whole transcriptome amplification at low cell numbers. Starting with three different cell inputs (10, 5, and 1), we were able to successfully amplify all targeted prostate specific genes (AR splice variants AR 4/5 and AR V7, and androgen-signaling NKX3.1) as well as housekeeping genes POLR2A and RPLOP0 for all starting inputs (
Next, low numbers of aspirated LAPC4 cells (15, 12, 5, 3, and 1) were isolated with SASCA, followed by WGA. Amplification of genomic DNA was assessed using a qPCR assay composed of genes known to play a role in cancer.
49
Using a threshold for detection set at 36 Ct values, we chose a binary rating system to assess whether or not we had attained high-quality WGA DNA (
Aspiration Selection of CTCs in CRPC
We applied the SASCA technology to interrogate CTCs from patients with castration-resistant prostate cancer (CRPC). CTCs were first enriched using the VERSA, an EpCAM antibody-based positive-selection system. Cells were stained in the VERSA with EpCAM and Exclusion markers (CD45/CD34/CD11b), as well as a nuclear stain. Captured cells were transferred to MAs and then imaged to identify target cells. EpCAM+/Exclusion− events were identified as CTCs, while EpCAM−/Exclusion+ events were identified as PBMCs. As seen in
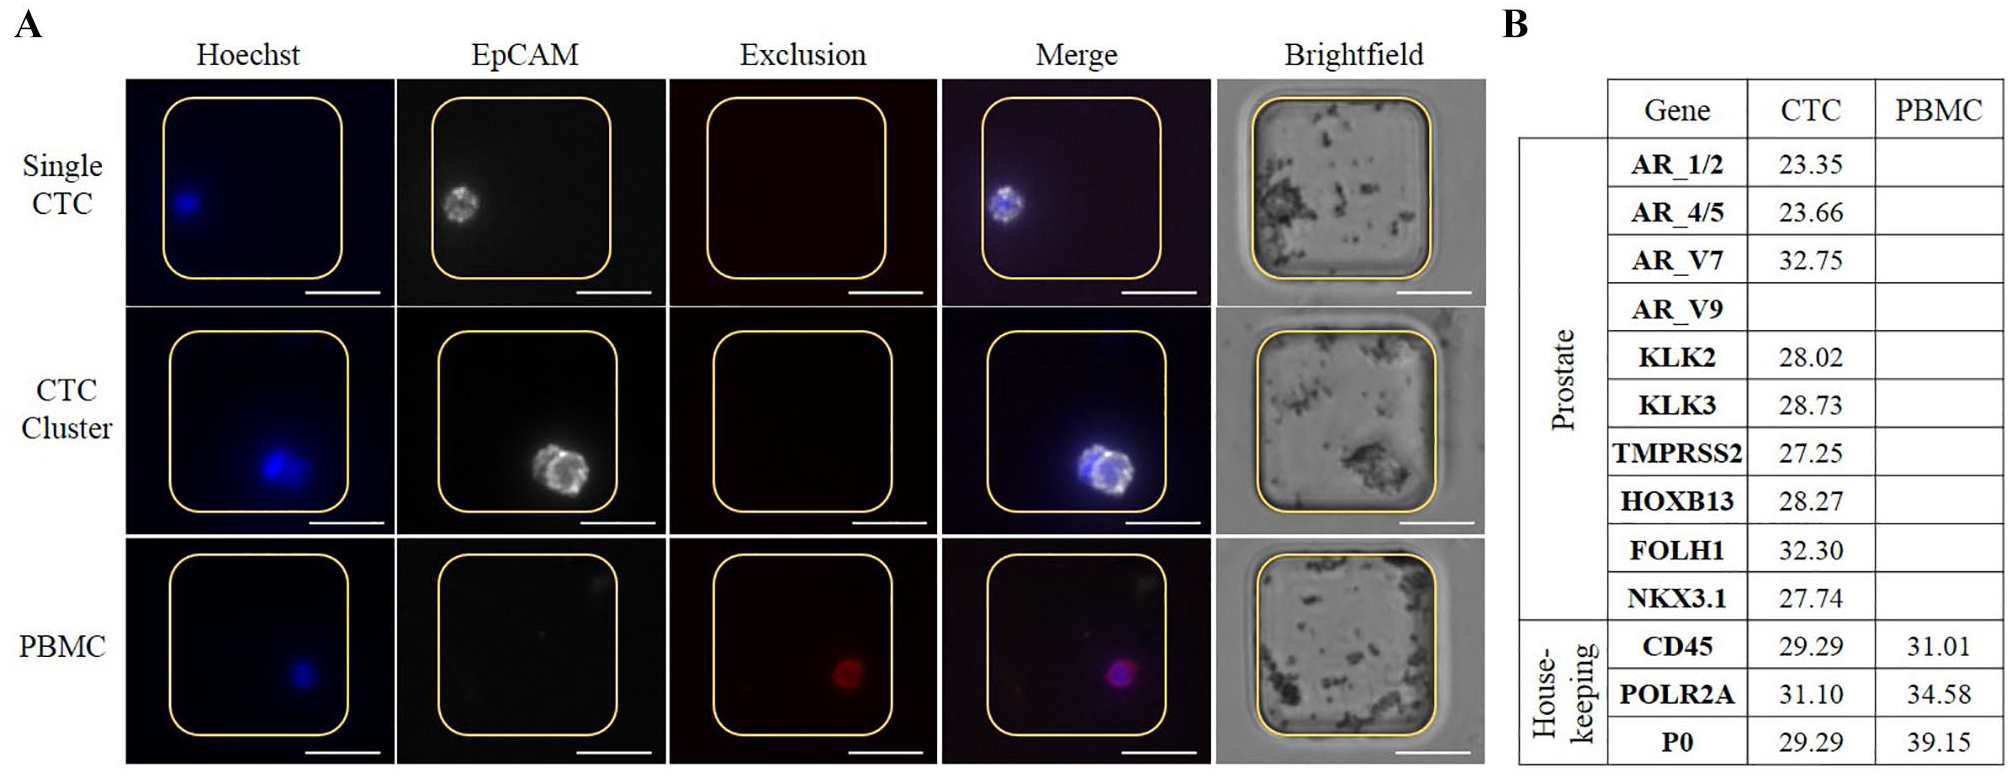
Enrichment of patient sample. (
Discussion
The SASCA platform leverages multiple technologies to improve purification of live rare-cell populations. Here, we describe its application in CTC isolation from liquid biopsies. Our initial CTC enrichment is performed using the VERSA device, which employs EpCAM-labeled paramagnetic beads to bind and extract EpCAM-expressing cells. Although this method provides a high degree of enrichment, the purity is often insufficient for precise molecular analysis of CTC populations, which have been shown to hold clinically relevant information. Acquiring viable, purified cells is imperative for reliable molecular characterization, including transcriptomic and genomic assays. The presence of contaminating background cells can mask changes occurring in rare cells and obscure expression of potentially clinically relevant biomarkers. Additionally, the quality of genomic sequencing is enhanced with a higher-purity cellular input, allowing visualization of copy number changes, insertions/deletions, gene rearrangements, and mutations. To overcome this obstacle, the SASCA platform detects and isolates rare cells on an individual basis, according to their phenotype. Live cells are collected and can be used for a wide variety of downstream analysis applications.
We sought to develop a strategy that integrates LOC bulk enrichment approaches with single-cell selection in order to improve rare-cell purities. As we developed each component of this tandem approach, achieving high purity of isolated cell populations was our primary objective, which in the past could potentially hinder cell yield and throughput. However, in this platform we sought to improve purity while minimally diminishing cell yield and throughput. While there is potential for cell loss when transferring from the upstream LOC device to the SASCA, this step is still necessary to achieve the level of purity required for advanced downstream analytics. To this end, the SASCA was designed to maximize output purity by integrating with a standard inverted microscope and a MA device. The platform itself is mounted to the z axis of the microscope, improving the ease of sample navigation, which in turn improves sample throughput. Guided by the semiautomated software, the MA device facilitates confident rare-cell collection. Combining these features greatly increases output purity without sacrificing speed and recovery. Moreover, all of the components used to fabricate the SASCA platform are easily accessible and affordable, which could benefit other labs performing rare-cell studies, where fluorescent microscopes with motorized stages are already available and requisite to perform such studies.
Commercially available technologies exist for manipulating individual cells within a bulk population. Previous rare-cell studies have used CMMs to isolate and interrogate individual cells. CMMs currently are available as manual, motorized, or automated models. The more motorized and automated a model is, the more expensive it is; automated models can cost up to $300,000, while the simplest mechanical models start at $750. However, cost is inversely proportional with regard to maneuverability and sample throughput. The SASCA was designed to harness advantages from both systems. To circumvent these drawbacks, the SASCA was designed to be mounted to the z axis of the microscope. Similar to the way robotic manipulators function through keeping their end effector in view, the SASCA keeps the micropipette tip in the field of view of the user at all times by virtue of its z-axis integration. The advantage gained from this is ease of handling by the user, as well as reliable precision and increased throughput. We assess how the SASCA compares to other CMMs in
Similar to the SASCA, the CellRaft System is a commercially available platform that integrates microscopes with MAs to isolate subpopulations of cells, and it also is mounted to the z axis. CellRaft illustrates how the integration of microtechnology with microscopy can be leveraged to enable microscale applications and capabilities. While our study and CellRaft show the benefits of attaching a microscope modification to the z axis, users should verify with their microscope manufacturer to ensure it is able to withstand the addition of the SASCA platform.
In addition to our unique CMM mounting method and our semiautomated collection approach (AIMC), we have provided an optimized method of seeding heterogeneous samples into microwells. Previous attempts in the literature to optimize microwell seeding density have used a Poisson distribution to model how cells distribute to wells. Indeed, the Poisson distribution is very effective at modeling truly monodisperse suspensions of cells; however, in reality, cell suspensions typically also contain small clusters of cells as well. Therefore, we have chosen to use the Pólya-Aeppli distribution. The Pólya-Aeppli distribution models Poisson delivery of clusters of items (i.e., cells) where the number of items in the clusters follows a geometric distribution. This distribution modeled the experimental seeding data significantly better than the Poisson distribution. To our knowledge, we are the first to suggest and demonstrate application of the Pólya-Aeppli distribution to microwell seeding. Together, the tools described above were designed to be flexible and enable translation to alternative microscopy platforms, representing a significant contribution to rare-cell enrichment technologies.
Although the single-cell isolation platform introduced here was used for CTC interrogation, the capabilities of the SASCA are not limited to CTCs, as advanced single-cell isolation presents a variety of applications for rare-cell studies. 52 Traditionally, molecular biology has studied tissue slices (tumor, brain, embryo, etc.), blood, or populations of cultured cells, which have varying levels of heterogeneity that researchers aim to better understand. For example, the analysis of neural progenitor cells could improve our understanding of developmental neural disease progression but requires the ability to isolate subpopulations of neural cells. Advances such as microdissection and single-cell isolation have allowed analysis of the heterogeneity of complex systems, which could provide new insights into disease progression. 53 As studies into the heterogeneity of diseased and developing tissue continue to increase, the SASCA provides an affordable, highly controllable platform to facilitate this research.
Conclusion
Improving the molecular evaluation of tumoral heterogeneity requires robust technology able to separate individual live cells for interrogation. To address these challenges, we have developed a platform that integrates low-cost technologies, such as MAs and manual micromanipulators, with real-time imaging software to isolate viable single cells based on phenotypic markers. Our platform successfully demonstrated enhanced purification of cell line subpopulations, resulting in the enrichment of gene expression endpoints. When applied to patient samples, we were also able to enrich both prostate cancer CTC and PBMC populations. The SASCA platform presents a highly controlled, affordable method for the isolation of subpopulations of cells that could provide the specificity and reliability needed for rare-cell investigation.
Supplemental Material
supplemental_material_for_SASCA_by_Tokar_and_Stahlfeld_et_al – Supplemental material for Pairing Microwell Arrays with an Affordable, Semiautomated Single-Cell Aspirator for the Interrogation of Circulating Tumor Cell Heterogeneity
Supplemental material, supplemental_material_for_SASCA_by_Tokar_and_Stahlfeld_et_al for Pairing Microwell Arrays with an Affordable, Semiautomated Single-Cell Aspirator for the Interrogation of Circulating Tumor Cell Heterogeneity by Jacob J. Tokar, Charlotte N. Stahlfeld, Jamie M. Sperger, David J. Niles, David J. Beebe, Joshua M. Lang and Jay W. Warrick in SLAS Technology
Footnotes
Acknowledgements
We would like to thank all patients who participated in this study. We are also grateful for the help of the UWCCC clinical research group, especially Jamie Wiepz, Kelly Bush, Amy Forsyth, Dorothea Horvath, Jane Straus, Mary Jane Staab, Dr. Glenn Liu, Dr. Douglas McNeel, Dr. Christos Kyriakopoulos, and Dr. Hamid Emamekhoo. Finally, we would like to acknowledge David J. Guckenberger for his engineering expertise, Croix Kimmel for his help in manufacturing devices, and Yasmin Alvarez-Garcia and Loren Stallcop for their help with contributions to the Pluronic F-127 protocol.
Supplemental material is available online with this article.
Declaration of Conflicting Interests
The authors declared the following potential conflicts of interest with respect to the research, authorship, and/or publication of this article: David J. Beebe holds equity in Bellbrook Labs LLC, Tasso Inc., Stacks to the Future LLC, Lynx Biosciences LLC, Onexio Biosystems LLC, and Salus Discovery LLC. Joshua M. Lang holds equity in Salus Discovery, LLC.
Funding
The authors disclosed receipt of the following financial support for the research, authorship, and/or publication of this article: This work was supported by a Movember-Prostate Cancer Foundation Challenge Award (to J. M. Lang and D. J. Beebe), NIH grant no. 1R01CA181648 (to J. M. Lang), Department of Defense Synergistic Idea Development Award PC140746 (to J. M. Lang), NIH grant no. 5R33CA137673 (to D. J. Beebe), and University of Wisconsin Carbone Cancer Center support grant NIH P30 (to D. J. Beebe and J. M. Lang).
References
Supplementary Material
Please find the following supplemental material available below.
For Open Access articles published under a Creative Commons License, all supplemental material carries the same license as the article it is associated with.
For non-Open Access articles published, all supplemental material carries a non-exclusive license, and permission requests for re-use of supplemental material or any part of supplemental material shall be sent directly to the copyright owner as specified in the copyright notice associated with the article.