
Abstract
Cutaneous measurements of electrogastrogram (EGG) signals are heavily contaminated by artifacts due to cardiac activity, breathing, motion artifacts, and electrode drifts whose effective elimination remains an open problem. A common methodology is proposed by combining independent component analysis (ICA) and ensemble empirical mode decomposition (EEMD) to denoise gastric slow-wave signals in multichannel EGG data. Sixteen electrodes are fixed over the upper abdomen to measure the EGG signals under three gastric conditions, namely, preprandial, postprandial immediately, and postprandial 2 h after food for three healthy subjects and a subject with a gastric disorder. Instantaneous frequencies of intrinsic mode functions that are obtained by applying the EEMD technique are analyzed to individually identify and remove each of the artifacts. A critical investigation on the proposed ICA-EEMD method reveals its ability to provide a higher attenuation of artifacts and lower distortion than those obtained by the ICA-EMD method and conventional techniques, like bandpass and adaptive filtering. Characteristic changes in the slow-wave frequencies across the three gastric conditions could be determined from the denoised signals for all the cases. The results therefore encourage the use of the EEMD-based technique for denoising gastric signals to be used in clinical practice.
Keywords
Introduction
The myoelectrical activity of the stomach is popularly known as the electrogastrogram (EGG). It consists of rhythmic slow waves and spikes originating from the interstitial cells of Cajal located inside the walls of the stomach. 1 The slow waves are responsible for the phasic contractions of the smooth muscles of the stomach, with a typical frequency ranging from 0.015 to 0.15 Hz (~1–9 cycles per minute [cpm]), a dominant frequency of around 0.05 Hz (3 cpm), and an amplitude range of 50–500 µV. 1 Clinically, EGG signals are reliably measured using invasive serosal electrodes. 1 Characterization of gastric slow waves in terms of amplitude, power, and frequency is essential to study gastric rhythm disorders and gastric motility. 2 It is somewhat difficult to accurately measure and characterize the gastric signals at the cutaneous level by surface electrodes (kept above the stomach) owing to the heavy contamination of the measured signal by biological artifacts like the electrocardiogram (ECG), respiration, motion artifacts, electrode drifts, random noise, and so forth. These interferences pose a challenge for accurate characterization of EGG signals to be used in clinical practice.2,3 Meanwhile, apart from measuring EGG signals using a limited number of electrodes, multichannel measurements are thought to be suitable to understand the physiology of gastric slow waves in a better way.4,5
Many techniques have been used by researchers for the purpose of extracting surface EGG with a clinically acceptable signal-to-noise ratio. Classical Fourier domain approaches,6–9 like bandpass filters (BPFs) and autoregressive models, have an inherent limitation on their applicability to nonstationary EGG signals whose frequency, amplitude, and phase widely vary across measurement timings and subjects. 5 To circumvent this problem, researchers10,11 have used wavelets to extract gastric signals amidst severe contaminations from biological artifacts and random noise. Nevertheless, the performance of wavelet denoising crucially depends on the proper selection of mother wavelet. 12 Hence, the generality of wavelet approaches to be applied for a wide group of normal and abnormal gastric signals needs to be optimized. Adaptive filters13,14 have been shown to be extremely useful in denoising gastric signals with the help of separate reference sensors. Since the efficiency of such approaches is crucially dependent on the reference channel, it is impractical to ensure that an estimate of the artifact could be applied to cancel the noise in all the measurement channels in all situations.15,16 The empirical mode decomposition (EMD) method 17 has been considered a suitable technique in identifying and selectively eliminating cardiac and breathing artifacts in EGG facilitated by instantaneous frequency (IF) analysis. 18 The fact that the EMD method does not require any basis function or reference sensors makes EMD more attractive in individually combating the artifacts, even with fewer numbers of EGG channels. Despite the superiority of EMD denoising for gastric signals, the usage of the method for denoising gastric slow waves is only sparingly found in the literature. 19
This article reports an extension of the EMD approach for further denoising multichannel EGG by utilizing the power of independent component analysis (ICA) combined with the ensemble empirical mode decomposition (EEMD) technique, 20 which overcomes some of the inherent limitations of the EMD method. While such a combined methodology has already been demonstrated for denoising multichannel magnetocardiogram signals, 21 a few modifications have been incorporated in the overall sequence of this combined methodology to make it suitable for eliminating artifacts in EGG signals. The methodology has been tested on gastric signals measured on a few subjects under standard EGG measurement conditions, and the results have been quantitatively compared with those from conventional approaches. It was found that ICA-EEMD outperforms other techniques by exhibiting good-quality gastric slow-wave signals with the lowest amount of distortion and an effective attenuation of artifacts. This work justifies the suitability of the proposed approach in selectively eliminating various artifacts, leading to a better characterization of gastric slow waves for routine clinical gastroenterological assessments.
Materials and Methods
EGG Measurement
EGG signals were measured using 16 discrete channels of a 64-channel electroencephalogram system, which can also function as a general-purpose biopotential recorder (Compumedics Ltd., Victoria, Australia) with the following parameters: bandwidth 0 and 200 Hz, gain 1000, and signal amplitude range ±200 mV. The analog signals were digitized with an analog-to-digital converter with a sampling rate of 1000 samples/s and a resolution of 24 bits. Discrete silver–silver chloride electrodes were used to measure the signals from the anterior abdominal surface (epigastrium) with the subjects lying in supine position. A skin–electrode contact impedance of ~10 kΩ was achieved by applying the skin preparation paste before applying the electrode gel. All 16 electrodes were placed on the abdominal surface below the xiphoid process and above the umbilicus with an electrode-to-electrode spacing of 3 cm in a 4 × 4 square matrix. The ground electrode was placed at the left costal margin horizontal to the central electrode of the measurement electrode matrix. A common reference electrode was placed on the midpoint of the vertical line joining the xiphoid and the umbilicus.1,5 Signals measured on all the measurement channels are referenced to the common reference electrode channel. EGG measurements were performed on four subjects (all male), one of whom had a gastric disorder diagnosed based on endoscopy and biopsy for bacterial infection in the stomach. The average body mass index of the subjects was 24 kg/m2. The measurements were conducted under three conditions, namely, preprandial (fasting state), postprandial (immediately after a meal), and postprandial (2 h after a meal). Written informed consents was obtained from all the volunteers before the EGG measurements were conducted, and the subjects did not complain of any discomfort either during or after the measurement. The subjects were asked to present themselves with an empty stomach and were instructed not to drink even water 2 h before the commencement of the EGG recording. Postprandial recordings were conducted after eating a meal of ~200 kcal. EGG data were recorded for a period of ~12 min for each condition. All the signal processing methods were implemented using MATLAB (Mathworks, Natick, MA).
For the purpose of testing the efficacy of the proposed denoising method in removing artifacts, two reference sensors were used to simultaneously measure breathing and body movements during EGG measurements for three of the four subjects. A thermistor sensor (TMP102, Texas Instruments, Dallas, TX) with a resolution of 0.06 °C was fixed below the nostrils of the subjects for measuring local changes in temperature during inhalation and exhalation. 22 A microelectromechanical-based three-axis accelerometer (ADXL335, Analog Devices, Norwood, MA) 23 with a measurement range of ±3 g and sensitivity of 300 mV/g was configured to measure vertical movements (Z axis) of the abdomen by fixing the accelerometer over a belt attached to the waist of subjects. The sensor measured acceleration proportional to body movements that are on pace with respiration or any other voluntary or involuntary motions. These signals were later correlated with the residual signals (obtained by subtracting denoised signals from raw EGG data) of different denoising methods. Signals recorded from these two sensors were also digitized and filtered with a BPF (0–45 Hz). These signals were later used as a reference for breathing and body movements for adaptive filtering. Least mean square adaptive filters 24 with a step size of 0.001 and tap length of 45 were used for the thermistor reference signal, and a tap length of 125 was used for accelerometer signals to adaptively filter the raw EGG signals for comparison with those of the proposed method.
Preprocessing of EGG Signals
The as-measured signals from the anterior abdomen are contaminated by artifacts like cardiac, respiratory, drift, and motion artifacts at various levels, causing the baseline of the very low-frequency gastric signals to undulate around a baseline and necessitate signal denoising methods to improve the signal-to-noise ratio.1–3
The below procedures were followed to denoise the gastric signals.
The baseline envelope of the cardiac signal in each measurement channel was isolated.
The envelope signals from all 16 channels were then treated as the raw data for EGG processing. The envelope signals were then downsampled to 10 Hz.
The raw data were subjected to ICA decomposition. Each independent component (IC) was subjected to EMD and EEMD processing.
Intrinsic mode functions (IMFs), which are obtained from EMD/EEMD decomposition, were subjected to the Hilbert–Huang transform (HHT). 17 From the spectral plots of the HHT, the IFs of the individual artifacts were identified and removed while adding the IMFs of each IC.
By compiling these ICs, which are denoised by the EEMD/EMD procedure, denoised EGG signals of all 16 channels were obtained by backprojecting the ICs. 21
The proposed methodology of combining ICA with EEMD/EMD in denoising multichannel EGG is illustrated as a flowchart in Figure 1 . Each step in the algorithm is explained in subsequent sections.
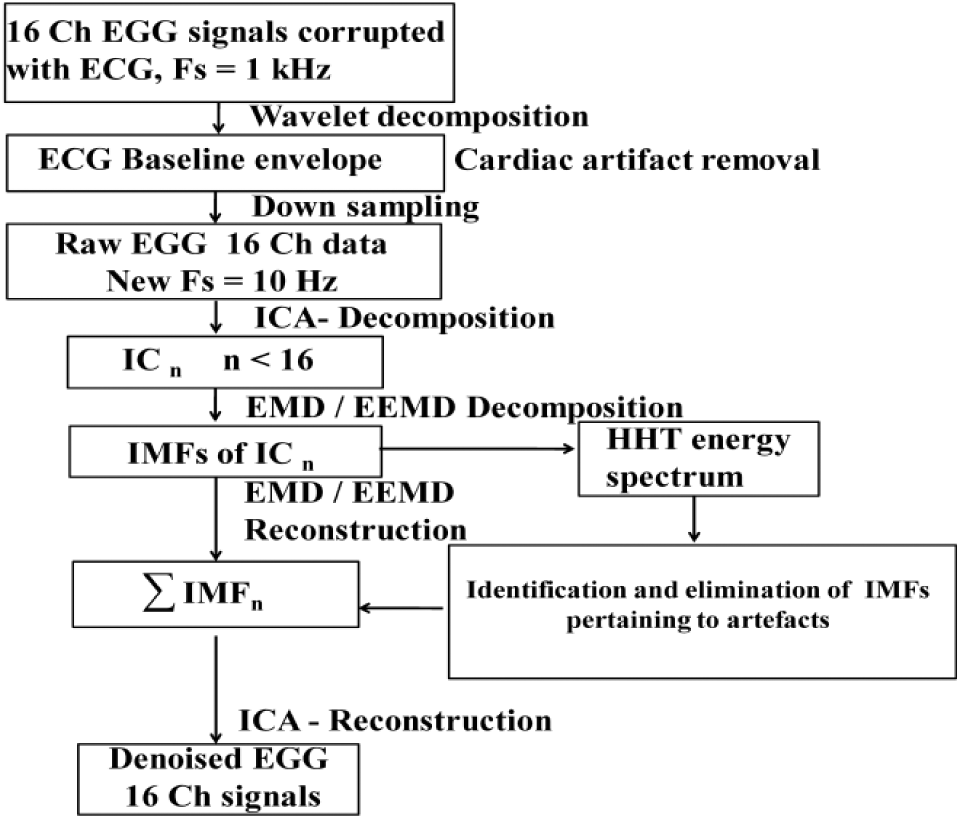
Proposed denoising procedure for multichannel EGG.
Presenting the Raw EGG Data
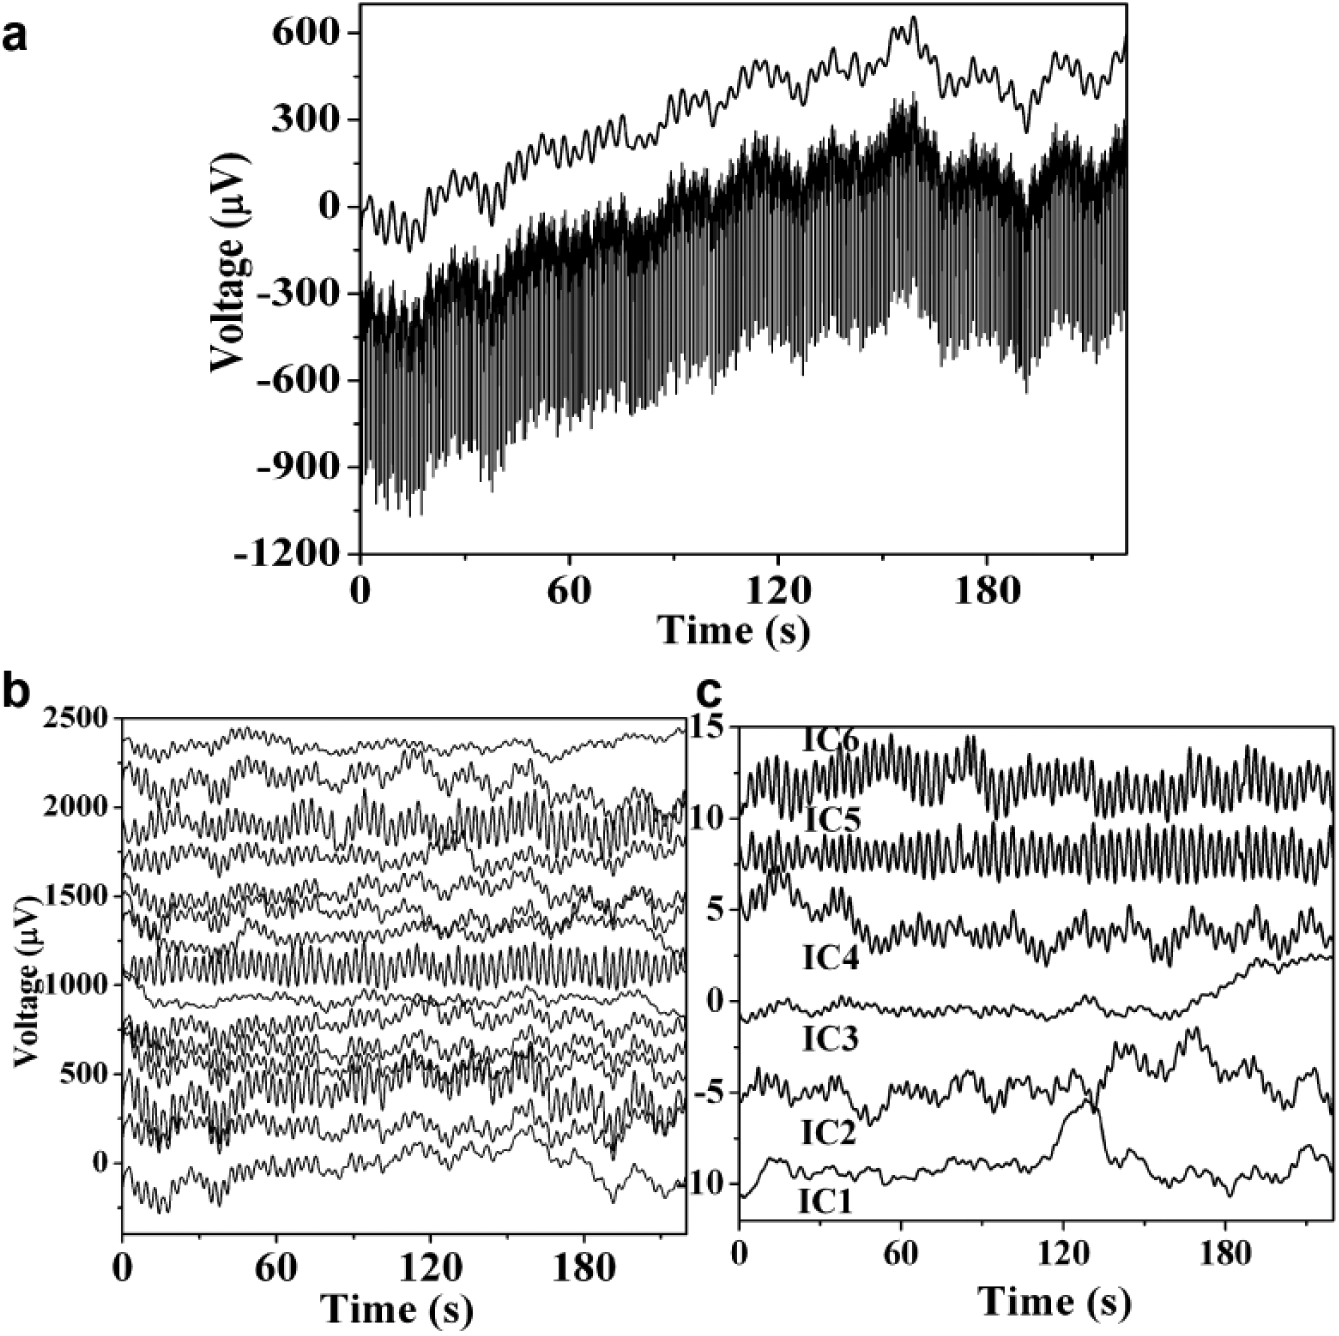
Cardiac artifacts in the as-recorded EGG traces were removed by applying the wavelet transform technique.21,22 The 16-channel data of all the subjects in each measurement condition were subjected to the wavelet decomposition procedure, with typically nine levels of decomposition using the “db 10” wavelet. The approximation coefficient of the wavelet decomposition, which usually contains the lowermost frequency content of any given signal, was used to identify the baseline envelope of the ECG, while the detailed coefficients of wavelet decomposition, which contain cardiac features and other high-frequency noise components in the as-recorded data, were eliminated, as shown in Figure 2a . Notice that the envelope of the ECG is composed of relatively high-frequency oscillations attributed to respiratory activity and very low-frequency EGG signals. These envelopes collected from all 16 channels were then treated as the raw EGG data. EGG contaminated by other artifacts, such as respiratory signals and other low-frequency noise in all the measurement channels, is shown in Figure 2b . The extracted raw EGG data were then downsampled to 10 Hz. While a brief introduction to each of these methods is given in the following section for completeness, detailed descriptions of them may be found elsewhere.25–27
(
Independent Component Analysis
ICA involves extraction of a set of statistically independent signals (sources) from their mixture with unknown mixing coefficients. Let

In this case, s(t), which comprises individual sources [

where W = A−1 in eq 2 is the unmixing matrix. This uncovering of independent sources si(t) from the measured signals xj(t) is generally possible only when the number n of actual sources s(t) is less than the number m of observations x(t). Estimation of A and s(t) depends on the minimization of mutual information between the independent sources and maximizing a metric that measures non-Gaussianity.
In this work, the fast ICA algorithm 28 in MATLAB was used to decompose the 16-channel EGG data shown in Figure 2b into the six typical ICs (ICs 1–6) in Figure 2c .
Empirical Mode Decomposition and Ensemble Empirical Mode Decomposition
The EMD method empirically identifies oscillatory basis (mode) functions intrinsic to any arbitrary signal and expresses the signal as a superposition of these IMFs. The IMFs provide a set of data-driven basis functions in terms of which the original signal admits decomposition. This first IMF is then subtracted from the original signal and a residue signal r1(t) is obtained. The procedure is then repeated by treating the residue as the basic signal to be decomposed into IMFs, and one gets subsequent residues:

At the end of each iteration, there is a progressive increase in the timescale from the first to the last IMF when the original signal is subjected to EMD decomposition. While reconstructing the signal back by summing the IMFs, those IMFs that correspond to artifacts could be eliminated based on prior knowledge of the artifact features. Since the frequencies are usually not constant throughout a given time sequence of nonstationary signals, IFs are calculated by taking the HHT. 17
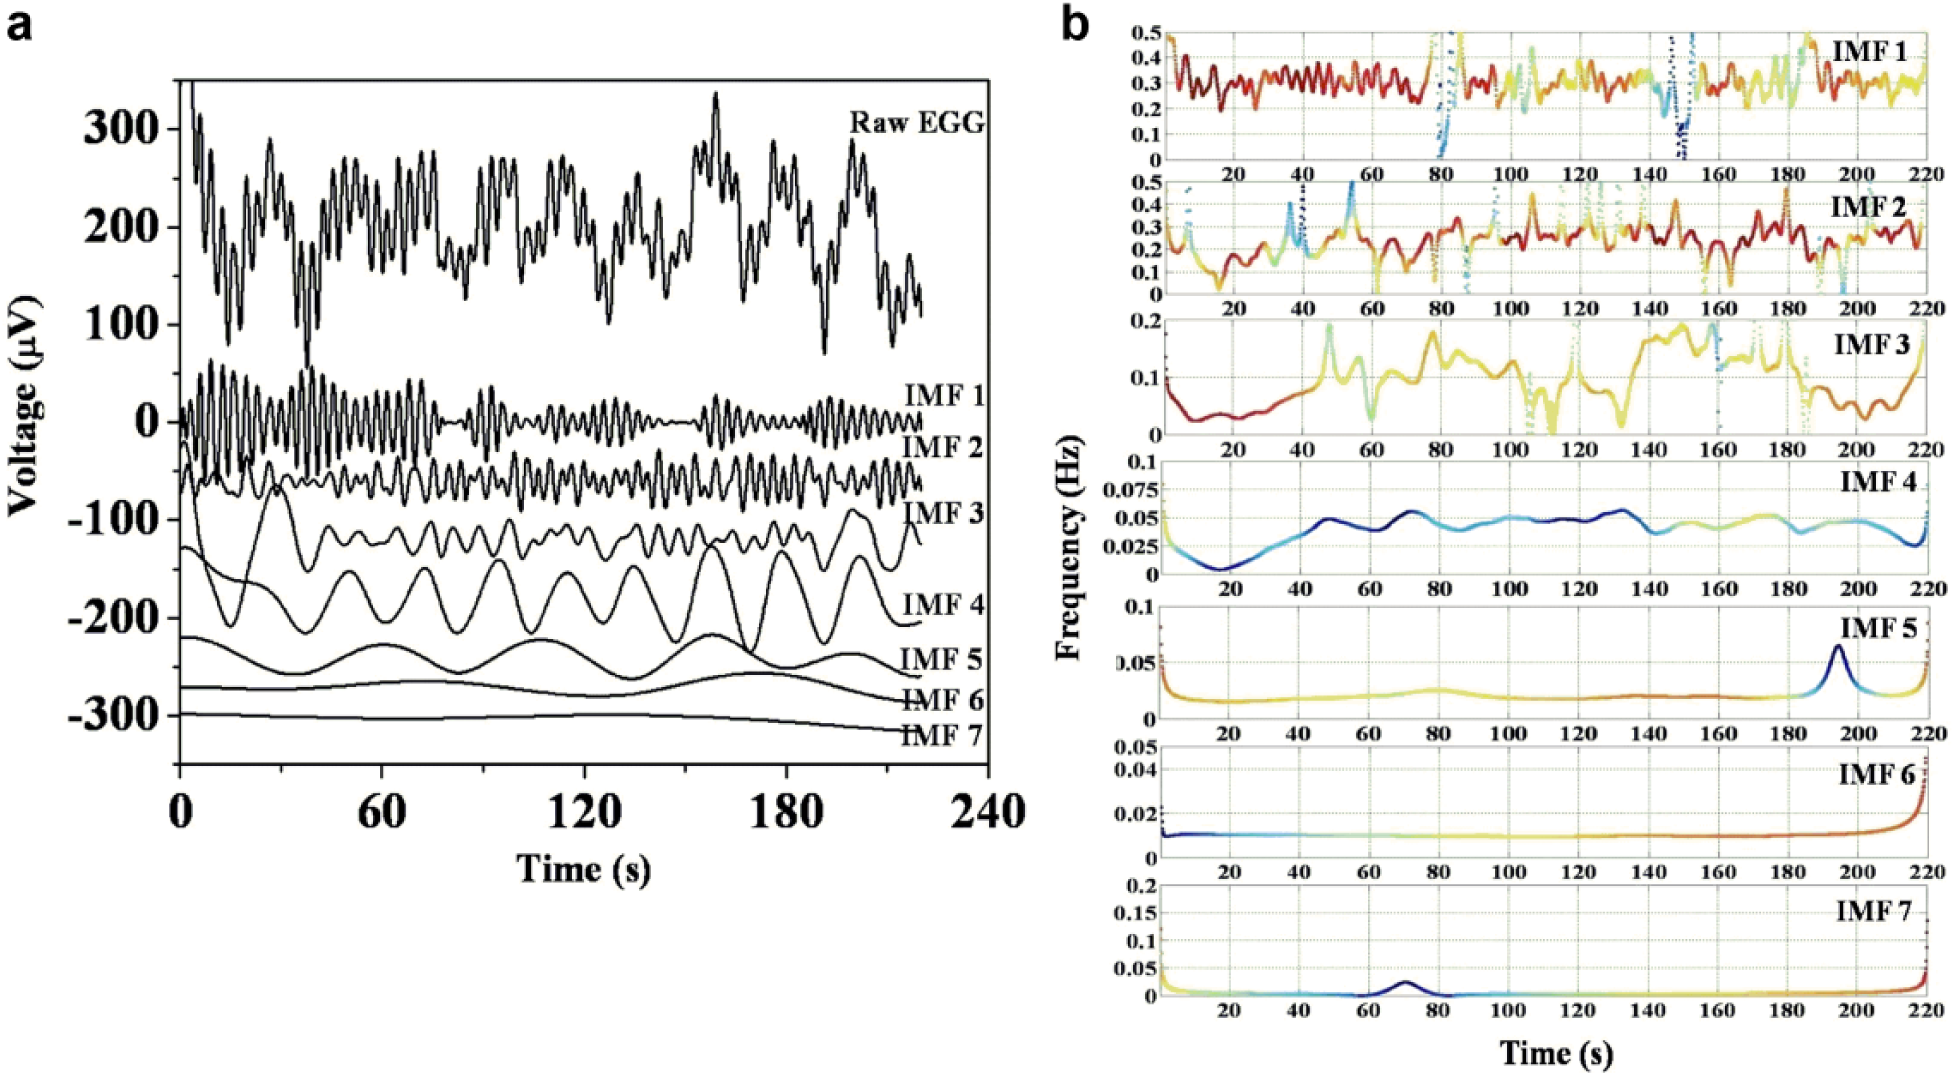
Figure 3a shows an IC of a raw EGG signal when subjected to ICA decomposition and its EEMD decomposition into seven IMFs (denoted as IMFs 1–7 in the figure). The HHTs taken on each IMF are shown in Figure 3b with time–frequency–energy plots featuring the dynamics of the IFs, together with the signal energy at each instant of time. The red color indicates higher energy and blue the lowest. From Figure 3a , b , it is evident that IMFs 1 and 2 contain frequency components spanning 0.3–0.4 Hz and 0.15–0.2 Hz, respectively, which could be attributed to breathing (ignoring a small spread in the IFs at some time instants in both IMFs).3,15,18 IMFs 3 and 4 contain IFs from 0.025 to 0.15 Hz, which could be associated with gastric slow waves and their harmonics. IMF 5 shows IFs (~0.02 Hz or 1.2 cpm) that could be attributed to other low-frequency components of the gastric signals. IMFs 6 and 7 represent very low-frequency drifts (<0.01 Hz); they are not expected from gastric signals and could be related to other sources, like motion artifacts or drifts, due to variations in electrode potentials. 29 Hence, IMFs 1, 2, 6, and 7 could all be removed, retaining the rest of the IMFS. IMFs containing IFs of interest and possessing relatively higher energies (even when such IFs are seen in IMFs associated with artifacts) are taken into consideration during the reconstruction of the signal of interest in order to preserve all the possible signal components.
(
Evaluation of the Denoising Algorithm
The efficacy of each method in denoising gastric slow waves is evaluated using a metric, namely, the signal-to-error ratio (SER), 22 which is the ratio of the power of raw signal to the power of the residual signal at various frequencies. The residue (error) is calculated by taking the difference between the raw signal and the denoised signal using each method.
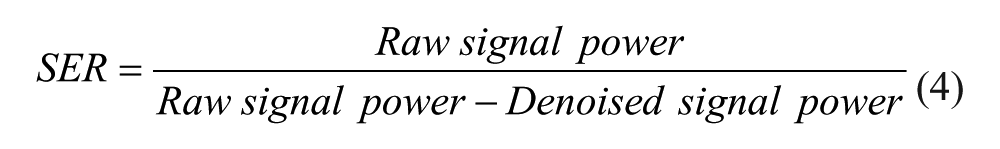
SER is calculated at different frequencies pertaining to the signal and artifacts. Any denoising algorithm is expected to preserve the original signal components (signal and its harmonics), keeping their power unaffected after denoising. Hence, at signal frequencies of interest, SER is expected to be infinity or high and the ratio is expected to be the smallest when calculated at the frequencies of the artifacts. The power of the signal is calculated from the power spectral density (PSD) plots generated using the Thomson multitapper method. 30
Pearson’s correlation coefficient is calculated to evaluate the level of correlation existing between the residue signals obtained by each denoising method and the signals recorded by the two reference sensors. Residue signal that shows a higher correlation with the output of the reference sensor is thus expected to reveal the effectiveness of the corresponding denoising method in removing a specific artifact component measured by the reference sensor. The accelerometer sensor is expected to measure the abdominal movements, which are due to breathing or any motion. The thermistor is expected to measure only breathing signals.
Results
Comparison of EGG Slow Waves Denoised Using EMD, EEMD, and BPF
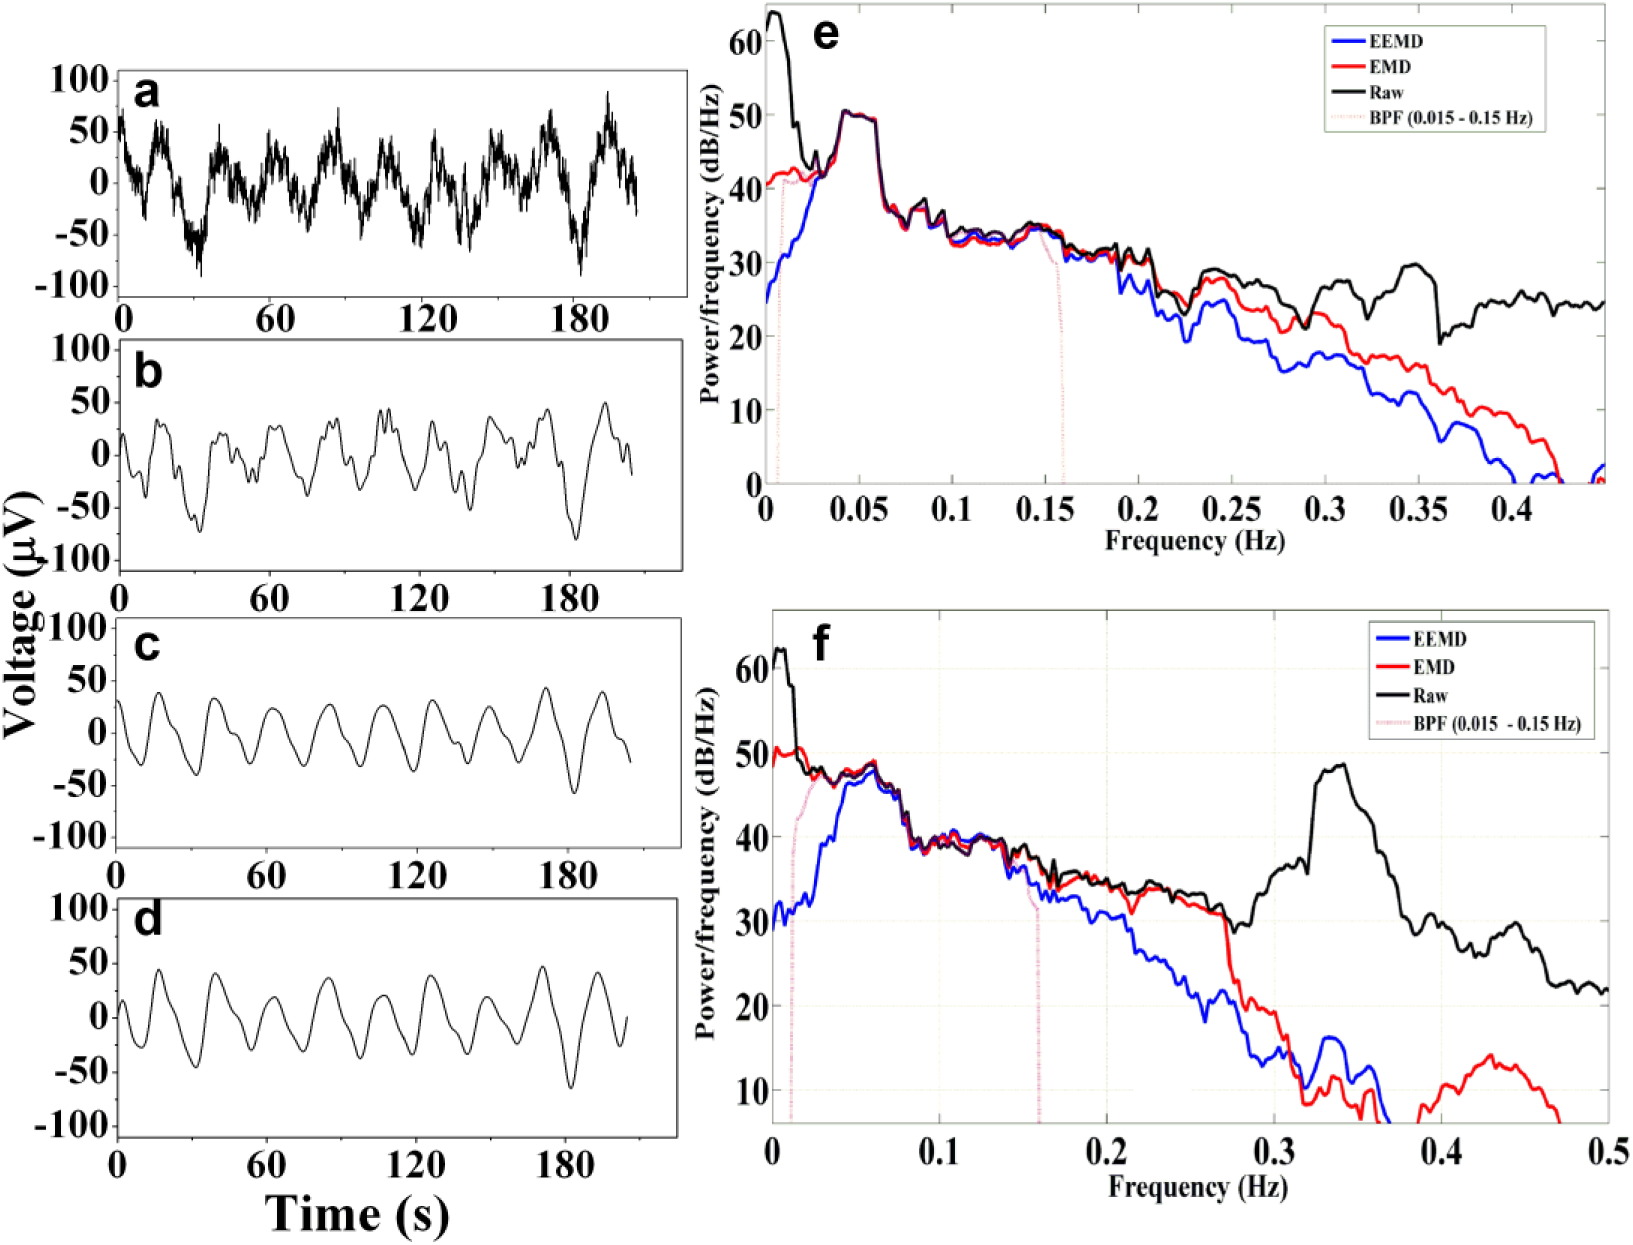
Figure 4 shows an IC of a raw preprandial EGG signal trace of a healthy subject denoised by the EMD method ( Fig. 4b ), the EEMD-based method ( Fig. 4c ), and the conventional BPF with a bandwidth of 0.015–0.15 Hz ( Fig. 4d ). Comparisons of the PSD plots of the raw as-measured EGG signal with those denoised using EMD, EEMD, and BPF for another healthy subject and a subject with gastric disorder are shown in Figure 4e and f , respectively. Relatively high-frequency fluctuations in the raw EGG component represent signal contributions arising from respiratory activity and the harmonic components of signals of gastric origin. Qualitatively, one can clearly see the complete elimination of respiratory artifacts with a noise-free gastric slow wave of 0.05 Hz or 3 cpm in the EEMD-based denoised signal ( Fig. 4c ) and the bandpass-filtered trace ( Fig. 4d ), whereas the EMD-based denoising method ( Fig. 4b ) shows some residual high-frequency wiggles, which are still present along with the gastric slow waves.
(
Figure 4e , f shows the comparison of the PSD plots of the raw as-measured EGG signal with those denoised using EMD, EEMD, and BPF (0.015–0.15 Hz) for a healthy subject and a subject with gastric disorder. For both subjects, the gastric slow waves occur around 0.05 Hz (3 cpm), with their harmonics occurring around 0.1 Hz (6 cpm) and 0.15 Hz (9 cpm), and a prominent respiratory peak near 0.3 Hz (18 cpm). Very low-frequency drifts occur below 0.02 Hz in the raw data of both cases. The slow-wave peak is more conspicuous for the PSD of the healthy subject in Figure 4e than for the subject with gastric disorder in Figure 4f . It is expected that the prominence or percentage of occurrence of slow waves significantly decreases for those with gastric disorders.1–3 It could be observed from PSD in Figure 4f that the frequency of the slow wave becomes visible only by the EEMD method providing better attenuation of drift artifacts than both EMD and BPF. With the chosen passband for the BPF, the drift could not be eliminated; however, the attenuation provided by BPF to respiratory signals is superior to that of both EMD and EEMD.
The SER calculated from the denoised EGG signals of a representative case using ICA-EEMD, ICA-EMD, and BPF, and the adaptive filtering using the accelerometer and thermistor as references are tabulated in Table 1 . Correlations measured between the residues obtained from all the denoising methods with the signals of the two reference sensors are also tabulated in Table 1 . It can be understood from Table 1 that the SERs guide the choice of optimized method that would preserve the slow waves (0.05 Hz) and their harmonics (0.1 and 0.15 Hz) and eliminate artifacts due to motion drifts (<0.02 Hz) and respiratory peaks (0.2 and 0.3 Hz), even though no method is ideal. BPF and an adaptive filter with the accelerometer as reference show high SERs (raw and denoised signal power are same) for the fundamental slow-wave frequency at 0.05 Hz but not for its harmonic at 0.15 Hz. An adaptive filter with a thermistor reference and ICA-EEMD exhibit reasonable preservation of signal and harmonics, which is evident from their reasonably high SERs. However, in eliminating the artifact components, namely, the motion artifacts (0.01 Hz) and respiratory peaks (0.2 and 0.35 Hz), ICA-EEMD supersedes the adaptive filter by eliciting very low SERs. ICA-EMD appears to eliminate artifacts to an acceptable level but fails to preserve signal components. Compared with the other techniques, BPF shows a higher reduction of artifacts, indicated by the small SERs at respiratory frequencies, but it is ineffective in reducing the motion artifacts since these components are within its passband. Another inference is that, apart from EMD/EEMD techniques, accelerometer-based adaptive filtering better removes the motion drifts than thermistor-based adaptive filtering and BPF.
Comparison of EGG Denoised Using Different Methods.
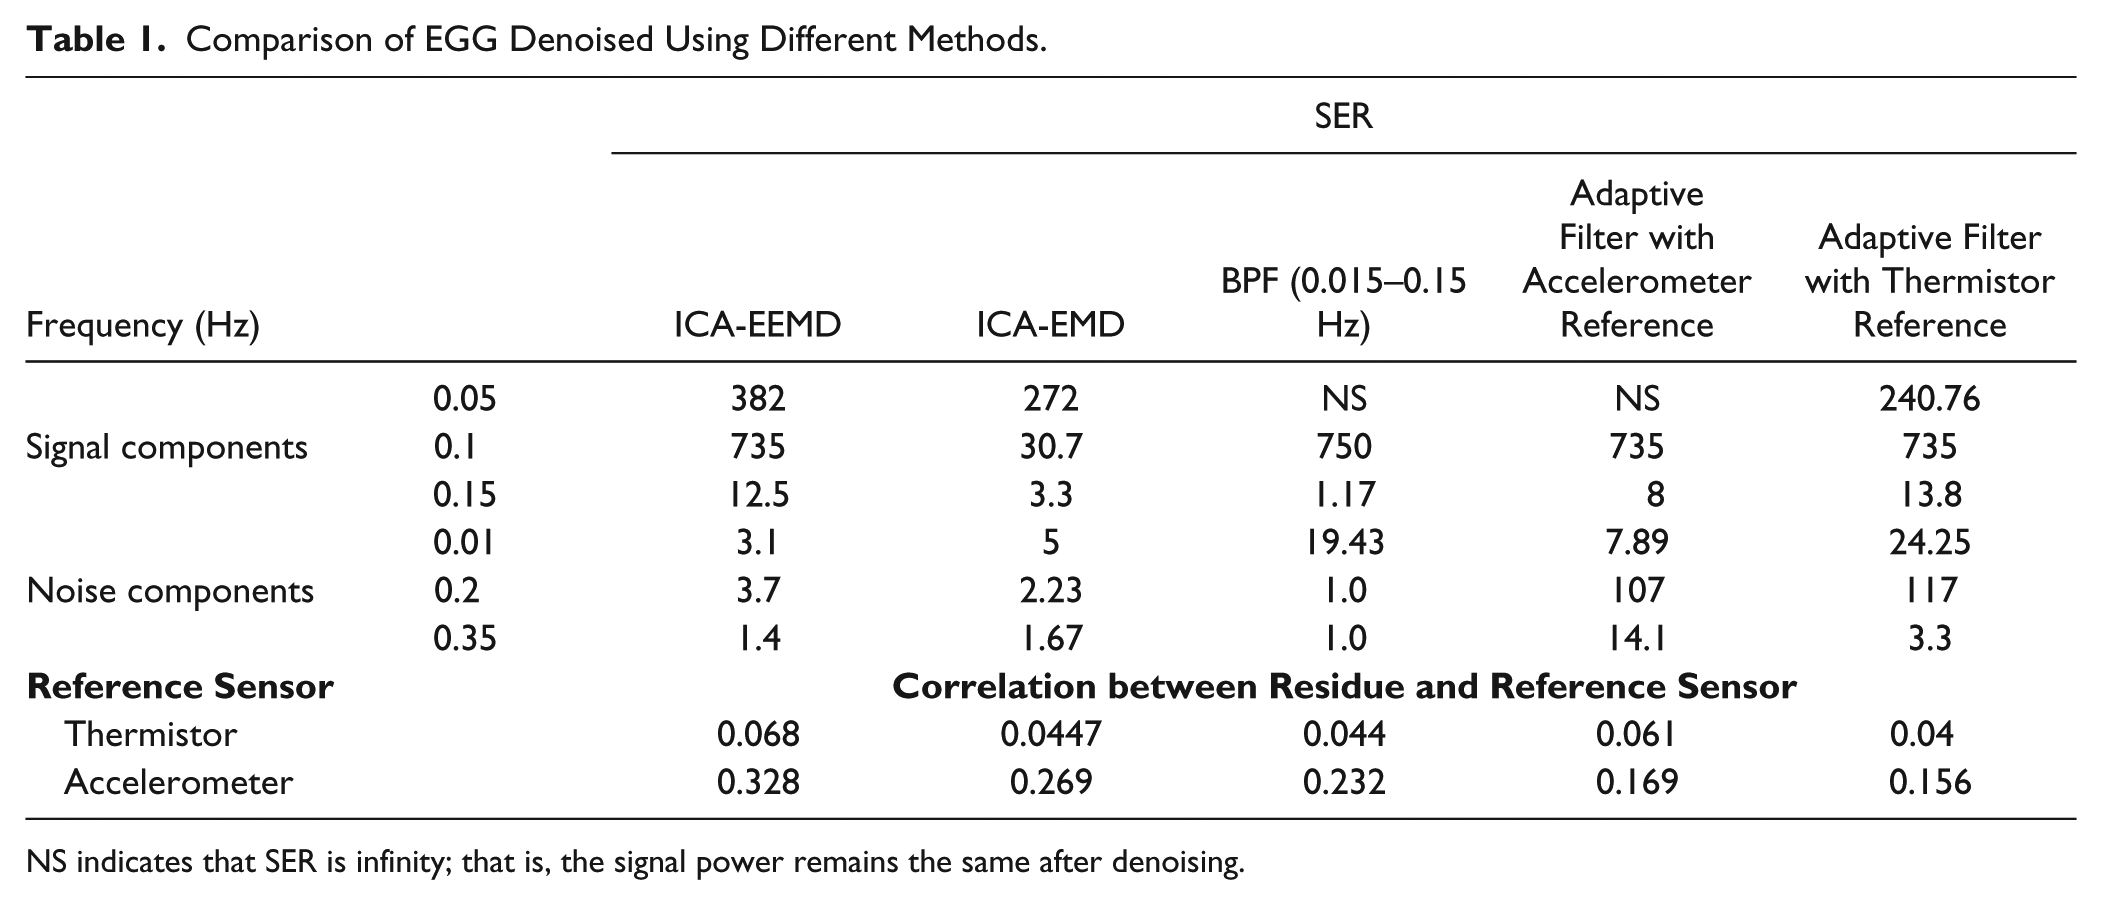
NS indicates that SER is infinity; that is, the signal power remains the same after denoising.
Similarly, the residues obtained by the EEMD method have relatively higher correlation (with p < 0.0005) with both reference sensors than those obtained by the other methods. The reason that ICA-EEMD shows slightly higher correlation (~33%) with the accelerometer sensor is probably because both motion artifacts and respiratory signals are recorded by the accelerometer, and the same are removed effectively by the EEMD technique, compared with other techniques. Even though the signals measured by the two reference sensors are used by both adaptive approaches, attenuation of these artifacts is not completely successful, as evidenced from poor correlation (and high SERs) at the frequency regime of the artifacts.
Investigation of the Distortions Introduced by the EMD Method in Denoising Slow Waves
It may be observed from Figure 5 that slow waves obtained using ICA-EEMD ( Fig. 5a ) are qualitatively clearer than those derived by its EMD counterpart ( Fig. 5b ) and are superposed on their corresponding raw EGG data for evaluation. Notice that some distortions are clearly visible in ICA-EMD denoised traces ( Fig. 5b ), especially at the ends of the signals, which makes them far different from those seen in ICA-EEMD in Figure 5a . It is evident that these distortions affect the proper quantification of slow waves in most of the channels. To name a few, one could compare slow-wave traces in the first row, second column, and the second row, third column of the 4 × 4 electrode matrix in Figure 5a , b . We have further examined these distortions by inspecting their corresponding IMFs and have confirmed that they are due to boundary effects, which are also verified on simulated EGG signals (not shown). These distortions are inherent and known to occur in the EMD technique. A nonlinear mixture of sinusoidal signals representing gastric slow waves (0.05 Hz), their harmonics (0.1 and 0.15 Hz), drifts (<0.01 Hz), and respiratory signals (0.2 and 0.3 Hz) is used to selectively retrieve the slow-wave components using both EMD and EEMD techniques. It has been found that an artificial increase in spectral power near the slow-wave components is observed in the EMD method, but it is much less than that extracted by the EEMD method.
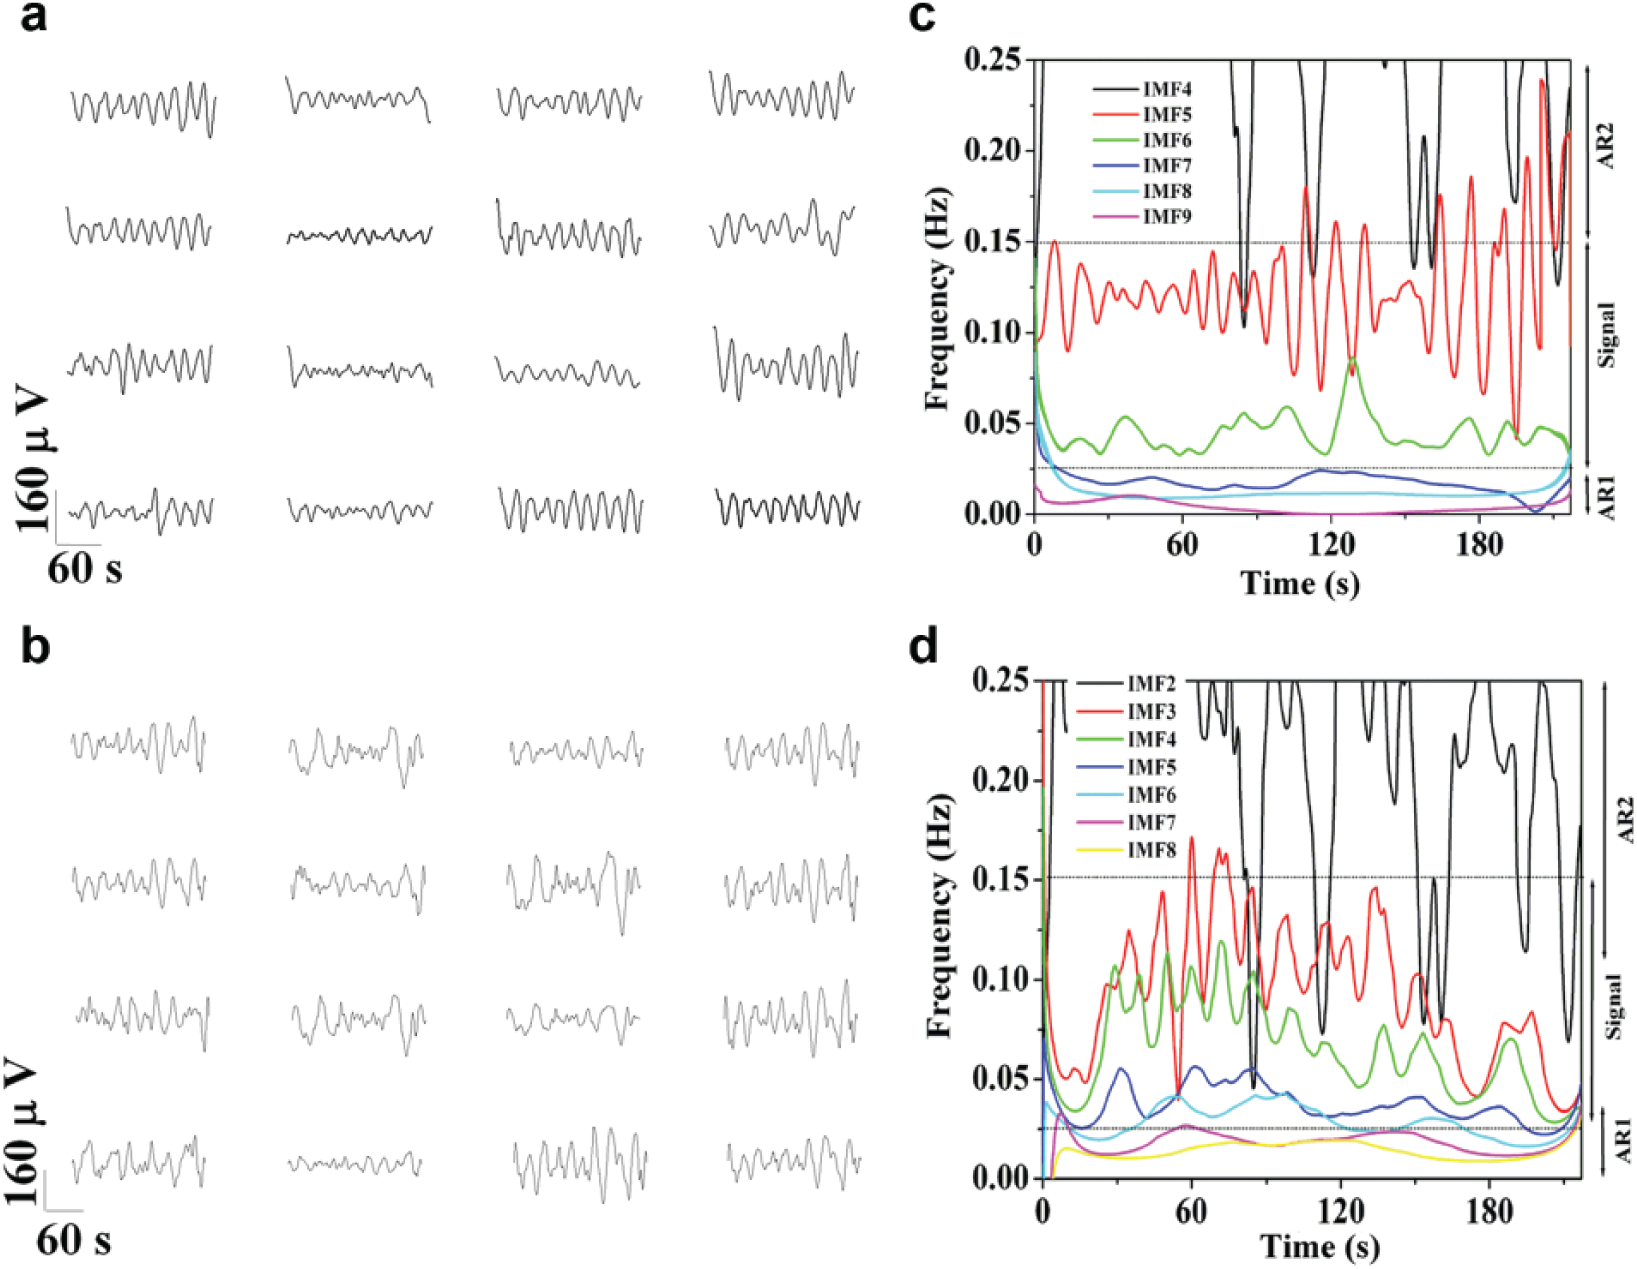
Gastric slow waves of 16 channels extracted by the (
In addition to this, the reason for the superiority of ICA-EEMD over ICA-EMD in denoising EGG signals is assessed with the help of IF plots. The IMFs obtained by EMD and EEMD decomposition over one of the ICs of 16 EGG channels are plotted in Figure 5c and d , respectively. IMFs of relevance to the present context, comprising frequency components pertaining to gastric slow-wave signals and artifacts obtained using both techniques, are shown. The trace color of the IMFs in EMD and EEMD in Figure 5c , d indicates an equivalent range of IFs captured by both techniques in decomposing the given raw EGG trace. These ranges of IFs in each IMF also implicate the high nonstationarity of the EGG signals. However, the IFs of the IMFs obtained using the EEMD technique show relatively less overlap in the frequencies of the gastric signals (in the frequency range 0.02–0.15 Hz) with those of the artifacts than with those obtained using the EMD technique. This ultimately facilitates a clear demarcation of the IFs into signal and artifact regimes (marked as signal and AR1 and AR2 regimes in Fig. 5c , d ). AR1 refers to drift or motion artifacts (frequency range below 0.02 Hz), and AR2 refers to respiratory signals and their harmonics (above 0.2 Hz). As can be observed in the figure, IMFs pertaining to gastric slow waves (IMFs 5 and 6, the red and green traces in Fig. 5c ) are better confined to the region between AR1 and AR2. Hence, gastric signal components could be completely retrieved (by selecting only IMFs 5 and 6), eliminating IMFs that fall in both AR1 and AR2. On the other hand, one may notice that the IMFs of the EMD technique show an overlap in the IFs of artifacts with those of the signal components. Hence, to extract gastric signals without appreciable loss, the IFs of IMFs that are known to contain artifacts also need to be included, which leads to improper denoising of gastric signals, as observed in Figure 5b . Clearly, this mode-mixing problem appears to be the main reason for poor performance of the EMD method in attenuating respiratory and very low-frequency drifts due to motion artifacts.
Hence, this analysis unequivocally demonstrates that both boundary effect and mode-mixing limitations of the EMD technique seriously affect the quality of the extracted slow-wave signals, and these distortions are less in the signals that are denoised by the EEMD method.
Measurement of Gastric Slow-Wave Parameters
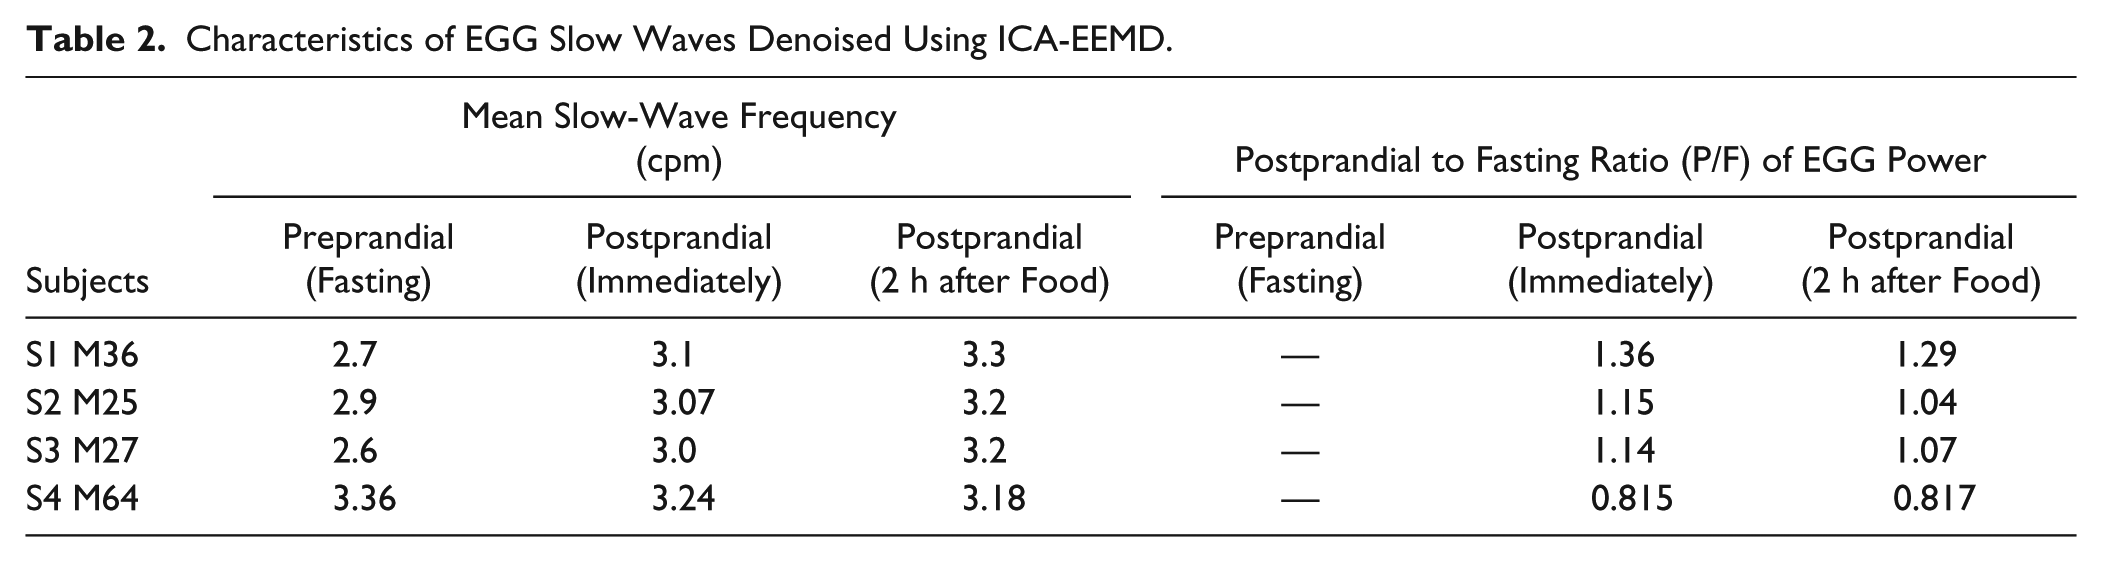
Having obtained clean gastric slow waves using the ICA-EEMD method for the multichannel EGG, we characterized the slow waves by measuring the dominant mean slow-wave frequency and postprandial-to-fasting EGG power ratio (P/F),1–3 both of which are tabulated in Table 2 . The mean dominant frequency refers to the average of the frequencies of the extracted slow waves in all 16 channels for each subject under each measurement condition. As seen in Table 2 , there is a progressive but marginal increase in the dominant frequency of gastric slow waves from the preprandial to the postprandial condition for all three healthy subjects (S1–S3 in Table 2 ), and such changes are not observed in the EGG measured from the subject with gastric disorder (S4 in Table 2 ). The P/F ratio, which qualifies normal gastric emptying, is found to be decreasing after 2 h for the three healthy subjects but relatively unchanged for subject 4, indicating delayed emptying.2,31 However, the association of P/F with the gastric dysfunction of subject 4 (S4 M64) is unknown and is beyond the scope of this study.
Characteristics of EGG Slow Waves Denoised Using ICA-EEMD.
Discussion
The proposed methodology of denoising only the ICs of a signal has already been demonstrated for cardiac signals, 21 and this work applies the same for gastrograms. Still, acquiring gastric signals and identifying them in the presence of artifacts is not straightforward, like in cardiac signals, where the features are evident most of the time. The proposed work differs from the conventional methodology1–7 of extracting gastric signals. Conventional acquisition of EGG4,12–14 uses a lower sampling rate of (e.g 3–4 Hz) which partly avoids cardiac artifacts to be measured along with gastric signals. In contrary, this work advocates acquiring EGG at a higher sampling rate of 1000 Hz, there by allowing all the features of the cardiac cycle. However, it is to be noted that since the prescribed 32 bandwidth for ECG is 0.01–100 Hz, sampling at a lower rate (e.g., 4 Hz) for measuring the EGG signals would still admit very low-frequency components (~0.01 Hz) of the cardiac cycle. It is often argued that cardiac artifacts in EGG measurements occur above 0.5 Hz (even for a very low heart rate, e.g., 30 beats per minute) and so could be easily removed in BPF and in the EMD method. It is to be noted that the beat-by-beat variations of the cardiac cycle comprise very low-frequency (<0.15 Hz) components due to autonomic activity, 33 which partly coincides with the frequency regime occupied by gastric signals and so it might be difficult to delineate them. Hence, admitting cardiac signals completely and ensuring that the P-wave, QRS, and T-wave features are totally eliminated (by isolating the baseline envelope using a wavelet-based technique) before downsampling (for computational ease) is felt to be a reasonable approach in this work to extract EGG signals. Successful extraction of good-quality slow waves, as shown in Figures 4 and 5 , may be partly attributed to the algorithmic sequence employed in this work for processing the measured EGG signals. Recently, a similar approach of isolating the baseline envelope of the R wave of ECG signals for the purpose of removing the respiratory signals from EGG using adaptive filters has been reported. 34 It is to be noted that the degree of influence of the respiratory signals over the electrodes on the thoracic surface is estimated to be different during each breathing cycle but occurring in a synchronous manner. 16 This precludes the usage of signal processing algorithms like ICA and adaptive filters, since both are not suited for removing artifacts that mix in a nonlinear manner, especially respiratory artifacts. Hence, the usage of a single reference channel13,14 to denoise artifacts in each of the measurement channels requires extensive evaluation. It stands to reason that adaptive filters are not able to remove the artifacts completely, as shown in Table 1 . The proposed method, on the other hand, isolates these baseline envelopes and separates breathing and gastric components using EMD and EEMD techniques, which are known to handle nonlinear mixtures of signals. The proposed method is also computationally efficient for processing multichannel EGG data since the EMD/EEMD algorithm is required to be applied to a few ICs (typically six) only, and not to each of the 16 channel data, and further, the data length is substantially reduced by downsampling. Because the time taken for generating IMFs in EMD- and EEMD-based methods is a matter of concern,26,27 the usage of EMD/EEMD with fewer samples of data makes the proposed methodology ideally suited for the extraction of gastric slow-wave signals.
The central point of investigation in this work is to highlight the ability of the ICA-EEMD and ICA-EMD methods for denoising multichannel EGG in comparison with the most straightforward approach of bandpass filtering of the EGG signals. 1 Evaluating the performance of the BPF is obviously dependent on the selected passband of the filter. The passband used in this work, that is, 0.015–0.15 Hz, is the most employed frequency range.1–4,18 It can be easily noticed that artifacts occurring below 0.02 Hz (associated with drifts or body movements 29 ), which fall within this passband of the BPF, could be attenuated by the EEMD method, as seen in Figure 4 and Table 1 . Both the EMD and EEMD methods use selective attenuation of artifacts with prior knowledge (by looking at their IFs in IMFs) of each artifact. Contrary to this strategy of targeting only the artifacts, the BPF assumes a frequency window to selectively admit the signal components without any knowledge of the artifacts. The distortions introduced by improper selection of passbands and the errors introduced by the filtering process have been corroborated with invasively measured slow waves using serosal electrodes.18,29 Reports emphasizing the need to explore the possibilities of quantifying gastric signals outside the conventional frequency regime also exist.3,34 Both EMD and EEMD act as tunable filters to achieve the best passband to discriminate artifact and signal regimes with minimum leakage of spectral powers (with adjacent IMFs), as shown in Figure 5 . Among the two techniques, EEMD surpasses EMD with less mode mixing and end effect distortions. It is possible that the poor performance of EMD is attributed to the leakage of spectral power in different IMFs (or frequency bands), leading to ineffective artifact elimination, 35 as clearly observed in Figures 4 and 5 and Table 1 . A detailed investigation of the effect of these distortions on gastric signals has not been reported earlier.
The correlation measure endorses the fact that no signal components are distorted and the residues of EEMD are true specimens of low-frequency motion drifts and respiratory signals. This could be taken as a figure of merit to signify the efficacy of the EEMD method.
In the absence of any experimental validation of the gastric slow-wave signals with those measured invasively (which are not justifiable for healthy subjects), the consistency of the extracted gastric slow waves in exhibiting the expected changes in the power and frequency observed across the measurement conditions tabulated in Table 2 lends credence to the denoised signals as genuine gastric slow waves and is in agreement with that reported in earlier studies.2,3,31 The present report particularly points to the suitability of an algorithm in efficiently retrieving gastric slow waves and their harmonics compared with conventional approaches. Translating this for clinical usage, the methodology obviously invites extensive validation and refinement by testing it on a variety of gastric conditions on a wide group of subjects fulfilling all the necessary physiological requirements of a typical clinical EGG recording. In such cases, some modifications in the proposed methodology might be essential, for example, in selecting the IMFs of EEMD decomposition. Better quantification of slow waves using these denoising approaches would facilitate comparative studies on EGG slow waves in a variety of gastric dysfunctions and has implications on gastric emptying as a basic first-level diagnostic assessment in gastroenterology—quite similar to the ECG, which is inevitable in cardioelectrophysiological diagnosis.
Conclusion
In summary, the suitability of the proposed combined methodology has been logically justified in specifically combating cardiac, breathing, and drift artifacts in each signal processing step in denoising the gastric signals. Compared with BPF, adaptive filters, and EMD, the EEMD-based method is more suitable for denoising EGG slow-wave signals and their harmonics. All the methods have been extensively tested under three gastric conditions on a few subjects for selective removal of artifacts without causing any distortion. The method therefore shows promise to be directly useful for individual EGG channels, and may be combined with ICA for multichannel acquisitions. It has also been demonstrated to deliver useful clinical information on the denoised signals. It is expected that the proposed method could lead to better quantification and interpretation of slow waves to be employed in clinical assessments.
Footnotes
Acknowledgements
The authors would like to thank Mr. Vikas R. Bhat for his valuable assistance during the experimental recording and analysis of the EGG data. It is a pleasure to thank our colleagues Mr. R. Baskaran, Dr. N. V. Chandra Shekar, and Dr. G. Amarendra for encouragement and support. The authors would also like to thank Mr. M. P. Janawadkar, former director, Materials Science Group, IGCAR, and Dr. T. S. Radhakrishnan, former DST-sponsored scientist, IGCAR, for their support and suggestions for refining the article. Dr. P. Bhattacharjee, medical superintendent, DAE Hospital, Kalpakkam, India, is acknowledged for his guidance in interpreting the signals.
Declaration of Conflicting Interests
The authors declared no potential conflicts of interest with respect to the research, authorship, and/or publication of this article.
Funding
The authors received no financial support for the research, authorship, and/or publication of this article.