
Abstract
To understand women’s and men’s physiological ranges of liver T1rho relaxation time measured with a single breathhold black blood sequence, this healthy volunteer study was conducted in 62 women (mean age, 38.9 y; range, 18–75 y) and 34 men (mean age, 44.7 y; range, 24–80 y). Approval from the institutional ethics committee was obtained. Magnetic resonance imaging was performed with a 3.0T scanner with six spin-lock times of 0, 10, 20, 25, 35, and 50 ms and a single breathhold of 12 s per slice acquisition. Six slices were acquired for each examination. The results demonstrated that the female liver T1rho value ranged between 35.07 and 51.97 ms and showed an age-dependent decrease, with younger women having a higher measurement. The male liver T1rho value ranged between 34.94 and 43.39 ms, with no evidential age dependence. Postmenopausal women had similar liver T1rho values as men. For women, there was a trend that the liver T1rho value could be 4% to 5% lower during the menstrual phase than during the nonmenstrual phase. For both women and men, no evidential association was seen between body mass index and liver T1rho.
Chronic liver disease is a major public health problem worldwide.1–3 The epidemic trend of chronic liver disease is expected to increase owing to an aging population, the growing epidemic of obesity, and nonalcoholic steatohepatitis (NASH). Liver biopsy remains the standard of reference for the diagnosis and staging of liver fibrosis. However, it is an invasive procedure with potential complications. Both animal experiments and clinical studies have revealed that liver fibrosis, even early cirrhosis, is reversible. Treatment with combined therapies on underlying etiology and fibrosis simultaneously might expedite the regression of liver fibrosis and promote liver regeneration.4,5 Earlier stage liver fibrosis is more amenable to therapeutic intervention. Even when the underlying etiology of liver fibrosis could not be eradicated, therapies on liver fibrosis might help restrict the disease progression to cirrhosis. A noninvasive, objective, and quantitative technique for assessing liver fibrosis and monitoring disease progression or therapeutic intervention is therefore highly desirable. The spin-lock radiofrequency (RF) pulse used in T1rho imaging introduces the sensitivity to the chemical exchange effect, which makes it feasible to use T1rho to probe the macromolecular environment of human tissue.6,7 Wang et al. 8 and Zhao et al. 9 described T1rho magnetic resonance imaging (MRI) for assessing rat liver fibrosis models caused by biliary duct ligation and carbon tetrachloride intoxication, suggesting an increased T1rho value is associated with collagen deposition in the fibrotic liver but less so with edema. Studies in human subjects, both in healthy volunteers and liver fibrosis patients, have since been reported.10–19 With a two-dimensional (2D) fast gradient echo sequence, Deng et al. 10 and Zhao et al.11,12 reported that the mean T1rho value was 42.8 ± 2.1 ms (B0 = 3T, B1 = 500 Hz) in healthy volunteers. Allkemper et al. 14 reported that the normal liver T1rho value was 40.9 ± 2.9 ms (B0 = 1.5T, B1 = 500 Hz) and the elevated liver T1rho measurement was significantly associated with the Child-Pugh staging of the patients. In patients with chronic liver diseases, Takayama et al. 16 demonstrated that the liver T1rho value showed significant positive correlations with the serum levels of total bilirubin, direct bilirubin, and indocyanine green (ICG-R15) and significant negative correlations with the serum levels of albumin and γ-glutamyl transpeptidase. Recently, Xie et al. 19 reported that fatty liver did not affect the diagnostic performance of T1rho for detecting liver fibrosis and suggested an upper limit of 49.5 ms for nonfibrotic livers.
To overcome the artifacts associated with respiration motion during T1rho image acquisition, Chen et al.20,21 proposed a 2D black blood T1rho MR relaxometry technique for liver imaging. The black blood effect of 2D fast spin echo (FSE) sequence and double inversion recovery were used to achieve blood signal suppression. In a pilot volunteer study, Wáng et al. 22 demonstrated that compared with multiple breathhold bright blood signal technique, this new sequence reduces image artifacts, improves image quality, and improves scan-rescan reproducibility, with promise for clinical application. Using this single breathhold black blood sequence, the current study aims to understand the physiological ranges of liver T1rho relaxation for women and men. This knowledge is critically important for developing T1rho as an imaging biomarker for liver tissue composition or liver function.
Materials and Methods
This volunteer study was conducted with the approval of the institutional ethics committee, and informed consents were obtained. One hundred healthy volunteers without known history of liver diseases were recruited from the local community. During the course of this study, the decision was made to recruit more women than men, as women show greater individual variations. 22 Two obese participants, with 1 subject having a body mass index (BMI) of 33.8 kg/m2 and another subject having a weight of 99 kg, failed the examination. The T1rho value measurement could not be performed precisely in 1 participant because of multiple cysts in the liver. MRI showed another subject had liver solid tumor, but the subject was lost to follow-up and therefore excluded from the final analysis. Finally, there were 96 volunteer participants, including 62 women (mean age, 38.9 y; range, 18–75 y) and 34 men (mean age, 44.7 y; range, 24–80 y).
All participants underwent standard T1-weighted and T2-weighted liver anatomic imaging and single-breathhold black blood FSE liver T1rho imaging21,22 using a Philips Achieva TX 3.0T scanner equipped with dual transmitter (Philips Healthcare, Best, the Netherlands). The subjects were scanned in supine position. A 32 channel cardiac coil (Invivo Corp, Gainesville, FL) was used as the receiver, and the body coil was used as the transmitter. For T1rho imaging, 2D axial images were acquired with phase encoding along the anterior-posterior direction. RF shimming focused on the right liver was applied to reduce B0 inhomogeneity ( Fig. 1 ). An RF pulse cluster that can achieve simultaneous compensation of B1 RF and B0 field inhomogeneity was used for T1rho preparation. 23 The parameters for MRI included TR/TE 2000/20 ms, in-plane resolution 1.5 mm × 1.5 mm, slice thickness 7 mm, SENSE acceleration factor 2, half scan factor (partial Fourier) 0.6, number of signal averaging 1, delay time for spectral attenuated inversion recovery 250 ms, delay time for double inversion recovery 650 ms, and spin-lock frequency 500 Hz. T1rho images with 6 spin lock times (TSLs) of 0, 10, 20, 25, 35, and 50 ms were acquired, with a single breathhold of 12 s for data acquisition. Six slices were acquired for each examination, and the slice position was based on axial anatomic imaging with the aim of covering a large portion of the right liver parenchyma. Breathhold was trained for the volunteers before the scan started, as a good breathhold is essential to obtain high-quality T1rho map ( Suppl. Document 1 ). The total scan duration for T1rho imaging was approximately 5 min, inclusive of the resting time allowed between each slice acquisition.
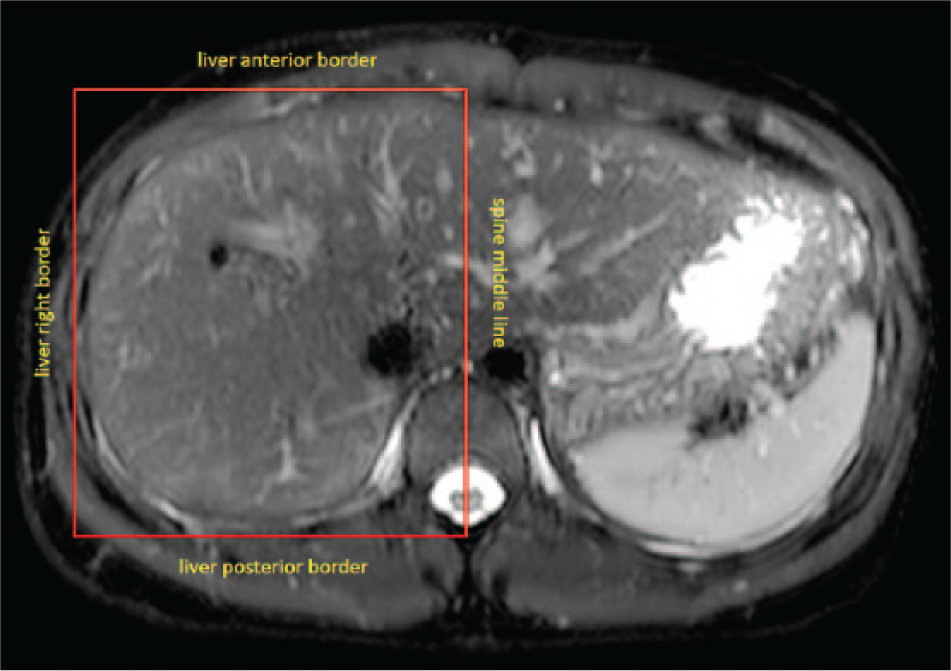
A shimming box placed on the T2-weighted image. This shimming box for the right liver is defined by the spine middle line and anterior, posterior, and right liver borders.
All images were processed using Matlab R2015a (Mathworks, Natick, MA). T1rho maps were computed by using a monoexponential decay model, as described by the following equation: M (TSL) = A · exp(–TSL/T1 rho), where A is a constant scaling factor and TSL is the time of spin lock. Nonlinear least square fit with the Levenberg-Marquardt algorithm was applied. Maps of coefficient of determination (R2) were also generated for the evaluation of goodness of fit. Only T1rho values for pixels associated with R2 > 0.80 were included in the subsequent region of interest (ROI) placement and T1rho analysis to eliminate the unreliable poorly fitted T1rho values due to artifacts.10,11 With the aim of standardizing measurement, a histogram protocol was used. Histogram was plotted using a fixed number of bins, with the center of the bins located from 30 ms to 70 ms, with 2 ms increments. The first bin included T1rho between 0 and the first center (30 ms), and the last bin included T1rho between the last center (70 ms) and infinite. The mean of the T1rho value of the pixels corresponding to the highest three or four bars so to include >80% of pixels within the selected ROI was taken as the liver T1rho reading ( Fig. 2 ; Suppl. Figs. S1 and S2 ). It was shown that the histogram approach and ROI approach provided similar measurements. 12
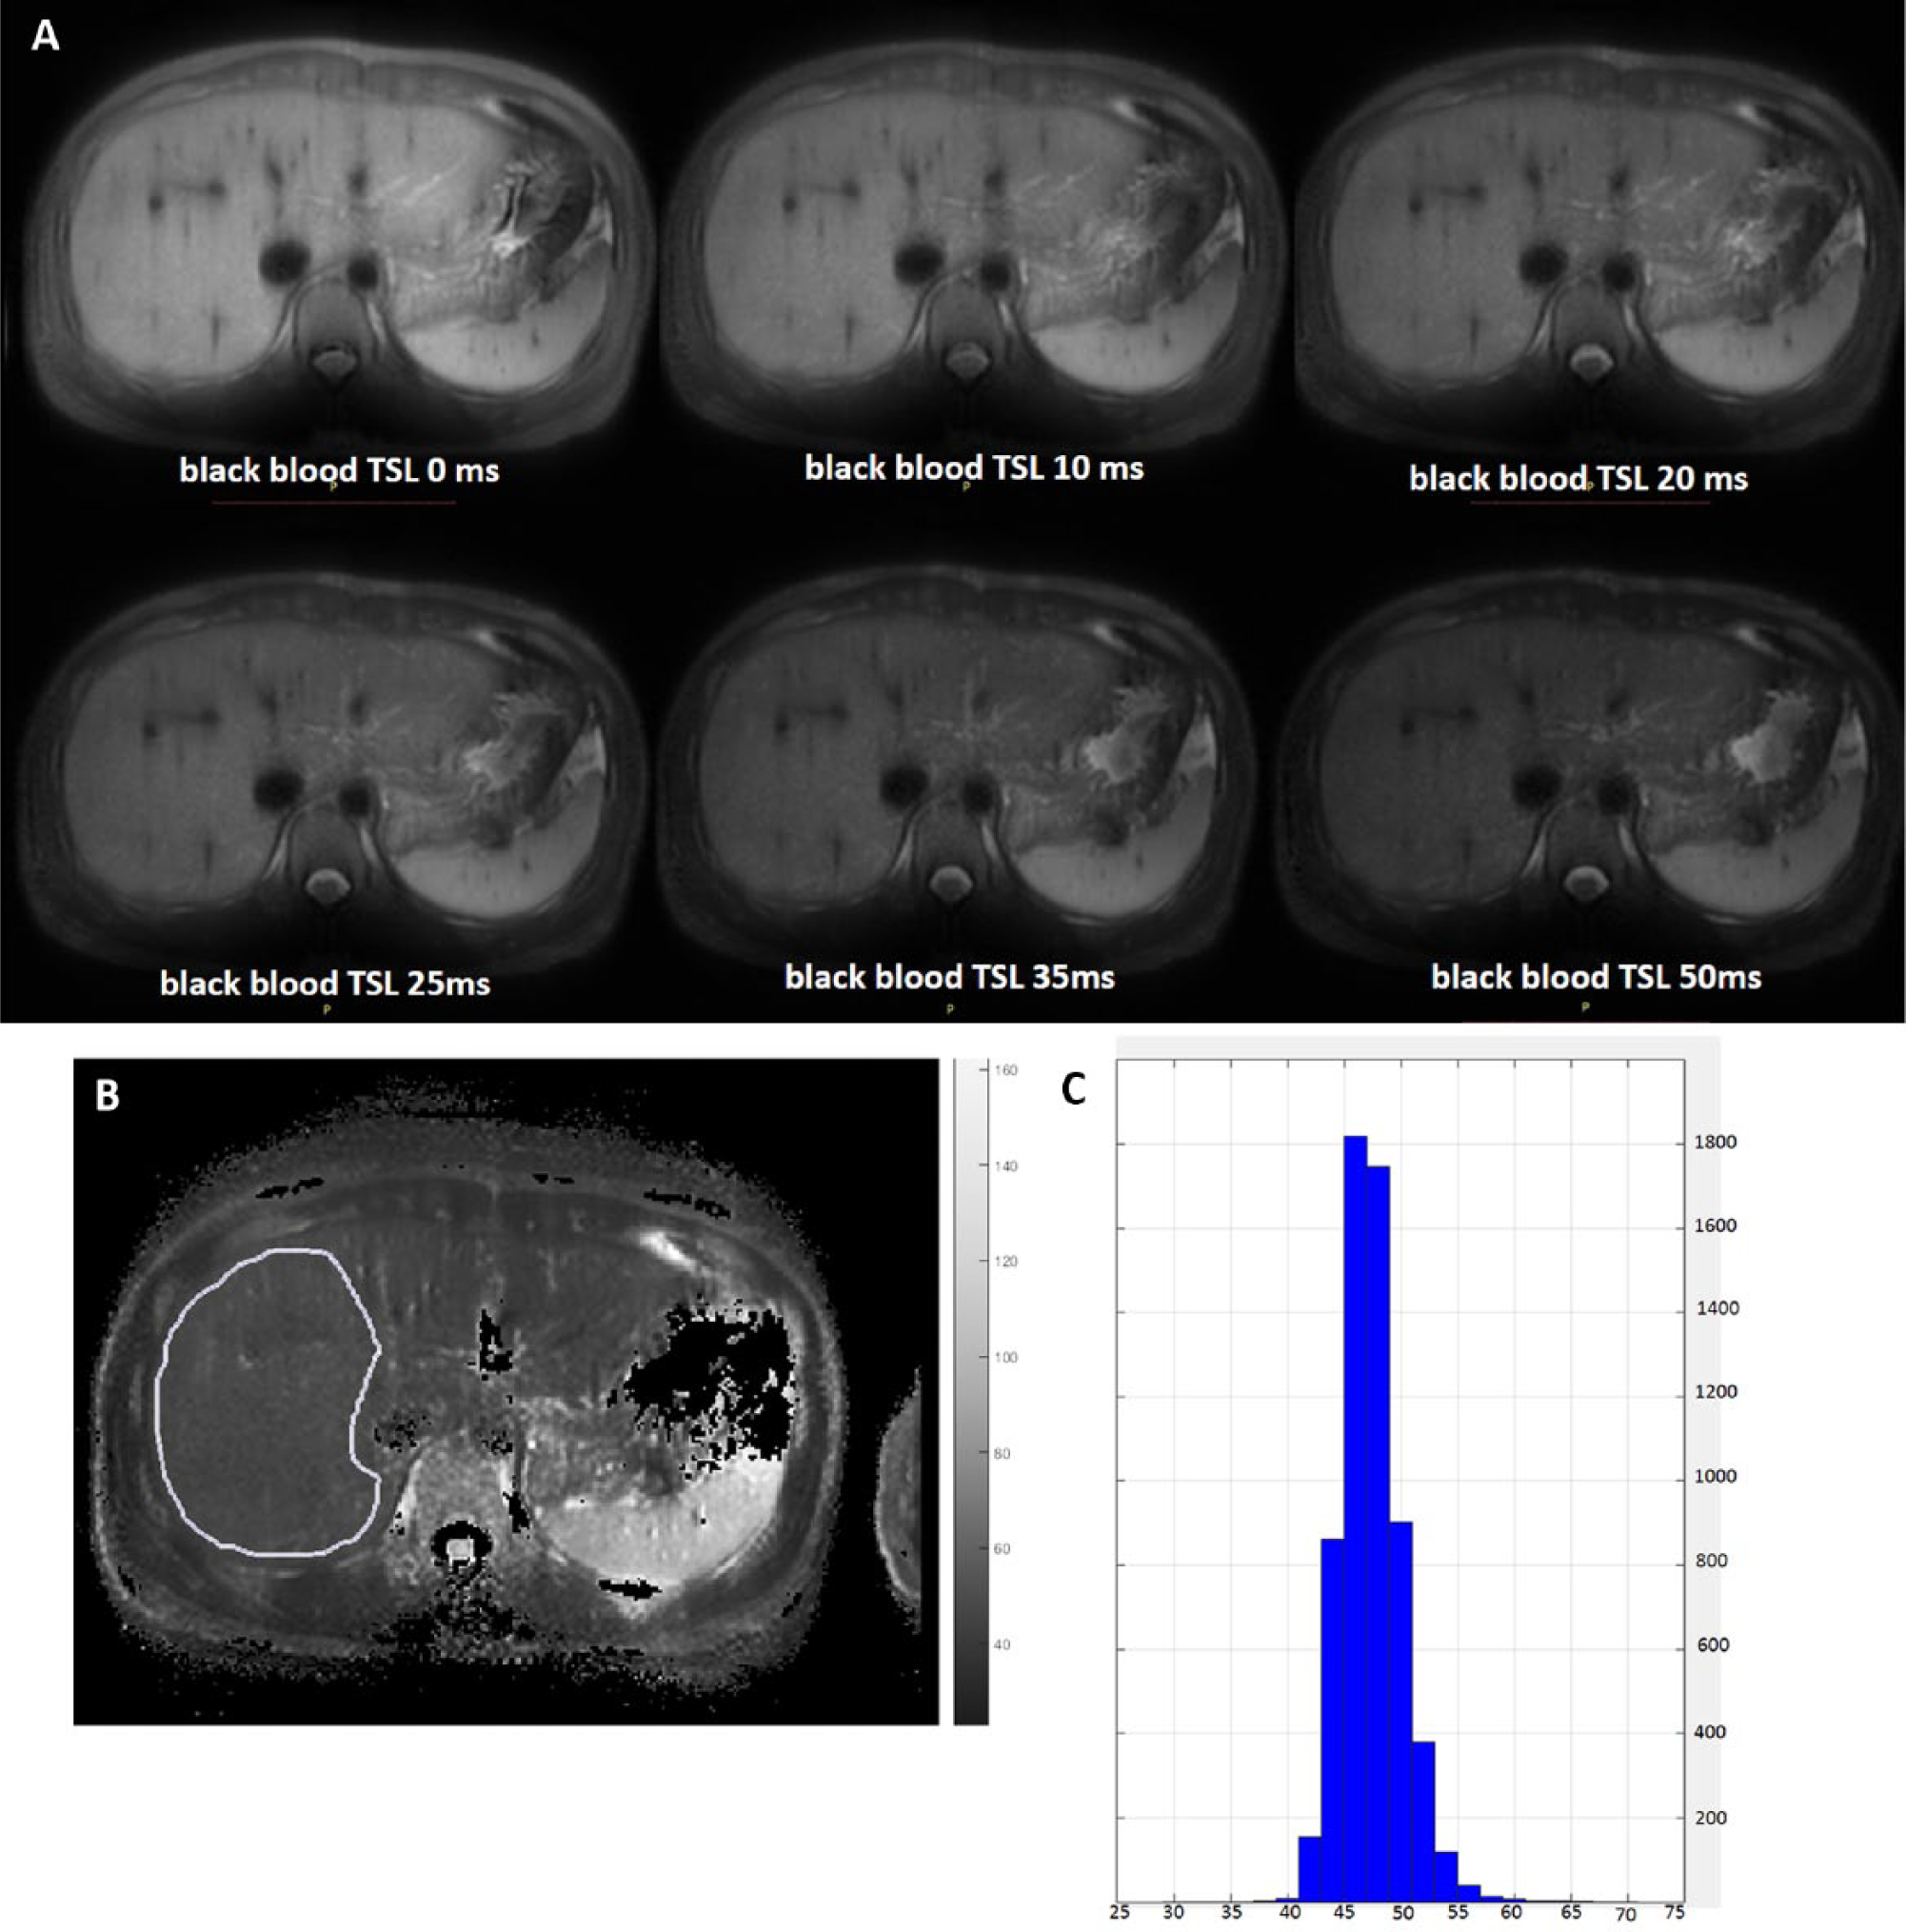
Liver T1rho measurement process. (
During the course of this study, the decision was made to include BMI information as well as menstrual cycle information for women. BMI information was obtained in 51 female participants and 24 male participants. The menstrual cycle information was obtained in 37 female participants. In addition, five women were scanned twice, at the menstrual phase and at the second half of the nonmenstrual phase, to investigate the menstrual cycle’s impact on liver T1rho. Our pilot study showed that the impact of meals on liver T1rho values was minimal (subject 1: 41.23 vs 41.02 ms; subject 2: 38.96 vs 38.75 ms; subject 3: 43.94 vs 43.27 ms, for fasted and postprandial scans, respectively), and therefore, this point was not further investigated in this study ( Suppl. Document 2 ). Liver T1rho values in men and women were separately analyzed.
An abdominal radiologist with more than 15 y of experience read all the standard anatomic T1-weighted and T2-weighted fat-suppressed images. Incidental findings in the liver and biliary system included the following: liver cysts in 30 participants, liver hemangioma (or cysts) in two participants, gallbladder adenomyosis in three participants, biliary stone in four participants, cholecystitis (thickened gallbladder wall) in one participant, biliary hamartoma in one participant, and small lymph node seen in the porta hilar in one participant. These incidental findings, as well as other incidental findings in the pancreas, spleen, and kidneys, were communicated to the participants. Further follow-ups or other examinations such as ultrasound were recommended when appropriate.
Results
Physiological liver T1rho values are shown in
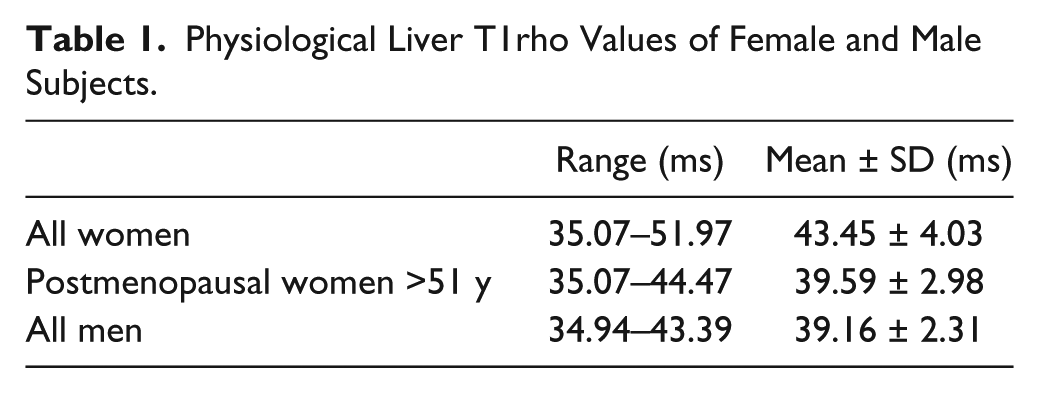
Table 1
and
Figures 3
Physiological Liver T1rho Values of Female and Male Subjects.
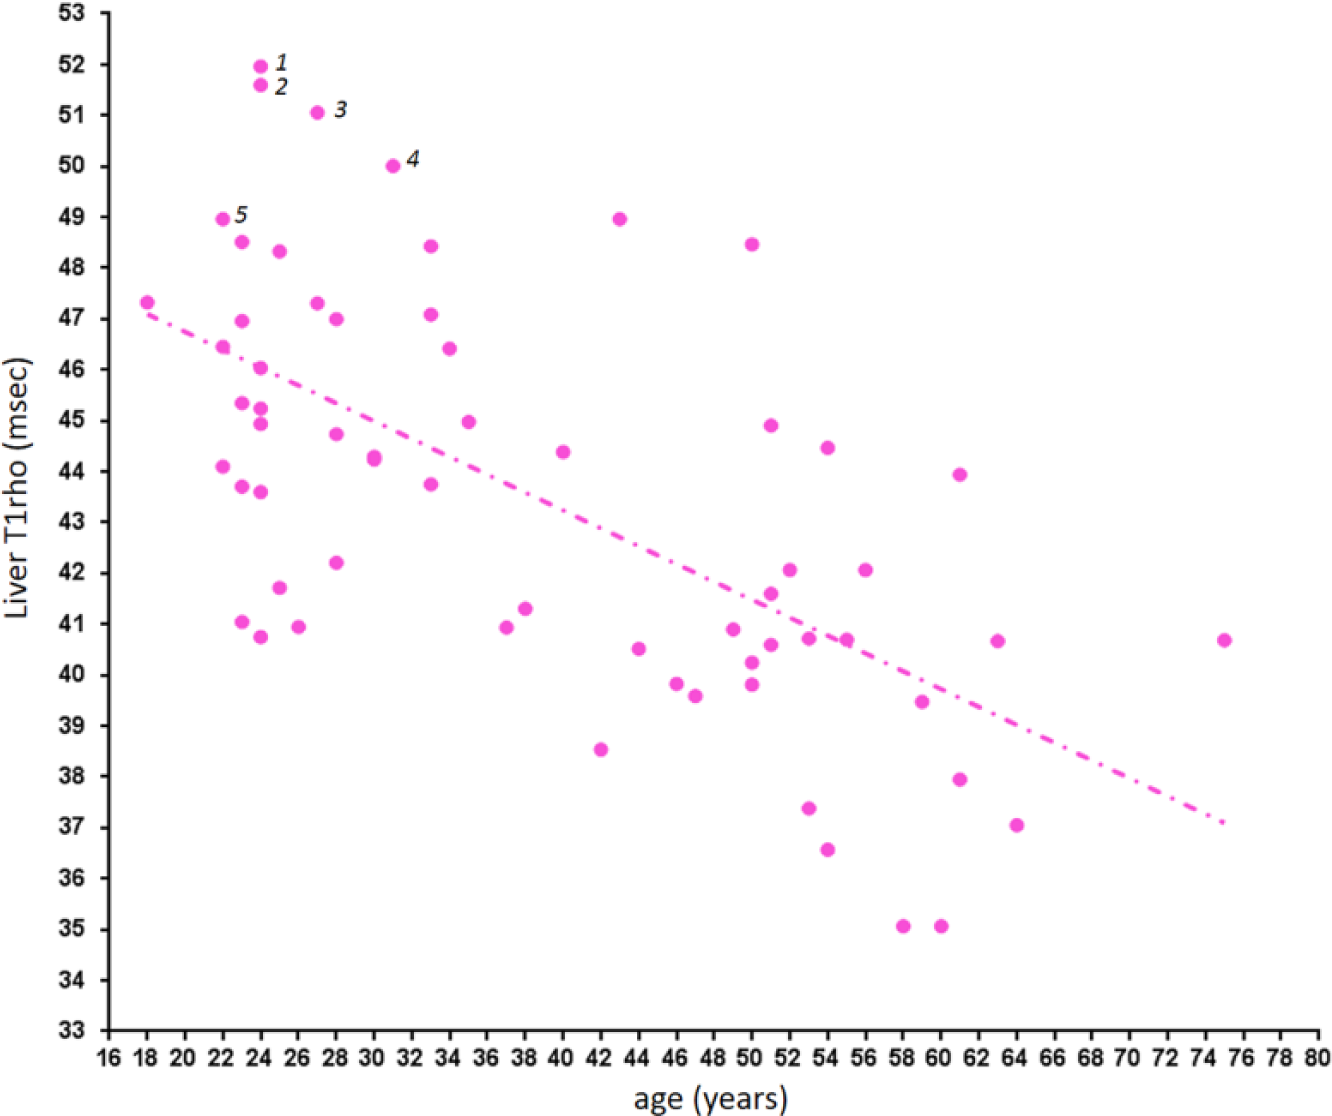
Liver T1rho in female subjects. An age-dependent decrease is noted. Cases 1 and 3: blood liver function and viral hepatitis b antigen tested negative; cases 2 and 4: blood liver function, viral hepatitis b antigen, and viral hepatitis c antibody tested negative; case 5: blood viral hepatitis b antigen tested negative.
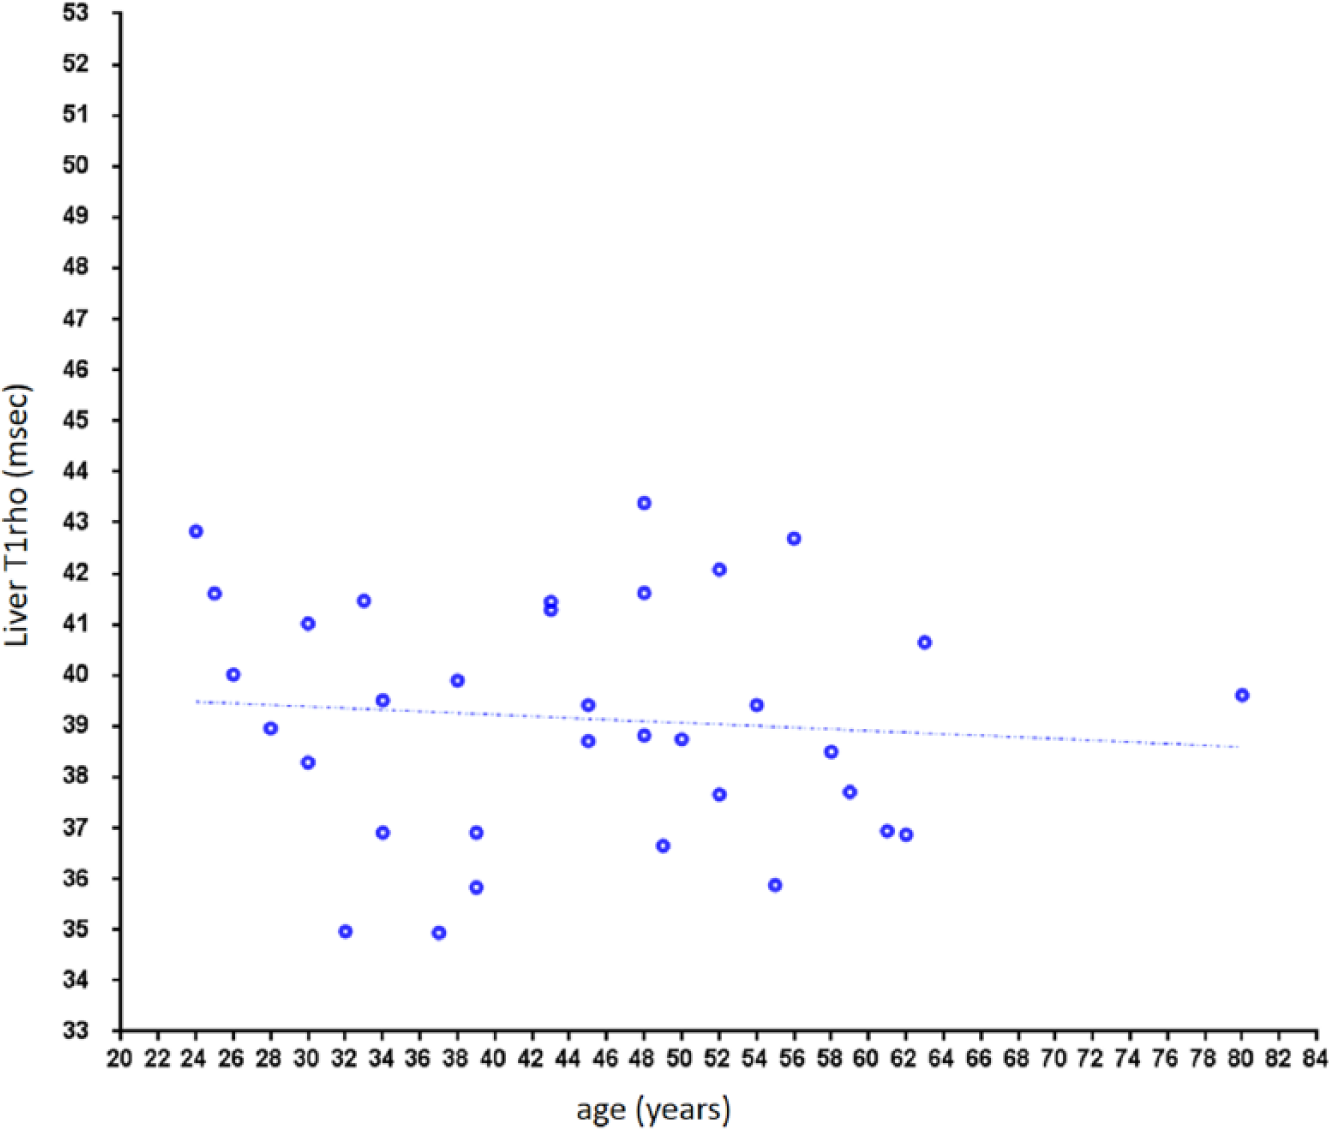
Liver T1rho in male subjects. No notable age dependency is observed.
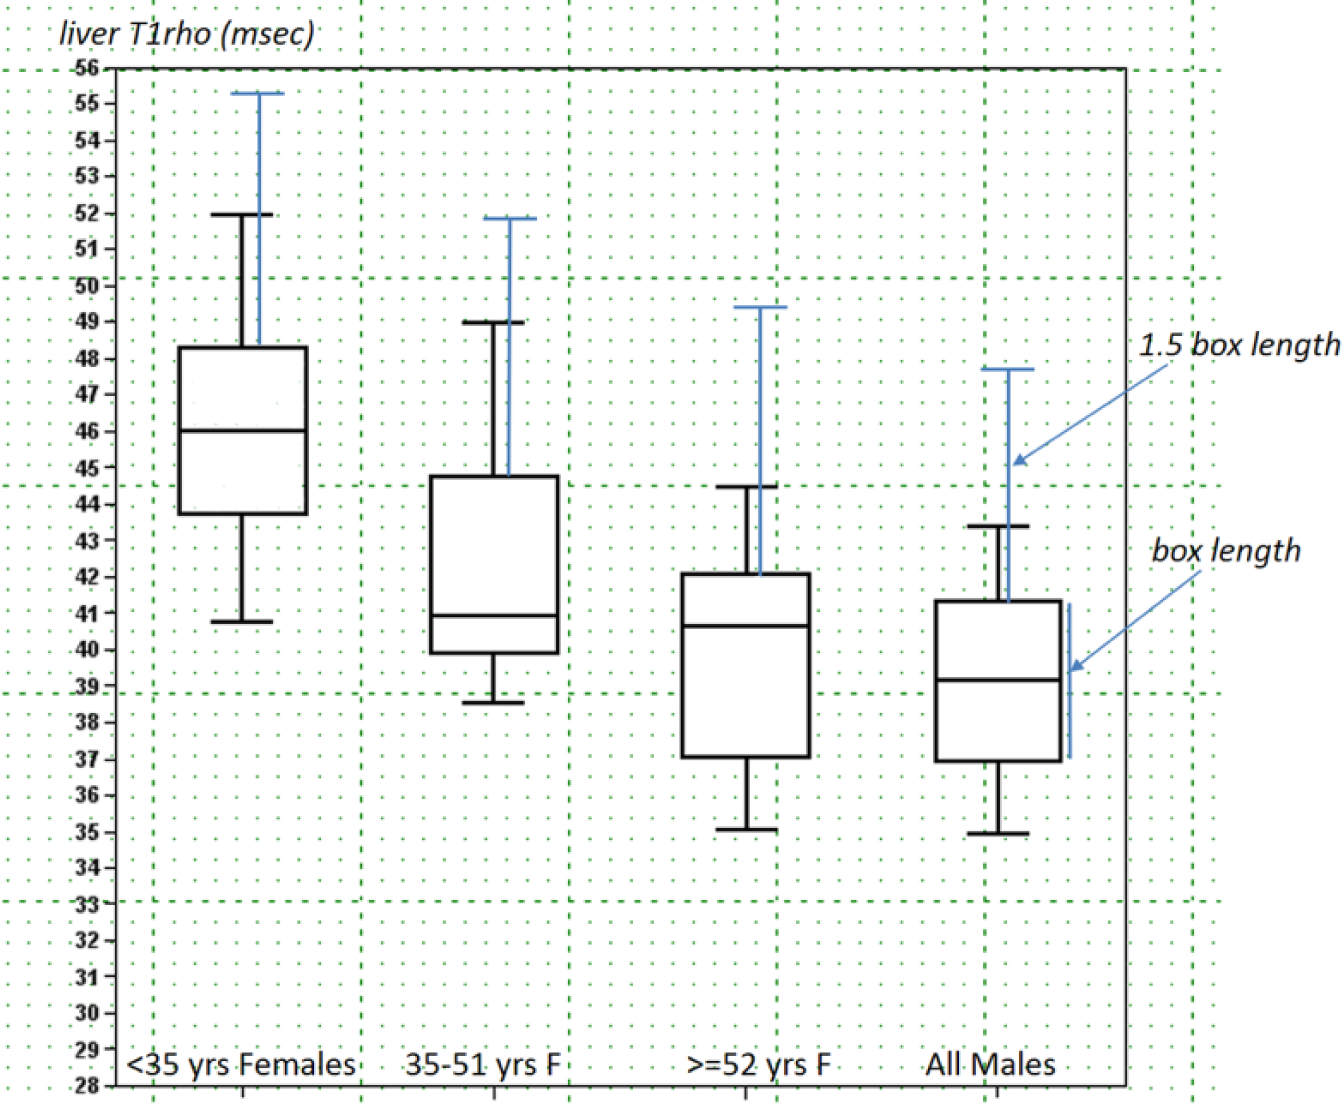
Box-whisker plots of liver T1rho of three female age groups of <35 y, 35 to 51 y, and ≥52 y, and men of all ages. The 1.5 box length defined upper limits are denoted in blue lines ( Suppl. Document 3 ).
The menstrual cycle of 37 female participants was recorded. Thirty-six participants were in the nonmenstrual phase, with the mean liver T1rho value being 45.69 ± 3.64 ms. Eleven participants were in the menstrual phase, with the mean liver T1rho value being 43.53 ± 3.49 ms (4.7% lower than subjects in the menstrual phase, p = 0.053 for t test). For the five subjects scanned at the menstrual phase and the second half of the nonmenstrual phase, liver T1rho was 42.74 ± 4.31 ms and 44.52 ± 2.36 ms, respectively, with the menstrual phase being 4.2% lower (p = 0.07 for t test, Wilcoxon signed-ranks test p = 0.14).
The relationship between liver T1rho and BMI is shown in Figure 6 . For both women and men, no evidential association was seen between liver T1rho and BMI.
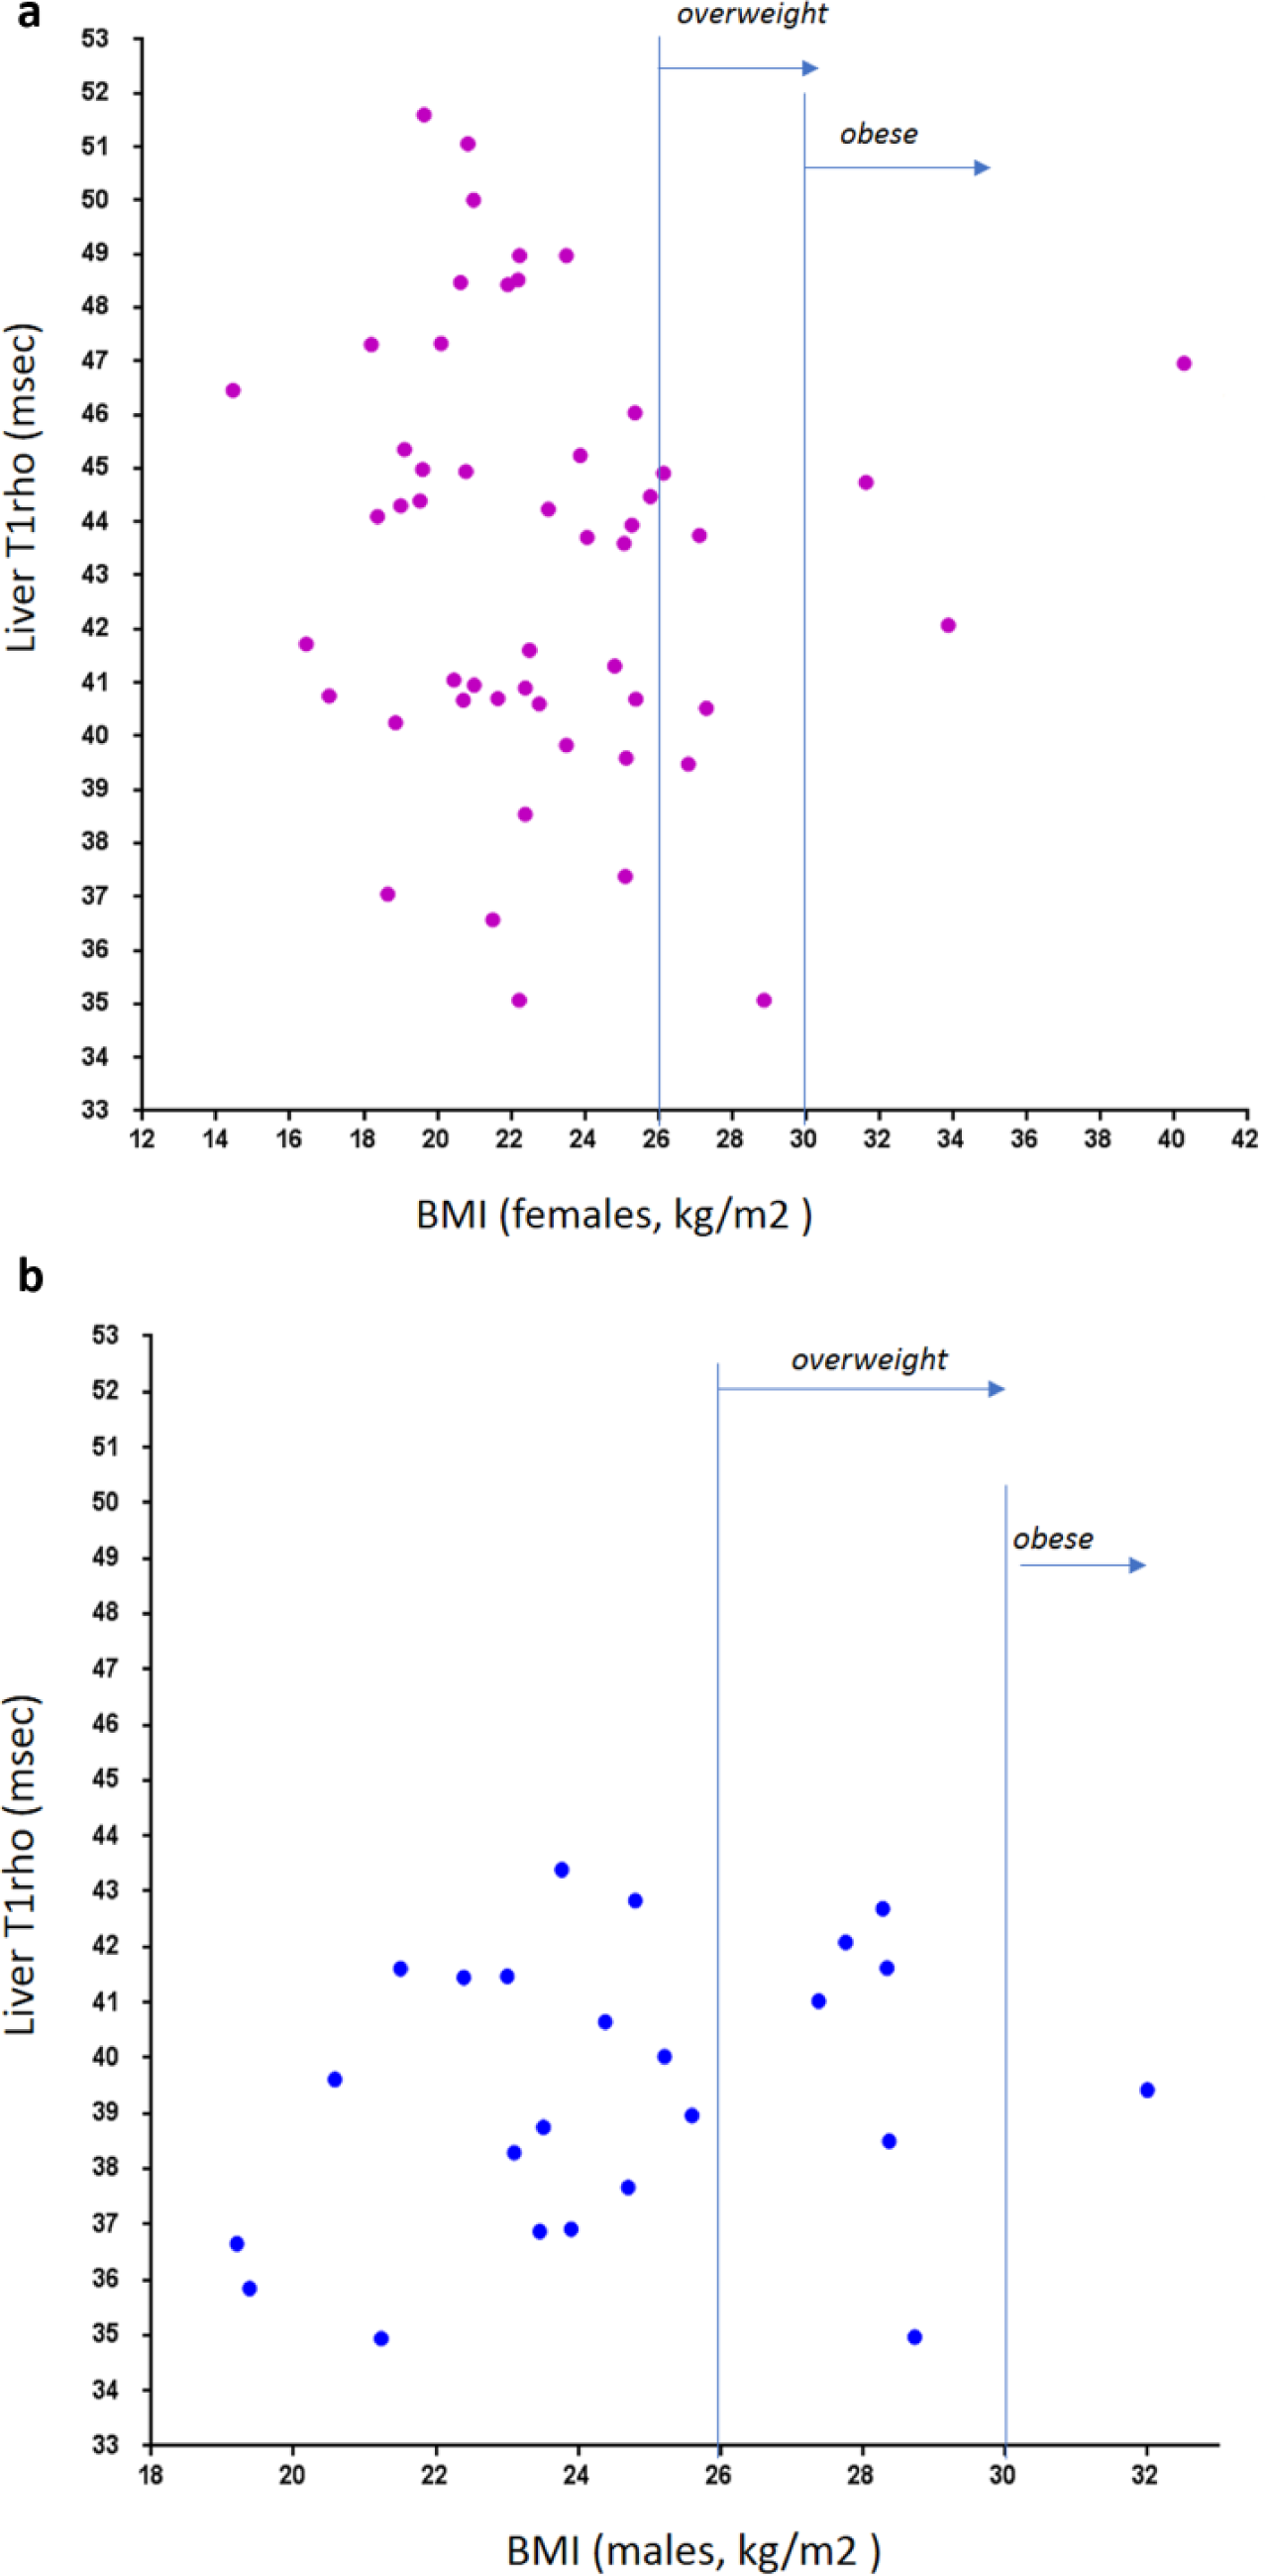
Relationship between liver T1rho and body mass index (BMI). (
Discussion
T1rho has the potential to be a sensitive marker of liver diseases. This has been indicated in earlier animal studies.8,9,24 In a recently study, Koon et al. 25 reported on day 10 after biliary duct ligation that all experimental animals could be separated from normal liver based on T1rho measurement, when liver histology resembled early-stage fibrosis, and the fibrous area counted for 0.38% ± 0.44% of the liver parenchyma area. Liver T1rho may also be used as marker of liver function, as demonstrated by Allkemper et al. 14 and Takayama et al. 16 With a gradient echo bright blood–based sequence, Xie et al. 19 recently suggested the upper limit of physiological T1rho measurement may be 49.5 ms in humans. However, until now, the physiological range of liver T1rho has not been systematically studied.
The advantages of the single-breathhold black blood FSE–based sequence for liver parenchyma T1rho imaging have been reported. 22 The Bland-Altman plot showed that the intrascan repeatability mean difference was 0.025 ms, with 95% limits of agreement of −1.16 ms to 1.21 ms; the associated intraclass correlation coefficient (ICC) was 0.98. The interscan reproducibility mean difference was −0.08 ms with 95% limits of agreement of −3.28 ms to 3.31 ms; the associated ICC was 0.82. 22 Compared with the multiple breathhold approach, the data acquisition speed is greatly accelerated; this is not only due to all the data being acquired from a single breathhold, but also because the necessity is removed for rescanning when slice mismatch occurs between different TSLs for the multiple breathhold method. Compared with previous reports,10,11,22 in the current study we introduced a few steps to further ensure the robustness of data acquisition, including (1) standardized shimming box placement in the right lobe ( Fig. 1 ), (2) increasing the number of TSLs from three/four to six, (3) increasing the slice number per examination from three to six, (4) and measuring liver T1rho with a histogram approach to avoid potential operator-induced bias. The breathhold duration was around 13 s per slice acquisition (12 s for data acquisition and about 0.5–1 s for instruction preparation) and well tolerated by all participants. Except for two cases of high obesity and one case of multiple liver cysts, liver T1rho imaging was successfully implemented in all of the remaining 97 volunteer subjects. T1rho images were largely artifact free, and the histogram showed a concentrated distribution of pixels ( Fig. 2 ; Suppl. Fig. S1 and Fig. S2 ). We consider the current T1rho imaging approach to be clinically applicable.
The physiological range of liver T1rho for female subjects demonstrated strong age dependence, with younger women having higher T1rho measurement. Actually, to our surprise, liver T1rho can be higher than 50 ms in healthy young women. Such high measurement was previously considered to be associated with liver fibrosis.14,19 Indeed, we asked all subjects with liver T1rho >49 ms to have a liver function test and at least viral hepatitis b test, which turned out to be negative for all of them ( Fig. 3 ). On the other hand, postmenopausal women older than 51 y had T1rho values similar to male subjects. The lowest liver T1rho measurements were similar for women and men. For the five subjects scanned both at the menstrual phase and the second half of the nonmenstrual phase, liver T1rho during the menstrual phase was 4.2% lower. In addition, 11 participants scanned in the menstrual phase had a mean liver T1rho value 4.7% lower than the other 36 participants scanned in the nonmenstrual phase. Although statistical power can be increased with access to larger sample sizes, we expect this may not be clinically relevant for most examinations. For marginal cases, liver T1rho imaging at the nonmenstrual phase may improve consistency. In the study by Koon et al. 25 of 32 young male rats (200–250 g), the physiological liver T1rho value was 38.38 ± 1.53 ms (range, 36.05~41.53 ms), which is similar to the human data obtained in this study (mean ± SD, 39.16 ± 2.31 ms; range, 34.94–43.39 ms). The normal range is slightly wider in human livers, likely because laboratory animals are more homogeneous in their age and other physiological conditions, including diet. Because the male liver T1rho value is more consistent across ages, it is more appropriate to compare liver T1rho by black blood FSE sequence and bright blood gradient echo sequence using male subject data, resulting in a difference of 3.2 ms (39.16 ± 2.31 ms vs 42.36 ± 2.00 ms).10,11
It is likely that liver T1rho can be influenced by the iron content in liver, with higher iron content in the liver leading to lower T1rho measurement. 26 The overall iron deposition extent in the body and in the liver has been noted to be higher in men than in women.27,28 In biological systems, liver iron content increases over aging,28–30 and liver iron content in women increases significantly after menopause.28,31 The T1rho dynamics observed in this study seem to reflect partially the pattern of liver iron physiological changes; therefore, we postulate that liver T1rho physiological dynamics are partially influenced by the iron content of the liver. 26 However, it should be noted that T2 and T1rho relaxations show different contrast mechanisms.9,32 In addition, the measured range of liver T2 and T2* values in individuals without iron overload has been very wide. Schwenzer et al. 28 found that normal T2* values ranged from 14 to 46 ms at 1.5T. It was noted that MR relaxometry methods may not be accurate for quantifying iron in subjects with physiological iron content or mild iron overload. 33 Another physiological gender difference is that men and women have different mean hemoglobin levels in healthy venous blood, with the mean level of women approximately 12% lower than that of men. 34
The World Health Organization defines overweight as a BMI of 25 or higher and obesity as a BMI of 30 or higher. For Chinese adults aged 20 y or older, it was recently reported that a BMI of 24.0 to 25.9 for men and women was deemed as optimal. 35 Our preliminary analysis in this study showed when fat suppression was applied to the liver, T1rho had no evidential association with BMI. Xie et al. 19 recently reported that fatty liver itself does not affect liver T1rho quantification when fat suppression is applied during data acquisition. However, more studies are needed to confirm this result.
A further deeper investigation into the mechanism of the phenomenon observed in this study may lead to better understanding of the fundamentals of liver physiology and also the biophysics of T1rho contrast. Estradiol has a favorable role in chronic liver disease, which is suggestive of a protective effect of estrogens against nonalcoholic fatty liver disease (NAFLD) in women. 36 Although men have a higher prevalence of NAFLD than women, there are observations of persistent increases in the incidence of NAFLD in women beyond middle age, whereas such continued increases in NAFLD incidence are not demonstrated in men.37,38 Aging increases the risk for NAFLD in premenopausal women.37,38 Age is a risk factor for NAFLD in women but not in men. 39
There are a number of limitations of this study. Because we did not include patients with mild liver diseases in the study, the upper limit of normal liver T1rho remain undecided. However, the data obtained in this study should provide support for future patient studies. For example, a man with a liver T1rho >45 ms should raise high suspicion for liver diseases; on the other hand, a young women with liver T1rho = 50 ms may be normal. In hindsight, that the liver iron levels of study participants were not directly or indirectly measured was an important limitation of this study. However, previous studies seem to suggest MR relaxometry cannot accurately quantify iron in subjects without iron overload.28,33 One technical limitation of the current T1rho sequence is insufficient RF pulse energy for T1rho imaging for two obese patients. Further sequence optimization is required to overcome this difficulty. Another point of note is that the T1rho value may be dependent on the sequence design 40 ; therefore, T1rho values measured by different acquisition methods may not be directly compared. Although the T1rho imaging method described in this study is practical for clinical applications, we also expect that conversion factors can be developed for comparison of T1rho sequences with different sequence preparation designs. The same as this study, most of the reported studies of liver T1rho imaging were performed at 3T with a spin lock frequency of 500 Hz, and most studies report a mean physiological liver T1rho slightly greater than 40 ms.10–14,16,17,19,22,41
In conclusion, this study reports the normal liver T1rho value in healthy volunteers. The physiological value in men has relatively narrow distribution, whereas the physiological value in women has a wider distribution and decreases with age. In women, the liver T1rho measurement tends to be 4% to 5% lower during the menstruation phase. Postmenopausal women have a similar liver T1rho range as men. The knowledge of liver T1rho value in healthy volunteers provides the foundation for developing T1rho as an imaging biomarker for liver tissue composition or liver function.
Footnotes
Acknowledgements
We thank Miss. Yao T. Li and Dr. Olivier Chevallier, research student and research fellow at the Chinese University of Hong Kong respectively, for assistance during the MRI data acquisition.
Supplementary material is available online with this article.
Declaration of Conflicting Interests
The authors declared no potential conflicts of interest with respect to the research, authorship, and/or publication of this article.
Funding
The authors disclosed receipt of the following financial support for the research, authorship, and/or publication of this article: This study was partially supported by grants from the Research Grants Council of Hong Kong SAR (Project Nos. 476313 and SEG CUHK02).
References
Supplementary Material
Please find the following supplemental material available below.
For Open Access articles published under a Creative Commons License, all supplemental material carries the same license as the article it is associated with.
For non-Open Access articles published, all supplemental material carries a non-exclusive license, and permission requests for re-use of supplemental material or any part of supplemental material shall be sent directly to the copyright owner as specified in the copyright notice associated with the article.