
Abstract
This study investigated a combined use of intravoxel incoherent motion (IVIM) parameters, Dslow (D), PF (f), and Dfast (D*), for liver fibrosis evaluation. Sixteen healthy volunteers (F0) and 33 hepatitis-b patients (stage F1 = 15, stage F2–4 = 18) were included. With a 1.5 T MR scanner and respiration gating, IVIM diffusion-weighted imaging was acquired using a single-shot echo-planar imaging sequence with 10 b values of 10, 20, 40, 60, 80, 100, 150, 200, 400, and 800 s/mm2. Signal measurement was performed on right liver parenchyma. With a three-dimensional tool, Dslow, PF, and Dfast values were placed along the x axis, y axis, and z axis, and a plane was defined to separate healthy volunteers from patients. The three-dimensional tool demonstrated that healthy volunteers and all patients with liver fibrosis could be separated. Classification and regression tree showed that a combination of PF (PF < 12.55%), Dslow (Dslow < 1.152 × 10⁻³ mm2/s), and Dfast (Dfast < 13.36 × 10⁻³ mm2/s) could differentiate healthy subjects and all fibrotic livers (F1–4) with an area under the curve of logistic regression (AUC) of 0.986. The AUC for differentiation of healthy livers versus F2–4 livers was 1. PF offered the best diagnostic value, followed by Dslow; however, all three parameters of PF, Dslow, and Dfast contributed to liver fibrosis detection.
Keywords
Introduction
Chronic liver disease is a major public health problem worldwide. The epidemic trend of chronic liver disease is expected to increase due to an aging population, the growing epidemic of obesity, and nonalcoholic steatohepatitis (NASH). Viral hepatitis is the most common blood-borne infection worldwide.1,2 Chronic viral hepatitis can lead to hepatic fibrosis, cirrhosis, and hepatocellular carcinoma. 3 Liver fibrosis, a common feature of almost all chronic liver diseases, involves the accumulation of collagen, proteoglycans, and other macromolecules in the extracellular matrix. 4 Clinically, liver fibrosis usually has an insidious onset and progresses slowly over decades. Originally considered to be irreversible, hepatic fibrosis is now regarded as a dynamic process with the potential for regression. 4 Treatment with combined therapies on underlying etiology and fibrosis simultaneously might expedite the regression of liver fibrosis and promote liver regeneration.5–7 Earlier-stage liver fibrosis is more amenable to therapeutic intervention. Even when the underlying etiology of liver fibrosis could not be eradicated, therapies on liver fibrosis might help delay the progression of the disease to cirrhosis.
To date, noninvasive diagnostic tests available from clinical practice are not sensitive or specific enough to detect occult liver injury at an early stage. 8 Liver biopsy is currently the standard of reference for the diagnosis and staging of liver fibrosis. However, liver biopsy is an invasive procedure with several contraindications and with a risk of complications, such as pain, hemorrhage, bile peritonitis, penetration of abdominal viscera, pneumothorax, and even death.9,10 The mortality rate associated with needle biopsy was estimated to be between 0.009% and 0.12%. 10 A noninvasive and quantitative technique for detecting liver fibrosis is highly desirable.
In diffusion-weighted (DW) MRI, the intensity of the acquired MR signal depends on the self-diffusion of the excited spins, that is, on the microscopic stochastic Brownian molecular motion, and the extent and orientation of molecular motion is influenced by the microscopic structure and organization of biological tissues.11–14 Perfusion can contribute to the diffusion measurements significantly because of the incoherent motion of blood in the pseudorandom capillary network at the macroscopic level.15–18 Intravoxel incoherent motion (IVIM) reflects the random microscopic motion that occurs in voxels on MR images of water molecules (either intracellular or extracellular) and the microcirculation of blood. Le Bihan et al.15,16 proposed the principle of IVIM, which enables the quantitative parameters that separately reflect tissue diffusivity and tissue microcapillary perfusion to be estimated. IVIM signal attenuation is modeled according to the equation
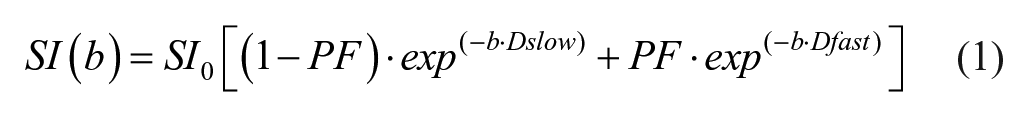
where SI(b) and SI0 denote the signal intensity acquired with the b-factor value of b and b = 0 s/mm2, respectively. Perfusion fraction (PF or f) is the fraction of the pseudodiffusion linked to microcirculation, Dslow (or D) is the true diffusion coefficient representing the pure molecular diffusion (slow component of diffusion), and Dfast (or D*) is the pseudodiffusion coefficient representing the incoherent microcirculation within the voxel (perfusion-related diffusion or fast component of diffusion).
Molecular water diffusion in fibrotic liver would be restricted by the presence of collagen fibers in the distorted lobular structure. Given the relatively high blood volume fraction of <25–30 mL of blood per 100 g in liver, 19 perfusion can contribute to the diffusion measurements significantly because of the incoherent motion of blood in the pseudorandom capillary network at the macroscopic level. It is well accepted that liver fibrosis is associated with reduced liver perfusion.20–23 Recently, there has been greater interest in using the IVIM technique to study diffused liver diseases, such as liver fibrosis. However, so far the literature has shown that IVIM is unable to detect early liver fibrosis reliably. 24 We noticed that the potential optimal combination of three IVIM parameters, Dslow, PF, and Dfast, for the detection of liver fibrosis has not been explored in sufficient detail. In this study, we set out to explore whether a combination of Dslow, PF, and Dfast can be used to separate fibrotic livers from healthy livers. We reanalyze our previously reported cohort, the Shenzhen 2012/2013 ivim dataset, 25 using our updated understanding for the IVIM technique and liver imaging. Our literature review showed that the Shenzhen 2012/2013 ivim dataset remains one of the largest datasets ever reported with all the patients having biopsy histopathology grading (Fig. 10 of Li et al. 24 ).
Materials and Methods
The characteristics of the Shenzhen 2012/2013 dataset have been previously reported. 25 The MRI data were acquired during the period from August 1, 2012, to August 15, 2013. The study was approved by the ethical committee of Shenzhen No. 3 Hospital, and informed consent was obtained, which included secondary analysis for the data acquired. The IVIM images of one volunteer and one patient were adjudged to contain substantial motion artifacts and were therefore excluded for analysis. Sixteen healthy volunteers (10 males, 6 females; mean age 36.4 years old; range 21–79 years old) and 33 consecutively viral hepatitis-b patients were included in the current study. The patient cohort had 15 stage F1 subjects (mean age 31.8 years, range 22–53 years) and 18 stage F2–4 subjects (mean age 42 years, range 22–53 years). The histology diagnosis for liver fibrosis was based on the 2000 Xi’an Consensus of the Chinese Society of Infectious Disease and Parasitology and the Chinese Society of Hepatology, 26 and is very similar to the METAVIR score. 27 Stage 1 (F1) of liver fibrosis is mild fibrosis, only seen at the portal area; stage 2 (F2) indicates fibrosis extending out from the portal areas, with rare bridges between portal areas, but without the destruction of the lobular structure; stage 3 (F3) is severe fibrosis, where there is fibrotic bridging between portal areas and between portal areas and center veins; and in stage 4 (F4) there are pseudolobules formed, and this is the final stage of cirrhosis. F0 and F1 livers are commonly referred to as without significant hepatic fibrosis, hepatic fibrosis (F2–4) are commonly referred to as significant hepatic fibrosis, and F4 is also referred as cirrhosis. 28 Hepatic fibrosis is considered clinically significant if defined as F2 or greater than F2, and requiring medical attention.28,29
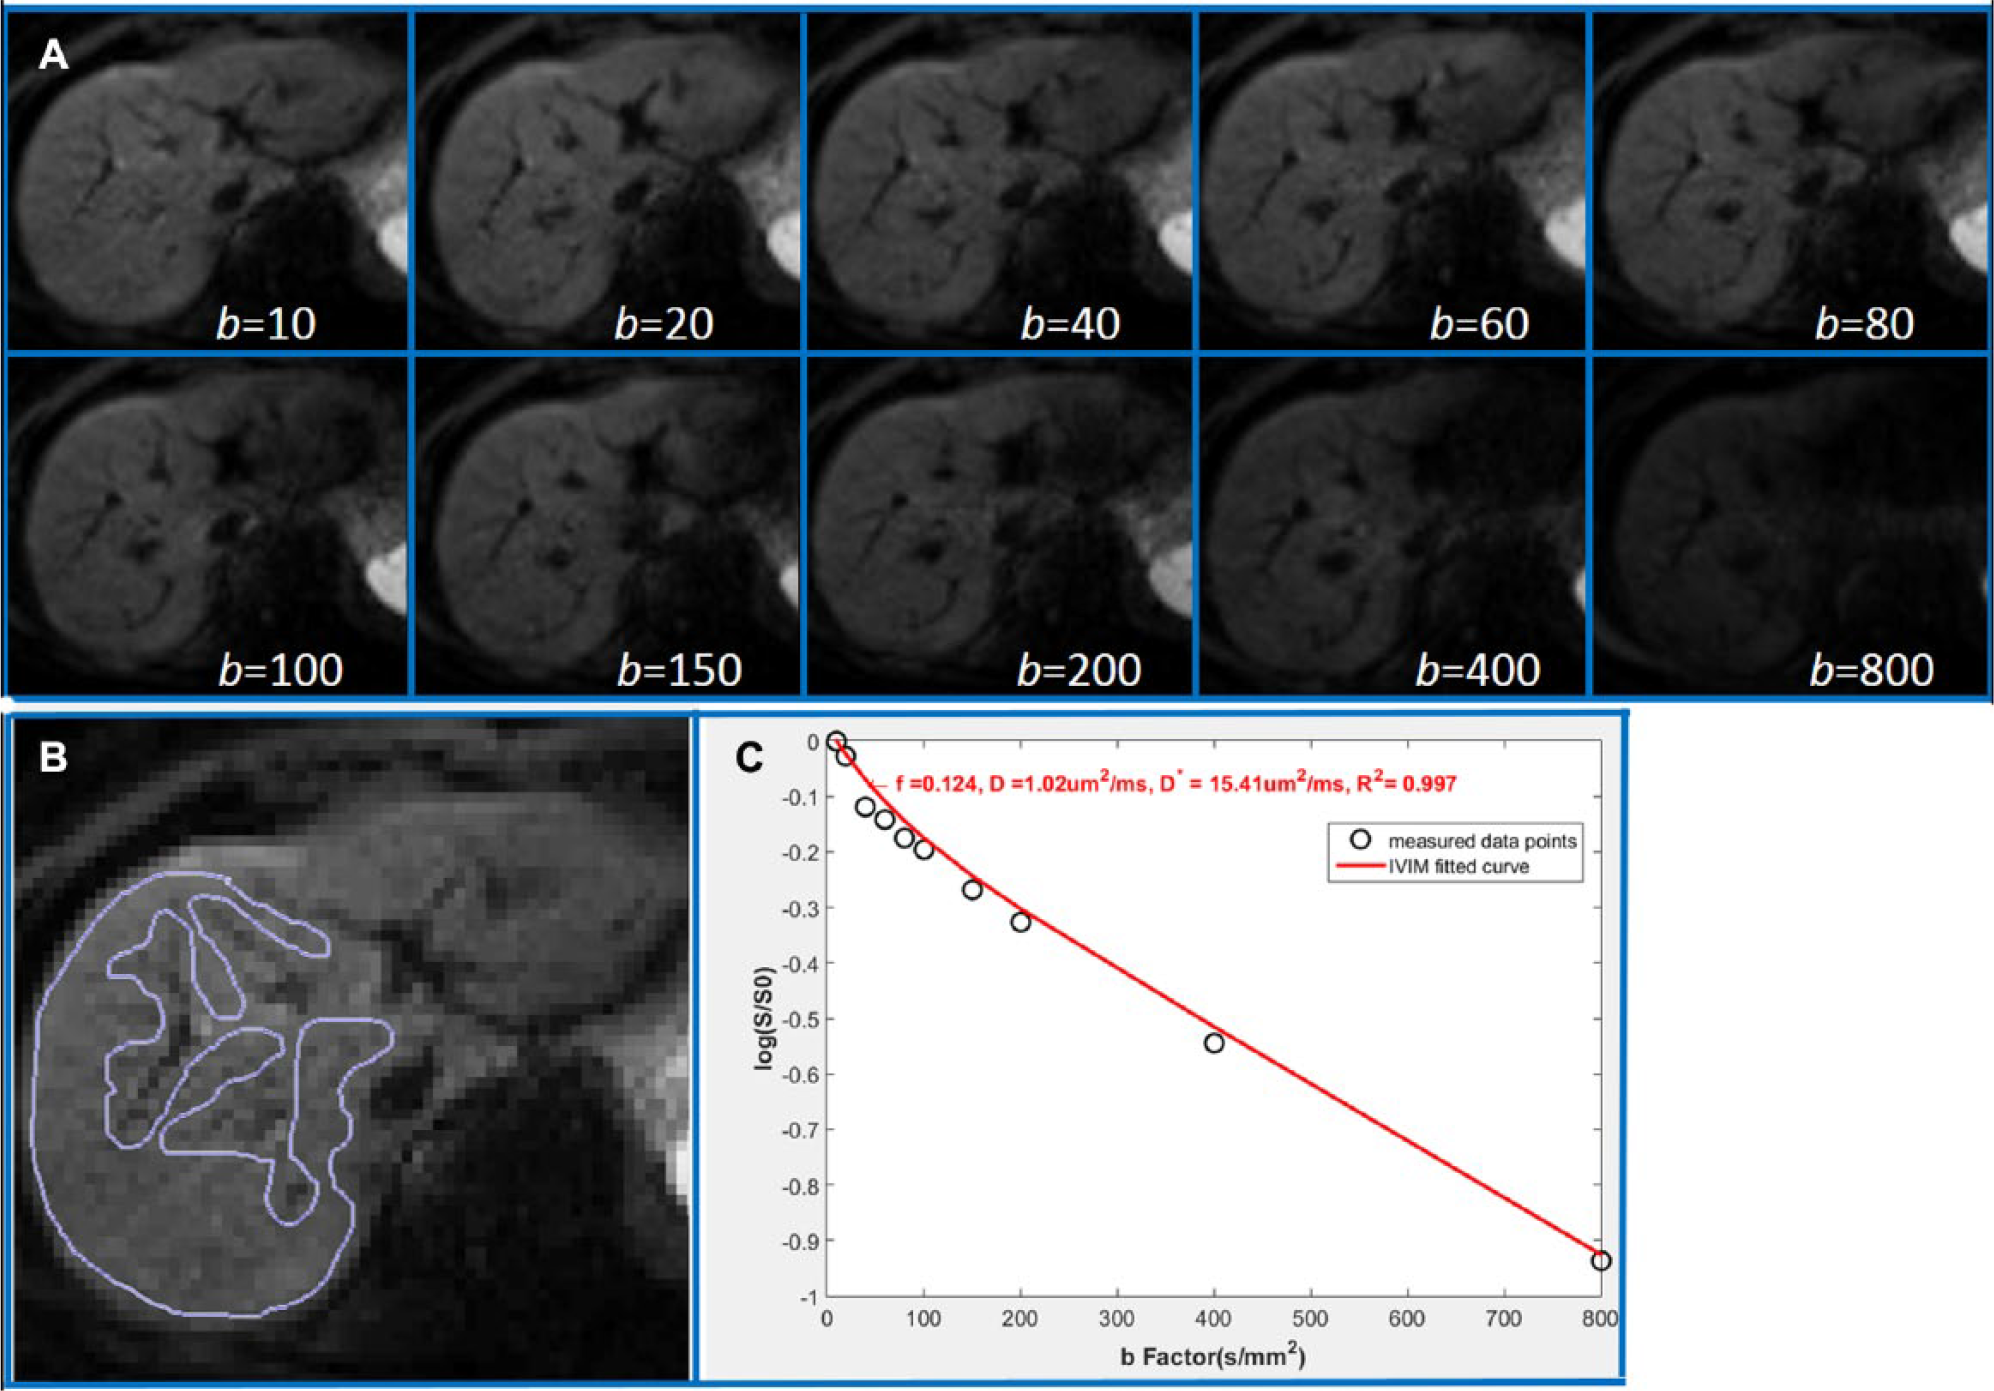
MRI was performed with a 1.5 T magnet (Achieva, Philips Healthcare, Best, Netherlands). The IVIM DW imaging sequence was based on a single-shot DW spin-echo-type echo-planar imaging sequence, with 10 b values of 10, 20, 40, 60, 80, 100, 150, 200, 400, and 800 s/mm2, respectively. The spectral presaturation with inversion recovery (SPIR) technique was used for fat suppression. Respiratory gating was applied in all scan participants and resulted in an average TR of 1500 ms, and the TE was 63 ms. Other parameters included slice thickness = 7 mm, matrix = 124 × 97, field of view (FOV) = 375 × 302 mm, number of acquisitions (NEX) = 2, number of slices = 6. The IVIM signal attenuation was modeled according to eq 1. As in our last report, 25 the estimation of Dslow was obtained by a least-squares linear fitting of the logarithmized image intensity at b values greater than 200 s/mm2 to a linear equation. The fitted curve was then extrapolated to obtain an intercept at b = 0. The ratio between this intercept and SI0 gave an estimate of PF. Finally, the obtained Dslow and PF were substituted into eq 1 and were nonlinear least-squares fitted against all b values to estimate Dfast using the Levenberg–Marquardt algorithm.
All curve-fitting algorithms were implemented in an accustom program developed on MatLab (Mathworks, Natick, MA). Regions of interest (ROIs) were positioned to cover a large portion of liver parenchyma while avoiding large vessels ( Fig. 1 ). For ROI analysis, the IVIM parameters were calculated based on the mean signal intensity of the whole ROI, which has been shown to offer better estimation than pixel-wise fitting when the signal-to-noise ratio (SNR) of the DW images is low.30,31
(
The following measurement modifications were made compared with our previous report. 25 As the left lobe of the liver is more likely to suffer from artifacts associated with cardiac motion and B0 inhomogeneity susceptibility due to its proximity to the stomach and the air inside, in the current study, only the right lobe of the liver was measured ( Fig. 1 ). Figure 1 demonstrates that the ROI was carefully drawn to cover only the right liver parenchyma while avoiding vasculature and artifacts. All six slices per subject were evaluated, while the slices with notable motion artifacts and those demonstrating notable outliers with signal b-value relation were discarded, and finally, the number of slices used for final analysis varied from two to five (average three slices). In addition, with careful histopathology review, two patients with an F1 histology score were redefined into F2. The overall results of current analysis did not differ very notably from previous analysis. 25
A three-dimensional tool was programed using IBM SPSS 23 for Windows (SPSS Inc., Chicago, IL), and the measures of Dslow, PF, and Dfast were placed along the x axis, y axis, and z axis. Data points from healthy volunteers were labeled as blue in the three-dimensional space, F1 patients were labeled as pink, and F2–4 patients were labeled as red. Attempts were then made to separate healthy volunteers from all patients (F1–4), healthy volunteers from significant patients (F2–4), and separate patients with different stages. The support vector machine (SVM) approach was used to quantitatively separate the F0 from F1–4, or F0 from F2–4.
32
SVM was used to find a plane (parametrized as Ax + By + Cz + D = 0) that was able to separate the data points into two groups. The distance of the closest data point from an individual group to the separating plane was defined as
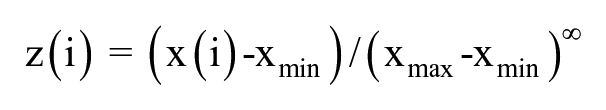
where x(i) is the original data and z(i) is the normalized data, and xmax and xmin are the maximum and the minimum value of x(i), respectively. Note the range of z(i) after normalization is from 0 to 1 for each dimension.
The classification and regression tree (CART) model was used to find the cutoff values for PF, Dslow, and Dfast to differentiate F0 livers versus F1–4 livers and F0 livers versus F2–4 livers. 33
Results
Livers of healthy volunteers had a PF of 16.6% ± 3.6% (mean ± standard deviation [SD]), Dslow of 1.14 ± 0.22 (×10−3 mm2/s), and Dfast of 12.3 ± 3.1 (×10−3 mm2/s), respectively. The coefficient of variance (CoV, SD/mean) for PF, Dslow, and Dfast in healthy volunteers was 0.19, 0.22, and 0.25, respectively.
When the study participants were grouped into three groups, (1) healthy volunteers (F0), (2) insignificant liver fibrosis (F1), and (3) significant liver fibrosis (F2–4), it was seen that PF offered the best differentiation of the three groups, followed by Dslow (
Table 1
,
Fig. 2
). By adjusting the viewing angel, the three-dimensional visual tool demonstrated healthy volunteers (F0, n = 16) and all patients with liver fibrosis (F1–4, n = 33) could be separated (
Figs. 3
Mean, SD, and CoV of PF, Dslow, and Dfast of Healthy Volunteers, F1 Liver Fibrosis Patients, and F2–4 Liver Fibrosis Patients.
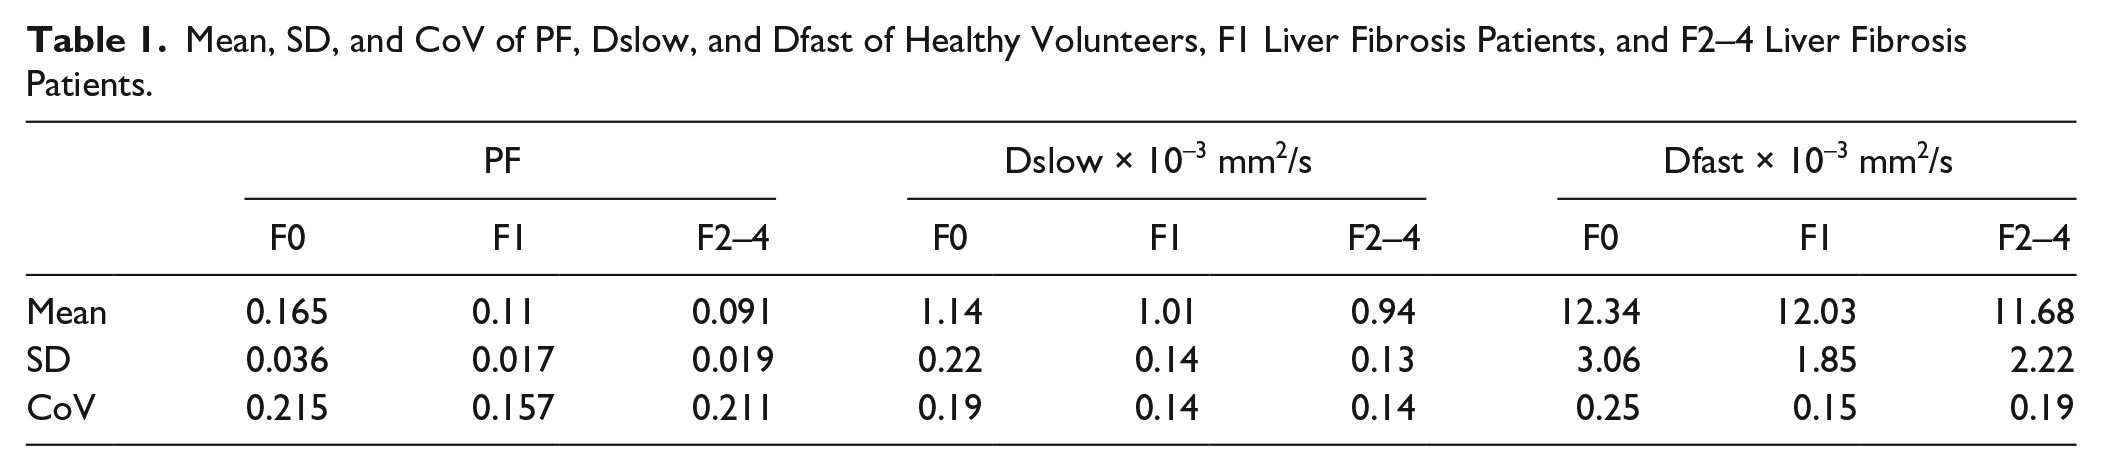
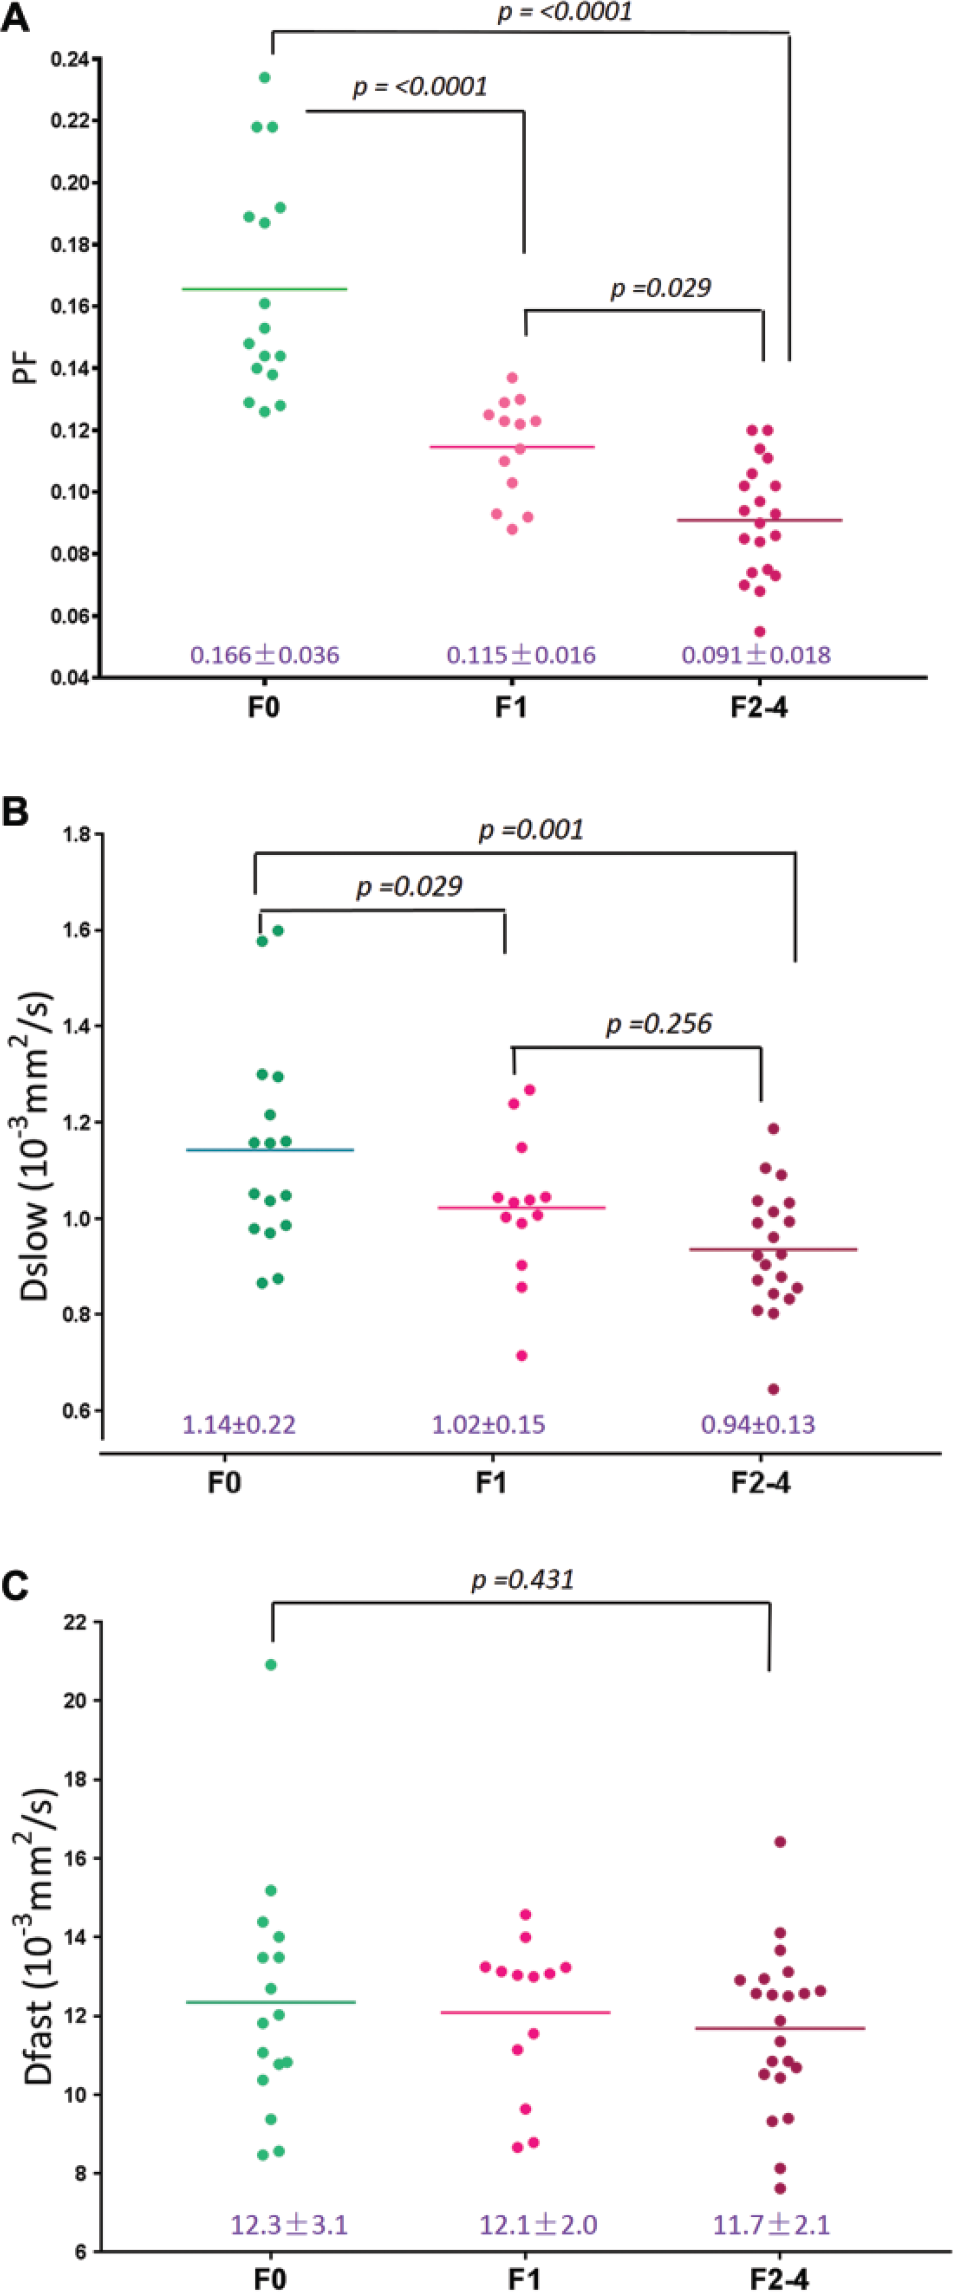
Scattered plots and mean of PF, Dslow, and Dfast of healthy volunteers, F1 liver fibrosis patients, and F2–4 liver fibrosis patients. p value, analysis of variance and Mann–Whitney U test.
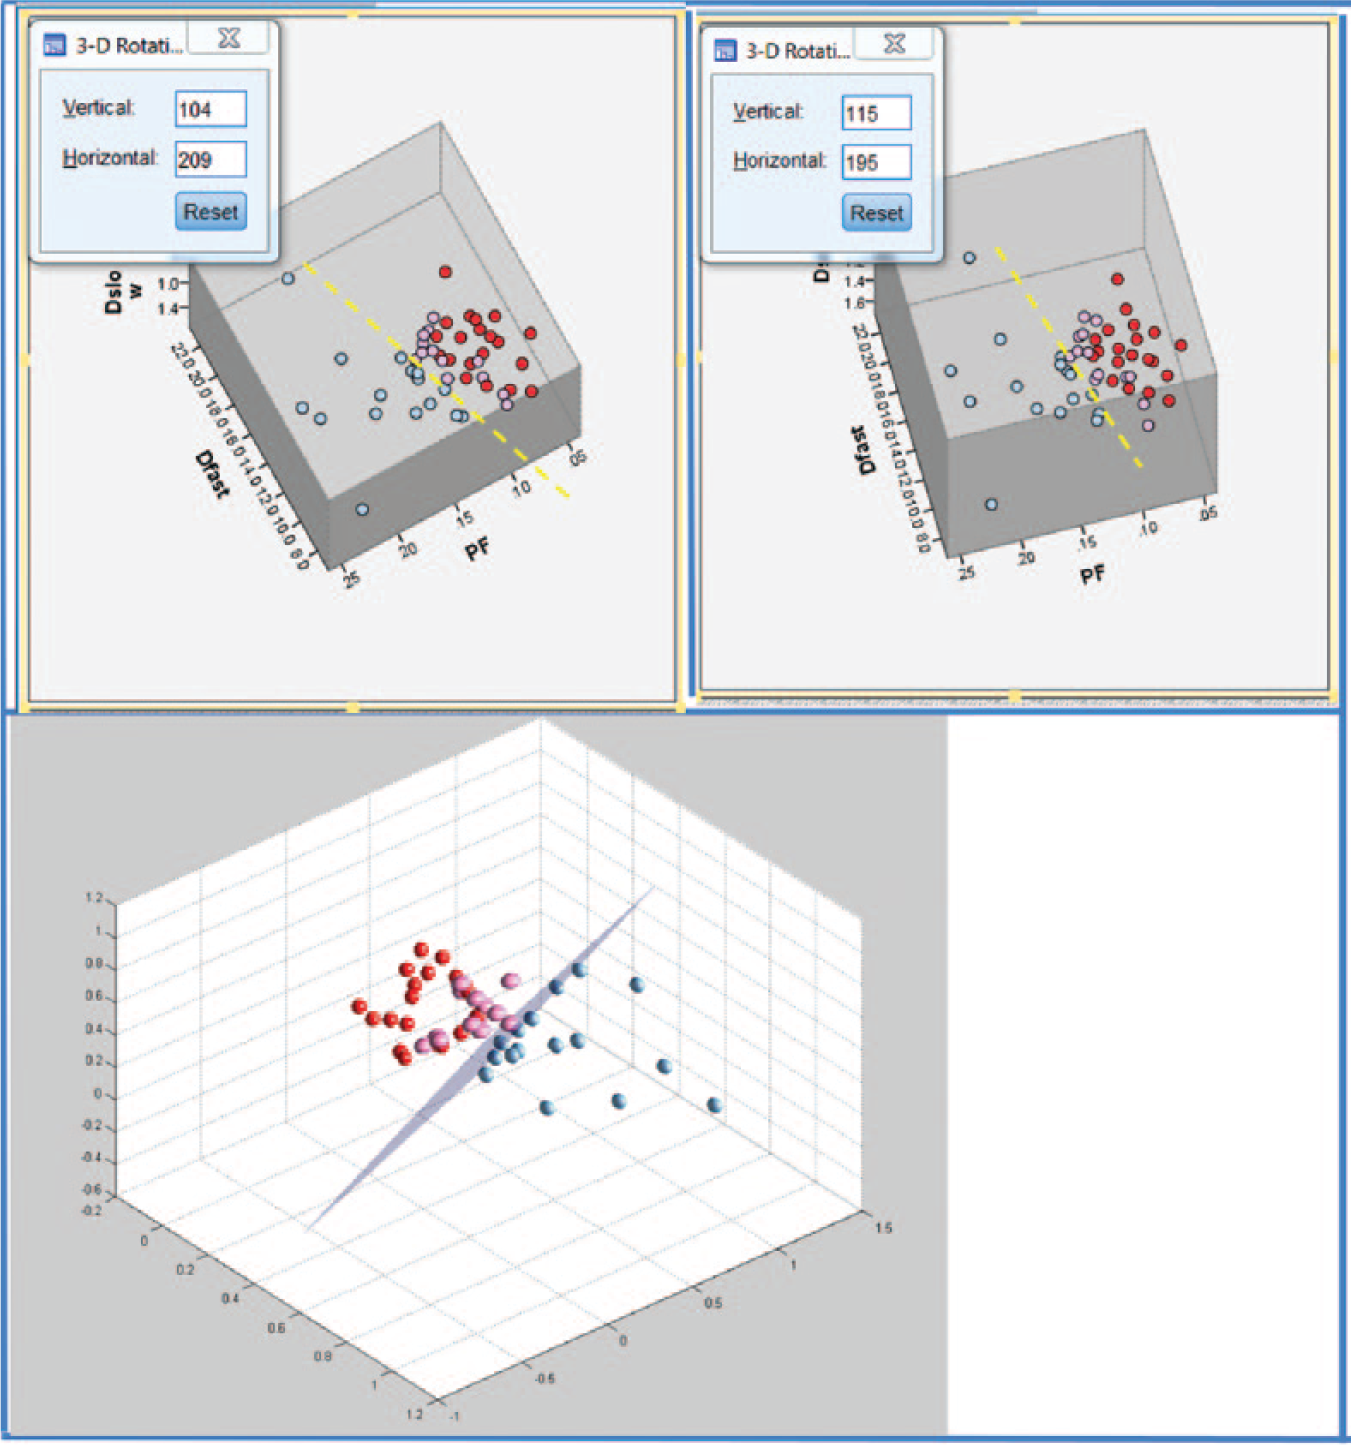
Three-dimensional display of healthy volunteer group (blue balls), F1 patient group (pink balls), and F2–3 patient group (red balls). Each ball represents one participant. The differentiation of the volunteer group and patient group can be better visualized by rotation in a three-dimensional space (dotted yellow line or purple plane).
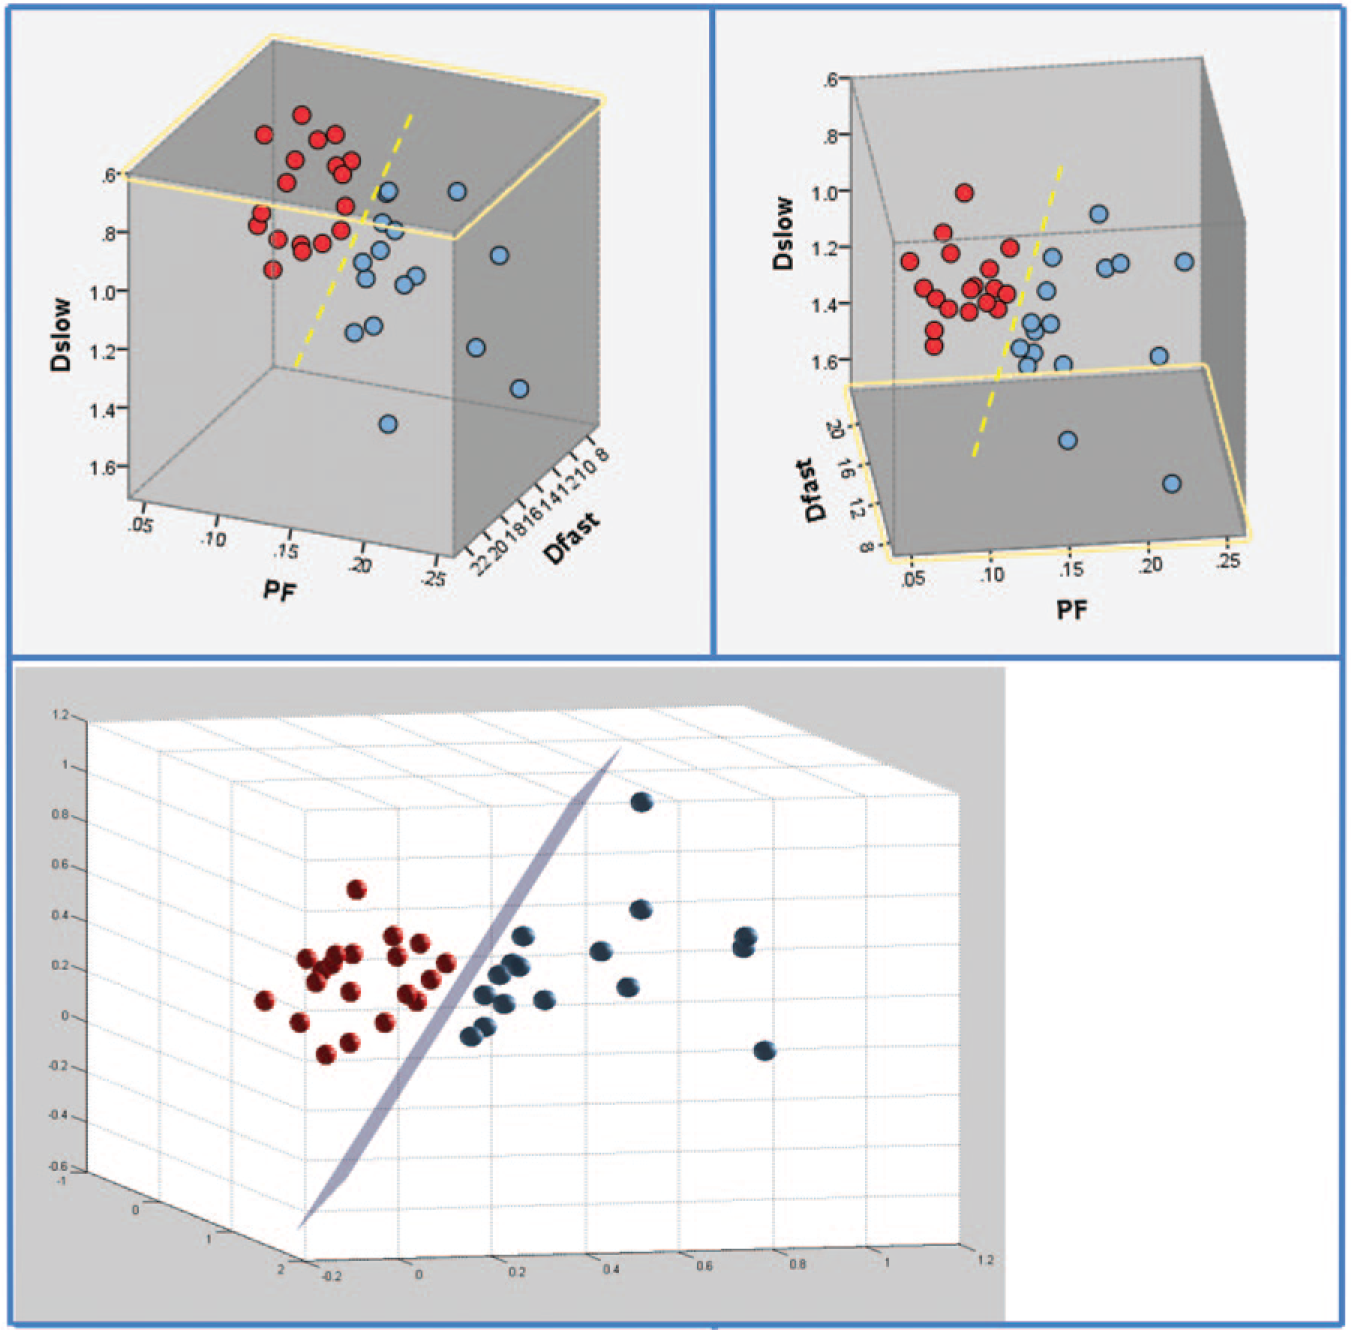
Three-dimensional display of healthy volunteer group (blue balls) and F2–3 patient group (red balls). Each ball represents one participant. The differentiation of the volunteer group and the patient group can be better visualized by rotation in a three-dimensional space (dotted yellow line or purple plane).
Quantitative analysis with SVM showed healthy volunteers, and all patients with liver fibrosis (F1–4) were differentiated with a plane defined by (166.58*PF) + (8.90*Dslow) – (0.98*Dfast) –19.71 = 0 ( Fig. 3 ); healthy volunteers and patients with significant liver fibrosis (F2–4) were more clearly differentiated with a plane defined by (29.56*PF) + (4.33*Dslow) – (0.12*Dfast) – 6.67 = 0 ( Fig. 4 ). The mean distance of the data points for F0 versus F1–4 to the central plane was 0.0021F0 + 0.0026F1–2 = 0.0047, and for F0 and F2–4 to the central plane, 0.0149F0 + 0.0138F2–4 = 0.0287.
The three-dimensional visual tool demonstrated better differentiation of healthy livers and fibrotic livers than the two-dimensional plot using PF and Dslow values ( Figs. 3 – 5 ), indicating that Dfast contributed to differentiating healthy volunteers and patients with liver fibrosis.
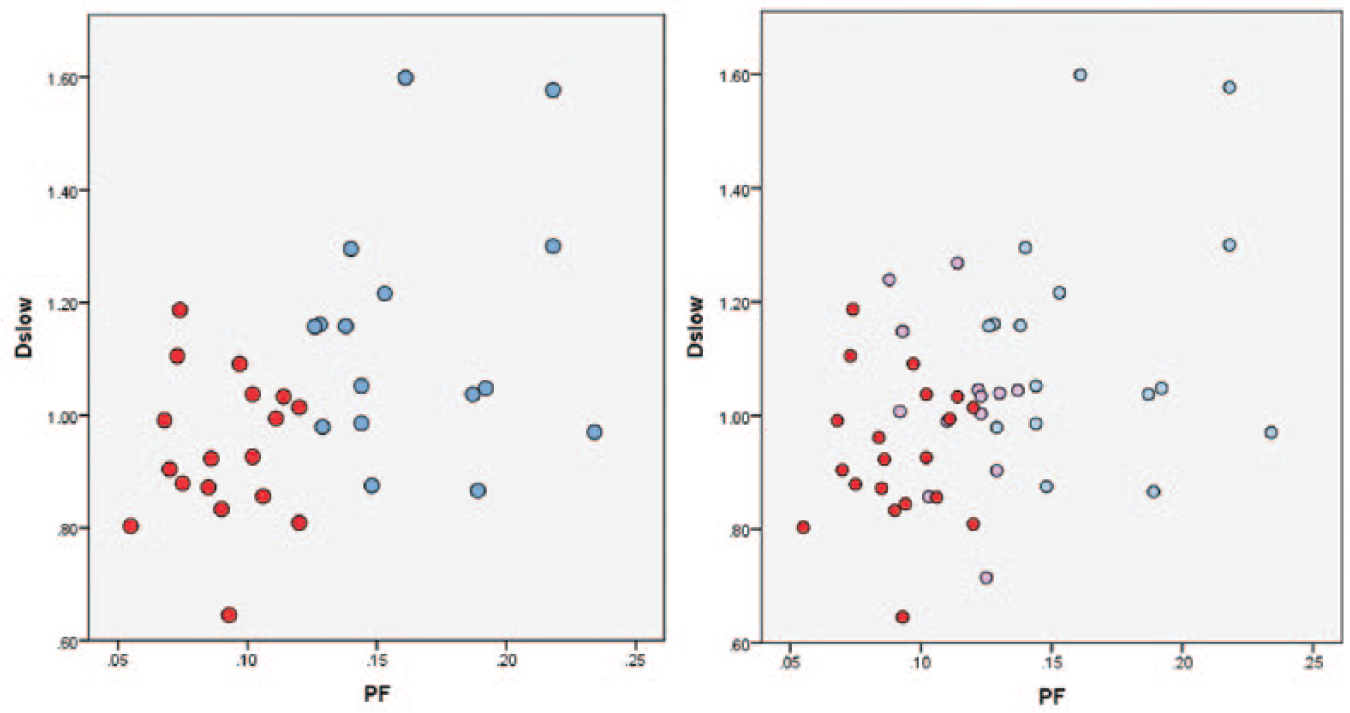
Two-dimensional demonstration of healthy volunteer group (blue balls), F1 patient group (pink balls), and F2–3 patient group (red balls) using the PF axis and Dslow axis. Each ball represents one participant. A combination of the PF axis and Dslow axis is insufficient to differentiate F0 subjects vs. F1–4 patients, in contrast to demonstrations in
Figs. 3
The CART analysis result is shown in Table 2 ; a combination of PF (cutoff value: PF < 12.55%), Dslow (Dslow < 1.152 × 10⁻³ mm2/s), and Dfast (Dfast < 13.36 × 10⁻³ mm2/s) can differentiate healthy subjects (F0) and fibrotic livers (F1–4) with an area under the curve of logistic regression (AUC) of 0.986. The AUC for differentiation of healthy subjects (F0) from significantly fibrotic ones (F2–4) was 1.
CART Analysis of AUC of F1–4 or F2–4 (compared with F0) on PF, Dslow, and Dfast.
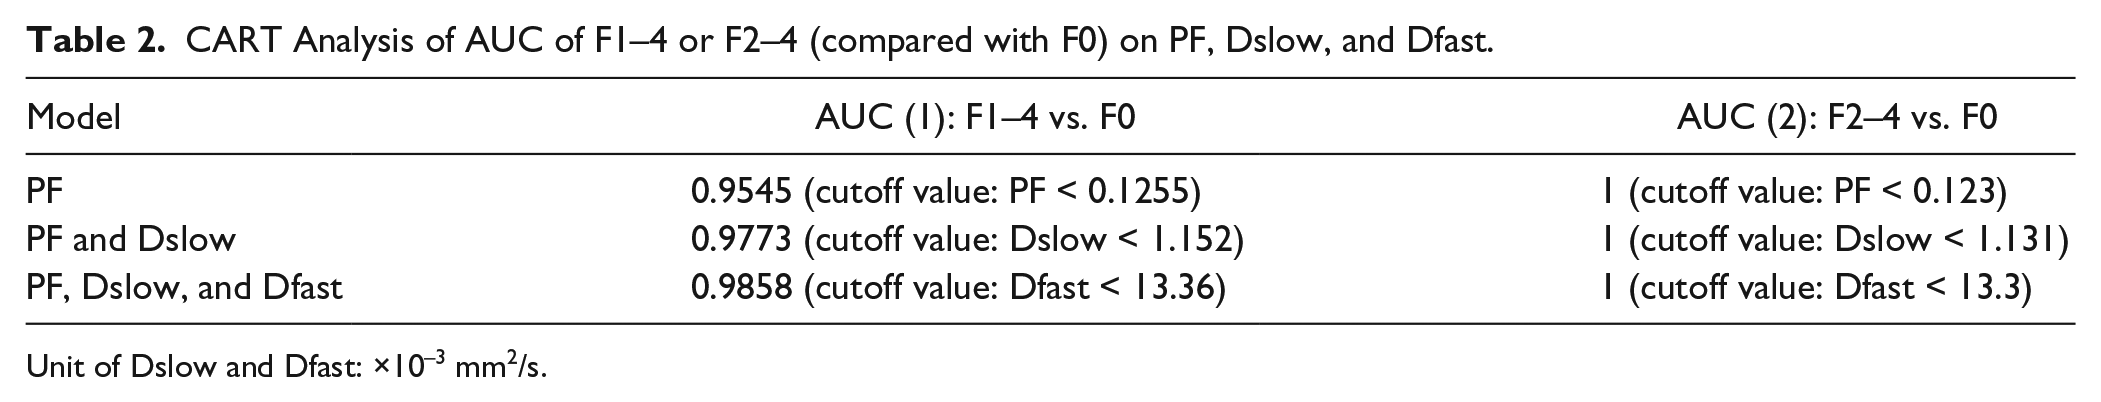
Unit of Dslow and Dfast: ×10−3 mm2/s.
Discussion
Currently, the most clinically used imaging technique for evaluation of liver fibrosis is ultrasound elastography, while the investigational technique of MR elastography has undergone many clinical trials. 34 The ultrasound elastography method is inexpensive, fast to acquire, and does not require postprocessing. In particular, one-dimensional transient elastography has been adopted clinically. The diagnostic accuracy of ultrasound elastography has been assessed in numerous studies and pooled in meta-analyses. The reported diagnostic accuracy for various ultrasound elastography techniques has an AUC in the range of 0.84–0.87 for fibrosis stage ≥F2, 0.89–0.91 for fibrosis stage ≥F3, and 0.93–0.96 for fibrosis stage F4.35–37 MR elastography provides higher overall diagnostic accuracy than ultrasound-based elastography. 34 Meta-analyses report an AUC for MR elastography in the range of 0.84–0.95 for diagnosing fibrosis stage ≥F1, 0.88–0.98 for fibrosis stage ≥F2, 0.93–0.98 for fibrosis stage ≥F3, and 0.92–0.99 for fibrosis stage F4.38–40 The limitations of ultrasound elastography include that it is an operator-dependent technique, while MR elastography requires additional hardware (an elastography driver) to be added to the MR scanner. As the IVIM imaging sequence is widely available in clinical MR scanners, it represents a promising alternative to existing techniques for liver fibrosis evaluation.
The PF and Dslow measurements obtained in this study broadly agreed with previous reports.24,41–46 For the 27 studies that reported measurement for healthy livers, the median value for Dslow was 1.11 × 10⁻³ mm2/s and 1.02 × 10⁻³ mm2/s at 1.5 and 3 T, respectively; the median value for PF was 22.00% and 22.65% at 1.5 and 3 T, respectively. 24 Using an acquisition of 25 b values, ter Voert et al. 41 reported a CoV of 0.23, 0.22, and 0.68 for PF, Dslow, and Dfast of normal liver regions of 15 subjects. In another five reports, the CoVs for PF and Dslow in healthy subjects were reported to be 0.13 and 0.11, 42 0.30 and 0.21, 43 0.28 and 0.19, 44 0.20 and 0.64, 45 and 0.18 and 0.05. 46 For healthy subjects, the CoV in our study was 0.21, 0.19, and 0.25 for PF, Dslow, and Dfast, respectively. The Dfast value obtained in this study is indeed lower than that in most of the previous reports. 24 The computing of Dfast, and to a lesser extent also PF, may have been comprised by that there was no b = 0 images for the Shezhen 2012/2013 ivim dataset (for an example with a b = 0 image included, see Suppl. Fig. S1 ). Dfast is more associated with low b values (<50 s/mm2), which corresponds to the steep part in the measured signal versus the b-value relationship (Fig. 5 of Li et al. 24 ).
Although much research has been published on the evaluation of liver fibrosis using IVIM, how to optimally combine Dslow, PF, and Dfast to get diagnostic information is not yet explored. The most important result of the current study is that despite the Shezhen 2012/2013 ivim dataset not being acquired with an optimized protocol, we were still able to demonstrate that healthy volunteers and patients with liver fibrosis could be differentiated. Another important finding of this study is that among the IVIM parameters of PF, Dslow, and Dfast, PF offers the best diagnostic value and Dfast can provide additional differentiation value, although it is a less stable measurement. Overall, the cluster of F1 subjects was located between F0 and F2–4; however, it was not possible to differentiate patients of different stages of F2–4 in this study. We expect this is at least partially due to the fact that the histological diagnosis is also not clear-cut; a high-end F1 liver will be similar to a low-end F2 liver. 47 The findings of this study are important, as until now it has been considered that there is no reliable noninvasive method, whether imaging or serum biomarkers, that can reliably detect early-stage liver fibrosis. In the meantime, we are looking into further validating our approach with other datasets or new prospective studies. Additionally, a two-dimensional flat plane was used in this study to separate healthy livers versus fibrotic livers; theoretically curved planes can also be used if curved planes offer better separation of healthy livers versus fibrotic livers, or better staging of fibrotic livers.
IVIM parameters strongly depend on the choice of the b values and the threshold used for computation. Numerical modeling suggests that the estimation uncertainties of Dslow and PF can reach 3.89% and 11.65%, respectively, with typical parameter values at a moderate SNR of 40. 48 However, to estimate Dfast within 10% uncertainty requires an SNR of >122. 48 Pekar et al. 49 commented that Dfast in particular tends to be unstable unless an unrealistically high SNR is achieved. More b values and applying an optimized b-value distribution reduce errors in the IVIM parameter estimation.24,40,50–53 In the study of ter Voert et al., the imaging time for IVIM with 25 b values was 5–6 min, which is clinically acceptable. Empirical literature also suggests that Dslow is the most reliable parameter among the three. 24 However, Dslow may suffer from a limited dynamic range for detecting fibrotic changes in the liver, as shown in this study. On the other hand, PF may offer both reasonable measurement stability and a sufficient dynamic range.
There are a few ways to improve the measurement accuracy in this study. This study used only 10 b values, while ter Voert et al. recommend no less than 16 b values for IVIM quantification to improve the measurement reliability. 34 The cutoff b value to obtain Dfast for this study, that is, b = 200, might have been too high. 24 It will be worthwhile to assign only b values of less than 50 s/mm2 as low b values. The cutoff values of PF < 12.55%, Dslow < 1.152 × 10⁻³ mm2/s, and Dfast < 13.36 × 10⁻³ mm2/s ( Table 2 ) may need to be readjusted if a different b-value distribution is used. DW imaging is very sensitive to any macroscopic patient motion. Due to the extensive residual motion from respiratory-gated data acquisition, 24 it may be beneficial to use the breath-hold technique, even at the cost of a reduced b-value number or reduced voxel spatial resolution. Our previous experience suggests that it is possible to get precise liver tissue measurement by multiple breath-holds. 54 Other approaches will be to denoise as well as design better segmentation to statistically remove ill-fitted pixels in the ROI, and employ better-fitting strategies and motion correction.55–59 Actually, our preliminary analysis demonstrated that IVIM parameters’ scan–rescan reproducibly can be satisfactory if motion-contaminated data are carefully removed during analysis. Another limitation of our study is all our patients had liver fibrosis due to viral hepatitis-b. Whether the results of our study can be generalized to liver fibrosis of other causes, such as NASH, remains to be validated. Quantification of diffusion may be confounded by fat and iron in the liver, 60 and this has not been carefully investigated in this study. However, it has already been shown that imaging can reliably detect late-stage liver fibrosis and liver cirrhosis, 61 and the question that requires more research is how to detect F1 and F2 stage liver fibrosis. Additionally, it is known that liver fat and iron can be quantified by MRI.62,63 It is expected that with a better IVIM imaging protocol with more b values and better image postprocessing, differentiation of early-stage fibrotic liver from healthy liver should have increased reliability. The use of Bayesian prediction, incorporating relevant findings from the available methods, is also a promising technique for liver fibrosis evaluation. 64 Bayesian prediction provides probabilities, rather than a yes/no decision; it also allows the weighting of different methods, such as IVIM, liver T1rho,65,66 and elastography38–40 readouts, therefore realizing multiparameter diagnosis.
In conclusion, a combination of PF, Dslow, and Dfast shows the potential of IVIM to detect early-stage liver fibrosis. Among the three parameters, PF offers the best diagnostic value, followed by Dslow; however, all three parameters contribute to liver fibrosis evaluation. Further research shall improve image data postprocessing, denoise or remove poorly fitted regions in the liver, and validate our approach with additional datasets.
Footnotes
Acknowledgements
The authors thank Dr. Jing Yuan, Medical Physics and Research Department, Hong Kong Sanatorium and Hospital, for setting up the data acquisition protocol at the Shenzhen No. 3 People’s Hospital.
Supplementary material is available online with this article.
Declaration of Conflicting Interests
The authors declared no potential conflicts of interest with respect to the research, authorship, and/or publication of this article.
Funding
The authors disclosed receipt of the following financial support for the research, authorship, and/or publication of this article: This study was supported by a direct grant for research from the Chinese University of Hong Kong (No. 4054167).
Notes
References
Supplementary Material
Please find the following supplemental material available below.
For Open Access articles published under a Creative Commons License, all supplemental material carries the same license as the article it is associated with.
For non-Open Access articles published, all supplemental material carries a non-exclusive license, and permission requests for re-use of supplemental material or any part of supplemental material shall be sent directly to the copyright owner as specified in the copyright notice associated with the article.