
Abstract
The erythrocyte sedimentation rate (ESR) is a commonly used test to screen for inflammatory conditions such as infections, autoimmune diseases, and cancers. However, it is a bulk macroscale test that requires a relatively large blood sample and takes a long time to run. Moreover, it provides no information regarding cell sizes or interactions, which can be highly variable. To overcome these drawbacks, we developed a microfluidic microscopy-based protocol to dynamically track settling red blood cells (RBCs) to quantify velocity of cell settling, as a surrogate for the ESR. We imaged individual cells in a vertical microfluidic channel and applied a hybrid cell detection and tracking algorithm to compute settling velocities. We combined eigenvalue background subtraction and centroid detection together with the Kalman filter and Hungarian assignment solver algorithms to increase accuracy and computational speed. Our algorithm is designed to track settling RBCs/aggregates in high cellularity samples rather than single cells in suspension. Detection accuracy was 79.3%, which is comparable to state-of-the-art cell-tracking techniques. Compared with conventional ESR tests, our approach has the advantages of being automated, using microliter volumes of blood samples, and rapid turnaround.
Introduction
Cell segmentation and analysis is an important tool for biomedical and physiological research. These are often performed by methods involving microscopic examination. Apart from visual inspection of cells, certain studies in medicine and cell biology require information about the temporal dynamics of the cells since the metabolic processes of living organisms are time dependent. 1 It is cumbersome to manually observe hundreds or thousands of cells under a microscope, motivating the need to develop computational cell-tracking tools. For instance, tracking algorithms to observe sperm motility 2 or cell signaling dynamics 3 have been developed in prior studies, which provide automated single-cell data in a fast and reliable manner.
Several methods for automatic cell detection exist in the literature. A popular one is based on optical flow, as demonstrated by Markandey et al. 4 However, there are constraints concerning the contrast and velocities of the object in the image to be tracked. Another popular automated detection method is based on the Hough transform, which is essentially a feature extraction technique. 5 A lacuna of this technique is the possibility of false peaks caused by arc segments of the cells to be tracked and occurrence of speckles in the image. In addition to these methods, Cui et al. 6 proposed a particle filter–based tracking algorithm, which uses the gradient inverse coefficient of variation (GICOV) method 7 to detect and estimate the cell diameter and center. However, this method is computationally intensive and gives rise to false detection if there is a large variation in diameter across cells. The accuracy of the method also falls in cases of fast uniform motion of cells, which is rather frequent. The decrease in accuracy is because the cell velocity estimated by this particle filter uses an inherent multidistribution state model, which is nonlinear, thereby affecting accuracy.
A more accurate detection technique is required for efficient tracking of cells. For the case of blood cell tracking, the algorithm must extract important parameters such as diameter, speed, rate of increase of size of cells, interaction of cells, and so on, which are essential for biological research. In addition, the implementation should be suitable for real-time implementation, which poses speed and computational complexity constraints on the algorithms.
The apparatus for cell-tracking experiments has improved vastly by the use of microfluidic devices for hosting the cells8–11 because of the capability to flow cells in such channels as well as for the advantage of automation and miniaturization that microfluidic systems provide. 12 The erythrocyte sedimentation rate (ESR) assay is a commonly performed test for prediagnosis of disorders related to inflammation. Recent research is focused on using microfluidic platforms to improve the performance of the ESR test, 13 which is conventionally done as a bulk assay. The motivation to achieve automated microfluidic ESR is that although the conventional bulk ESR is useful in prediagnosis of several disorders, its clinical usefulness is limited by lack of quantitative validation, poor correlation with blood cell sizes of individual patients, large volume of blood required along with time consumption, and a long test duration. During free settling, fibrinogen and other inflammation proteins cause red blood cells (RBCs) to stack on top of each other to form structures called rouleau, 14 which settle faster because of increased density. Thus, the fundamental study parameter for the ESR test is the formation of the rouleau, their changing size, and settling velocities. Most recently, Isiksacan et al. 15 related cellular aggregation to the rouleau size and velocity and compared level of cellular aggregation to the erythrocyte sedimentation rate by doing a regression study from conventional ESR data, using light scattering as a method of determining aggregate formation.
We develop an approach combining the advantages of the microfluidic platforms and cell-tracking algorithms to track single cells as well as a network of interacting cells. The tracking algorithms validate an experimental system, which mimics the ESR test. Optofluidic imaging can allow for better quantitative study of intercellular and protein-cell interactions. Also, it reduces sample volumes as well as the study duration. The overall variations due to different cells sizes in different patients can also be accounted for, which is not possible in bulk sedimentation assays. Experimental validation is performed by automated cell detection and tracking of settling RBCs in a microfluidic channel to assess the algorithm’s utility in assays like ESR tests. In addition, cell positions are referenced to create a network of cells, which finds utility in other inflammation and cell adhesion studies.
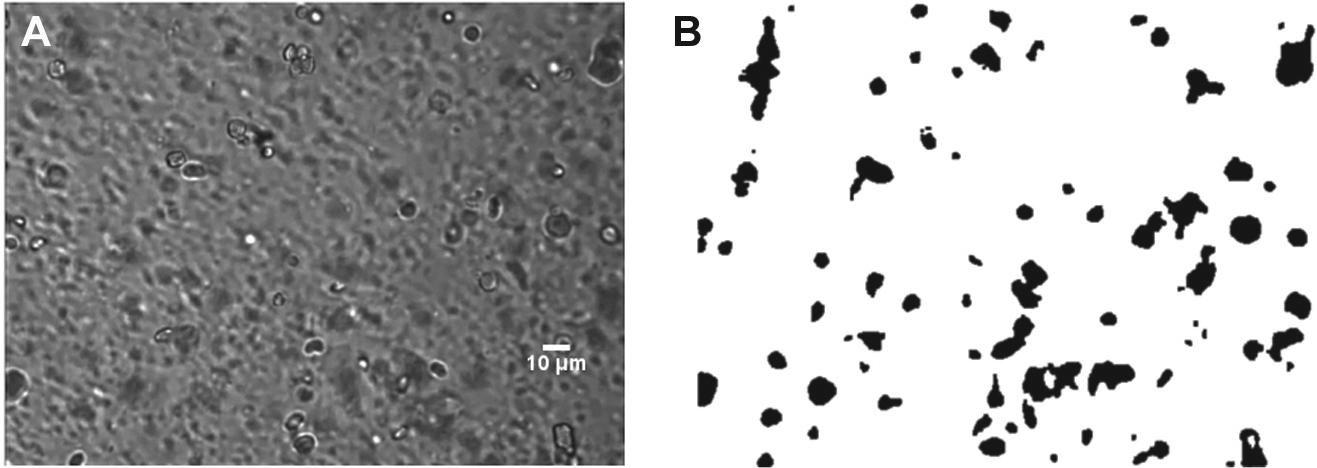
Our cell-tracking algorithm comprises a robust method for detection, tracking, and extraction of important parameters of cells, which are useful for subsequent analysis. The detection part involves fast segmentation of the foreground, which consists of moving cells against a dynamic background using the eigenspace background subtraction techniques. 16 The output is a binary image containing only cells, which disappear as dark blobs against a white background. Then the centroid detection algorithm is applied to obtain the centroids and areas of all white blobs. The coordinates are stored in arrays for further processing. Each cell must be tracked in subsequent frames, which requires association of the detected centroids to respective cells in the processed frames in real time. With the combined implementation of the Kalman filter 17 and Hungarian assignment solver, 18 each detected cell is accurately tracked. The Kalman filter is used to determine cell speed and rate of increase in cell size. The Hungarian assignment solver associates the centroids to respective cells with less computational complexity. Analyzing Kalman and Hungarian data helps in studying intercellular interactions. With all the algorithms running in real time and with high accuracy, the proposed solution is fast and offers higher accuracy than the state of the art.
Method
We first describe the experimental setup. The subsequent sections give a detailed description of the proposed algorithm.
Sample Preparation
Whole-blood samples were obtained via venipuncture from healthy volunteers recruited from the Health Centre at the Indian Institute of Science, Bangalore, and stored in ethylenediaminetetraacetic acid (EDTA)–coated Eppendorf vials at room temperature. RBCs were extracted from the whole blood by centrifugation and were suspended in autologous plasma at 0.5% hematocrit concentration for experimentation.
Experimental Setup
A microfluidic microscopy-based setup was assembled to accommodate imaging of settling cells (cf. Fig. 1 ). A uniform solution of RBCs suspended in autologous plasma (0.5%) was vertically allowed to settle in a microfluidic device having a single channel of depth 100 µm and width of 1 mm. The low hematocrit cell concentration was chosen to obtain better imaging results as higher concentrations result in high cell densities, making it impossible to detect individual cells in an image. Higher hematocrit concentrations lead to incorrect cell detection estimates due to noise by loosely focused cells in the adjacent background of the target cell. It takes 3 to 5 min for the cells to stabilize movement and start settling down with relatively uniform speed. The cell capture videos are analyzed for 5 min after this time point to determine the cell velocities. Estimating the velocities takes a very small amount of time, but we made different measurements over this 5-min time scale to see the occurrence of rouleau formation and thus see the changes in cellular velocities due to aggregate formations.
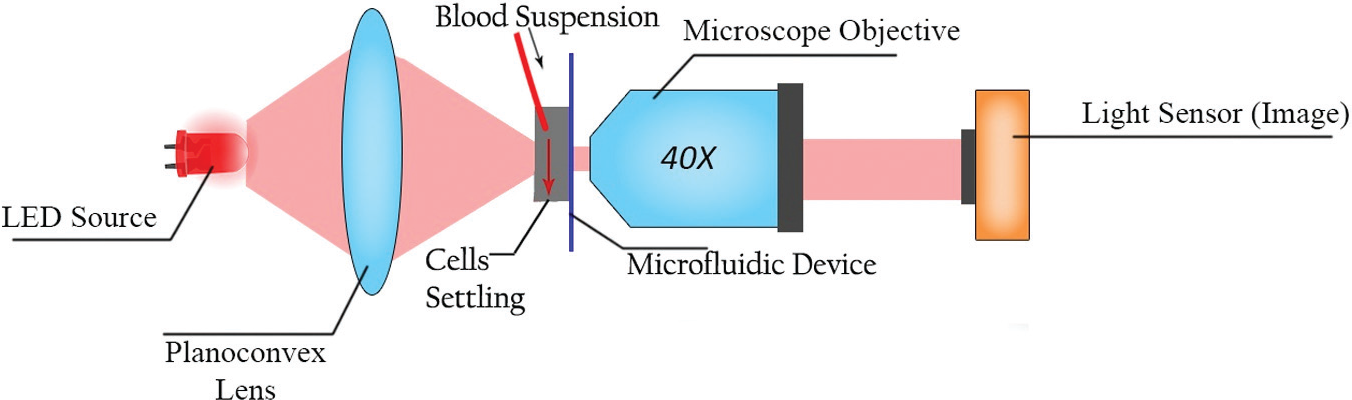
Experimental setup to record videos of settling red blood cells in a microfluidic channel.
The channel depth is quite large for well-focused imaging of RBCs as it results in dynamic low contrast noise. However, this is required for reproducing the accurate conditions of blood cell settling and to mitigate the effects of cell-to-channel wall interactions. To counter the problem of imaging RBCs with deeper channels, we used a suitable background subtraction algorithm in our solution. The microfluidic device was mounted on a vertical imaging setup in line with a 40× magnification microscope objective, a light-emitting diode (LED) light source, and a monochromatic image sensor (Imaging source DMK 23U618 [The Imaging Source, LLC Suite 400, 6926 Shannon Willow Rd, Charlotte, NC 28226, United States]), which facilitated recording of cell settling videos on a computer. These videos were subsequently processed by the cell detection algorithms.
The videos of cells flowing were obtained at a frame rate of 60 frames per second. The algorithms were executed on an Intel processor-based desktop computer (4th gen i7, 12 GB RAM).
Proposed Algorithm
The algorithm comprises of two parts: detection and tracking. In the detection phase, the cells are segmented from the static background using the eigenspace background subtraction technique. 16 The output consists of cells segmented as white blobs. The centroids of the blobs are estimated by first obtaining contours using connected component analysis 19 and then using a sample centroid formula. The radii of cells are estimated by approximating blobs as circles. The average area of a cell is known initially, and if cells are occluded, the number of cells is approximately found by the area of the blob. After obtaining centroids and radii, the Hungarian assignment solver 18 is applied in assigning centroids in the correct order of cells in each frame. A Kalman filter 17 is then applied to each detected cell giving the cell settling velocities. The number of centroids gives the total number of cells detected. The details of the algorithm are explained in subsequent sections.
Cell Detection
Eigenspace Background Subtraction Technique
Imaging cells settling in a channel of high depth has cell debris varying in time, giving rise to low-contrast image frames with cells out of focus. This can be modeled as background noise, which calls for detection of cells in a noisy dynamic background. We use eigenspace background subtraction to extract foreground cells because the method builds a background model by learning the static parts of the previous 20 frames. The learning procedure involves fewer computations, which is essential for detecting cells in real time. To extract cells from the background, the previous 20 frames of a frame in the current computation are processed to build an adaptive eigenspace model of the background. The mean µ and covariance matrix C of the initial 20 frames I[1–20] are computed. The eigenvector space describing the background is built using the estimated matrices. Using the eigen decomposition technique, the covariance matrix C is diagonalized as L = φCφ
T
, where φ is the eigenvector matrix of the covariance data and L is the corresponding diagonal matrix of its eigenvalues. A principal component feature vector Ii − φ
T
Xi is then formed, where Xi = Ii − μ is the mean-normalized image vector. Then, each input frame is projected in the eigenvector space by the eigen background images
(
Centroid Detection
Once the cells are segmented, the centroids are individually detected and stored. This is achieved by first extracting edges of the blobs using the Canny edge detector.
20
The Connected component analysis technique
19
is then used to determine the contour of each blob from the Canny edge output image, which is stored in a 2D array. Each row corresponds to contour points of a cell. The area enclosed by the contour is evaluated to estimate the diameter of the detected cell. This area also helps in differentiating normal cells with clumps of cells by comparing it with the average cell diameter. The centroid
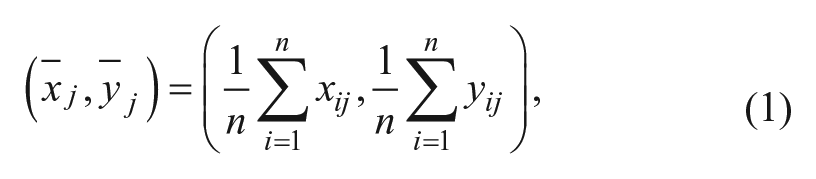
where (xij, yij) is the jth contour point of the ith detected cell and n is the number of contour points of each detected cell. The estimated centroids and diameters of Y detected cells are stored in a Y × 3 array, which is used for tracking. The application of the centroid detection to an input image containing RBCs is shown in Figure 3 .
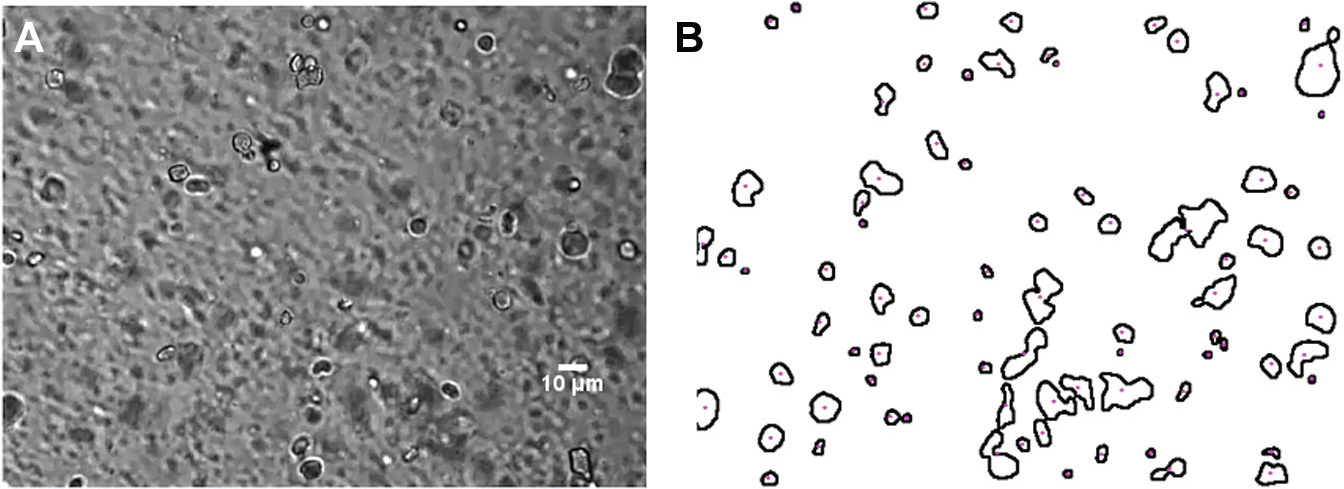
[Color online] Outlining results after centroid detections: (
Multicell Tracking
Since there are several cells detected in a single frame, we need an accurate mechanism to simultaneously track multiple cells. The sequence of estimated centroids and radii of detected cells stored in a Y × 3 array will always be in increasing order of Euclidean distances from the origin located at the top left of the image. The order may differ from frame to frame depending on changing cell positions. Thus, the order of the centroids in one frame corresponding to an order of tagging of cells in that frame may not be preserved in subsequent frames. To preserve the order, a correct centroid association to a corresponding tagged cell in every frame must be achieved. We accomplish this function through the combined implementation of the Kalman filter and Hungarian assignment solver, which are discussed next.
Kalman Filter
The Kalman filter is a popular algorithm for estimating and updating parameters from a series of measurements over a time. We use Kalman filter for tracking multiple cells by using the estimated centroids, predicting their motion, and resolving the identity of the tracked cells. The filter algorithm involves prediction and measurement update stages, which are recalled below.
1. Prediction: The state of a cell xt at a time t is assumed to evolve from the state xt−1 following a state transition matrix Ft as per the equation
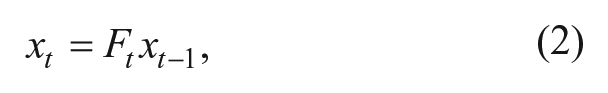
where
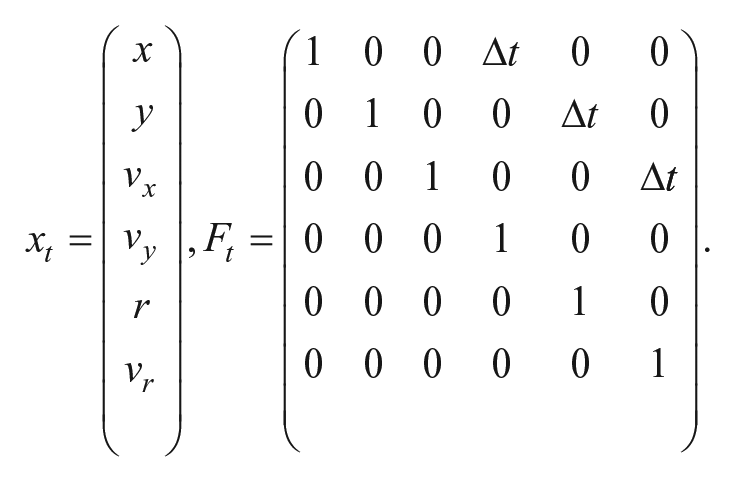
The state model assumes nonaccelerating objects modeled in (2) with Δt being the interframe interval of the video. We predict the state at time t from t − 1, which is then used by the Hungarian Assignment solver to associate detected centroids at time t to respective cells. After the centroids are assigned, the Kalman measurement update is performed.
2. Measurement update: The centroids obtained are assumed to be corrupted with zero-mean additive Gaussian noise. The measurement update is applied only on x, y, and r. The measurement noise is captured in vt, which has a covariance matrix R. The error in prediction stage is corrected in this stage zt, given by
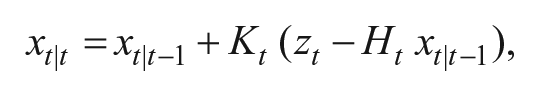
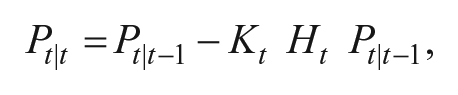
where Kt is given by
Hungarian Assignment Solver
The Hungarian assignment solver is used to map the detected centroids to respective cells captured in a matrix form called the cost matrix. The column size of the cost matrix is the number of centroids detected at time t − 1, and the row size is the number of centroids detected at time t. The matrix is populated with the values that are differences between the Kalman filter centroid predictions at t − 1 and centroids obtained at t. Then the assignment solver is applied to optimize the cost. 18 Once the cost is minimized, the order of the rows is used to assign the centroids to respective cells. This completes the tracking of cells.
Experimental Results
Our tracking algorithm’s performance is governed by the measured settling parameters and experimental conditions of microfluidic cell settling. For a standardized height of the observed field of view of the microfluidic channel, the velocities and sizes of the settling cells or rouleau should be determined. In addition, due to the relatively larger depth of our microfluidic channel (about 100 µm) compared with other cell-imaging channel designs, the algorithm must reject out-of-focus motile cells in the background.
Figure 4
shows three successive frames of multiple cells tracked, where each image is taken at an interval of 2 s. The trajectories of adjacent cells are mapped over time, denoted by the yellow and green lines. These cells appear to move closer to each other over time. This information can be used as position data and helps in monitoring the formation of the rouleau.
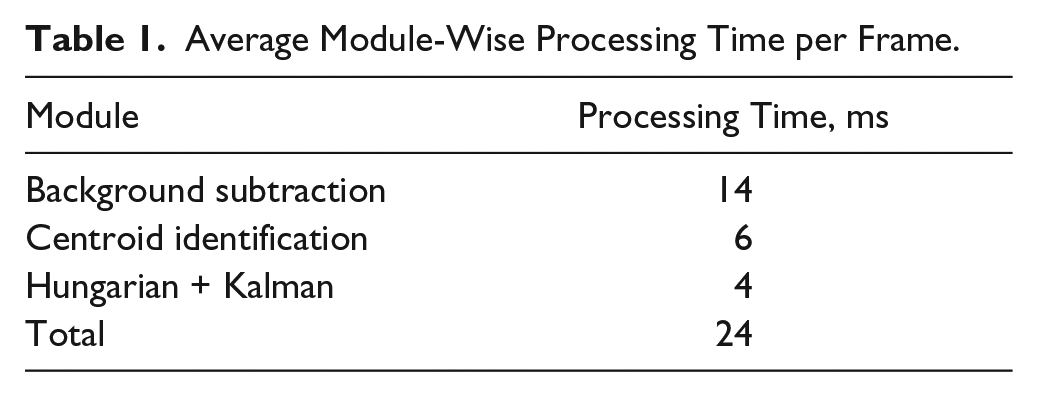
Table 1
gives the average split-up of the computation times of the algorithms processed on each image of resolution 320 × 240 having an average of 90 cells. Our solution has the feature of comparing the cell size versus velocity.
Figure 5
shows the variation of the settling velocities versus radii of the cells. The velocities of the cells are estimated by multiplying Kalman-predicted velocities in units of pixels/frame with a scale factor
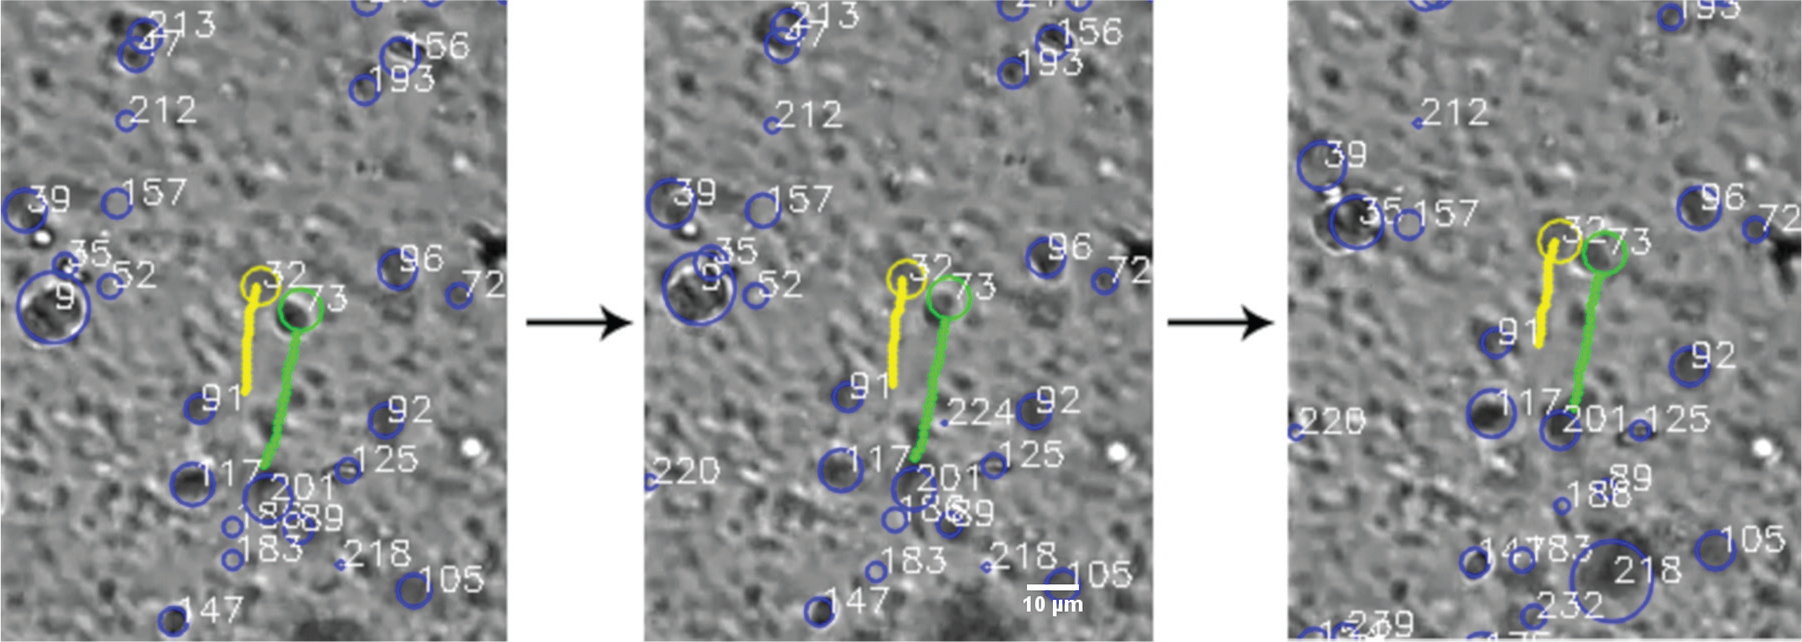
[Color online] This figure shows three successive frames of cells tracked in the same field of view of the microscope. The time elapsed between two images is 2 s. The trajectories of the two adjacent cells are mapped over time (yellow and the green lines). The tracked cells seem to be moving upward (instead of downward) because the image is inverted.
Average Module-Wise Processing Time per Frame.
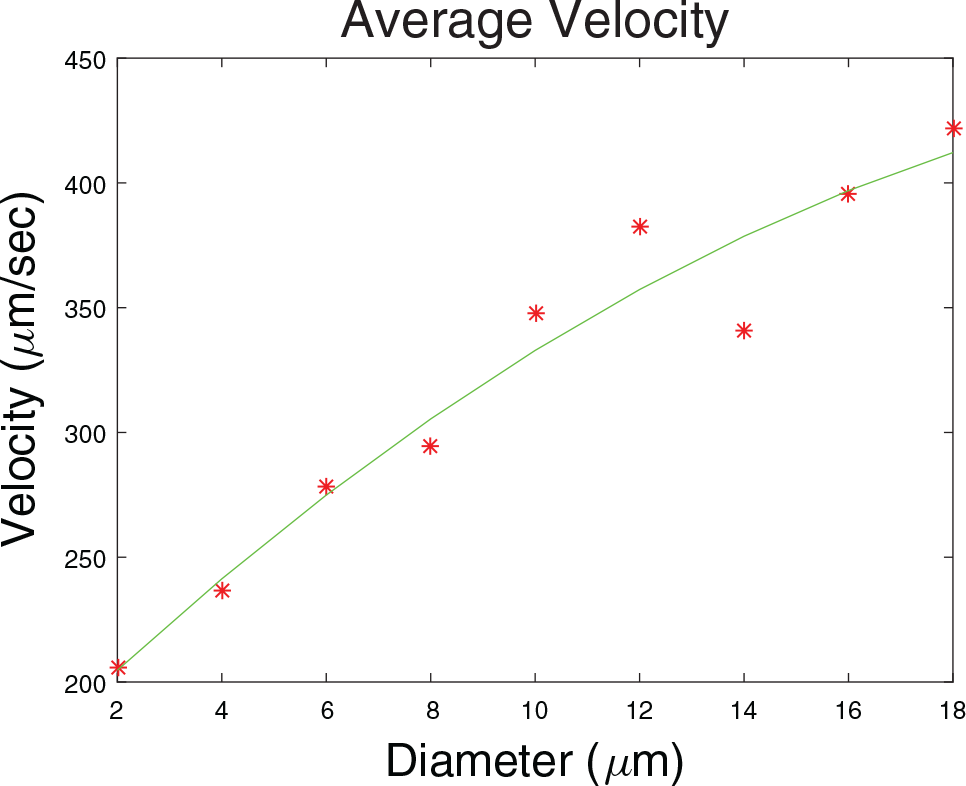
[Color online] The velocity profile of cells in relation to the cell sizes. The red spots are the average velocities, and the green curve shows the quadratic fit.
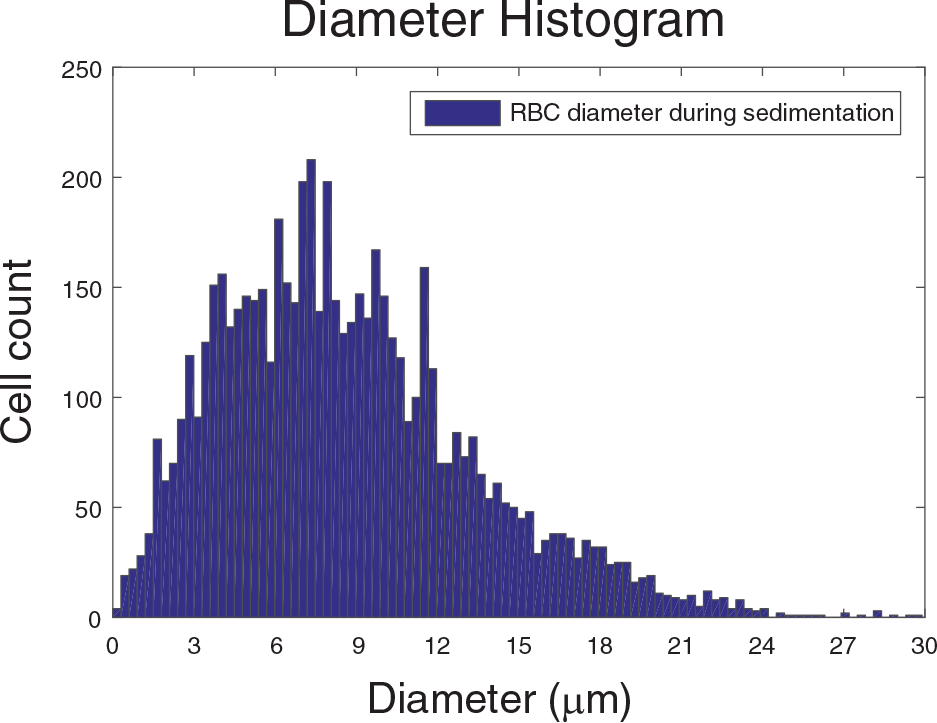
A histogram of the diameter of cells showing the population of cell/rouleau of different sizes. As expected, the peak occurs for about 6 to 9 microns, which is close to the diameter of an erythrocyte.
Comparison with State-of-the-Art Techniques
We compare the cell detection results obtained by the proposed solution with the Hough transform algorithm 5 and the GICOV. 7 Table 2 shows cell detection results using these techniques on videos of free-settling cells, obtained over three experimental trials, containing a mean of 90 cells per frame. The performance factors for cell detection are the total number of cells detected correctly and the percentage of false detections. A cell is said to be detected correctly if the centroid coordinates and diameter are estimated to an accuracy of ±10%. The Hough transform is unable to detect low-contrast cells that are also vital to study cell behavior. The GICOV method tries to fit a circle or an ellipse to a cell based on cell edge contrast. Hence, it can detect low-contrast cells. However, due to the large variation in the diameters of the cells, it gives rise to false detections or alarms. The computation time of all the methods increases with the number of cells. From Table 2 , we infer that the proposed method is 79.3% accurate in the detection of the cells, much higher than the Hough transform and GICOV methods.
Performance Comparison of Various Techniques on the Video of Free-Settling Cells Flowing in a Microfluidic Channel at an Average of 90 Cells Per Frame, Performed Over Three Independent Experiments.
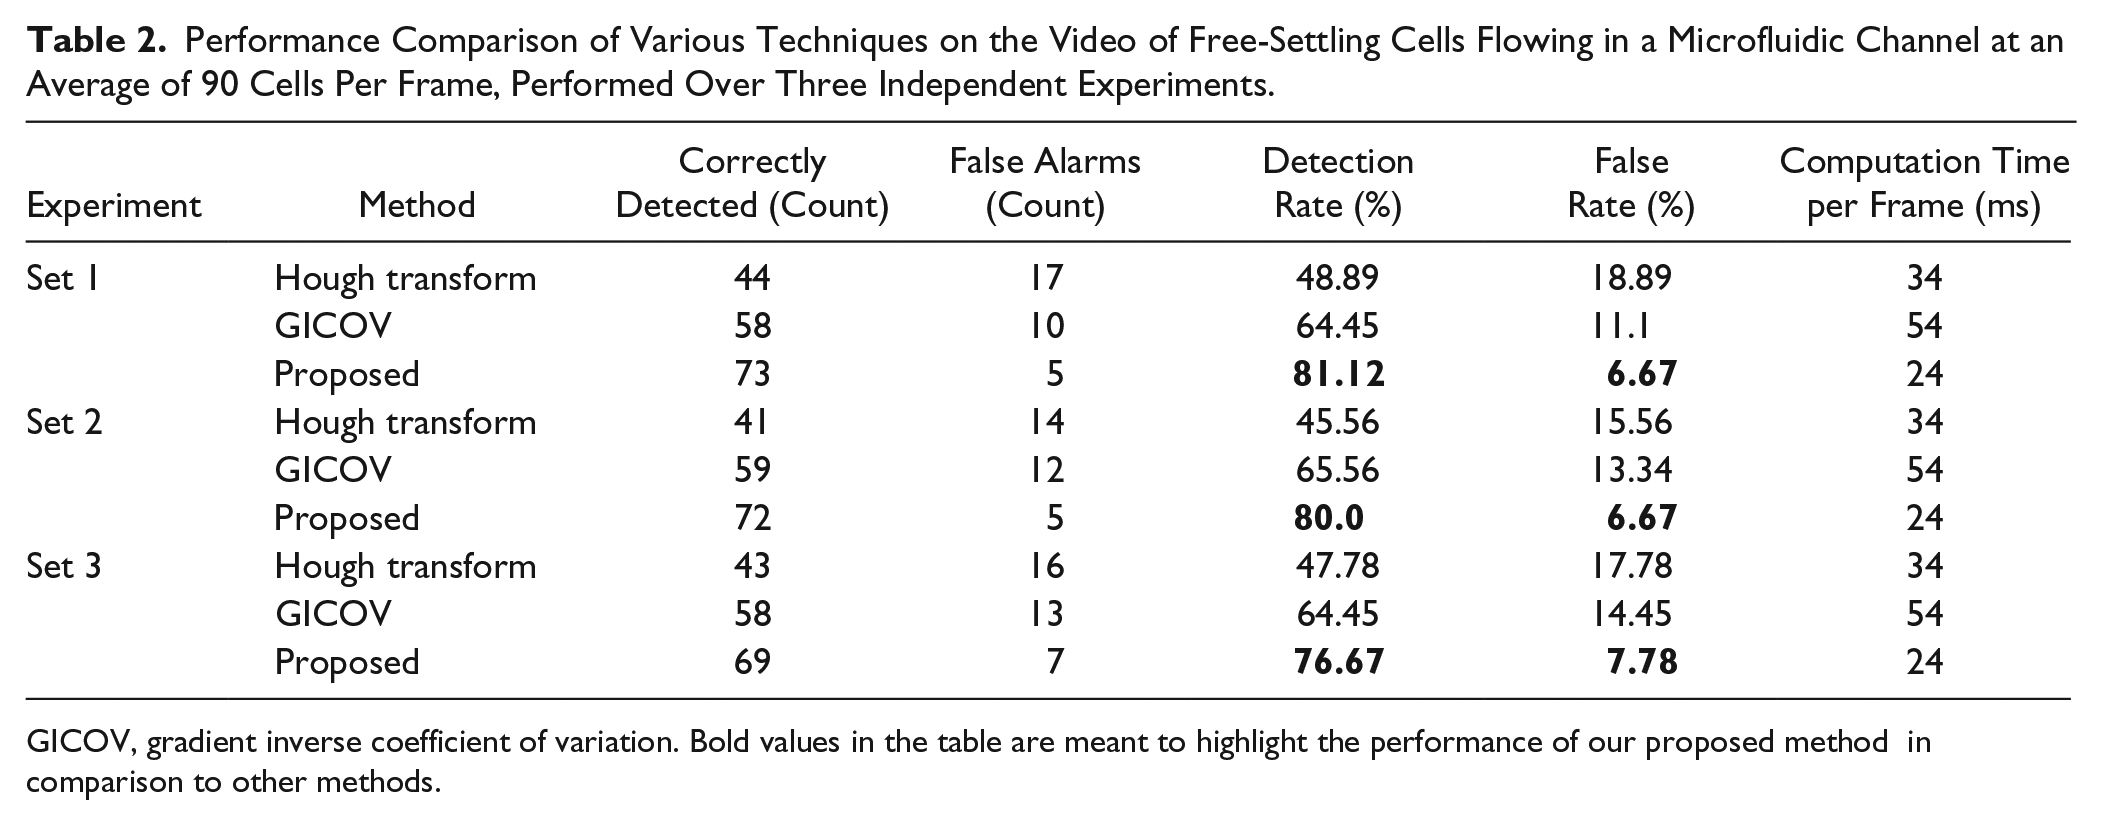
GICOV, gradient inverse coefficient of variation. Bold values in the table are meant to highlight the performance of our proposed method in comparison to other methods.
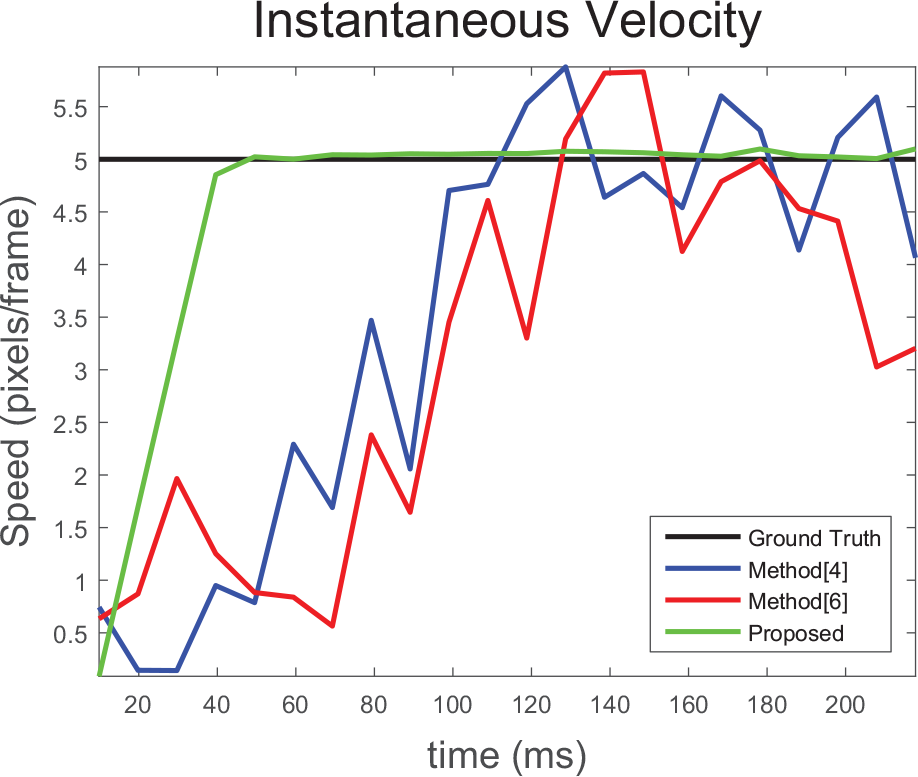
To evaluate the accuracy of tracking and speed estimation, a test case containing a single circular blob with a speed of 5 pixels per frame is synthesized as shown in Figure 7 , and using this, the methods, optical flow, 4 the particle filter, 6 and cell tracking using centroid displacement 21 are compared. The number of particles chosen for the particle filter by Cui et al. 6 is 50. The position estimates fed to the filters are corrupted by the noise assumed earlier. Figure 8 shows the speeds estimated at different time instants. Methods by Markandey et al. 4 and Yoshikawa et al. 21 use vector gradient to estimate the velocities. Since noise contains high-frequency components, the gradient exacerbates the noise amplitudes, which increases the error in estimating velocity components and hence the speed. A particle filter assumes a nonlinear motion model with complex state probability density. It was found to have a higher speed error by 10% to 15% and higher computation time by 20% to 25% compared with the proposed speed estimation technique described earlier. From Figure 8 , we can observe that our proposed speed estimation algorithm converged in 66 ms with an error percentage less than 2%, while other methods took more than 100 ms with more than 10% error.
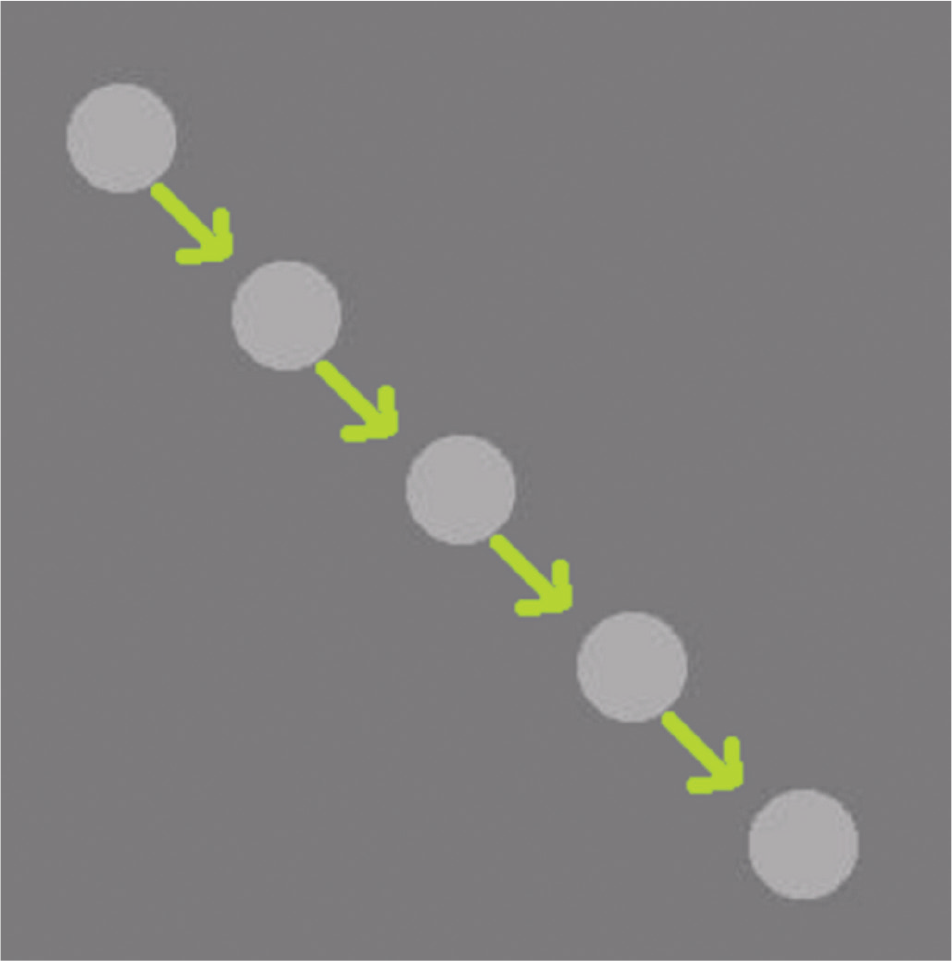
Synthesized test case of a circular blob whose motion in each frame is indicated by the green arrows to evaluate the speed performance with the state-of-the-art techniques.
As observed from Table 1 , Table 2 , and Figure 8 , our algorithm performs better with respect to other state-of-the-art algorithms for the detection and tracking in a video containing a high density of cells. This comparison considered the parameters of detection accuracy, errors in estimating cell-settling velocities, and computation time. Since the cell identification accuracy is high even in high cell density images, which often pose challenges due to background noise, our method is a better alternative for tracking settling cells in a high-cellularity solution, like that encountered in a typical ESR test.
Conclusion
In conclusion, we have developed real-time cell-tracking algorithms to observe freely settling RBCs in a microfluidic microscopy-based setup. This is an effort to re-create the ESR test’s analysis using the microfluidic environment to reduce test time and for better accuracy. The accuracy in detecting cells and estimating their velocities was 79.3% for cells in a dynamic background containing high noise. This accuracy gives enough room for settling velocity–based analysis of individual cells or aggregates. The proposed algorithm outperforms previous cell-tracking algorithms in terms of computational time and accuracy of cell tracking. We expect the test to be developed further with automatic translation stages to observe cell velocities at different lengths of the microfluidic channel. The conventional ESR is about a generation-old bulk test, which needs replacement with better quantitative methods. We hope that the development of this microfluidic cell tracking–based method will enable the development of methods that provide automated, quick, and reliable cellular clinical testing protocols.
Footnotes
Acknowledgements
We would like to thank Mr. Abhishek Pathak and Mr. Rajesh Srinivasan for his aid in preparation of blood samples. We also acknowledge Mr. Jayesh Adhikari for preparing illustrative schematics.
Declaration of Conflicting Interests
The authors declared no potential conflicts of interest with respect to the research, authorship, and/or publication of this article.
Funding
The authors disclosed receipt of the following financial support for the research, authorship, and/or publication of this article: This research was supported by the Innovative Young Biotechnologist Award (IYBA) 2013 by the Department of Biotechnology (DBT) of the Government of India. It was also partially supported by the University Grants Commission Centre for Advanced Study program.