
Abstract
Current treatment strategies for chemotherapy of cancer patients were developed to benefit groups of patients with similar clinical characteristics. In practice, response is very heterogeneous between individual patients within these groups. Precision medicine can be viewed as the development toward a more fine-grained treatment stratification than what is currently in use. Cell-based drug sensitivity testing is one of several options for individualized cancer treatment available today, although it has not yet reached widespread clinical use. We present an up-to-date literature meta-analysis on the predictive value of ex vivo chemosensitivity assays for individualized cancer chemotherapy and discuss their current clinical value and possible future developments.
Current strategies for cancer chemotherapy were developed by demonstrating improved efficacy in patient cohorts defined by similarity of diagnosis and other clinical variables. In practice, the clinical response is heterogeneous within these groups, and drug treatment of cancer very much remains a trial-and-error endeavor. It stands to reason that great benefits are collectable from further personalizing treatment, both for the individual patient and society.
Tailored, individualized, and personalized therapy and precision medicine are terms used interchangeably and are in no manner well defined, but all of them allude to the improved treatment efficacy expected from choosing the most appropriate treatment for each patient. 1 In terms of drug therapy of cancer, this means identifying subgroups that benefit from a specific drug or drug combination. For instance, consider a theoretical scenario in which two treatments, A and B, are available for first-line treatment. Assume they have comparable expected response rates of ~20%, yielding no obvious a priori preference for one over the other, and that they have different mechanisms of action and are structurally different so that the response rates are statistically independent. If that is the case, the overall response rate in this treatment line can be increased to 36% if a highly accurate (close to 100% accuracy) predictive test for drug resistance for one of the drugs is available. For example, if a test is available for drug A, 20% of patients will receive and respond to drug A. The remaining 80% are treated with drug B, and 20% of those respond, that is, 16% of all patients. In total, then, 36% of all patients respond, yielding a 1.8-fold increase in response in the first line of treatment. Also, if an accurate test for drug B is available as well, patients predicted to be resistant to both drugs can be referred to clinical trials or supportive care.
Recent years have seen the arrival and clinical use of predictive tests for specific drugs, in particular novel targeted therapies. For example, Her-2 expression in breast and gastric cancer supports treatment with trastuzumab, and the mutation status of RAS and EGFR-TK in colorectal cancer and non–small-lung cancer, respectively, is decisive for the use of inhibitors of the Erb-B pathway and BRAF mutation status in melanoma for the use of BRAF inhibitors. 2 An inherent problem with target-based biomarkers is that they test only for the presence of the drug target and do not account for resistance mechanisms unrelated to the target. Another issue is the emerging consensus that even so-called target drugs, in particular receptor-kinase inhibitors, exhibit a wide spectrum of activities in the cell (i.e., polypharmacology), which are not tested for.
Targeted drugs are a new, highly welcome addition to the chemotherapeutic arsenal, but classical cytotoxic drugs that target all proliferating cells remain the pillar upon which cancer treatments are still built. Thus, there is a need for predictive tests that can guide choice of classical chemotherapeutic agents as well as novel targeted drugs. The perhaps most direct approach is to use in vitro chemosensitivity as a proxy. The idea to directly measure the drug sensitivity of the patient’s tumor cells to individualize treatment choice is natural and already has a long history. 1
There are several different methods for measuring sensitivity to cancer drugs, each with specific technical features that make them more or less suited for clinical use. Assessment of drug sensitivity ex vivo is based on the basic premise that if a chemical compound is inactive when the tumor cells are directly exposed to it in a test tube, it is unlikely that the compound will be able to kill cancer cells in the patient. An overview of different methods for ex vivo drug sensitivity testing is shown in Table 1 .
Overview of the Most Common Methods for Cell-Based Tests.
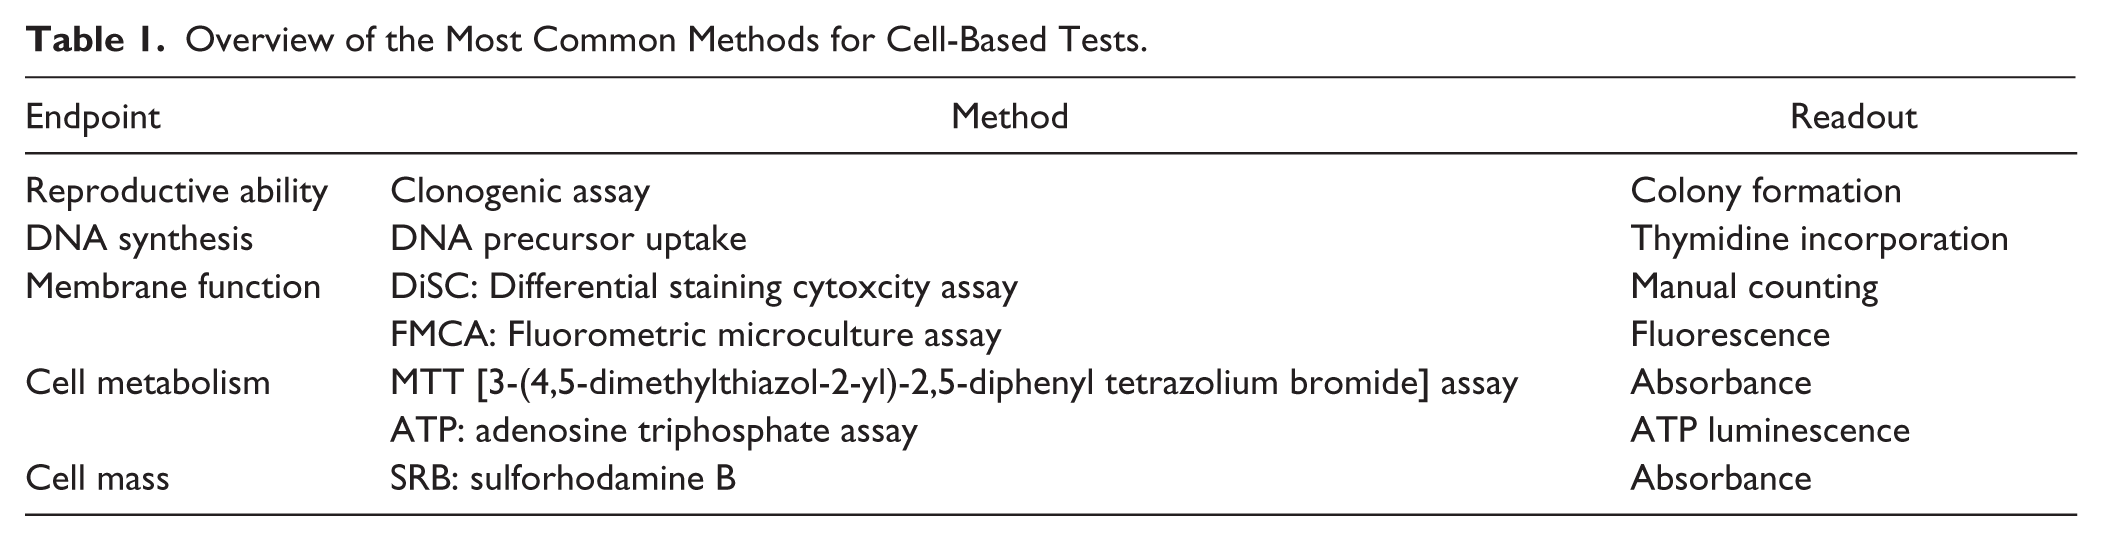
The choice of method is critical. Early on in the development of resistance tests for cancer drugs, the colony-forming ability after drug exposure was measured. 3 This method is in line with the cancer stem cell hypothesis that only a small percentage of immature cells in the cancer cell population are able to grow and differentiate. Unfortunately, the method is technically challenging, and the frequency of successful analyses, the evaluability rate, was low. It was subsequently shown that so-called total cell kill assays that measure early cell damage in the entire tumor cell population, and not only in the colony-forming or proliferating cells, correlate equally well with clinical treatment outcomes as the earlier mentioned test methods and is technically more robust with higher evaluability rates.4,5
One of the first total cell kill methods that showed good correlation with treatment outcome was the differential staining cytotoxicity assay.4,5 The method is based on staining of viable and nonviable cells in drug-exposed cultures. The method has many advantages but requires great technical expertise, both in performance and in the evaluation of drug effect in the microscope. To increase the sample throughput, methods with automated readout are preferable.
There are currently several methods to measure cell viability, most developed to be suitable for screening in drug development. The reagents vary, but the main analysis principles are measurement of metabolic activity, cell mass, or cell membrane integrity. The [3-(4,5-dimethylthiazol-2-yl)-2,5-diphenyl tetrazolium bromide] (MTT) assay is based on colorimetric measurement of a formed insoluble purple salt in metabolically active cells. 6 Another method measures the metabolic activity of the cells based on the measurement of cellular adenosine triphosphate (ATP) by luminescence. 7 The amount of ATP correlates directly with the number of cells. Another way is to measure the cell mass with the use of sulforhodamine B (SRB), which binds to proteins in fixed cells. 8 A disadvantage of the SRB method is that it does not measure the viable cells and therefore assumes that proteins from dead cells have disappeared from the culture. Methods that measure intact cell membranes include the fluorometric micro culture cytoxicity assay.9,10 The analysis principle is that esterases in cells with intact plasma membranes hydrolyze fluorescein diacetate to fluorescent fluorescein.
A key feature of total cell kill assays is that the expected response to individual drugs can be predicted directly from the assay outcome in contrast to, for example, gene or protein expression profiles that mostly reflect a more general state of resistance or sensitivity and have been found bioinformatically challenging to analyze. Thus, because drug sensitivity assays based on total cell kill are still considered relevant to use in the development toward precision medicine in oncology, we present a literature meta-analysis of published ex vivo/in vivo chemosensitivity correlations considered to reflect the potential clinical utility of these assays.
Materials and Methods
Published articles reporting correlation data between individual ex vivo chemosensitivity from total cell kill assays and clinical tumor response were retrieved using a PubMed search in mid-2016 and added to a database along with articles referenced in retrieved articles. The period covered for the literature search was 1983 to mid-2016. Only articles reporting sufficient data (i.e., ex vivo drug activity combined with clinical tumor response in individual patients allowing for calculation of assay sensitivity and specificity) were included. No distinction was made between retrospective and prospective correlations, with the former constituting the majority. As far as possible, data overlap was avoided; that is, in the case of several reports from the same authors with potentially overlapping data, only the most updated report was used for data collection.
Most of the correlations collected were for patients who received combination treatments. In those cases, the ex vivo result was determined by the most active drug tested in the combination treatment used in vivo. The response data reported by the study authors were used if available; if not, any observable response (complete or partial remission) was considered in vivo sensitive, and all other responses were considered as in vivo resistant (no change, stable disease, progressive disease). Thus, a true-positive (TP) correlation corresponds to clinical response (complete or partial remission) and at least one of the drugs used in treatment showing ex vivo sensitivity, whereas a true-negative (TN) correlation corresponds to none of the drugs used testing sensitive and the patient showing no response. False-positive (FP) correlations correspond to at least one drug used in the treatment showing ex vivo sensitivity although the patient showed no response and, finally, false-negative (FN) correlation as none of the drugs used showing ex vivo sensitivity although the patient had a clinical response.
Sensitivity (%) was calculated as
Confidence intervals were calculated using the Clopper-Pearson method at 95% confidence, and the significance test used Fisher’s exact test in R 3.2.3. 11 The figure was drawn using the ggplot2 12 R-package.
Results
Predictive Performance of Ex Vivo Chemosensitivity Assays
Table 2 summarizes the 1835 individual patient correlations of ex vivo chemosensitivity and in vivo response collected from the 34 reports we were able to retrieve. The studies therein cover a wide range of diagnoses, and for many, only very few observations are available. Most of the correlations are for patients who received combination treatments, in which case the effect of the combination was taken to be predicted by the most active single agent, as described in the Materials and Methods section. The overall sensitivity was 88% (CI: 86%-90%) and specificity 72% (CI: 68%-75%), and the performance does not vary greatly between different diagnoses and assays.
Overview of Ex Vivo/In Vivo Correlations.
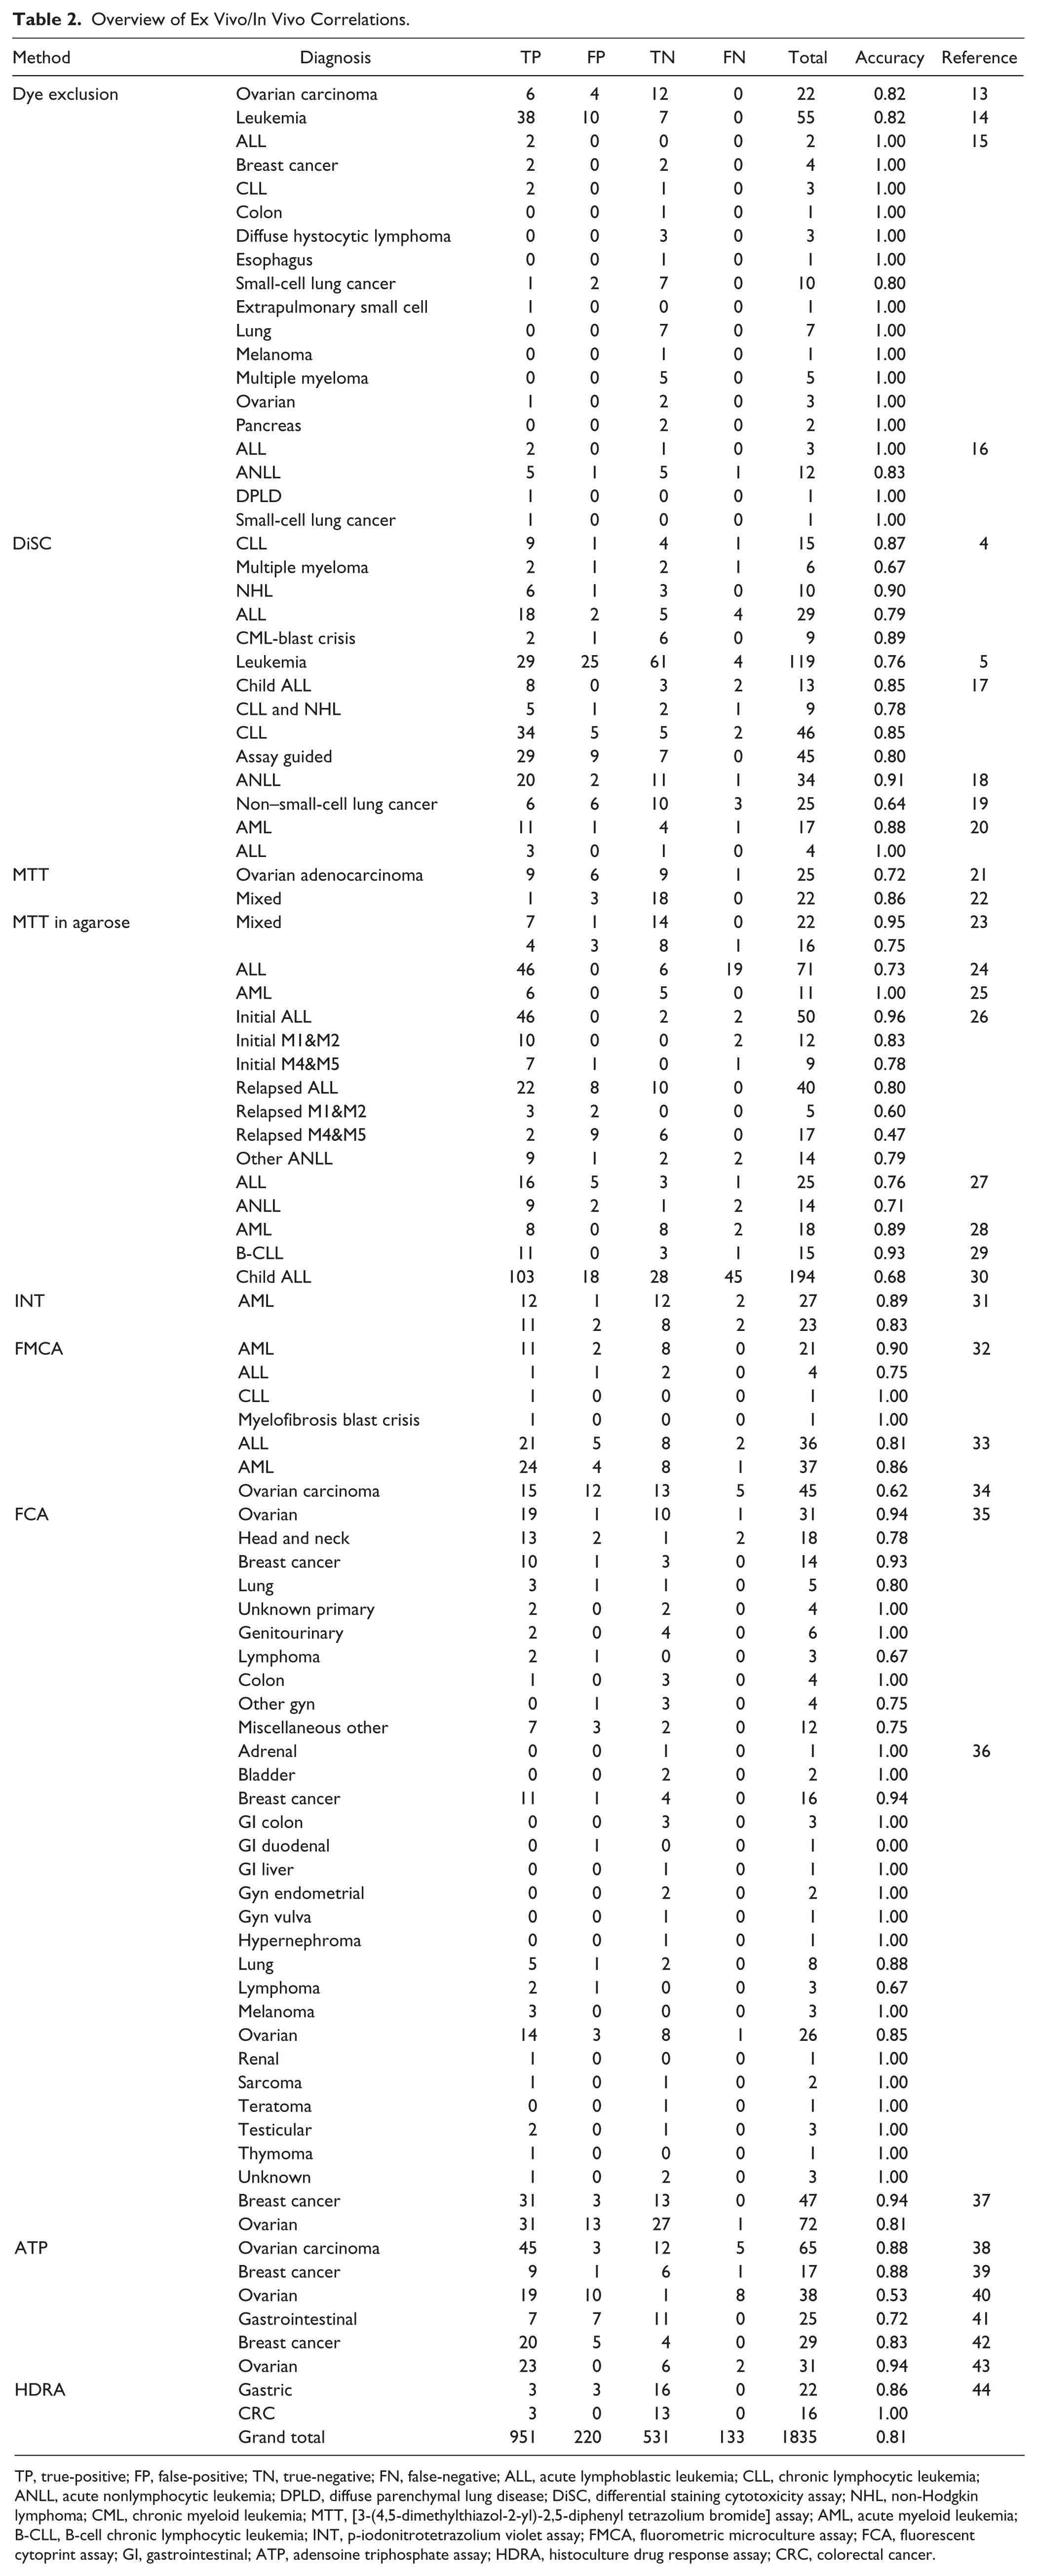
TP, true-positive; FP, false-positive; TN, true-negative; FN, false-negative; ALL, acute lymphoblastic leukemia; CLL, chronic lymphocytic leukemia; ANLL, acute nonlymphocytic leukemia; DPLD, diffuse parenchymal lung disease; DiSC, differential staining cytotoxicity assay; NHL, non-Hodgkin lymphoma; CML, chronic myeloid leukemia; MTT, [3-(4,5-dimethylthiazol-2-yl)-2,5-diphenyl tetrazolium bromide] assay; AML, acute myeloid leukemia; B-CLL, B-cell chronic lymphocytic leukemia; INT, p-iodonitrotetrazolium violet assay; FMCA, fluorometric microculture assay; FCA, fluorescent cytoprint assay; GI, gastrointestinal; ATP, adensoine triphosphate assay; HDRA, histoculture drug response assay; CRC, colorectal cancer.
In Figure 1 , the posttest response rates of each study and diagnosis have been plotted (red symbols correspond to TP rates and green to 1-TN rate; the size is proportional to the number of correlations). In addition, the aggregated response rates across multiple studies are plotted for breast cancer, gastrointestinal cancer, acute myeloid leukemia, and acute lymphoblastic leukemia (ALL), for which 95% confidence intervals are given as error bars. Solid lines correspond to the predicted posttest response rates as calculated from the overall sensitivity and specificity for the ex vivo assays.
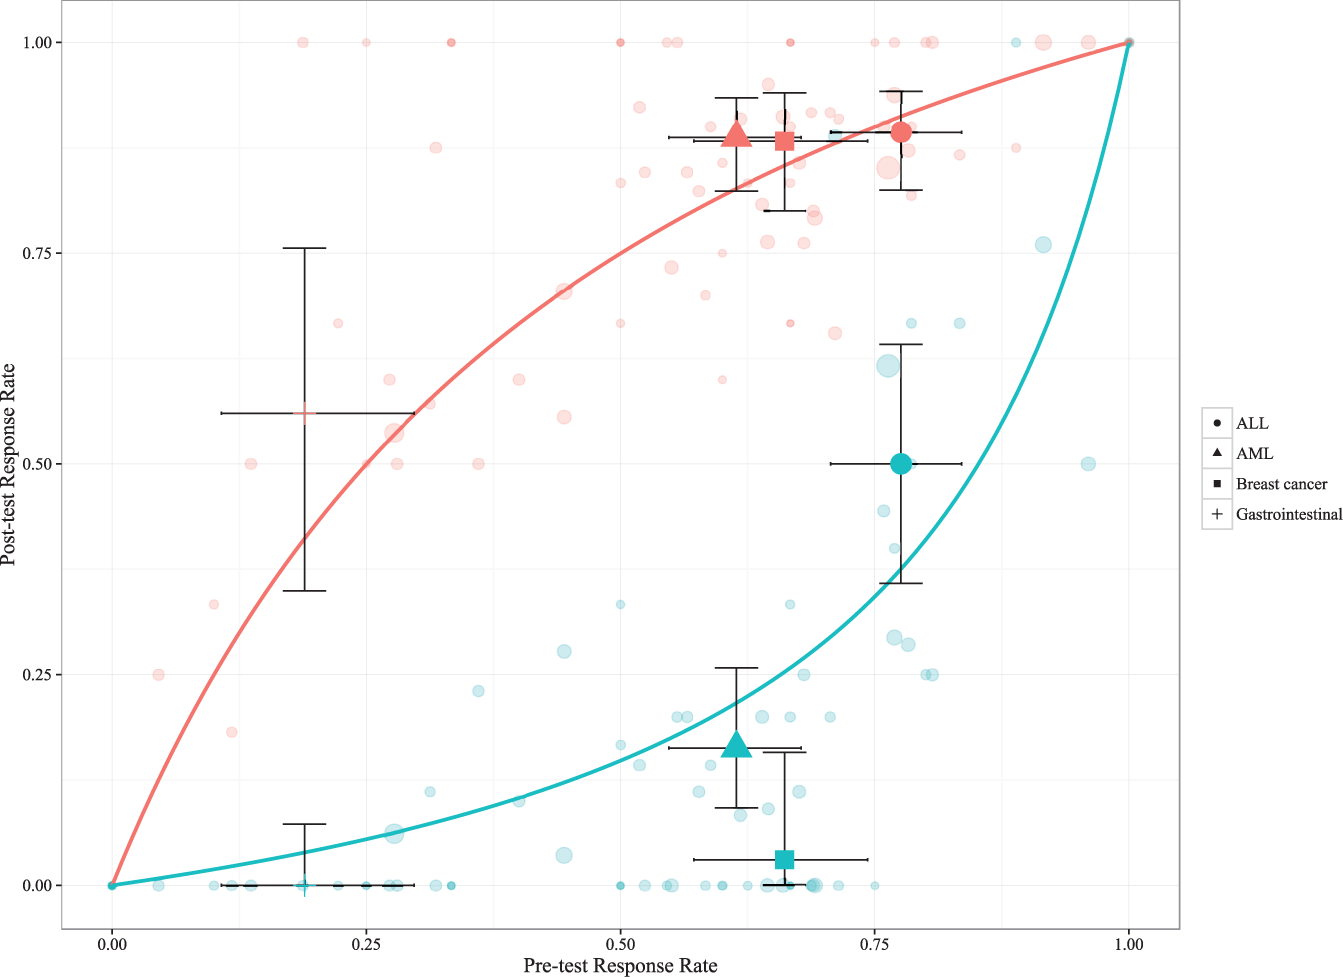
Horizontal axis indicates the overall response rate and vertical axis posttest response rate. Each study and diagnosis yields two points for a given overall response rate; red circles correspond to the true-positive rate and green circles to 1 – true-negative rate. The size of all symbols is proportional to the number of correlations. In addition, the aggregated response rates across multiple studies are plotted for breast cancer, gastrointestinal cancer, acute myeloid leukemia, and acute lymphoblastic leukemia, for which 95% confidence intervals are given as error bars. Solid lines correspond to the predicted posttest response rates as calculated by the overall sensitivity and specificity.
To exemplify the potential clinical relevance of an assay, a patient with metastatic colorectal cancer is expected to have a 50% probability to respond to first-line combination chemotherapy (e.g., 5-fluorouracil [5-FU] combined with oxaliplatin [pretest response rate on the horizontal axis based on the clinical experience from this disease and treatment]). Assuming the most active drug determines the response and a cell-based chemosensitivity assay indicates resistance to both drugs, the probability that the patient will respond to 5-FU with oxaliplatin goes down to approximately 15% (posttest response rate, green line). If, on the other hand, the assay indicates that at least one of the drugs is active, the probability that the patient will respond goes up to approximately 75% (posttest response rate, red line).
Apart from a number of small data sets that exhibited perfect separation (posttest response rates of 1[0] for sensitive [resistant]), most studies, regardless of diagnosis and/or assay, reported similar sensitivity and specificity.
Interestingly, the sensitivity and specificity observed for the ex vivo chemosensitivity tests are on par with what has been reported for a pharmacogenomic predictor of response to neoadjuvant chemotherapy (T/FAC: paclitaxel, 5-FU, doxorubicin, cyclophosphamide) in breast cancer: 92% sensitivity and 71% specificity (n = 51). 45
Prospects for Tailoring Therapies
The majority of all correlations were derived from the clinical response to a diagnosis-specific standard drug combination, which leaves the question of the value of the predictive performance for single drugs open. However, among the correlations, single-drug treatments were also included. For instance, for fludarabine in chronic lymphocytic leukemia and non-Hodgkin lymphoma (n = 9), a sensitivity of 83% (CI: 36%-100%) and specificity of 67% (CI: 9%-99%) were reported, 17 and for prednisolone in ALL (n = 71), a sensitivity of 71% (CI: 58%-81%) and specificity of 100% (CI: 54%-100%) were reported. 24 Thus, the predictive performance for single-drug treatments is in line with that for combination therapies.
Hypothetically, a combination therapy combining ex vivo sensitive drugs could result in in vivo antagonism, and conversely, a drug combination in which all constituent drugs are inactive could prove active in combination (i.e., show synergism). Indeed, in a small study on gastrointestinal cancer with an ATP endpoint, Kawamura and colleagues 41 reported a higher predictive accuracy when using the ex vivo test result of the combination actually used in vivo instead of a most active drug classification from the constituent drugs (88% vs. 69%, n = 16). The difference, although not statistically significant (p = 0.39), resulted from a higher TP rate (positive predictive value) for the combination test, suggesting fewer FPs that would arise from in vivo antagonism.
Much of the data analyzed are retrospective and do not necessarily reflect the test performance if the assay results are used to guide the treatment. However, 70 correlations were retrieved from assay-guided treatment,17,19 with an aggregate sensitivity of 92% (CI: 79%-98%) and specificity of 53% (CI: 35%-71%). Although the estimated specificity is markedly low, the performance is consistent with the overall performance reported above.
Discussion
A remarkable finding when it comes to the predictive accuracy of the total cell kill assays is that the correlation between the test and clinical outcome does not obviously depend on the diagnosis and/or the method of use. Roughly, the sensitivity and specificity of these methods are 90% and 70%, respectively, for prediction of tumor response. Notably, we retrieved no study reporting ex vivo–in vivo correlations in terms of tumor response more recent than the year 2000. The reason for this is not fully clear but is suggested to be because such assay performance data, as reported here, has been established so there is little incentive to publish new reports on this subject.
Higher sensitivity than specificity is expected due to mechanisms of resistance in vivo in addition to those at the cellular level; that is, FPs are to be expected because of, for example, pharmacokinetic variation between patients. Indeed, several studies have demonstrated that therapeutic drug monitoring to ensure optimal exposure to chemotherapeutics improves survival. 46 Nevertheless, if the tumor cells are highly resistant ex vivo, there is only a small chance that the drug will be active in vivo. This means that chemosensitivity assays are better at prediction of in vivo resistance than sensitivity.
Despite the rather impressive performance of ex vivo chemosensitivity assays, they have not become part of clinical routine when deciding on a therapy. This probably stems from the lack of evidence in the form of prospective correlations. Furthermore, increased response rates do not necessarily translate into increased survival. More evidence is needed from clinical trials showing increased survival using assay-guided therapy compared with physician’s choice of therapy. The gold standard for medical evidence is the randomized controlled trial.
To date, there are very limited data from such trials for ex vivo chemosensitivity assays. One small study on platinum refractory ovarian cancer randomized between therapy based on a cell-based cytotoxicity test and the choice of the treating physician. 47 The assay-guided arm tended to give a higher fraction of tumor responses and longer progression-free survival, but the difference did not reach statistical significance. However, in a retrospective analysis, the authors noted that the difference was statistically significant for patients enrolled early in the study and that physicians were prescribing treatments often suggested by the assay in the physician’s choice treatment arm toward the end of the study.
The evidence for tailoring therapy from a wide selection of targeted drugs based on target biomarkers is also currently lacking. In a recent study, 48 patients with treatment-refractory solid cancer were randomized to treatment with a targeted drug selected from molecular mapping of cellular signal transduction pathways in fresh biopsies or to the clinician’s choice of treatment, which was mostly cyclophosphamide. No difference was observed with respect to tumor response or progression-free survival.
A large randomized control trial is a major financial undertaking beyond the resources of academia, and to date, no pivotal trials have been published for cell-based chemosensitivity tests. This contrasts with the situation for specific predictive markers for individual targeted drugs. Resource-strong pharmaceutical companies, driven by the hope of future economic gains from selling their compounds, have a vested interest in finding specific biomarkers for their drugs. For obvious reasons, however, these same players have no interest in including more generic biomarkers, such as cell-based tests or gene expression analysis, with the potential to predict effects of many different drugs in their studies.
The reason why the randomized controlled trials of increased survival from tailored therapy cited above were negative could be due to several factors. First, the studies conducted were quite small, and the patients recruited had drug-resistant tumors. Second, it is unlikely that a single biomarker or assay can provide all the relevant information for optimal choice of therapy. However, various technologies could provide pieces of information in an advanced bioinformatic puzzle that needs to be solved. Thus, in a study designed to investigate the power of predictive tests, one could compare in the context of a randomized study the current routine with empirically based drug treatment to tailored treatment in cancer diagnoses in which markers are promising. The tailored treatment could be based on weighted information from, for example, therapeutic drug monitoring, ex vivo chemosensitivity testing, gene expression, and analysis of individual genes and proteins known to be linked to the effect of certain drugs. Such an approach, if found to be successful and to be introduced into the clinical routine, would require new expert clinical specialties in the form of clinically orientated bioinformatics and “laboratory oncologists” who could analyze, interpret, and weigh all the parameters and information needed for an optional and individual choice of therapy.
From existing evidence, two clinical applications of ex vivo chemosensitivity testing could be suggested: first, to exclude drugs for treatment based on ex vivo drug resistance, especially in patients with low pretest probability, and second, to enable informed choices between different treatment regimens considered equally effective from current clinical knowledge.
An alternative area of use for cell culture–based compound testing is as a potentially predictive biomarker regarding the information that can be collected within clinical studies for a specific compound. The tests can also be used to help identify the best diagnosis for a specific new compound to start with in clinical trials of a new compound following activity comparison between diagnoses in a panel of different tumor types ex vivo.
Finally, as we demonstrate here, there is little variation in performance between different ex vivo chemosensitivity assays. Thus, an important focus is to reduce cells needed for the test to allow for testing of as many drugs as possible. Also, a limitation of ex vivo chemosensitivity assays we analyze here is that only drugs that act directly on the tumor cells can be assayed. Drugs that target stroma (e.g., angiogenesis inhibitors) or modulate the immune response will require development of novel assays that can account for interactions between different cell types.
Footnotes
Declaration of Conflicting Interests
The authors declared no potential conflicts of interest with respect to the research, authorship, and/or publication of this article.
Funding
The authors received no financial support for the research, authorship, and/or publication of this article.