
Abstract
Although medical cancer treatment has improved during the past decades, it is difficult to choose between several first-line treatments supposed to be equally active in the diagnostic group. It is even more difficult to select a treatment after the standard protocols have failed. Any guidance for selection of the most effective treatment is valuable at these critical stages. We describe the principles and procedures for ex vivo assessment of drug activity in tumor cells from patients as a basis for tailored cancer treatment. Patient tumor cells are assayed for cytotoxicity with a panel of drugs. Acoustic drug dispensing provides great flexibility in the selection of drugs for testing; currently, up to 80 compounds and/or combinations thereof may be tested for each patient. Drug response predictions are obtained by classification using an empirical model based on historical responses for the diagnosis. The laboratory workflow is supported by an integrated system that enables rapid analysis and automatic generation of the clinical referral response.
Introduction
Cancer drug development has focused on finding drugs that provide benefit at the group level to groups of similar patients. However, in clinical reality, drug response is heterogeneous, and for the individual patient, one out of several alternatives with seemingly equal efficacy at the group level may be better. This is frequently observed in clinical practice in oncology when standard first-line chemotherapy fails but tumor response is achieved by next-line therapy. A large part of this variation is due to intrinsic differences in the chemosensitivity of the tumor cells. If tumor cell drug sensitivity is assessed prior to start of therapy, drugs can be selected that provide the best chance of benefit to the individual patient. 1
Ex vivo assessment of the activity of cancer drugs acting directly on the tumor cells is based on the simple premise that if a drug is ineffective when the tumor cells are directly exposed to the drug in a test tube, it is unlikely to have effect in vivo. 2 The choice of assay endpoint is critical. Earlier work used cell proliferation assays, but later it was recognized that the effect of most, if not all, cancer chemotherapeutics is derived from induction of apoptosis in the tumor cells. In light of this new knowledge, total cell kill assays were developed and considered to be a more relevant endpoint. 3
The accuracy of chemoresistance testing in relation to the outcome in the clinic has been reiterated in study after study. Total cell kill assays report a sensitivity of approximately 90% and specificity of 70% for predicting response and resistance to treatment, respectively, essentially regardless of diagnosis.4–6 A higher sensitivity than specificity is expected because there are several mechanisms for resistance other than those at the cellular level, but if the tumor cells are inherently resistant, it is unlikely that the drug will have effect. It should be noted that in contrast to emerging tests based on gene expression and status of specific genes, cell culture drug resistance tests provide a functional test for any panel of drugs.
Regardless of the endpoint used in a cell-based assay, the basic workflow is the same ( Fig. 1 ). Once the patient sample is received, tumor cells must be prepared for the assay. A panel of drugs to be tested is chosen based on the tumor type and clinical situation. The assay results are analyzed, and a clinical referral response is prepared. Here we describe our setup for rapid generation of tumor cell drug activity data. We describe our sample preparation procedure, our short-term fluorometric microculture cytotoxicity total cell kill assay, and the statistical evaluation of drug response by empirical references. In addition, we describe our lab workflow and computational infrastructure for generation of clinical referral responses.
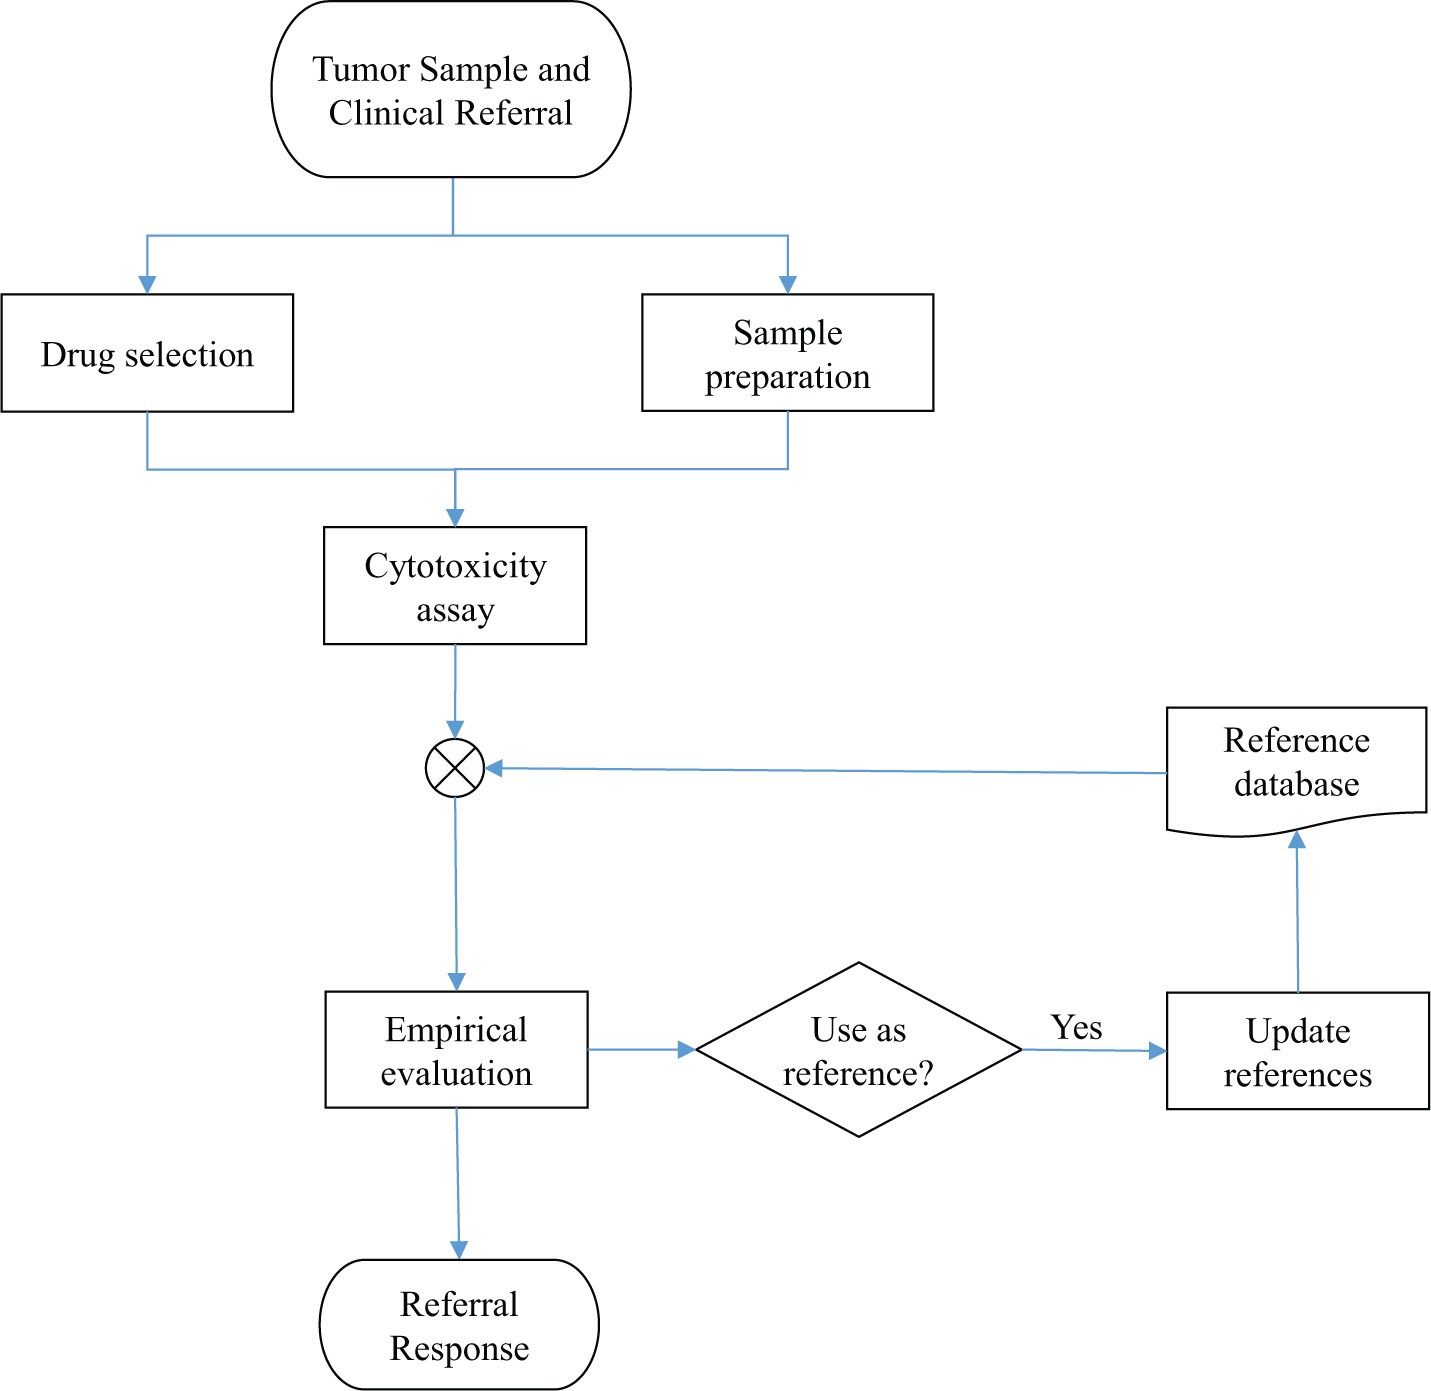
Workflow of our chemoresistance assay. The tumor sample is received together with a clinical referral. A panel of selected drugs is assayed and evaluated using a database of reference values. From this evaluation, the referral response is generated. Samples passing the quality requirements are added to the reference database.
Ex Vivo Drug Activity Testing
The analysis proceeds essentially as depicted in Figure 1 (each step described in detail below). The choice of drugs to assay is made in consultation with the referring physician based on the diagnosis and treatment history of the patient. In parallel, biomedical scientists prepare the sample for analysis. The drugs selected for testing are added to a microtiter plate that is seeded with the patient tumor cells, and the cytotoxic effect of drugs is assayed using the fluorometric microculture cytotoxicity assay (FMCA). The assay endpoint is based on cell count relative to untreated control, reported as percentage surviving cells (survival index percentage [SI%]).
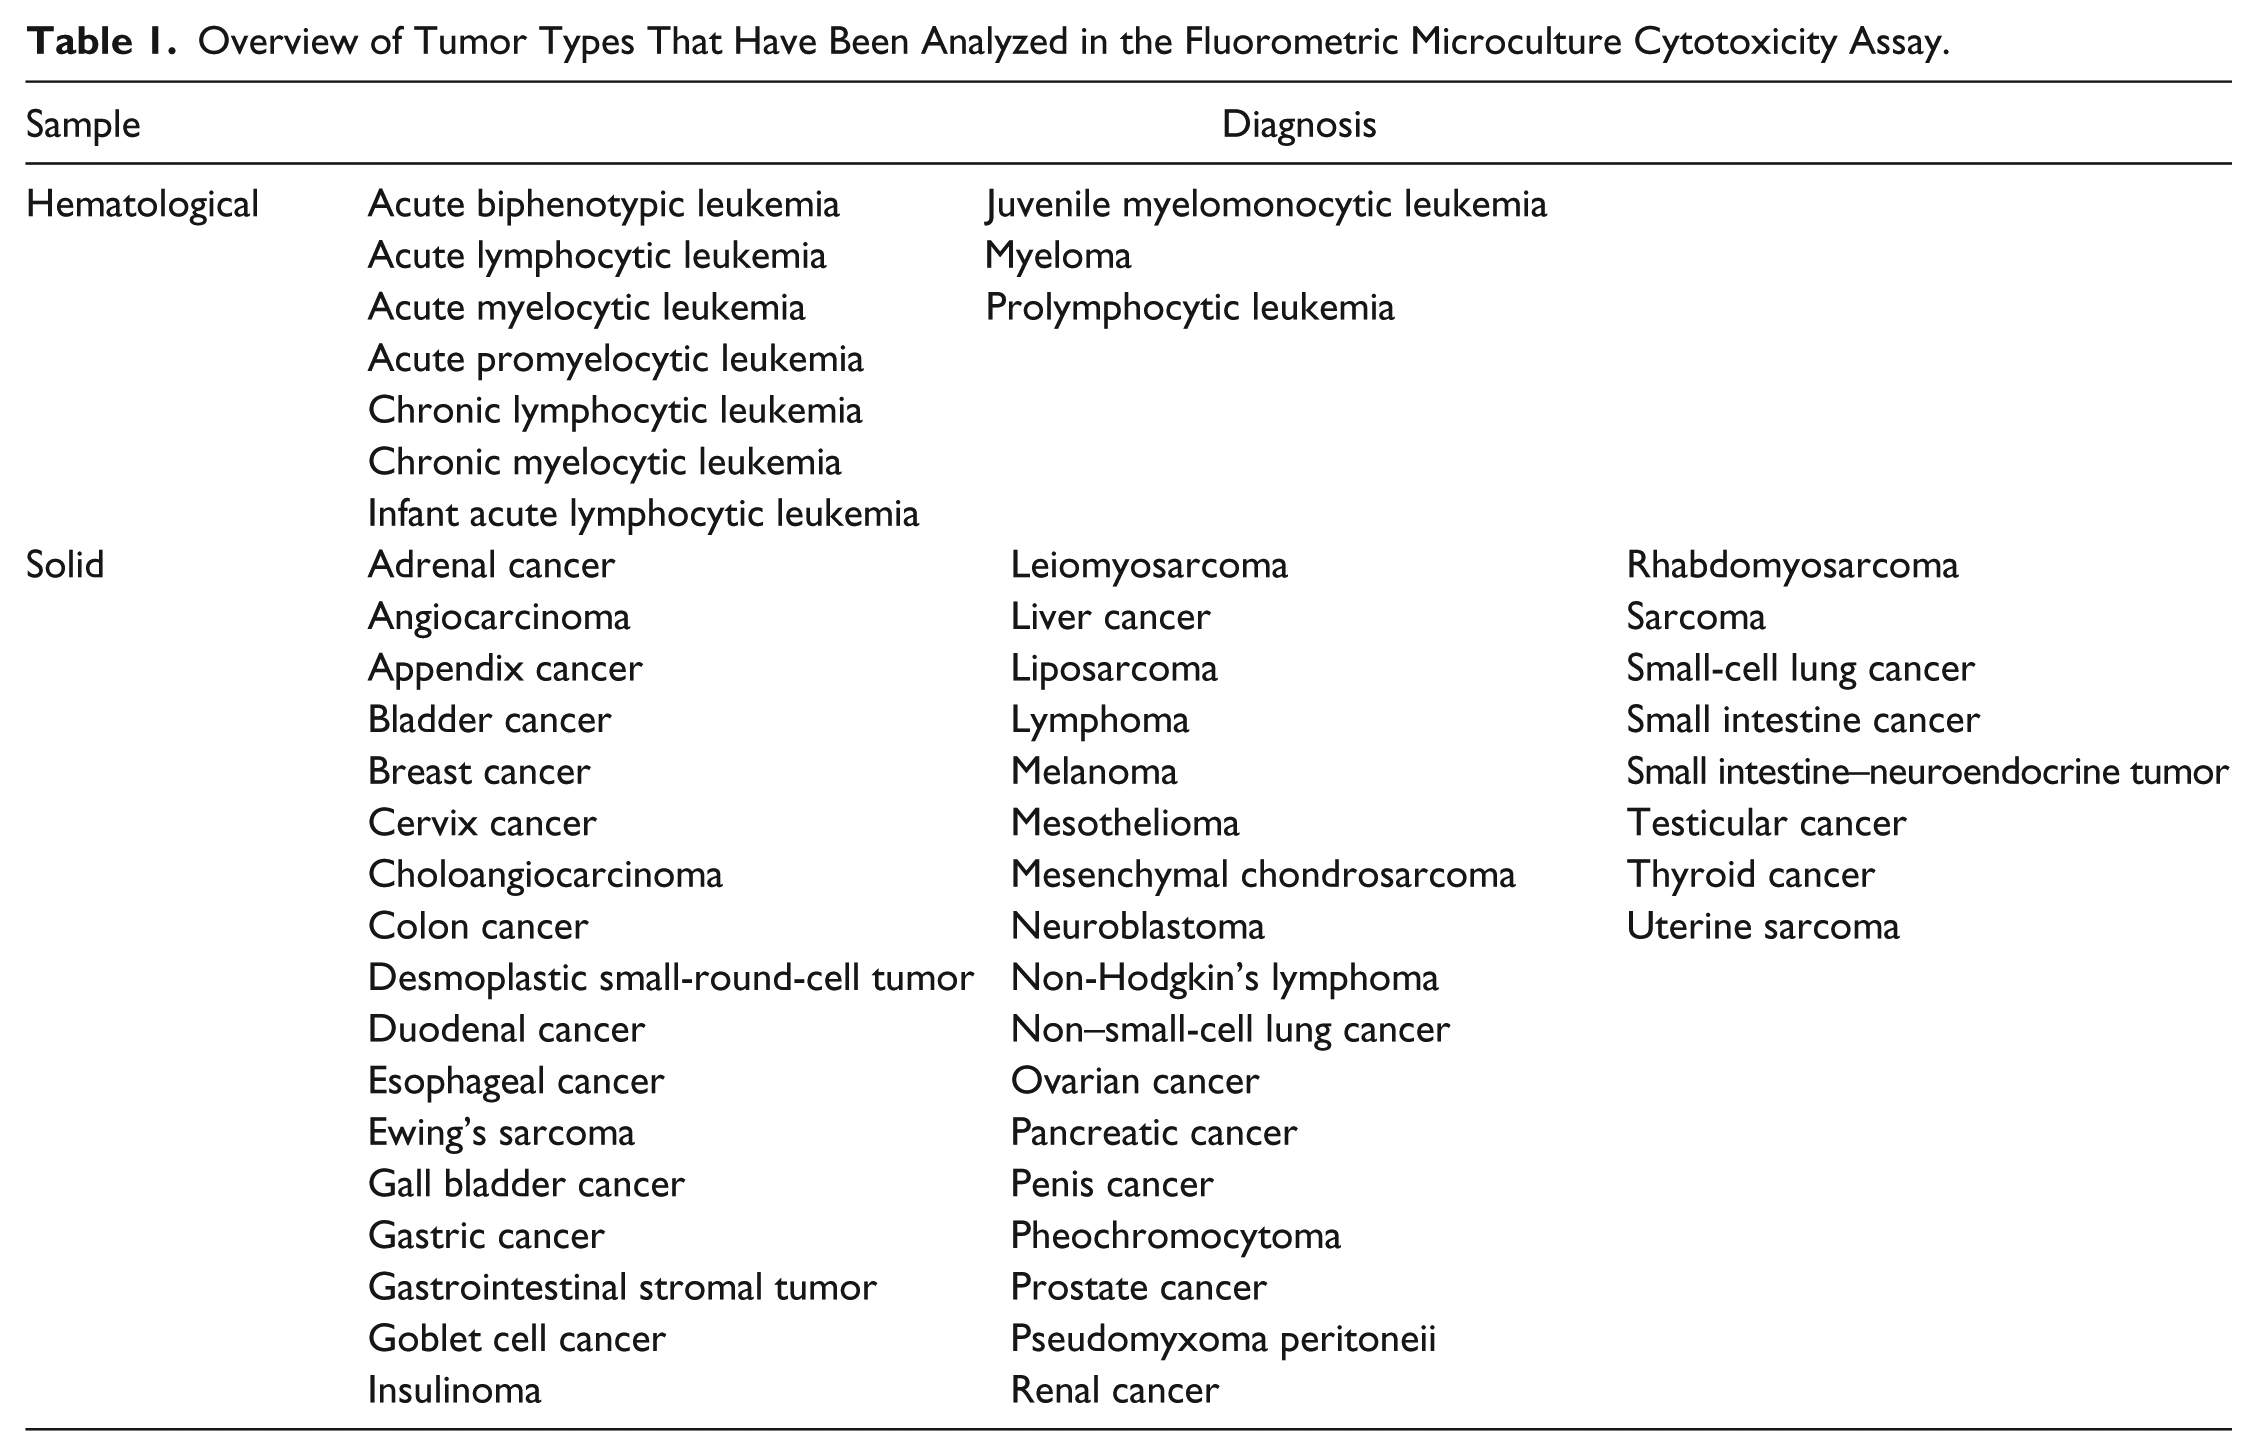
The SI% values are then compared with cumulated data from the same assay to obtain a resistance classification. Currently, three classes are used: low drug resistance (LDR), intermediate drug resistance (IDR), and extreme drug resistance (EDR). The cumulated data used are formed from similar samples, ideally of the same diagnosis and treatment history. However, if too few samples are available to obtain robust estimates of the thresholds used for classification, a more general collection of samples can be used (e.g., a mixture of solid tumor samples). Table 1 shows a compilation of diagnoses that have been analyzed so far. The list is extensive, but for the less common tumor types, the number of samples assayed so far is low.
Overview of Tumor Types That Have Been Analyzed in the Fluorometric Microculture Cytotoxicity Assay.
The drug resistance classification can be used in itself to make an informed decision about treatment choice. If a sample is classified as EDR with respect to a particular drug, it is a clear indication that it should be avoided for treatment. The clinical decision can be further based on the probability of response to treatment for the specific diagnosis. Where a pretest probability of response is available, a posttest probability can be computed and used to make quantitative judgment in deciding treatment.
The referral response consists of the sensitivity classifications for the panel of drugs tested as well as posttest probability of response (where available). Furthermore, if the sample is deemed representative of the diagnosis, it is added to the database of reference values. For the period 2013 to 2014, 80% of all analyses overall were successful for referred hematological as well as solid samples (with success rates varying across diagnoses; e.g., the success rate for ovarian carcinoma is close to 100%) according to the quality criteria described below.
Sample Preparation
The FMCA is applicable to a wide variety of tumor types; Table 1 shows an overview of diagnoses that have been analyzed in our lab. Hematological samples are taken as whole blood and/or bone marrow, in heparinized tubes, whereas solid samples can be taken either at surgery or obtained as needle biopsies. The key issue in preparing the sample is to enrich for tumor cells. Successful analysis require >70% tumor cells in the preparation, in sufficient number for seeding the plate. To facilitate this, separate sample preparation protocols have been developed for solid and hematological samples.
Solid Tumor Samples
The solid tumor samples are collected in sterile transport medium (TM)/wash buffer (WB; CO2-Independent Media; Gibco, Life Technologies, Carlsbad, CA) with 5% heat-inactivated fetal calf serum (HI-FCS; Sigma, St. Louis, MO) and 1.1% PeSt/Glut consisting of equal parts 200 mM L-glutamine (Sigma) and PeSt (10,000 U/mL penicillin and 10 mg/mL streptomycin in 0.9% NaCl; Sigma) and should be delivered to the laboratory within 24 h of sampling. The TM is poured off and saved for later because it may contain a large amount of tumor cells. The tumor sample is then weighed and WB is added to the sample to provide buffer and nutrients. The sample is then manually minced into <1 mm2 pieces with sterile scissors while continuously removing the WB with tumor pieces by the use of a Pasteur pipette and adding new WB.
After mincing, the sample is left in the hood for a few minutes to let the tumor pieces settle to the bottom. The supernatant (CW) is then removed and kept for later, again as it may contain an appreciable number of tumor cells. Then, collagenase (collagenase type I, 1.5 mg/mL; Sigma and DNase Type I, 100 µg/mL [Sigma] in CO2-independent medium, [Gibco], pH 7.35 to 7.45) is added to the tumor pieces at a volume of 10 mL/g specimen. A sterilized magnet is then put into the tube with the tumor pieces and collagenase (ENZ). The tube is then placed in a 37 °C incubator, on a magnetic stirrer, for 1 to 4 h depending on diagnosis and the sample constitution. All three phases (TM, CW, and ENZ) are then centrifuged (200 × g, 5 min, at room temperature [RT]) and the supernatant is removed. The pellets of the TM and CW phases are resuspended in 10 mL WB, and the pellet in the ENZ tube is resuspended in 20 mL WB. The ENZ tube is then centrifuged (200 × g, 5 min, RT) and the supernatant discarded. Another 20 mL of WB is added to the ENZ tube, the pellet is resuspended followed by a final centrifugation (200 × g, 5 min, RT). The supernatant is discarded and the pellet resuspended with 20 mL of WB.
Cytospin glasses are then made and stained for evaluation of which phases that contain viable tumor cells and will undergo further purification steps. The selected phases are pooled into one suspension and divided into 50 mL sterile falcon tubes containing 15 mL each. The tubes are placed in a centrifuge that is accelerated to 180 × g and then stopped. They are then removed from the centrifuge, and approximately 7.5 mL is removed from each tube and pooled (E) into a new sterile container. This procedure is repeated, usually three to five times.
The remaining bottom phases (A) are pooled into a separate tube and placed aside. The E-phase is divided into 50 mL sterile Falcon tubes, with 30 mL in each tube, and carefully underlayered with 10 mL Histopaque-1077 (Sigma). The tubes are then centrifuged for 15 min (510 × g, no brakes, RT), and the interface (IF) between the histopaque and the cell media is harvested with a Pasteur pipette. The IF is washed two times with WB (same as the ENZ tube) and resuspended in 10 mL wash buffer. The IF and A phases are then stained with Toluidine blue and counted in a Bürker chamber to determine the number of viable cells and the single cells to aggregates ratio. The cells are then diluted in complete culture medium (RPMI 1640 containing 10% HI-FCS and 2% PeSt/Glut) to a concentration of 0.11 × 10⁶/mL and are finally ready for seeding into 384-well experimental plates (45 µL/well).
A cytospin glass (D0) is made and saved for morphological evaluation of the cells used for the assay. If there are cells not needed for the assay, these are centrifuged and resuspended in freezing medium (HI-FCS containing 10% DMSO) to a concentration of approximately 5 × 10⁶ cells/mL. The cell suspension is then divided into cryotubes and placed in a precooled freezing container (Mr. Frosty, Nalgene, Thermo Scientific, Waltham, MA). The freezing container is placed in a −80 °C freezer overnight, and the vials are then moved to a −150 °C freezer for storage. These cells can then be used at a later time point if additional drugs need to be tested and/or for assessment of the activity of experimental drugs within a research program.
Hematological Samples
Peripheral blood and/or bone marrow are sampled in sodium-heparinized tubes and should reach the laboratory within 24 h, although up to 48 h might be acceptable. The cells are stained with Türk’s solution and counted in a Bürker chamber to determine the white blood cell (WBC) count. The cells are then diluted with WB at least 1:2 and with a WBC concentration less than 13 × 106/mL. Three milliliters of Histopaque is then added to 15 mL sterile tubes and then gently overlaid with 7 mL of the cell suspension using a sterile syringe. The tubes are then centrifuged (400 × g, 30 min, RT, no brakes), and the interface is harvested using a Pasteur pipette. Cells are then twice centrifuged (200 × g, 5 min, RT) and resuspended in 10 mL WB. Then the cells are stained with Toluidine blue and counted in a Bürker chamber to determine the cell concentration. They are then diluted with complete culture medium to a concentration of 0.44 or 0.89 × 10⁶/mL, depending on diagnosis, and are ready for seeding into 384-well experimental plates (45 µL/well). A cytospin glass (D0) is made, and remaining cells are centrifuged and resuspended in freezing medium to a maximum concentration of 30 × 106 cells/mL. The storage procedure then follows the same protocol for solid tumors.
Measurement of Cell Viability by FMCA
The FMCA is a cell viability assay based on the conversion of fluorescein diacetate (FDA) into fluorescein made by cells with intact plasma membranes. Following the 72 h incubation with drugs at 37 °C, humidity 95%, and CO2 5%, the 384-well plates are centrifuged (200 × g, 60 s, RT) after which the culture media are removed by an ELX405 Select (Bio-Tek Inc., Winooski, VT) and 50 µL phosphate-buffered saline (PBS) is added to the wells. This procedure is repeated twice followed by a final centrifugation, removal of PBS, and addition of 50 µL/well of Q2 buffer (125 mM NaCl, 5.9 mM KCl, 0.5 mM MgCl2, and 0.5 mM CaCl2 with 25 mM Hepes) and 1 µL of FDA (0.5 mg/mL in DMSO) to each well. Plates are incubated for 50 min in a Cytomat (37 °C, humidity 95%, CO2 5%) before being analyzed in a Fluostar Omega (BMG Laboratories, Ortenberg, Germany). All this is done by a fully automated SCARA system (Beckman Coulter, Labtech, Germany). Finally, a cytospin glass (D3) is made from the wells in the plate containing the untreated control.
The endpoint of the assay is Survival Index% (SI%): the fraction of surviving cells relative to unexposed control. It is calculated for each well as

where fExposed denotes the fluorescent signal in the wells with drug and fcontrol and fBlank are the average fluorescence in the control and blank wells, respectively. Exposure is done in duplicate, and the SI% value used in the empirical evaluation of drug response formed from the replicate average.
In addition, a number of quality controls are computed.
7
The signal-to-noise ratio
Empirical Evaluation of Drug Response
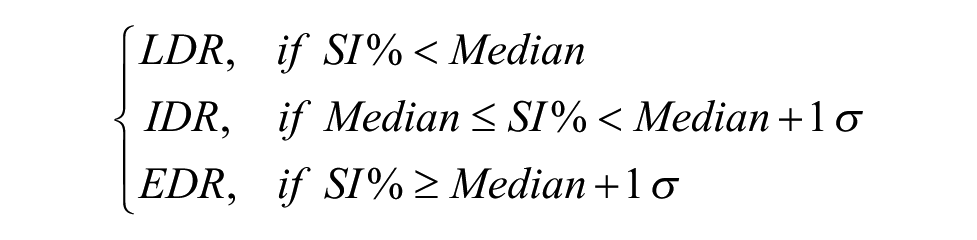
For each drug and concentration, the measured SI% is classified into three different classes of in vitro effect based on the median and standard deviation for previous assay data, as illustrated in Figure 2 .
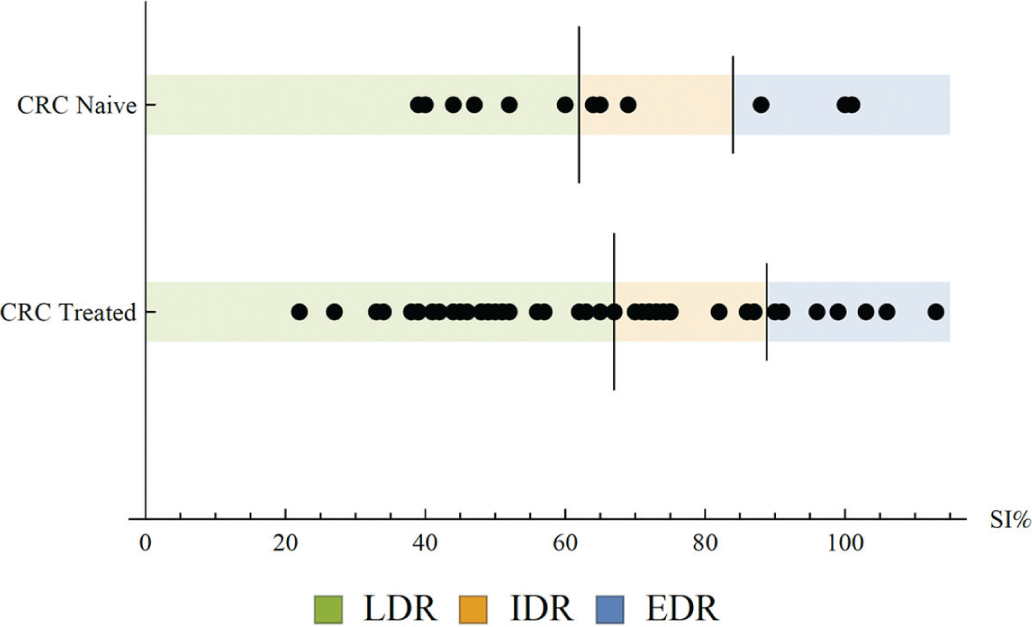
Example formation of reference values for resistance classification. Survival index percentage (SI%) values for oxaliplatin at 10 µM are shown for two reference cohorts: treatment naïve and previously treated colorectal cancer. Long vertical dash denotes the median; short vertical dash denotes the median + 1 standard deviation for each reference cohort. New samples with SI% values below the median are classified as low drug resistance (LDR), between median and median + 1 standard deviation as intermediate drug resistance (IDR), and above as extreme drug resistance (EDR).
The SI% median and standard deviation for a set of suitable reference samples are computed. The classification is then obtained as
The median plus one standard deviation (EDR) classification was shown to be predictive of in vivo drug resistance 8 in the initial development of chemoresistance assays, and later we demonstrated that the IDR and LDR classifications also have predictive value in hematological as well as solid tumor malignancies.6,9 The reference values used are chosen on a per diagnosis basis; the set of samples for the reference data used are chosen to be as close to the type of sample under analysis as possible. For the major diagnoses, a sufficient number of samples have been tested to obtain accurate estimates of the median and standard deviation. However, samples of rare diagnoses can also be analyzed by building a reference set from a representative mixture of samples. For instance, for any solid tumor sample, the complete set of solid tumors previously assayed can be used as a reference set for classification.
The endpoint of the analysis is the probability that the patient will respond to treatment. This probability is obtained through Bayes’ theorem, in which the a priori probability that the patient will respond to a specific drug is obtained from published data and/or clinical experience. Briefly, Bayes’ theorem shows that for any events A and B, it is the case that

Thus, to calculate the probability that the patient from whom the sample was obtained will respond (R) to a drug given a classification
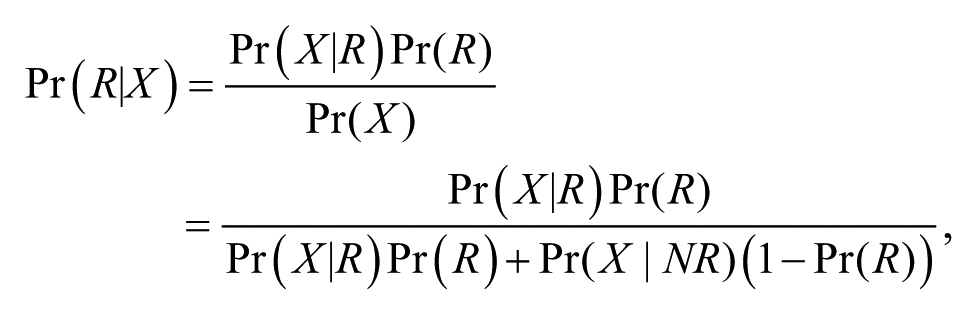
where NR denotes nonresponse. Pr(R) is the probability of response, and the probabilities Pr(X|R) and Pr(X|NR) correspond to the frequency of which the class occurs among responders and nonresponders, respectively, and have been estimated from clinical data. 2
Figure 3 depicts the a posteriori probability that a patient will respond to treatment for the different classifications (LDR, IDR, and EDR) as a function of the a priori probability. For example, for a drug with a clinical response rate of, for example, 20%, we can read off a response probability of 42% for samples classified as LDR, 5% for samples classified as IDR, and 2% for samples classified as EDR.
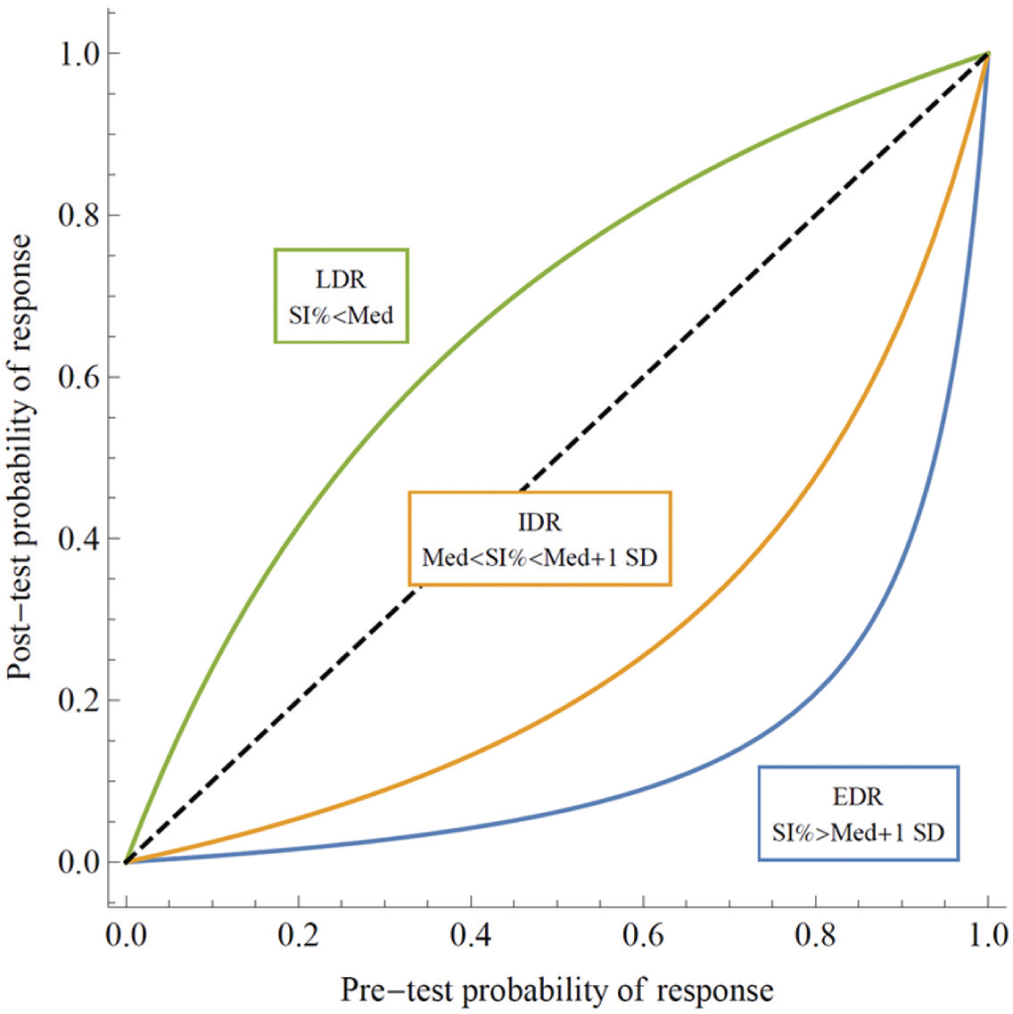
Posttest probability of treatment response as a function of the pretest probability for the three different sensitivity classifications.
Laboratory Workflow
A detailed overview of the laboratory workflow is show in Figure 4 . Time from receiving the referred sample to a referral response sent out is typically 4 d, during which the bulk of the waiting time is the 72 h incubation for the FMCA. Each referral is handled by a team of biomedical scientists and physicians. Sample preparation is largely a manual process as described above, but the remaining steps of the analysis are to a large part automated. Precision 2000 (Bio-Tek Inc.) is used for cell seeding, and the microtiter plates are loaded with drugs using acoustic dispensing in an Echo 550 (Labcyte Inc., Sunnyvale, CA) set up in a Access workstation. Finally, the FMCA has been automated using a Biomek NX (Beckman Coulter Inc., Pasadena, CA) with a SCARA system. In addition to instrument software, bespoke software systems support the clinical workflow ( Fig. 5 ). The open-source laboratory information system Brunn 10 is used to lay out the plates and manage as well as audit all computations for the SI% values, including quality controls. An in-house–developed application (Bridge) is used to generate a transfer scheme for the Echo 550 based on a plate layout exported from Brunn.
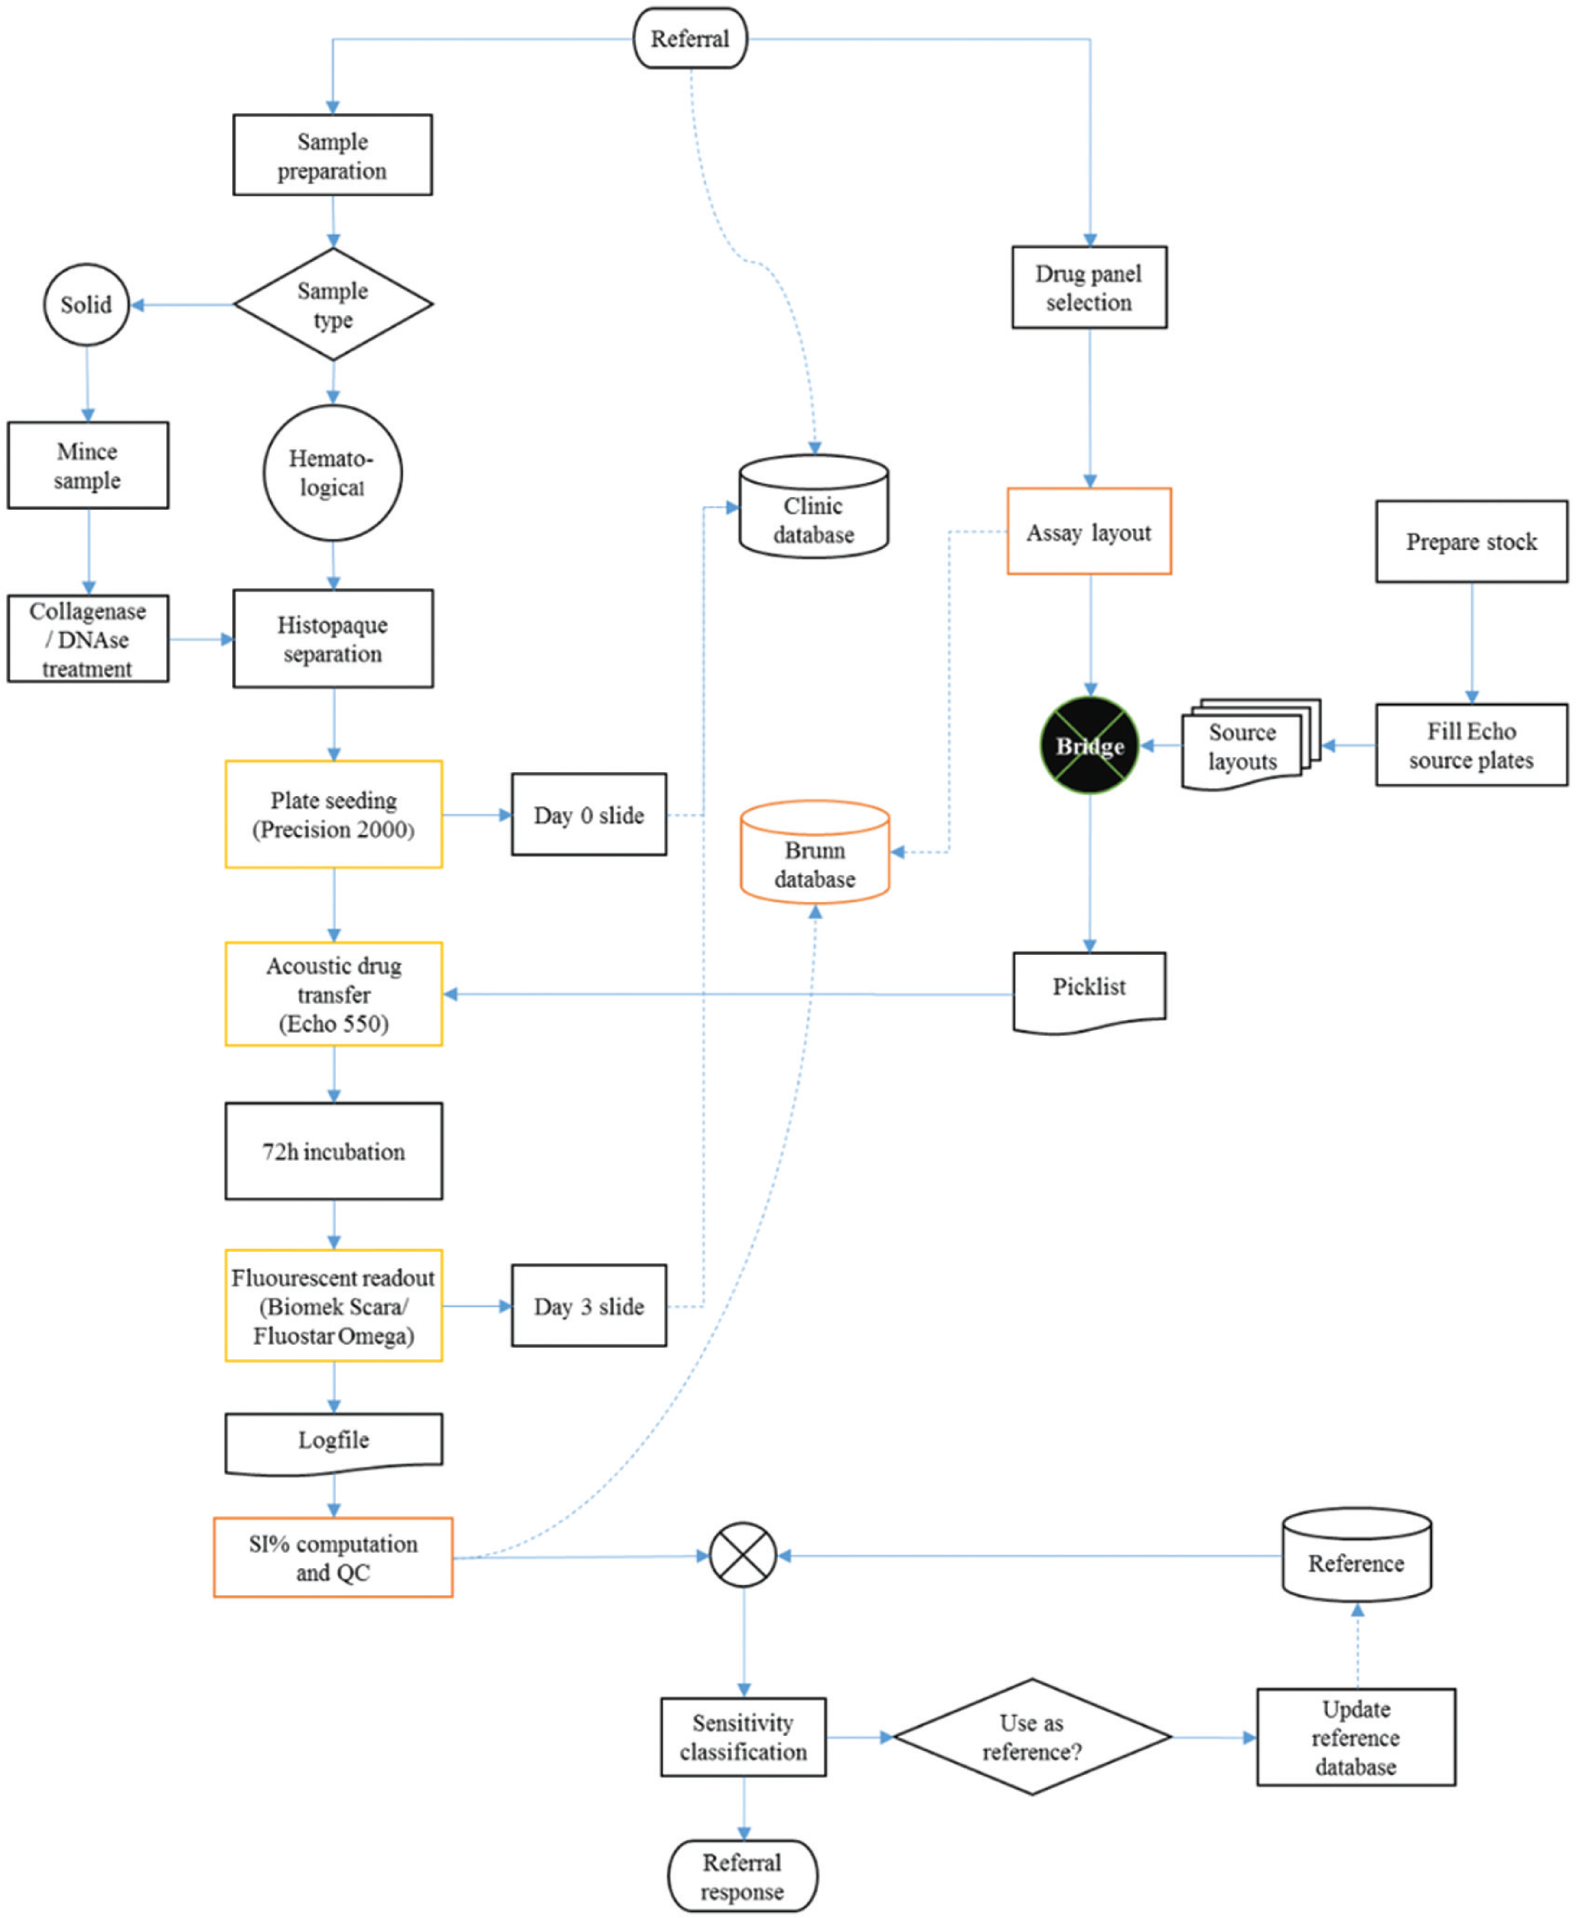
Overview of laboratory workflow.
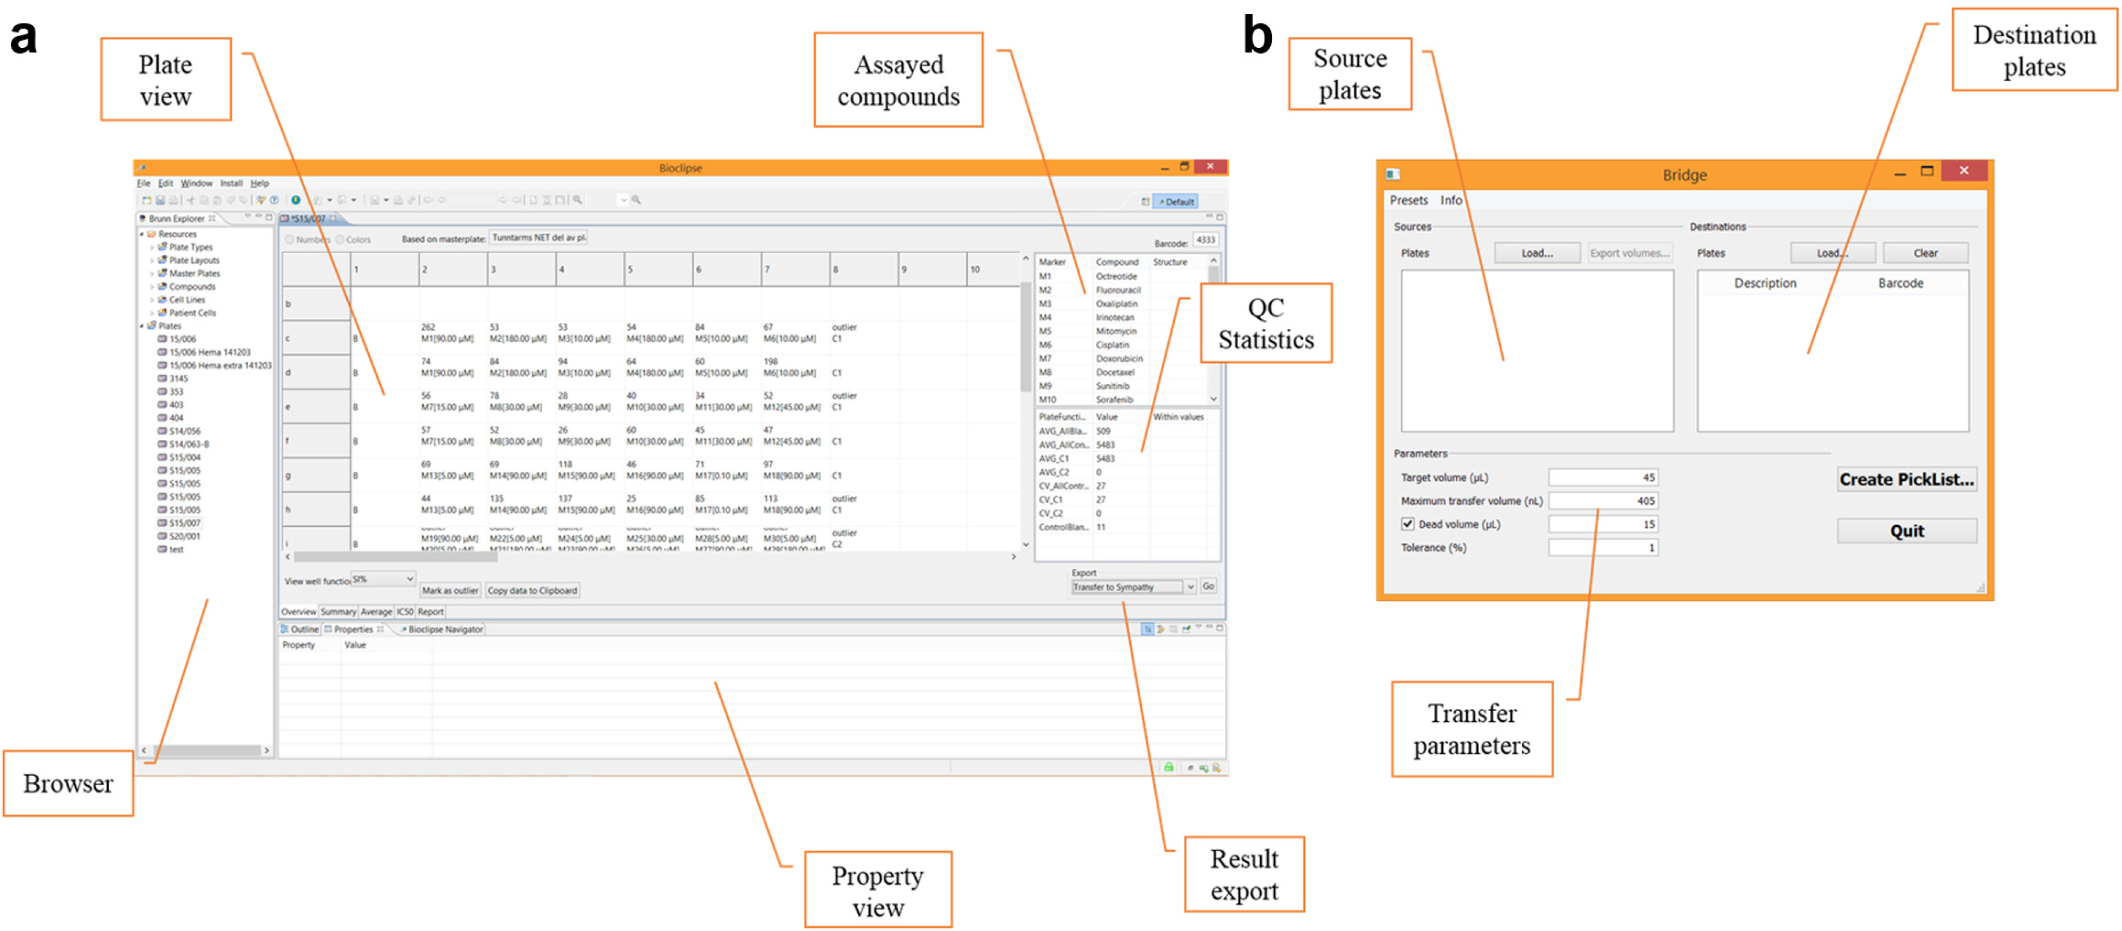
Supporting software for our chemoresistance assay. (
Clinical data and the referral response are prepared in a bespoke module in the hospital pathology system, which facilitates handling of electronic referral and response as well as billing. Below, we describe in detail how these systems work in concert through the processes of assay design, compound handling, and sensitivity analysis.
Assay Design
The layout of the assay plate is designed in the open-source software developed in house, Brunn. It was designed to support dose-response studies using FMCA (although it can be used for any endpoint in a microtiter plate format). The workflow consists of designing a plate layout and specifying drugs on the plate. Today, our compound concentrations in the assays range from 180 µM down to as low as 0.0014 µM. As the layout of the plate is prepared, all the calculations for the raw data are also added. Calculation of CV% and the control/background ratio is added automatically.
Most compounds are added in a 1:3 dilution series of five steps, and we transfer a maximum of 405 nL of compound to each well. For compounds dissolved in DMSO, this means we accept up to 0.9% DMSO. Each plate has DMSO control wells containing 0.9%, 0.3%, and 0.1% DMSO. If a DMSO control shows a significant effect (which rarely happens), all compound measurements with the corresponding concentration of DMSO are removed from further analysis. A few standard layouts have been designed to cover the standard drugs used for a specific diagnosis. These are used when no specific drugs have been requested for testing by the referring physician.
Compound Handling
The compounds are dissolved with DMSO, sterile water, or PBS to stock concentrations (in most cases, 10 mM) and then stored in −80 °C freezers. When it is time to prepare a new source plate for the Echo, the compounds are thawed and pipetted over to a barcoded Labcyte 384PP (P-05525-BC) polypropylene plate, in duplicate. The plate containing the compounds dissolved in DMSO is stored at RT under nitrogen gas (>95%) in a StoragePod (Model StoragePod Short Dundee, SPOD011, Roylan Developments Ltd., Surrey, UK) controlled by a MiniPod (Roylan Developments Ltd.) until use. Compounds dissolved in sterile water or PBS are put on a separate plate and are kept sealed in the refrigerator (+4 °C).
As of today (June 2015), we have a library of 80 compounds that the physician can choose from in the assay, as a single compound or in any combination preferred. The panel is selected based on feasibility to assay and approval for use in the clinic. The flexibility of the Echo 550 and the Access system gives us the advantage to easily choose and pinpoint the compounds of interest for any specific patient. This is a great advantage because we previously had to prepare the compounds beforehand and test all patient samples on the standard panel of 24 compounds that currently was prepared.
Drug transfers are facilitated by a custom-made application, Bridge. When the layout for a sample is prepared in Brunn, the destination plate specification is easily exported. The specification contains the compounds, destination wells, and final concentration. It is then imported into Bridge, together with layouts of the source plates and their most recent volume surveys as assayed by the Echo. Additional parameters are specified: final volume, source dead volume, maximal allowed transfer volume, and tolerance for error in target concentration due to discretization. Bridge automatically picks the highest available source concentration that can be used within the given tolerance. As an additional feature, Bridge can output a theoretical survey derived from the volumes transferred from each source well that can be used the next time a plate is prepared. This way, a new volume survey is not needed each time a plate is prepared.
Analysis
The instrument log file containing raw fluorescence readings is parsed directly by Brunn and stored in a database. The SI% values and corresponding control values are automatically computed based on the plate layout. The values are then manually audited and outlier wells removed from analysis. When quality control (QC) is completed, the plate results are transferred into a clinical application for completing and relaying the referral response.
In the clinical application, a set of reference values are chosen for sensitivity classification suitable for the diagnosis of the sample. Our references are based on a large cohort of previously analyzed patient data collected throughout the years and are entered into the clinical application as a list containing median and standard deviation for the survival index for each drug concentration. In addition, the sample and assay characteristics and microscope slides taken at day 0/D0 and day 3/D3 of the FMCA are available in the clinical application. In addition, the posttest probability of response is automatically calculated where the pretest probabilities are available.
The compounds to be included in the referral response can be selected manually, and additional comments or recommendations added as free text.
Clinical Referral Response Example
To illustrate the clinical utility of our chemoresistance assay, we present an excerpt from a clinical referral response ( Fig. 6 ). A hematological sample (bone marrow) from a 64-year-old patient with relapsed acute myeloid leukemia following standard induction treatment was referred for chemoresistance testing in February 2015. Previous treatment history included, among others, cyclophosphamide, etoposide, and cytarabine. The sample was of good quality, yielding 9.8 million tumor cells for analysis. In total, 52 drugs were assayed.
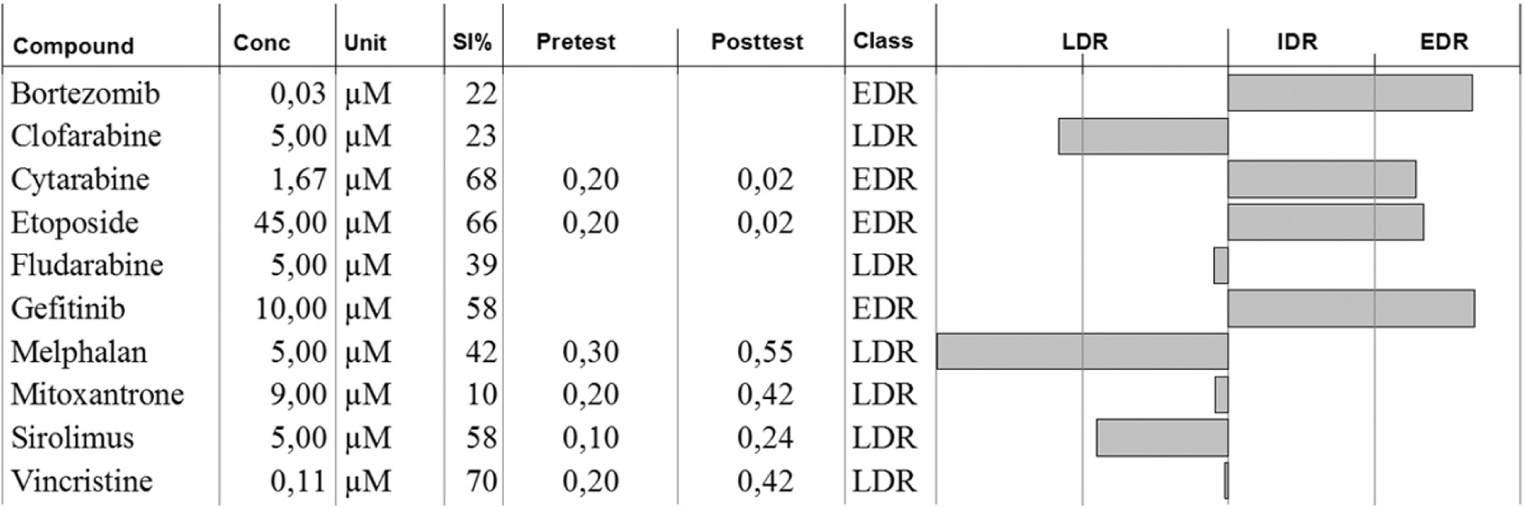
Excerpt from the clinical referral response for a relapsed acute myeloid leukemia sample. See text for details.
The profile showed LDR for clofarabine and more unexpectedly also for melphalan, and these drugs were the treatment options recommended to the clinician.
Discussion
Our chemoresistance assay has evolved into an integrated workflow that is largely supported by automation. The latest step in its development was the integration of acoustic dispensation of the compounds and integration into the laboratory information system with the clinical referral system. Acoustic dispensation not only provides higher accuracy than tip-based dispensation but also more importantly allows a greater flexibility in the choice of drugs for testing. In our previous tip-based setup, master plates containing compounds were prepared and frozen in batches, 24 plates at a time. For each round of analysis, a plate was thawed and cell suspension was added. Thus, there was little room for customizing the panel for the individual patient, and any customization in the drug panel entailed error-prone manual dispensation. By using acoustic dispensing and source plates stored in nitrogen atmosphere together with an easy-to-use software for plate layout, any available set of clinically relevant compounds can be assayed and changed on a patient-to-patient basis. Specifically, this is made possible because of the ability of acoustic dispensing to reuse the same library source plates for different assay layouts.
The development of our software infrastructure has been incremental. Brunn was initially developed in house to support dose-response studies for research but was found to be a close fit for the chemoresistance assay workflow. It is open source, and the license allows any potential user not only to use it freely but also to adapt it for their particular workflow. Although not officially certified, it was developed to fulfill such requirements. For instance, each user has a personal account, and all user actions that entail changes to the database are logged. Data cannot be deleted (only masked from view). Adaptation to clinical use simply entailed the addition of export functionality. To fulfill Swedish patient safety regulations, no identifying information is stored in the Brunn database, only a sample ID. When QC is completed, the assay results are transferred to the pathology electronic referral system by posting the data to a set of database tables that act as a mailbox. The referral is then opened in the referral system and assay data imported to it. There are several referral systems in use at the hospital, and the system in use at the pathology department was chosen as it was the closest fit to our needs. A module for handling response probabilities and preparing the response was ordered from the vendor. It is entirely feasible to use the same solution at another laboratory. Furthermore, Brunn was initially developed for use with tip-based dispensing based on fixed programs. To integrate it with our acoustic dispensing setup, we developed Bridge, which constructs a transfer picklist compatible with the Echo instrument software (Echo Cherry Pick v1.5). It constructs transfer instructions for arbitrary concentrations from the source plates. If the concentration span of a compound is too large to use a single stock concentration on the source plate, Bridge will automatically switch to a lower-concentration source well if available. It also tracks consumption and switches between replicate source wells as they become depleted. The picklist is computed batchwise, so any number and variation of assay plates can be combined into a single picklist. Also, importantly from a safety perspective, our setup with Bridge means the assay plate is specified only once (in Brunn), minimizing the risk of user error.
Chemoresistance assays can be compared with gene testing (i.e., molecular testing or target profiling), which attempts to link the genetic status of the tumor cells with a theoretical potential for drug activity. Gene tests available today apply to only a very small number of drugs and a limited number of cancer types. By design, they cannot identify active compounds within a large panel but only those few for which activity prediction based on genetic status has been established. Moreover, chemoresponse is multifactorial and depends on the complete set of genes expressed in the cancer cells at the time of treatment. The outcome of a chemoresistance assay will also depend on the susceptibility governed by the genetics but in a more powerful way because it will take into account whether the susceptibility is expressed. Thus, the chemoresistance assays measure the net effect of multiple resistance mechanisms rather than a single molecular one.
However, some limitations of the approach should be addressed. First, the primary cultures of tumor cells from patients show little proliferation during the 72 h assay time. This means that drugs acting strictly by inhibition of proliferation rather than cytotoxicity would not be detected in the assay. However, results for such drugs could still be valid if cell damage at suprapharmacological concentrations is dependent on the same protective mechanisms as those protecting the tumor cells from antiproliferative effects at lower concentrations.
Another obvious limitation of ex vivo drug activity assays when it comes to their predictive accuracy for drug treatment in patients is that these assays reflect only the pharmacodynamics of anticancer drugs. The outcome in the patient, however, will also depend on drug pharmacokinetics, which will be decisive for tumor cell drug exposure. 11 This explains why ex vivo drug activity assays are better at predicting in vivo resistance than in vivo activity; tumor cell extreme drug resistance ex vivo can hardly be compensated for by drug exposure at the high end of what is achievable in patients, whereas drug sensitivity ex vivo will not be evident in vivo if, due to pharmacokinetic factors that vary considerably between patients, 12 the drug exposure is too low. This is a general problem for various ex vivo assays that reflect pharmacodynamics effects, and to improve on in vivo predictability, information needs to be added from other methods. 11
The natural next step of development is further miniaturization of the assay to 1536-well microtiter plates. For most diagnoses, the tumor cell yield from preparation is the limiting factor for the number of drugs that can be tested. On average, we are able to assay 23 drugs for each referral; thus, scaling the assay 1:4, we could be able to test on average 90 drugs or drug combinations for each patient, making more room for serendipitous discovery of effective drugs for an individual patient. However, miniaturization will likely also require a more sensitive readout (e.g., bioluminescence), and work in this direction is in progress.
Importantly, further miniaturization that requires fewer cells per well would greatly increase the number of drugs that can be tested and open more extensive evaluation of drug combinations. Today, drug combinations are tested to only a limited extent and mainly in samples that yield enough tumor cells. With a larger number of combinations tested comes the possibility of discovering potentially important drug synergy.
It should be acknowledged that there are several other recently published short-term ex vivo assays for anticancer drug activity testing in patient tumor cells that seemingly report data predictive for the outcome in the clinic.13–15 The principal approach used in these assays is similar (i.e., isolated malignant cells are exposed to drugs in a multiwell automated format followed by assessment of cell survival), although the technical solutions for this endpoint assessment differs as do the ways to set the score for drug activity. Sometimes the drug activity scoring is combined with individual patient genetic analyses as a way to get mechanistic information for the drug activity profiles observed. All assays report data on a small number of patients indicating clinical utility. However, it remains to be seen from clinical studies if there are any major differences in the performance of the slightly different approaches for data acquisition and interpretation in these assays.
Future development of ex vivo chemoresistance assays may be to use them in concert with, for example, pharmacogenetic markers to inform on the pharmacokinetics of a drug and in that way increase the specificity of the assay. In addition, flow cytometry techniques could be integrated and used to study the cytotoxic effect on subpopulations of tumor cells, as has been done for, for example, acute myeloid leukemia. 14 We are currently working on incorporating flow cytometry in the workflow to study subpopulations in other diagnoses.
Footnotes
Acknowledgements
We gratefully acknowledge Anna Karin Lannergård, Annika Jonasson, Gunilla Frenne, and Lena Fredriksson for their skilful technical assistance in the development of this assay.
Declaration of Conflicting Interests
The authors declared no potential conflicts of interest with respect to the research, authorship, and/or publication of this article.
Funding
The authors received no financial support for the research, authorship, and/or publication of this article.