
Abstract
Recent advances in targeted protein degradation have enabled chemical hijacking of the ubiquitin–proteasome system to treat disease. The catalytic rate of cereblon (CRBN)-dependent bifunctional degradation activating compounds (BiDAC), which recruit CRBN to a chosen target protein, resulting in its ubiquitination and proteasomal degradation, is an important parameter to consider during the drug discovery process. In this work, an in vitro system was developed to measure the kinetics of BRD4 bromodomain 1 (BD1) ubiquitination by fitting an essential activator kinetic model to these data. The affinities between BiDACs, BD1, and CRBN in the binary complex, ternary complex, and full ubiquitination complex were characterized. Together, this work provides a new tool for understanding and optimizing the catalytic and thermodynamic properties of BiDACs.
Introduction
Many current targeted therapies are based on small molecules that inhibit the biological function of a protein of interest. One of the main limitations for inhibitor-based treatments is that high doses of the inhibitor are often needed for adequate target occupancy levels to drive efficacy. These doses can be challenging to achieve and may increase the likelihood of significant off-target side effects. Alternatively, targeted protein degradation is an emerging drug modality that harnesses the natural cellular protein homeostasis system to induce the destruction of target proteins. This approach utilizes a heterobifunctional small molecule that incorporates both an E3 ligase binding moiety—most commonly to the Cullin ring ligases cereblon (CRBN) or Von Hippel–Landau (VHL)—and a target protein binder, connected through a linker region. These compounds form a ternary complex between the E3 ligase and the target protein and facilitate E3 ligase-catalyzed ubiquitination of the target protein.1–11 The polyubiquitinated target protein is then degraded by the cellular proteasome. Importantly, BiDACs are catalytic, inducing the continued proteasome-mediated degradation of target proteins over time and therefore do not require stoichiometric binding to a target. Aside from the benefits of being able to use lower doses of the compound, BiDACs also offer additional selectivity opportunities, which may otherwise not exist with a traditional small-molecule inhibitor. Since BiDACs induce the formation of ternary complex interfaces between the protein of interest and a specific E3 ligase, it is possible to induce selective degradation of highly homologous targets that offer no route to selectivity via small-molecule inhibition. 12 Therefore, understanding the catalytic underpinnings of protein degradation is essential for the characterization and utility of targeted protein degradation as an emerging therapeutic strategy.
Targeted protein degradation is a complex multistep process that involves several proteins. First, ubiquitination requires activation of ubiquitin by an activating enzyme (E1) for transfer to a ubiquitin conjugating enzyme (E2). An E3 ligase mediates the final transfer of ubiquitin to a target. For CRBN-induced degradation, the neddylation of the E3 ligase CUL4 is also necessary for its activation. 13 Moreover, the E1 activation steps for ubiquitination and E3 neddylation are both ATP dependent. In the case of CRBN-mediated degradation, the CRBN-DDB1 complex binds to both CUL4 and the target protein, bringing the target into proximity to the E2 enzyme charged with ubiquitin to facilitate the transfer of ubiquitin to the target. Following ubiquitination, the target is degraded by the proteasome, by either directly associating with the proteasome or following an unfolding step by the VCP/p97 unfoldase. 14 In addition to the multiple enzymes involved in ubiquitination, the target itself may have numerous surface-exposed lysines, which may serve as potential ubiquitination sites, each directing alternative cellular fates for the same protein lysine residues.15–18
Binding affinities to a single target protein often describe the interaction of traditional inhibitors. The catalytic nature of BiDACs and the multiple proteins involved in the ubiquitination process introduce additional complexities. In the case of BiDACs, in vitro effectiveness is not determined by a single parameter such as half-maximal inhibition (IC50) or binding constant (Ki) but, instead, thermodynamic and kinetic parameters govern the overall degradation process. This is analogous to enzyme reactions where the thermodynamic and kinetic properties are contained in Km and kcat, respectively. To describe the catalytic properties and ternary complex formation, multiple parameters, such as binding affinities and rates of ubiquitination or degradation, must be measured. Individual binding affinities of BiDACs to either the target protein or an E3 ligase can be measured by various biophysical methods. Fluorescence polarization (FP), isothermal titration calorimetry (ITC), time-resolved fluorescence energy transfer (TR-FRET), 6 AlphaLISA, and surface plasmon resonance 19 have been used to analyze the target–BiDAC–ligase ternary complex formation. 20 These assays demonstrate that the efficiency of the ternary complex formation varies with linker length and the warhead used to address each protein binding partner. 21 Seemingly small changes in BiDAC chemistry may lead to variability in binding affinity for both proteins. Ternary complex formation based on individual binding affinities may also be influenced by positive or negative cooperativity from protein–protein interactions between the E3 ligase and target. 21
Moreover, the kinetic parameters of BiDAC interactions with proteins can play a crucial role in the rate of degradation. For example, slower off-rates for complex formation have been found to correlate with a faster rate of target protein degradation in cells.22,23 The formation of the ternary complex is followed by target ubiquitination by the E3 ligase and subsequent release of the BiDAC from the complex. This catalytic nature of the process allows for lower therapeutic BiDAC concentrations that are substoichiometric to target protein concentrations. As described by Fisher and Phillips, 24 an essential activator model framework25,26 can be used for BiDAC characterization. However, this approach has not yet been implemented and described in the literature.
Aside from the ability to recruit and form a ternary complex, the catalytic rate of ubiquitination is a key feature of a BiDAC that determines its overall efficiency at clearing target proteins. 27 Methods aimed at measuring overall kinetics and change in ubiquitination in vivo have recently been reported;28,29 however, deconvoluting the BiDAC-induced degradation into individual binding affinities and the kinetic components of degradation has not been described. Cell-free lysates provide a functional ubiquitination system that allows for the modulation of target concentration and bypasses cell membrane permeability issues. Also, the system allows for the addition of inhibitors of subsequent steps of degradation to enable quantitative analyses of ubiquitination reaction products.
Heterobifunctional protein BiDACs of the BRD2, BRD3, and BRD4 bromodomain and external domain (BET) proteins have been reported11,20,21,30–34 using either CRBN or VHL as the E3 ligase to induce the intracellular degradation. These heterobifunctional BiDACs utilize inhibitors of bromodomains and an E3 ligase binder connected through a linker moiety. Collectively, these BiDACs drive a deeper, more sustained, and efficacious response than their inhibitor counterparts (e.g., JQ1 and OTX015). Several BRD4 degraders33,34 have rapid degradation kinetics, and therefore BRD4 BiDACs serve as an excellent case study for detailed kinetic characterization. Here we describe a cell-free lysate ubiquitination method coupled with automated capillary-based immunodetection to quantify BiDAC-induced ubiquitination of purified bromodomain 1 of BRD4 (BD1), as well as endogenous BRD4, by applying the essential activator model ( Fig. 1 ).24,35
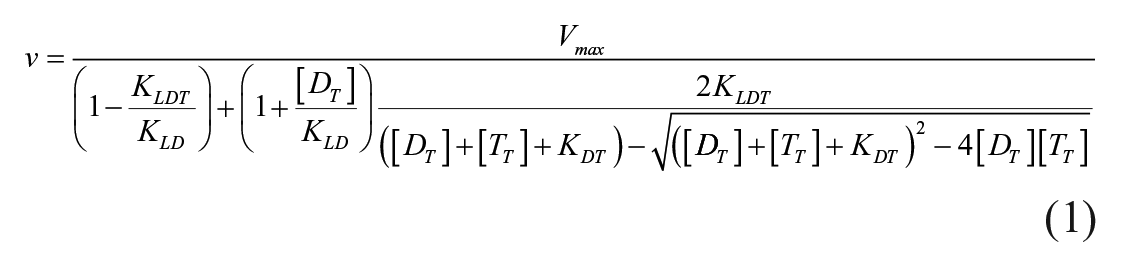
Essential activator model. An essential activator model 35 describes the binding affinities of compounds in binary and ternary complexes and the rate constant for ubiquitination. Kinetic parameters that govern induced ubiquitination of targets were determined fitting the following velocity equation to the data:
We found that the BiDACs differ significantly in the rates of ubiquitination, affinities, and cooperativity and follow a rapid equilibrium mode. Additionally, the patterns of ubiquitination were also quantified and found to vary between the compounds. Collectively, our results provide a framework for optimizing BiDAC properties to improve not only the affinities of ternary complex formation but also the rate of ubiquitination.
Materials and Methods
See Supplemental Materials and Methods for “BiDAC and Core Synthesis,” “Protein constructs and purification,” “CRBN and BD1 competition FP,” and “Dimerization CRBN-DDB1/BRD4(BD1).”
Cell-Free Lysate Preparation
HeLa-S3 cells were obtained from the Cell Culture Company (Minneapolis, MN). Phosphatase inhibitor cocktail (Thermo Fisher Scientific, Waltham, MA, cat. 78428) was added at 1× concentration to the final cell suspension in phosphate-buffered saline and pelleted. Cell pellets containing roughly 5 × 10⁸ viable cells from 1 L of cells were snap-frozen with liquid nitrogen and shipped on dry ice overnight and stored at −80 °C. Pellets were resuspended in 1 mL of cell lysis buffer (20 mM HEPES-KOH, pH 7.5, 5 mM KCl, 0.5 mM DTT, 1× phosphatase inhibitor) per liter of cells, followed immediately by a rapid thaw at 30 °C in a water bath and frozen with liquid nitrogen twice, followed by 10 min centrifugation at 4000g at 4 °C. The supernatant was removed from the pellet and incubated with Benzonase (Sigma, St. Louis, MO, cat. E1014; at ⩾250 units/µL per mL of cells) on ice for 30 min for endogenous BRD4 experiments. The supernatant was aliquoted into single-use tubes, flash-frozen, and stored at −80 °C. The total protein concentration of the lysate was determined using Pierce BCA Protein Assay Kit (Thermo Fisher Scientific, cat. 23225) in a plate-based format.
Cell-Free Lysate Ubiquitination Assay
Ubiquitination reaction components included 2 µM ubiquitin aldehyde (Boston Biochem, Cambridge, MA, cat. U-201-050), 0.15 µM wild-type or lysine-less ubiquitin, 5 mM MgCl2, 50 mM creatine phosphate (Sigma, cat. P7936, suspended in 20 mM HEPES, pH 7.5), 5 mM ATP (Thermo Fisher Scientific, cat. R0441), 100 µM bortezomib (Boston Biochem, cat. I-200), and 6 mg/mL total protein of cell-free supernatant lysate. Reactions were performed in an Eppendorf tube and incubated for 5 min at 30 °C. Reaction component final concentrations remained constant through all runs and are based on previously published protocols.36–40 For reactions containing inhibitor, the reactions were preincubated at 30 °C for 15 min before initiating the reaction with the addition of His-BD1-HA to 100 or 200 nM for kinetic experiments and 100 nM for pattern experiments. The 0 min time point was taken immediately after initiation by quenching 5 µL of each reaction with 25 or 5 µL of stop buffer (7 M urea in 50 mM HEPES, pH 8.2) in each well of a 96-well Eppendorf PCR Lo Bind plate (Eppendorf, Framingham, MA, cat. MFG003129512). Subsequent time points were taken at defined intervals and quenched in the same manner as the zero time point.
Detection of BD1 and BRD4 Using Capillary-Based Immunoblots
His-BD1-HA ubiquitination was detected by automated capillary Western blot with standard settings on the WES instrument (Protein Simple, San Jose, CA, 12-230 kDa kit cat. SM-W004) with HA-tag antibody (Cell Signaling Technologies, Danvers, MA, cat. 3724S). Run conditions were optimized based on a dilution series of His-BD1-HA diluted in the lysate and a dilution series of antibody. Antibody signals were determined to be saturated 1:50 for anti-HA and 1:200 for anti-BRD4 antibodies. The linear range for detection of His-BD1-HA was experimentally determined to be between 0.2 pM and 100 nM final loading concentration. The linear range for BRD4 detection with endogenous BRD4 antibody (Cell Signaling Technologies, cat. 13440) was determined from a 20 to 300 pM final loading concentration on the high-molecular-weight capillaries (Protein Simple, 66-440 kDa kit, cat. SM-W008). BRD4 was quantified as 11 ± 3 nM in 6 mg/mL HeLa cell-free lysate extract by comparison with purified BRD4 (Reaction Biology, Malvern, MA, cat. RD-21-153) and loaded on the WES at a final concentration of 0.05 mg/mL cell lysate (
Quantification of BD1 and BRD4 Ubiquitination
To calculate BD1 and ubiquitinated BD1 peak areas under the curve (AUCs), default settings of Gaussian peak fitting and exposure settings of a high dynamic range (HDR) of 2 s were used in the Compass for SW software (version 3.1.7, Protein Simple). The AUCs of each peak at individual time points were collected. AUCs were converted to a fraction of BD1 ubiquitinated by the following formula:
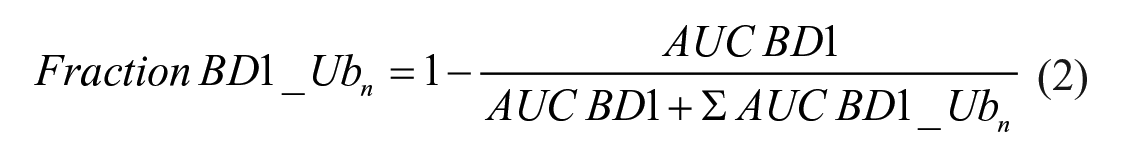
where BD1 is the lowest-molecular-weight peak and BD1_ubn represents all observed ubiquitinated species (n = 1–4 BD1). The total fraction was normalized based on the mean of DMSO replicates per test occasion. The BD1_ub and BD1 signals were self-normalized to the total HA signal.
BRD4 peak AUCs were determined with Gaussian peak fitting with the following settings: sample peak fit starting width ratio of 0.5–1.5, peak find threshold of 6, width of 2.8−3.0, and exposure setting of 2 s. First, the location of the BRD4 peak was set to have a molecular weight center with 0.25% of the BRD4 peak over an average of three zero time points. The BRD4_ubn peaks were fit as allowed by the data for molecular weight peaks ranging from 268 to 350 kDa and constrained to 2%−5% molecular weight placement between capillaries in a single run. The locations of the peak were varied until an acceptable fit was obtained within the allowable number of iterations in the Compass software. The individual Gaussian peaks represent molecular weights corresponding to one to eight ubiquitin molecules added and do not represent individually resolved ubiquitin molecules added to BRD4. The fraction BRD4 ubiquitinated was determined using the same equation as for BD1 described above. Only one time point was selected to capture initial rate conditions based on the criteria of ubiquitination of 10%−30% of BRD4. If more than two points met these criteria, the one with the smallest error was selected for velocity analysis.
Fitting Ubiquitination Rates
An enzyme activator model described by Segel 35 was used to analyze the kinetics of the BD1 domain, and BRD4 described by eq 1 with KLDT equal to KLD reduced the final equation fit to the following data:
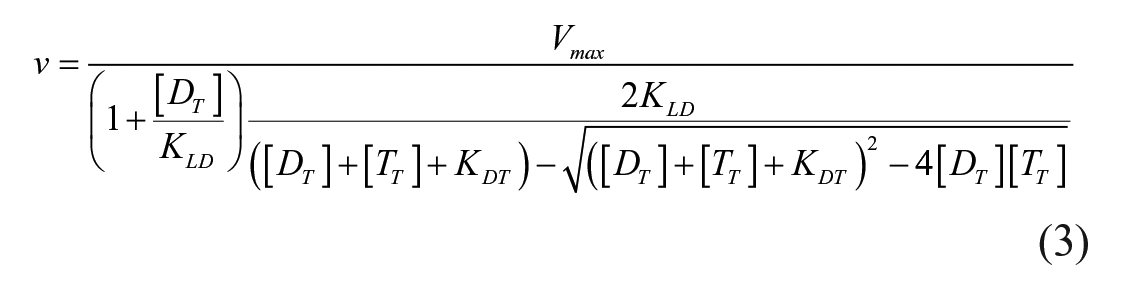
where Vmax is equal to kcat multipled by the concentration of the ligase, DT is the BiDAC concentration, TT is the concentration of the target, KDT is the equilibrium constant between the BiDAC and target, and KLD is the equilibrium constant between the ligase and the BiDAC using GraphPad Prism 9.0.0 (San Diego, CA).
Analysis of BD1 Ubiquitination Patterns
After quantifying the ubiquitination at each time point and for each BiDAC, the ubiquitination pattern for BD1 was determined with the lysine-less ubiquitin construct. The ubiquitination was carried out to achieve 5−15% of BD1 converted to BD1_ub (calculated with eq 2), based on kinetic studies of individual compounds. AUCs with a signal-to-noise ratio less than 50 were removed from the analysis. The fraction of BD1 ubiquitinated within a 5−15% conversion rate (regardless of the time at which it was collected) was identified for analysis of patterns to control differences due to the extent of the reaction.
BD1 HiBiT Degradation
DMEM no-phenol red medium and fetal bovine serum were purchased from Gibco (Grand Island, NY). The Nano-Glo HiBiT Lytic Assay System (Promega, Madison, WI, cat. N3050). The HiBiT-BRD4 BD1 cell line was generated in-house, ectopically expressing the BRD4 BD1 domain with a HiBiT fusion tag. Cell culture flasks and 384-well microplates were acquired from VWR (Radnor, PA).
BD1 degradation was determined based on quantification of luminescent signal using the Nano-Glo HiBiT Lytic Assay kit. Test compounds were added to the 384-well plate from a top concentration of 10 µM with 11 points, half-log titration in duplicates. Cells were added into 384-well plates at a cell density of 15,000 cells/well. The plates were kept at 37 °C with 5% CO2 for 3 h. The cells treated in the absence of the test compound were the negative control, and the cells treated with 30 nM of a known BRD4 degrader were the positive control. After 3 h of incubation, Nano-Glo HiBiT Lytic Assay reagents were added to the cells. Luminescence was acquired on an EnVision Multilabel Reader (PerkinElmer, Santa Clara, CA).
The data were fit by using the in-house data analysis software. The fit was performed through minimization of the root-mean-square error between observed and calculated values of the four-parameter logistic equation using the simplex optimizer of the Apache Commons Math library. Concentrations where the fitted curves cross the 50% response (DC50) and the maximal response achieved (Emax) were computed at a given time point.
Results
Cell-Free Systems Support On-Mechanism BiDAC-Induced Ubiquitination of the BRD4 BD1 Domain
To overcome challenges of in-cell ubiquitination assays and the complexity and number of components of a purely recombinant system, we instead used cell-free lysates derived from HeLa cells to investigate the BiDAC-induced ubiquitination of the purified recombinant BD1 domain of BRD4 (BD1) with an HA-tag. The HA-tag was chosen due to the availability of high-affinity monoclonal antibodies and the absence of lysine residues, preventing nonspecific ubiquitination. Similar systems have been described previously.36–39 In order to compare rates of ubiquitination, three compounds derived from the same BRD4 inhibitor, a derivative of JQ1, 41 were converted into BiDACs by incorporating an alkyl linker and either a phthalimide or isoindolinone-based CRBN binder ( Fig. 2 ). These BiDACs were then used to study the kinetic differences in induced BD1 ubiquitination.
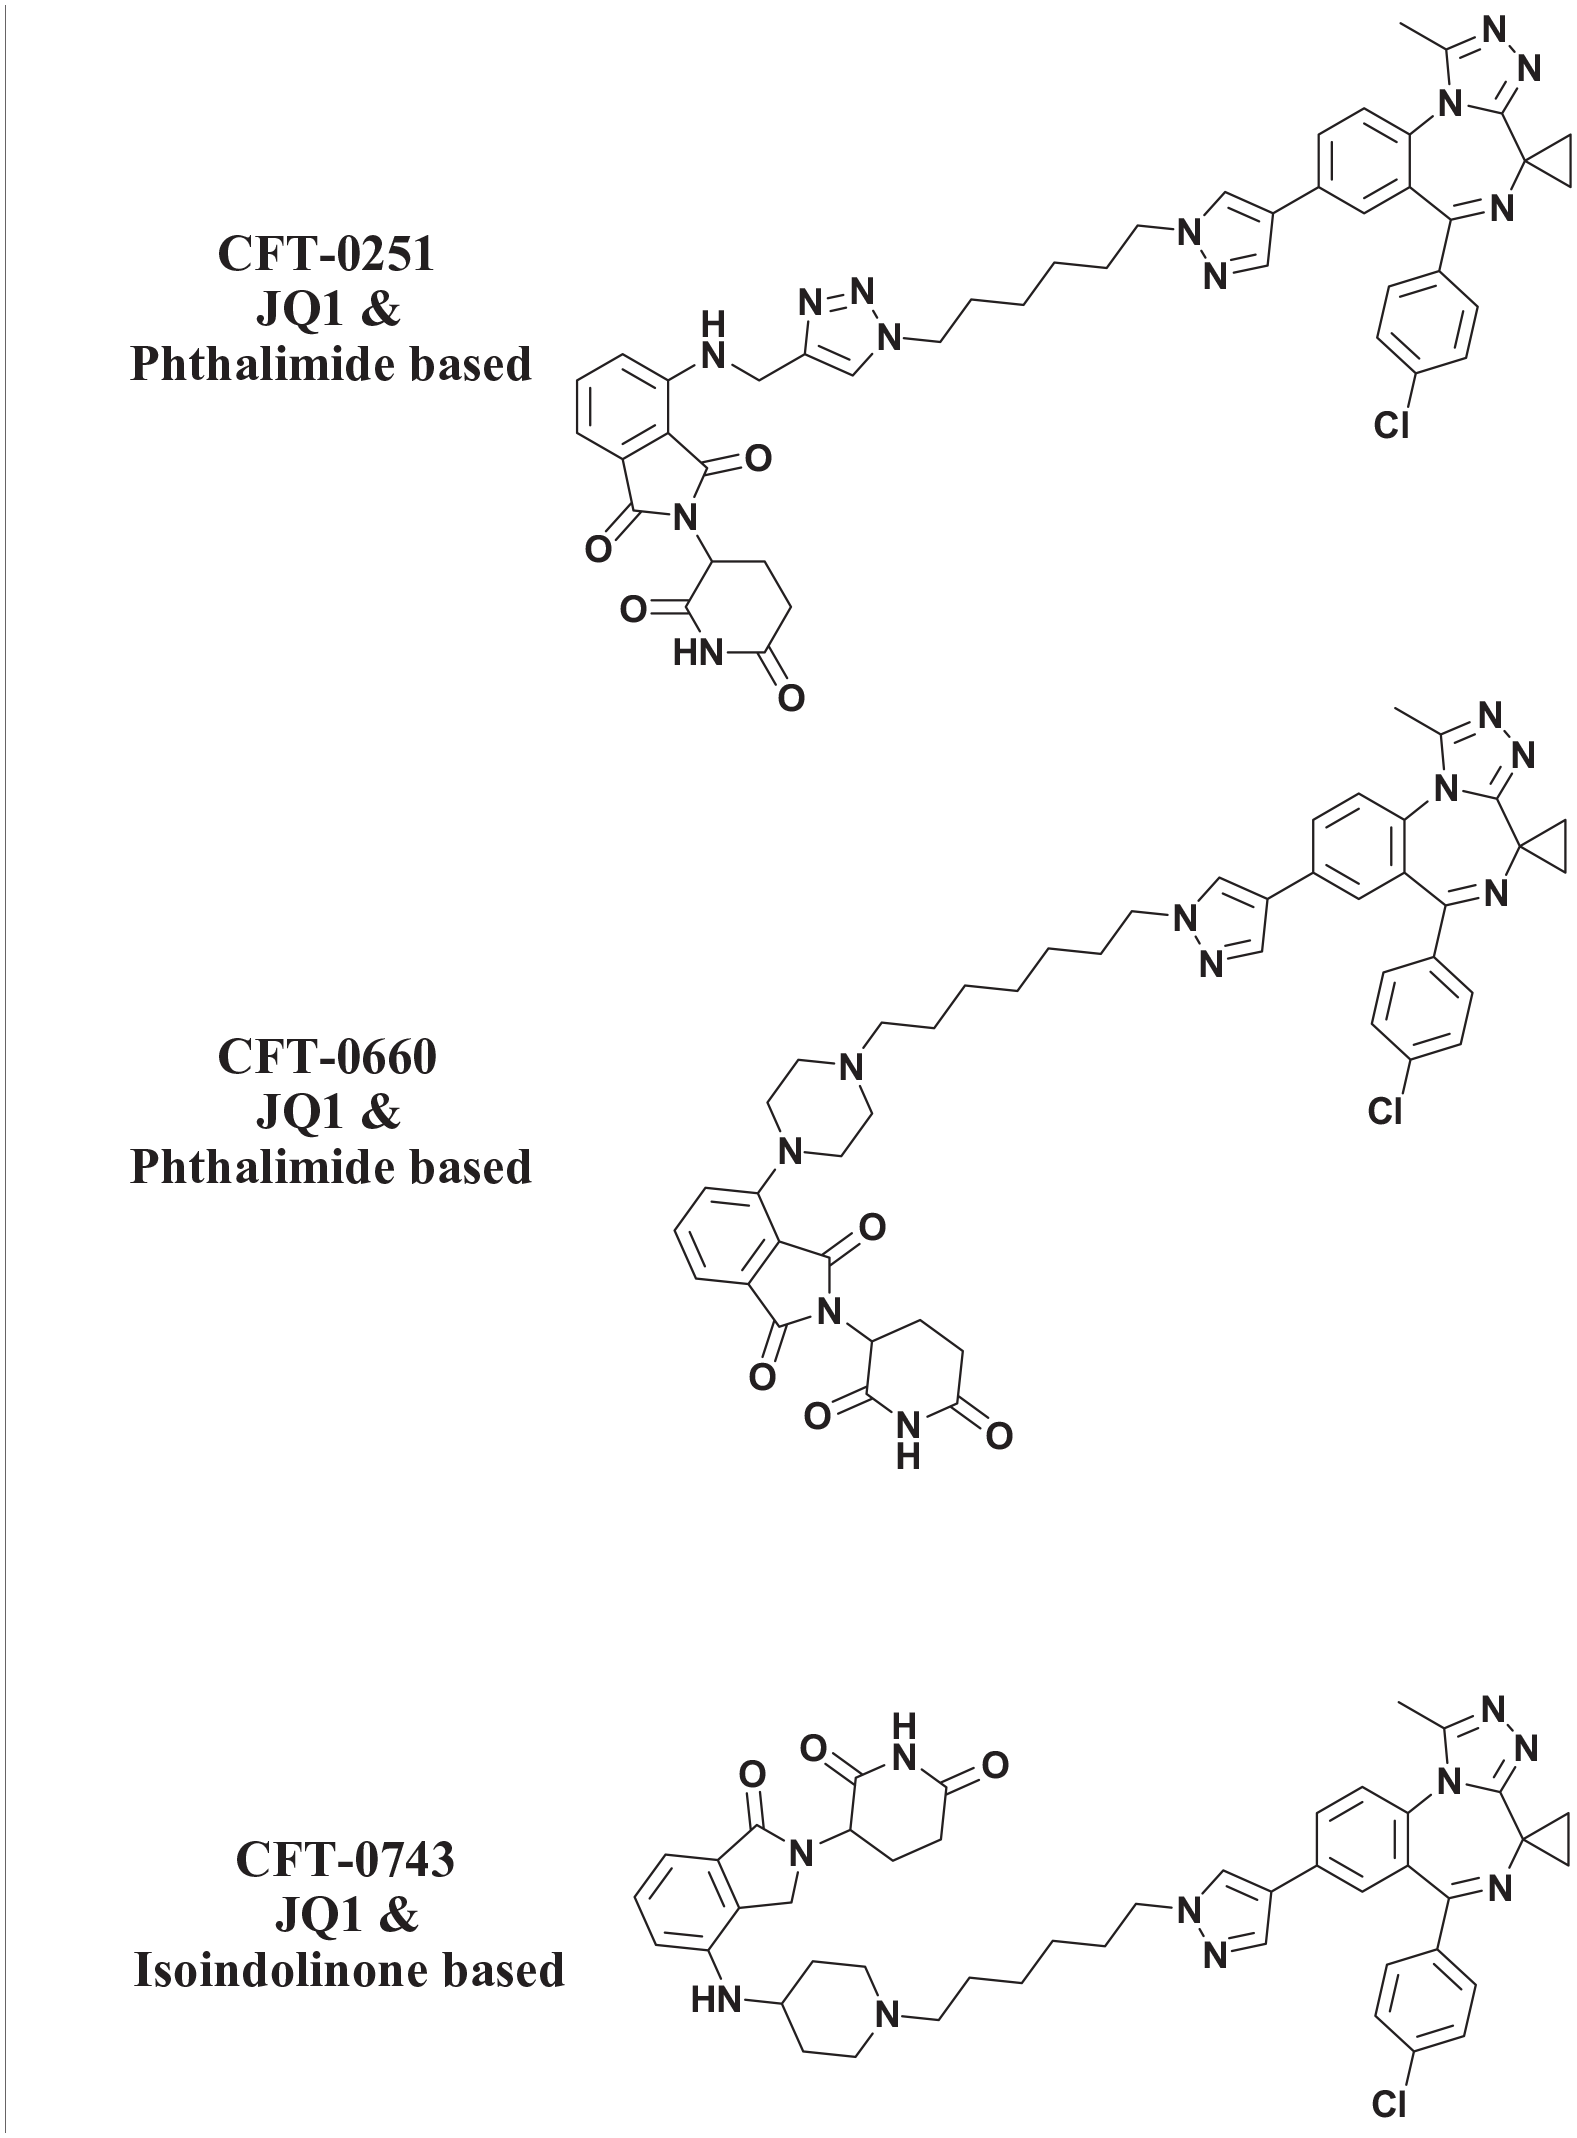
Structures of BiDACs used in this study.
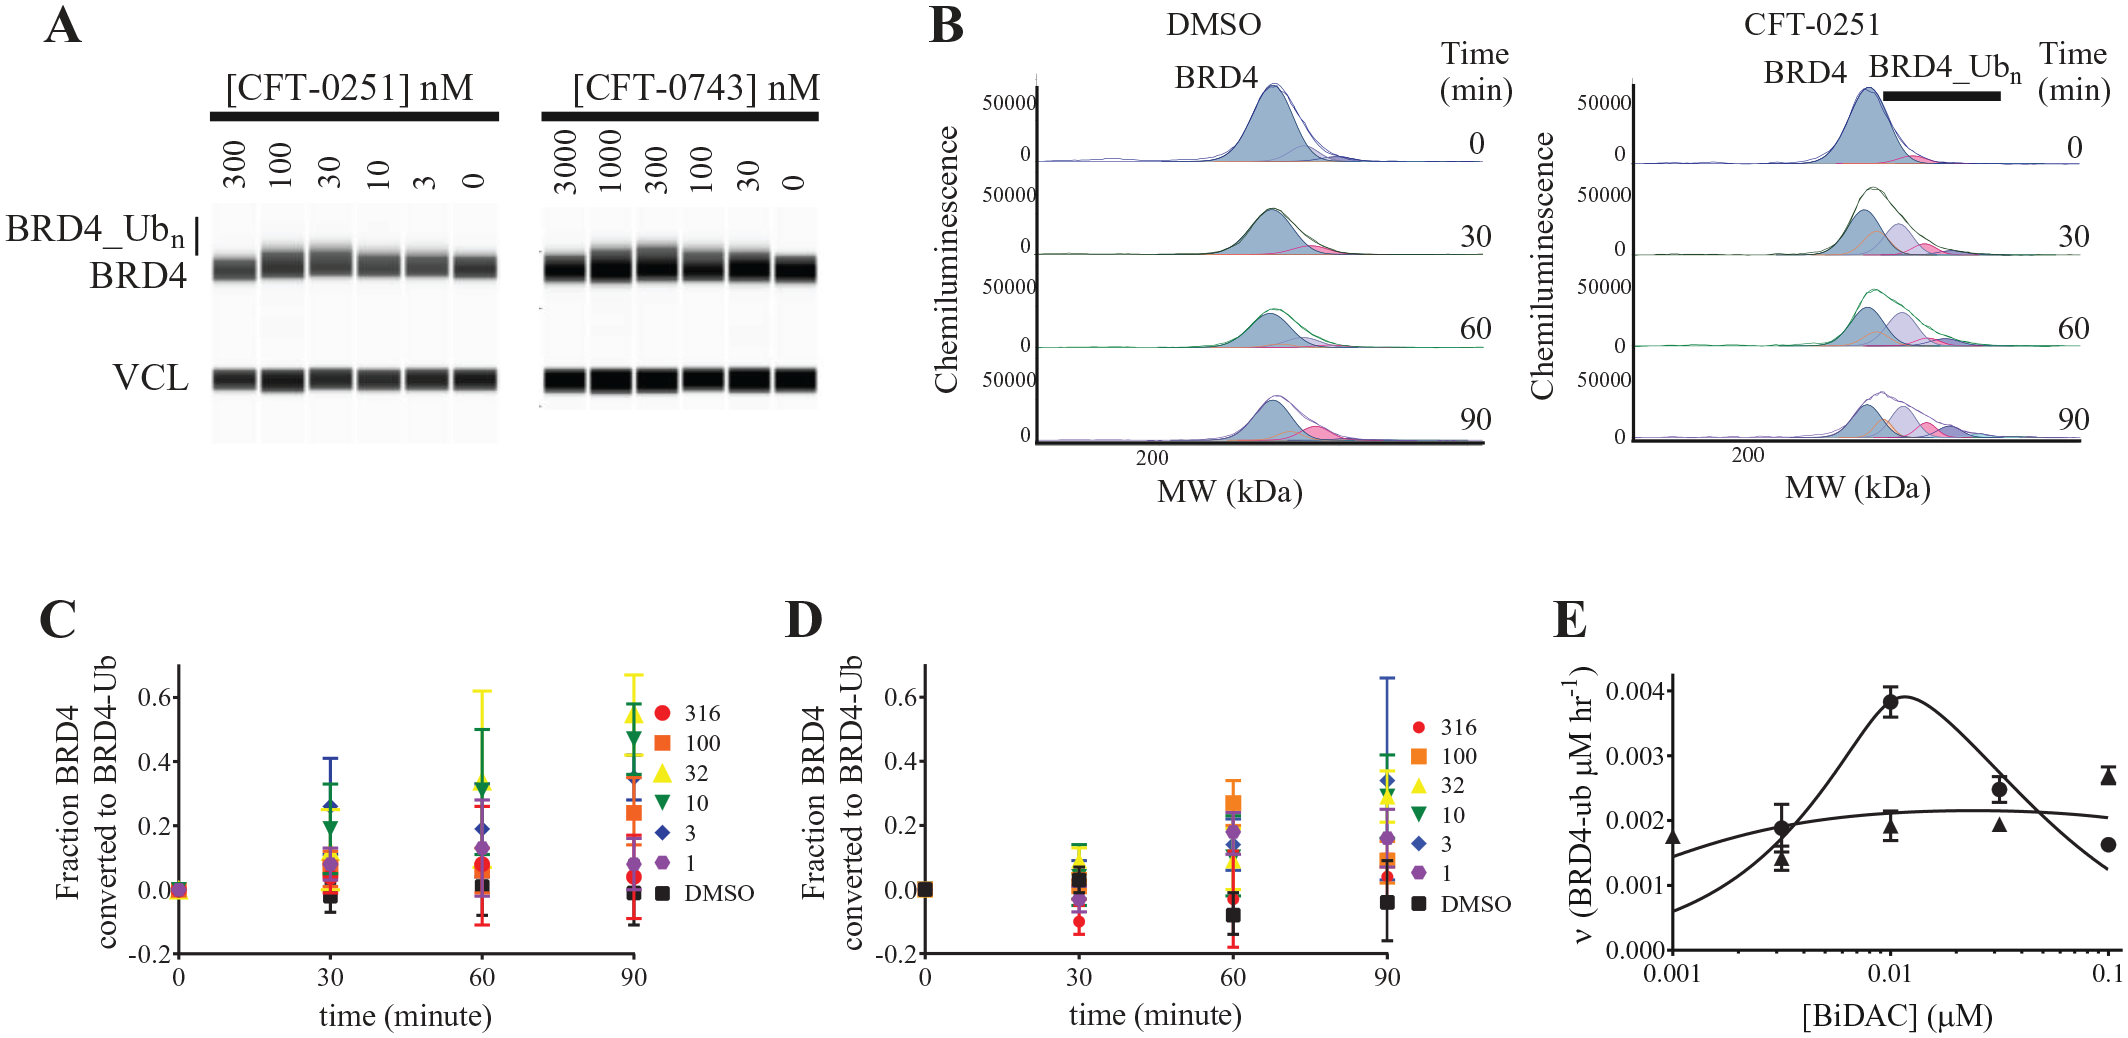
The cell-free ubiquitination reaction, coupled with capillary electrophoresis and immunodetection, allowed for the subsequent quantification of targeted ubiquitination induced by a BiDAC. Ubiquitination reactions were carried out by incubating the purified BD1 in HeLa lysates with varying concentrations of CFT-0251. The reactions were quenched, and BD1 ubiquitination was detected through immunodetection methods against its C-terminal HA-tag using automated capillary electrophoresis. Initial experiments showed that CFT-0251 at 30 nM demonstrated robust ubiquitination and was used to characterize the system ( Fig. 3A ).
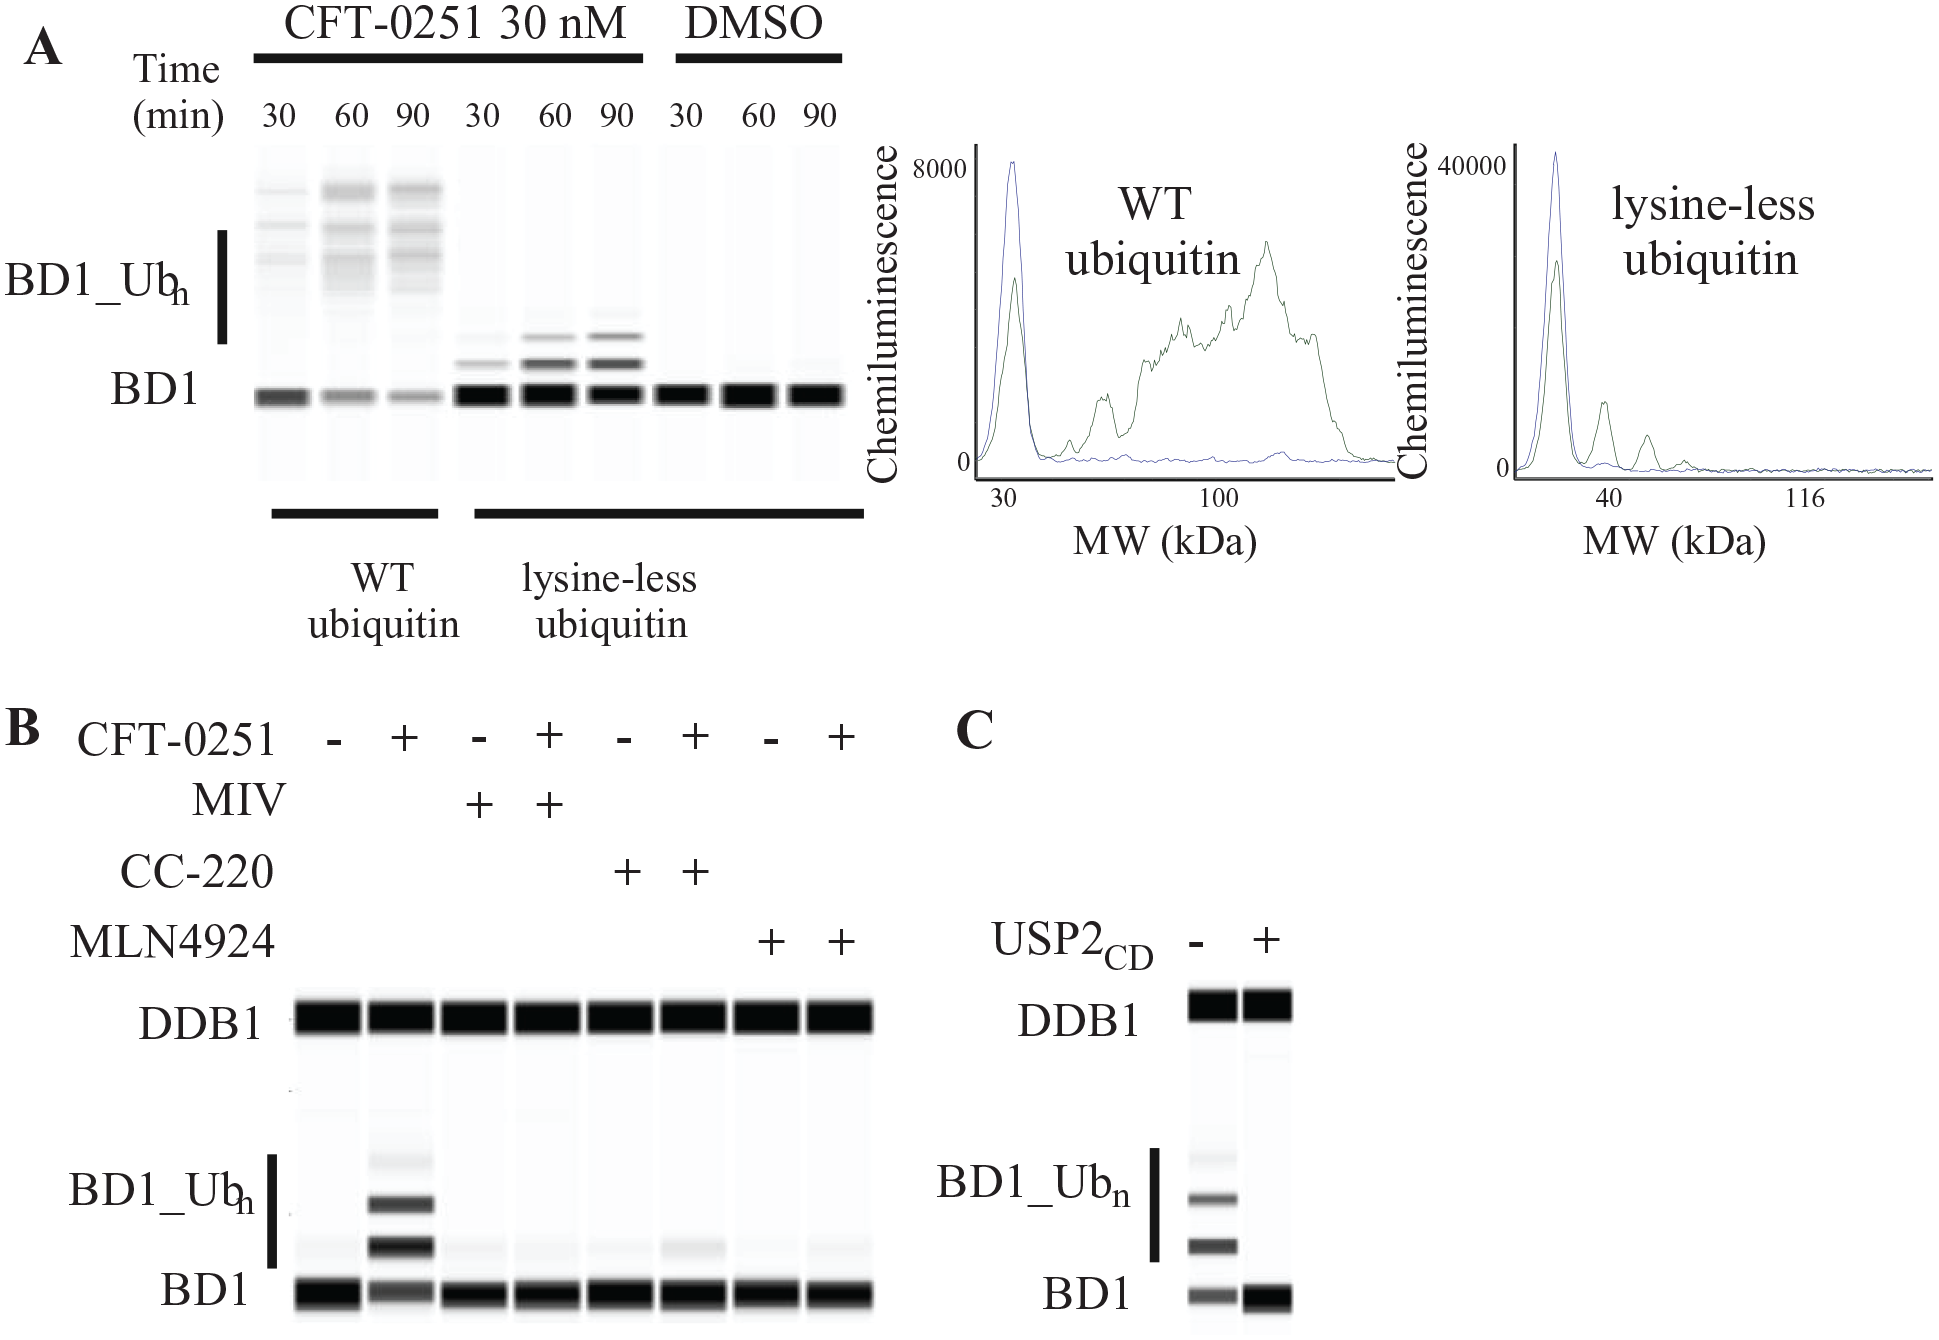
Cell-free lysates support on-mechanism ubiquitination of BD1 of BRD4. (
The cell-free lysate system supported ubiquitination of the BD1 domain with either ubiquitin or lysine-less ubiquitin, which does not form ubiquitin chains, both of which allowed for the small-molecular-weight BD1 protein to be resolved from BD1–ubiquitin conjugates using automated capillary electrophoresis ( Fig. 3A ). Notably, BD1 ubiquitinated with lysine-less ubiquitin resulted in well-resolved peaks, allowing for direct determination and quantitation of the number of distinct ubiquitinated sites on BD1. Since the lysine-less ubiquitin does not support the formation of polyubiquitin chains, the appearance of multiple bands indicates that multiple target lysine residues were ubiquitinated, which is consistent with prior biochemical studies with BRD4 BiDACs. 42
To confirm that each discrete peak represents the time-dependent conjugation of a lysine-less ubiquitin to the BD1 domain, the sample was treated with the promiscuous catalytic domain of the deubiquitinase USP2 (USP2CD) ( Fig. 3C ). The loss of the higher-molecular-weight bands with USP2CD supports the hypothesis that these larger-molecular-weight bands are due to the addition of ubiquitin to the BD1 domain.
Finally, to confirm the on-mechanism ubiquitination of BD1, excess concentrations of ligands and inhibitors to different components of the system (10 µM) were added to the ubiquitination assay in the presence and absence of CFT-0251. All compounds blocked the CFT-0251-induced ubiquitination of BD1 ( Fig. 3B ). Experiments with mivebresib, which is a potent BRD4 BD1 and BD2 inhibitor, and CC-220, a potent CRBN binder, abolished BD1 ubiquitination. MLN-4924, a potent neddylation inhibitor, also blocked CFT-0251-induced ubiquitination and demonstrated the dependence of degradation on the E1 activation of neddylation and subsequent activation of the Cullin family of E3 ligases, including CUL4. These observations cumulatively demonstrated that the cell-free ubiquitination reaction of CFT-0251 faithfully recapitulated the mechanism of degradation in intact cells.
Insights into BD1 Ubiquitination through Binary and Ternary Complex Formation
We proceeded to establish a quantitative model of BRD4 ubiquitination. BiDAC-mediated ubiquitination is dependent on two independent processes: ternary complex formation and the kinetic rate of ubiquitination by CRBN. Ternary complex formation is a thermodynamic equilibration process that can be evaluated in biochemical assays independently from ubiquitination. As described by Douglass and colleagues, ternary complex formation is driven by BiDAC affinity to two proteins. 43 In the case of the BRD4 BiDACs studied here, the BRD4 binding warhead has a higher binding affinity than the CRBN binding ligand, and therefore the ternary complex formation constant (KTF) would be expected to closely track with the binary binding interaction constant between BiDAC and the BRD4 BD1 domain. In contrast, the ternary complex inhibition constant (KTI) should most closely correlate with the binary BiDAC to E3 ligase binding constant. Importantly, ternary complex formation is also influenced by either positive or negative protein–protein cooperativity, which can enhance or weaken complex formation compared with calculations based on the mathematical analytical solution, which assumes no cooperativity upon complex formation. 43
To determine the affinities of the binary interactions between the BiDAC and each of the proteins, we used FP to measure binding to the BD1 domain of BRD4 and the E3 ligase CRBN-DDB1. The affinities for BD1 were very similar for all BiDACs tested, with KD values ranging from 19 ± 11 to 68 ± 37 nM. For binding to the CRBN E3 ligase, KD values were similar for CFT-0251 and CFT-0743 at 49 ± 2 and 13 ± 3 nM, respectively, while CFT-0660 had roughly 50-fold weaker affinity for CRBN at 2160 ± 1300 nM (
Summary of Rate and Binding Constants for BD1.
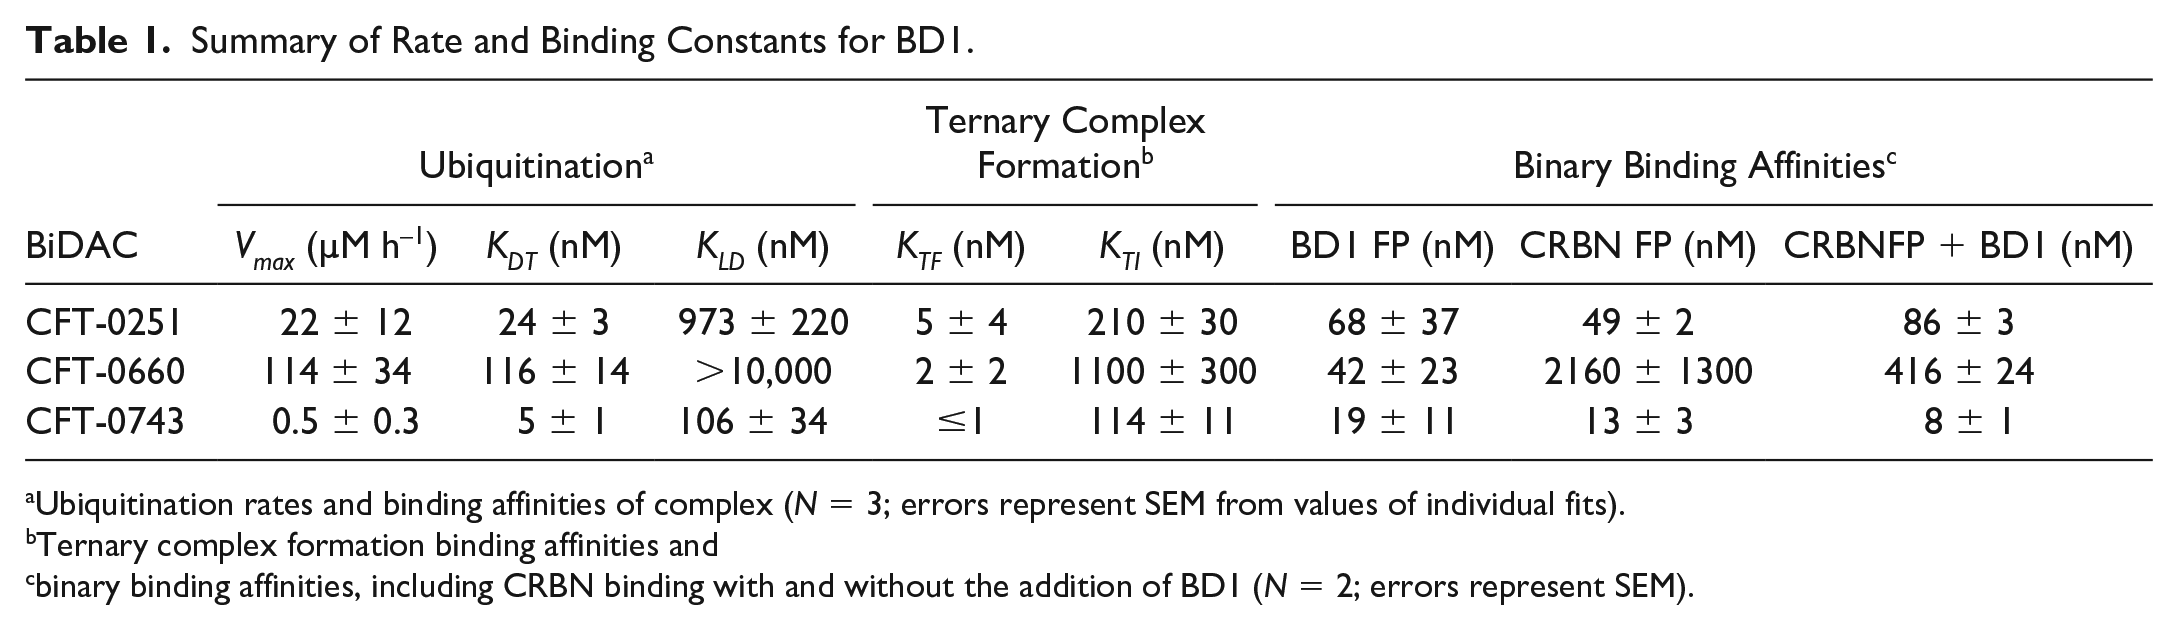
Ubiquitination rates and binding affinities of complex (N = 3; errors represent SEM from values of individual fits).
Ternary complex formation binding affinities and cbinary binding affinities, including CRBN binding with and without the addition of BD1 (N = 2; errors represent SEM).
To further quantify ternary complex formation, we used an AlphaLISA-based approach to derive KTF and KTI. These values reflect the binding of the BiDAC to BD1 and CRBN, respectively, in the context of the ternary complex (
Kinetics of BD1 Ubiquitination
While ternary complex formation is a prerequisite for ubiquitination, it does not necessarily determine the rate of ubiquitination. To test if the BiDACs from the same chemical series have differences in catalytic efficiency or only vary in terms of thermodynamic parameters, we measured initial rates of ubiquitination of the BD1 domain of BRD4 in cell-free lysates. To drive the ubiquitination reaction with lysine-less ubiquitin and to ensure that its depletion does not occur during the assay, we supplemented cell extracts with 150 µM lysine-less ubiquitin. BiDAC concentrations were varied from 3 nM to 1 µM (CFT-0251 and CFT-0743) or from 30 nM to 10 µM (CFT-0660). The amount of BD1 converted to ubiquitin-conjugated BD1 (BD1_ub) was then measured by immunodetection at four time points, including at time zero ( Fig. 4A ). The fraction of all species (BD1 and BD1_Ubn) was calculated from the AUC obtained at each time point as described in eq 2. The DMSO control shows low background ubiquitination over the 90 min time course. In contrast, at the dose at which maximal ubiquitination occurs (300 nM) for CFT-0251 ( Fig. 4A ), significant ubiquitination of BD1 occurs over the full time course of the experiment ( Fig. 4B ). The ubiquitination induced by these BiDACs ultimately leads to degradation, as demonstrated in 293T cell lines, which overexpress BD1 tagged with HiBiT ( Table 2 ).
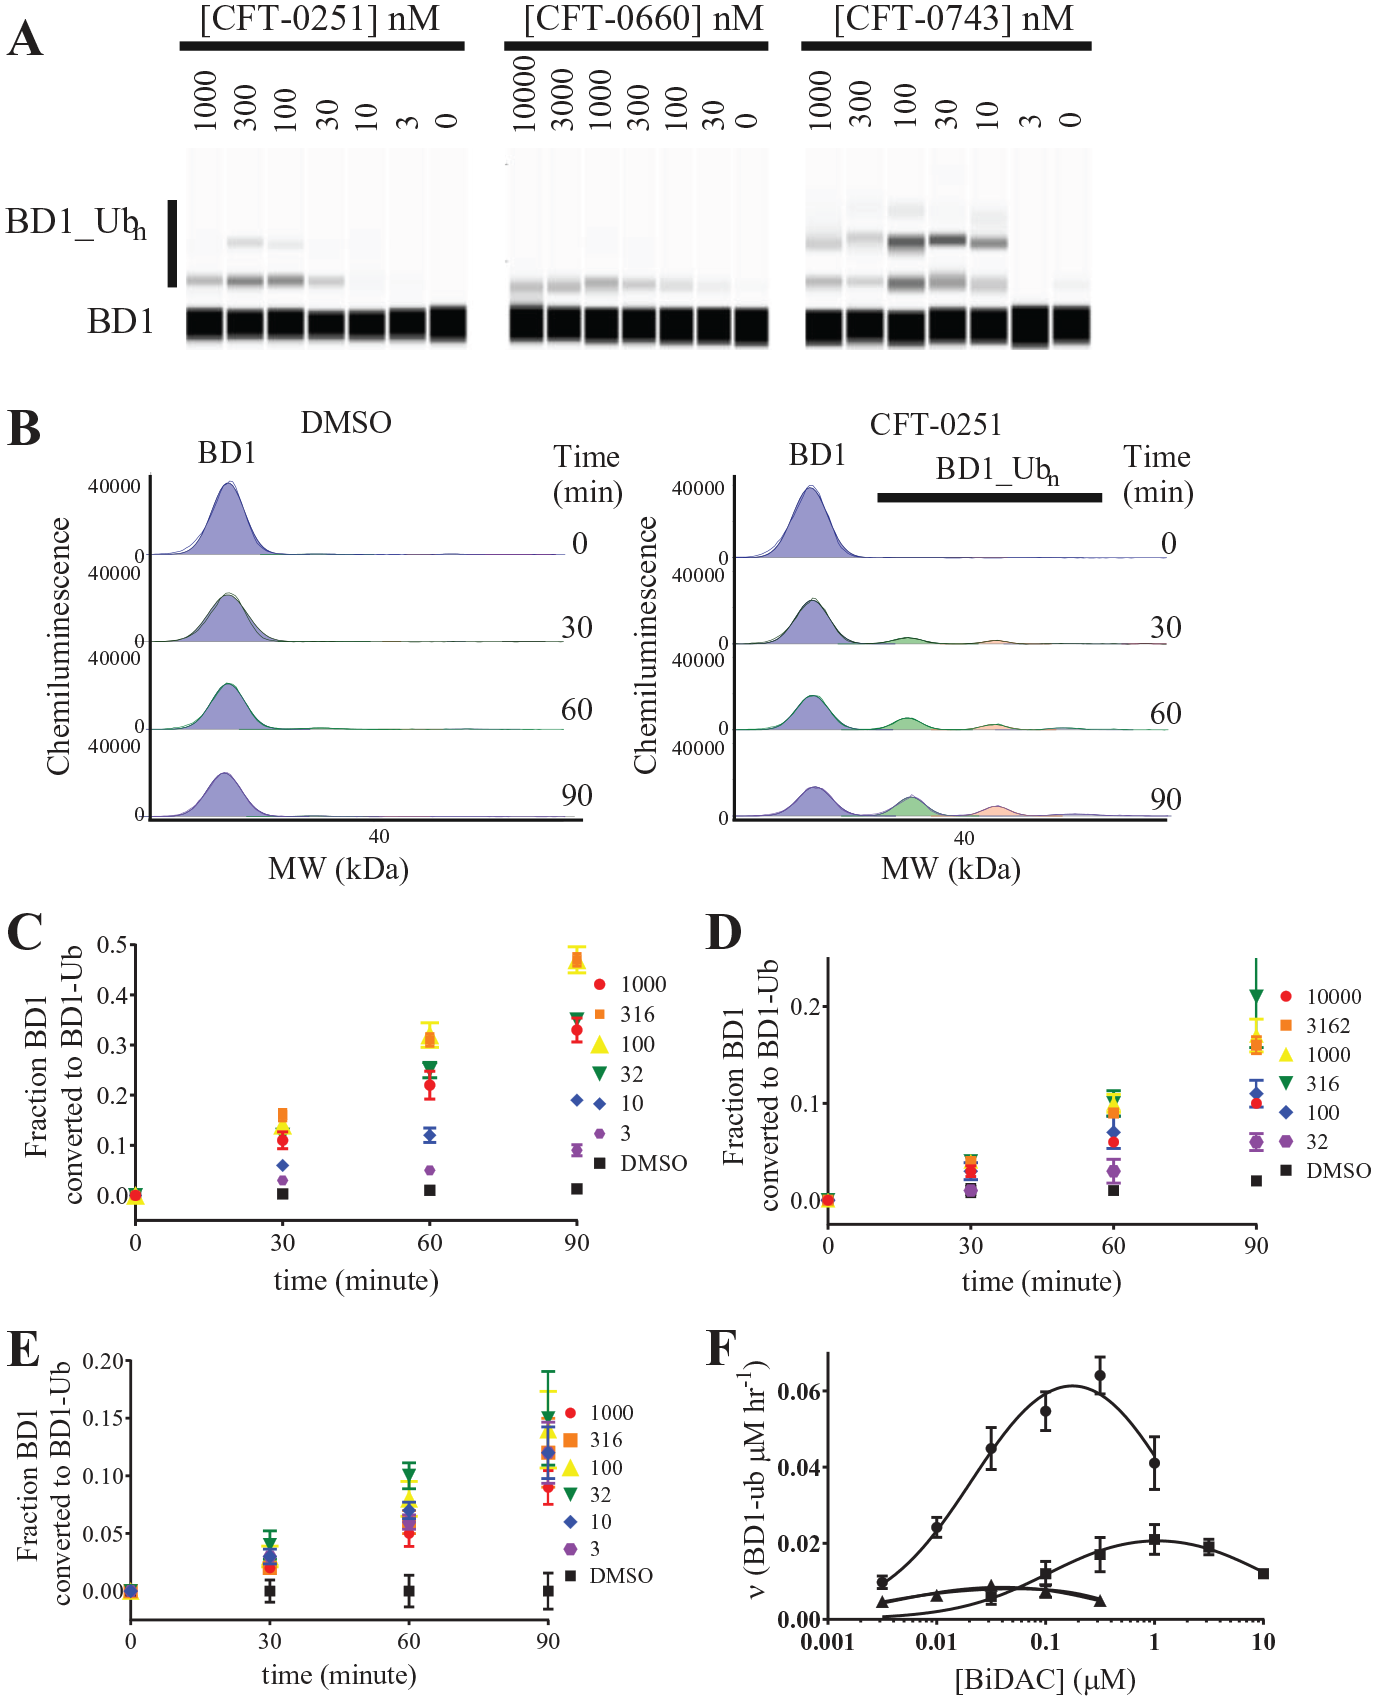
BD1 ubiquitination induced by BiDACs described by an essential activator model. (
Degradation Parameters for BD1.
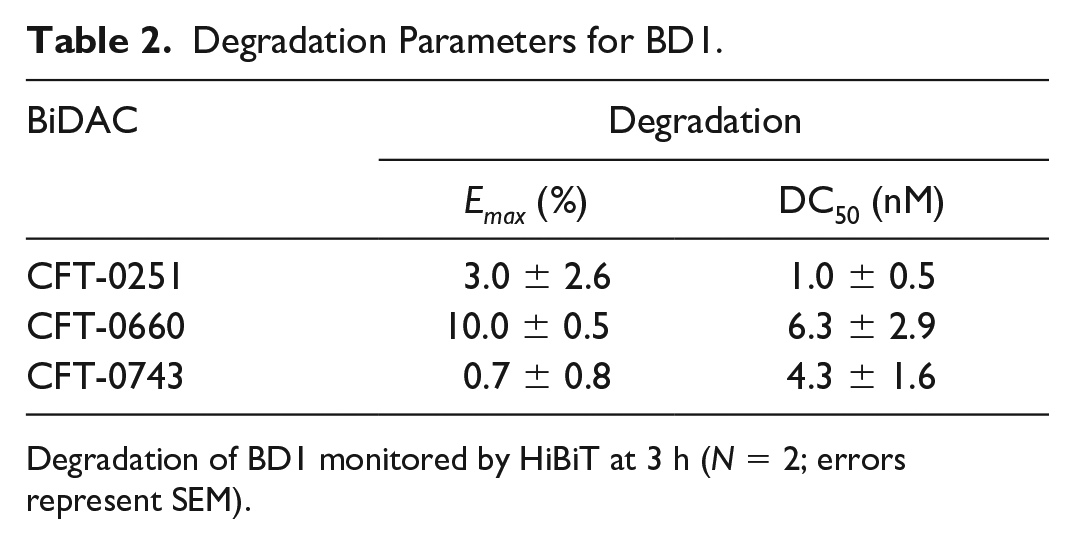
Degradation of BD1 monitored by HiBiT at 3 h (N = 2; errors represent SEM).
To assess the kinetic properties of the BiDACs, we have used an essential enzyme activator model described by Segel 35 ( Fig. 1 , eq 1) to calculate the maximal rate (VMAX) of ubiquitination. In this model, the target bound to the BiDAC is recognized by the E3 ligase for ubiquitination. This model is based on a rapid equilibrium assumption, and therefore it is assumed that the formation of ternary complex is dependent on the equilibrium constants of the BiDAC for the CRBN (KLD) and BRD4 BD1 (KDT) domains. To reduce the number of parameters in the fit, KLDT was set equal to KLD, assuming no cooperativity between the ligase and the BiDAC when it is bound to the target. This assumption is justified since the binding affinities from the binary binding assays are comparable affinities obtained in the kinetic ubiquitination assay ( Table 1 ). To account for ligase, Vmax is equal to kcat multiplied by the concentration of the ligase ( Fig. 1 , eq 3).
From time courses over a range of concentrations ( Fig. 3C–E ), only time points for which the resulting signal was above the DMSO control were used for analysis ( Fig. 3F ). We simplified the kinetic processing further by using the lysine-less ubiquitin, which can only undergo monoubiquitination. In support of this, detailed studies on the SCF-Cdc34 E3 ligase have shown that the monoubiquitination step is rate limiting. 13 The resulting rate versus BiDAC concentration curve revealed a bell-shaped curve that is consistent with the hook effect for the ternary complex formation of the ligase, BiDAC, and target protein35,43 for all three compounds ( Fig. 4F ). The essential activator kinetic model was fit to these data to determine the maximal rate of ubiquitination (VMAX) for each BiDAC. Importantly, the maximal rate varied between 0.5 and 113.6 µM BD1 ubiquitinated per hour ( Table 1 ), suggesting that the maximal rate of ubiquitination was very different across these BiDACs, even though they are members of the same chemical series.
Importantly, ternary complex formation parameters in the AlphaLISA assay and parameters extracted from the enzyme activator model rank order for all compounds. Interestingly, CRBN affinity was most potent in the binary assay and was weakest in the cell lysate, suggesting that steric hindrance (from the alpha beads and additional components of the E3 ubiquitination system) weakens the BiDAC-CRBN interactions. In particular, CRBN binding by CFT-0660 was very weak in the kinetic assay in spite of strong positive cooperativity observed in the ternary complex and the FP assays for this compound.
Further, the amount of the ternary complex formation
35
(height of the peak,
Kinetics of Endogenous BRD4 Ubiquitination
In addition to the ubiquitination of the BD1 domain of BRD4, the cell-free system also supports the examination of endogenous BRD4 ubiquitination (
Studies were performed with CFT-0251, CFT-0660, and CFT-0743 (
BRD4 ubiquitination induced by BiDACs. (
As with the BD1 domain studies, CFT-0251 reached a peak maximal velocity of ubiquitination and CFT-0743 exhibited a flat-rate curve (
Fig. 5E
). However, the maximal velocity is an order of magnitude slower for endogenous BRD4, which is expected at lower protein concentrations of roughly 10 nM in the cell-free extract (estimated using a purified protein standard) (
Ubiquitination Pattern Differences
In addition to the overall number of ubiquitin molecules added, the pattern of ubiquitination could also play a role in determining the fate of the target protein.
13
While the detailed analysis of ubiquitination patterns is outside of the scope of this paper, our approach provided us with an opportunity to observe differential BiDAC-induced ubiquitination patterns. The number of individual ubiquitin molecules added was analyzed using both the His-BD1-HA and the lysine-less ubiquitin constructs under conditions where the BiDACs were incubated at the optimal concentration (Cmax) for ubiquitination. These studies demonstrated that multiple ubiquitination sites on BD1 were observed for all compounds tested. To better understand the different ubiquitination site preferences, the ubiquitination levels were assessed at time points that corresponded to a similar fraction of target converted between 5–15% (
Fig. 5A
). Generally, the ubiquitination profile was dominated by monoubiquitination, with smaller amounts of diubiquitination and triubiquitination (
Fig. 5B
,
Discussion
Approaches to quantifying specific elements of the targeted protein degradation cycle have been described, including ternary complex formation, individual protein component engagement to small molecules, in-cell ubiquitination, and overall protein degradation.6,20,28 A key feature of BiDACs is the catalytic nature of the molecules. 27 However, detailed methods to quantify the specific catalytic activity steps have not been established. Here we show how cell-free ubiquitination reactions, coupled with quantitative analysis using an enzyme activator kinetic model, can be used to quantify the kinetics of BiDAC-induced ubiquitination and compare the active complex affinities with thermodynamic parameters underpinning the target, ligase, and BiDAC interactions.
A similar ranking of BiDAC ubiquitination kinetics was observed for endogenous BRD4 ( Fig. 5E ) and BD1 ( Fig. 4F ) domains. The lack of resolution of the peaks of nonubiquitinated and ubiquitinated BRD4 presents challenges for large-molecular-weight endogenous proteins. In addition, lysine-less ubiquitin was used for BD1 kinetics to allow for discrete peaks for quantification, whereas wild-type ubiquitin was used for BRD4 and captured the processivity of ubiquitin chain formation. The similar rank order of the rates of ubiquitination induced by BiDACs in the two formats indicates that processivity was not a significant factor in the relative ubiquitination rates for this system, in agreement with previous reports that monoubiquitination is the rate-limiting step in the process. 13
Here we show that the parameters that govern BiDAC interactions and catalytic behavior can be simplified to KDT, KLD, and Vmax using an enzyme activator model to fit rates of ubiquitination (
For example, the slower rate of ubiquitination and affinities of CFT-0743 are informative. The low amplitude in the ubiquitination assay relative to the ternary complex assay ( Table 1 ) and the favoring of multiple lysines ubiquitinated on BD1 compared with other compounds ( Fig. 6 ) raise the possibility of additional interactions in the cell-free ubiquitination assay. Additional factors governing the ubiquitination could arise due to the interfaces formed between the target protein and ubiquitination machinery components,42,44,45 such as E2 ligases.46–49 Additionally, the AlphaLISA ternary complex could introduce artificial constraints due to tags and binding to beads, which could limit the protein–protein interfaces formed, which are accessible to the protein complex in the purified binary system. Additionally, the cell-free extract also contains constraints that weaken the binding affinity compared with the purified binary system. However, in every measurement of affinity CFT-0743 had the tightest binding. These data could be used to improve the properties of the BiDAC during the drug development process. For CFT-0743, it might be beneficial to optimize catalytic efficiency even at the expense of potency.
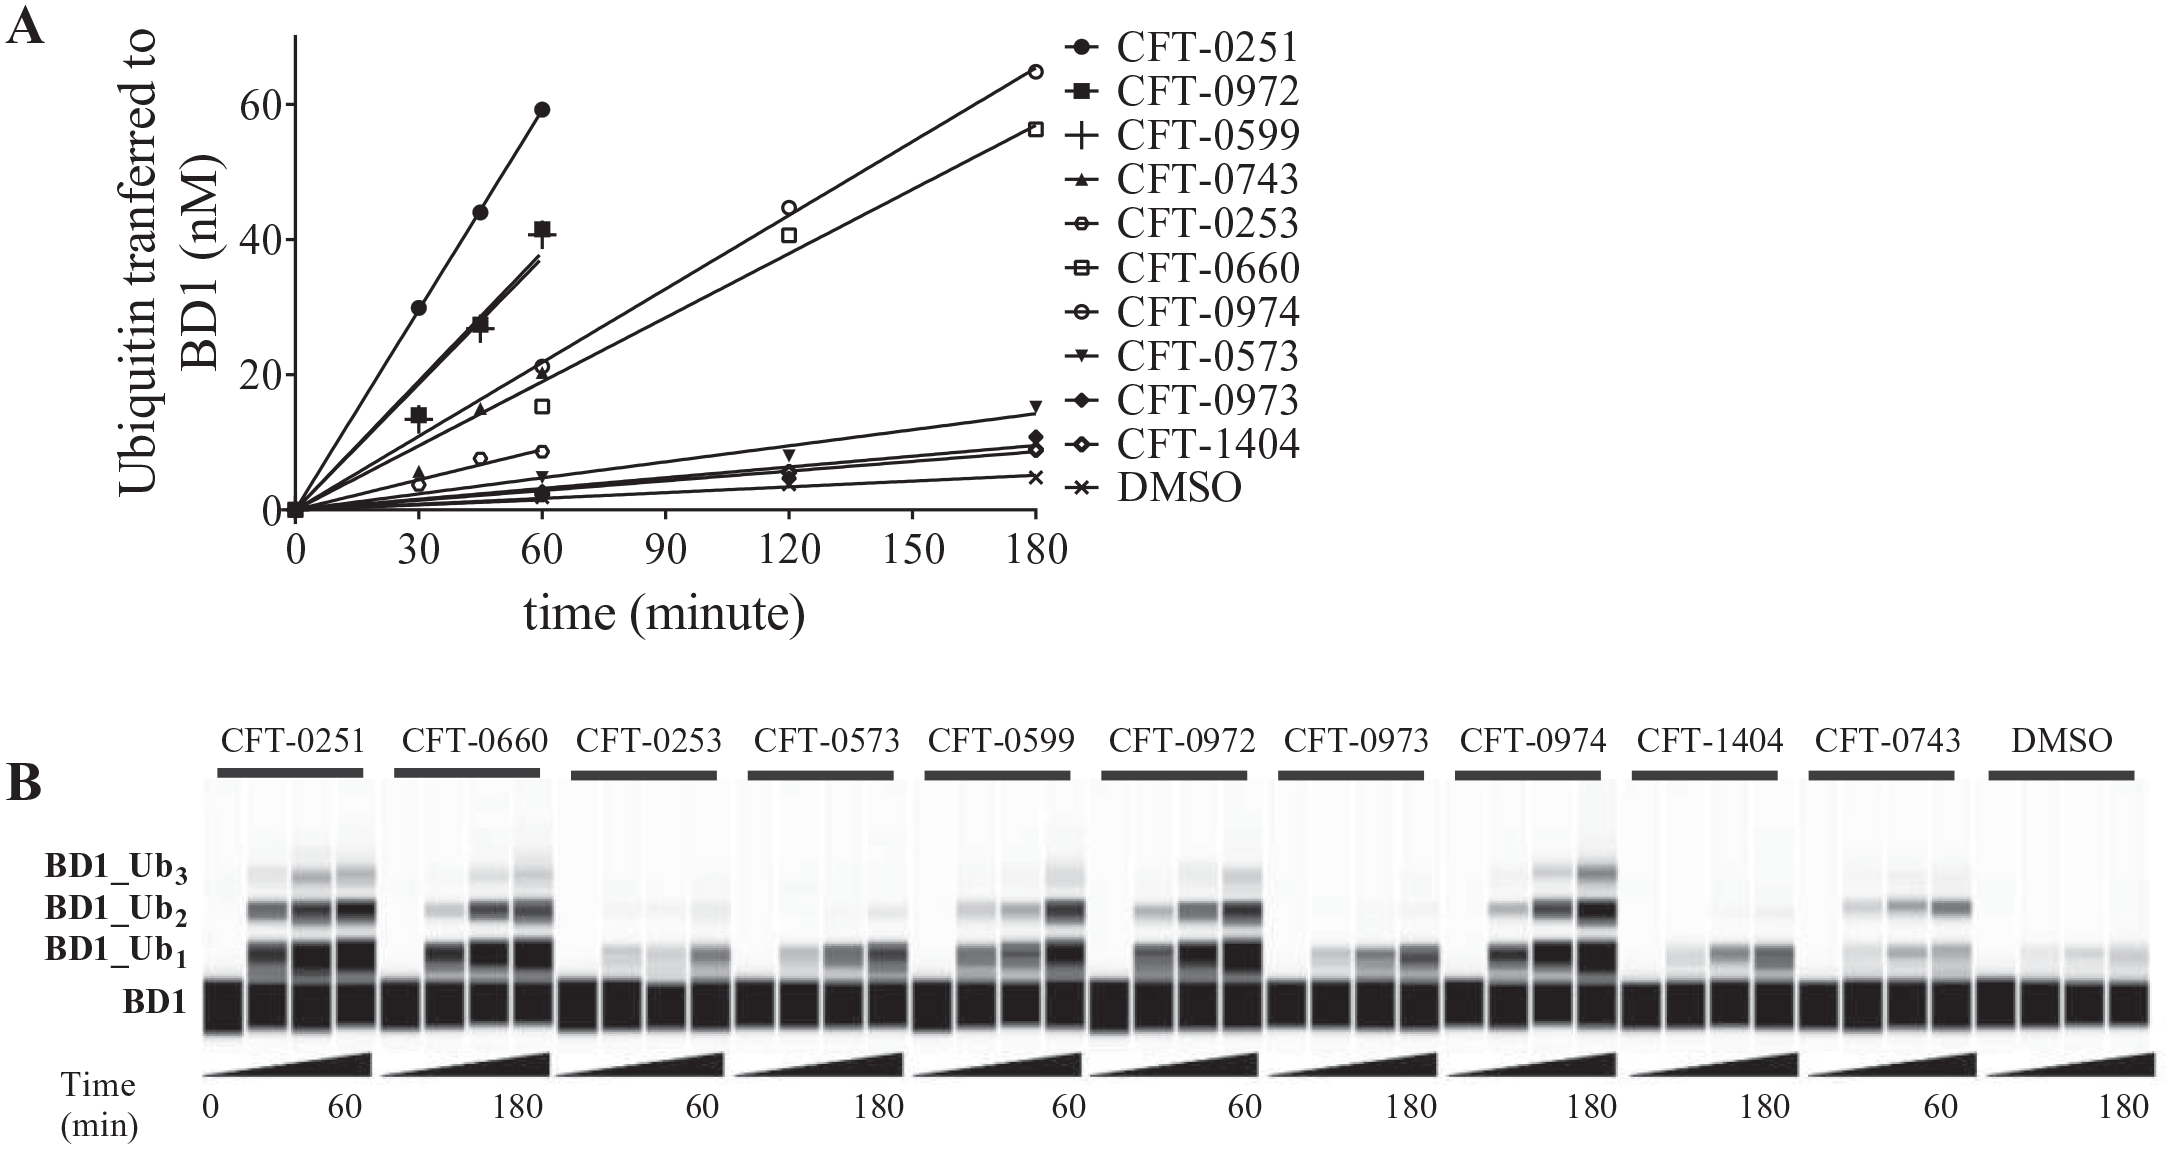
BiDAC-induced ubiquitination of BD1 varies in number of ubiquitination sites. (
We also noted that a binding affinity for CRBN was not a determinant for maximal catalytic turnover. While CFT-0660 had a maximal observed velocity in the middle of the three BiDACs, the fitted VMAX parameter for this compound was significantly faster than that determined for CFT-0251 and CFT-0743. Interestingly, CFT-0660 exhibited the weakest affinity for CRBN. Destabilizing the CRBN–product complex relative to other BiDACs may allow the ubiquitinated target to dissociate faster, thereby freeing up CRBN and BiDAC for the ubiquitination of additional BD1, resulting in a faster turnover of BD1. However, in this case, the weaker affinity for the ternary complex dramatically affects the concentration at which ubiquitination can occur in the cell. As a result, the optimization could focus on improving the CRBN affinity for the BiDAC.
Understanding the ubiquitination rates provides insights into chemical elements of a BiDAC series that optimize the E3 ligase processing of target proteins. This is particularly true for challenging proteins of interest, where the rate of ubiquitination may prove to be a critical parameter for optimization, along with the binding affinities of binary and ternary complexes.
21
While the methods and systems to quantitatively describe the thermodynamics and kinetics of degradation have yet to be developed, it is certainly the next step to fully understand the process of BiDAC-induced protein degradation and the contribution of every step of the cycle to the overall rate of degradation. The BiDACs presented here achieved similar degradation profiles at 3 h through different means. For example, CFT-0743 overcomes a slow rate of ubiquitination with tight affinities, while CFT-0660 overcomes weak binding with a faster rate of ubiquitination (
Supplemental Material
sj-pdf-1-jbx-10.1177_24725552211000673 – Supplemental material for A Method for Determining the Kinetics of Small-Molecule-Induced Ubiquitination
Supplemental material, sj-pdf-1-jbx-10.1177_24725552211000673 for A Method for Determining the Kinetics of Small-Molecule-Induced Ubiquitination by Ellen F. Vieux, Roman V. Agafonov, Lydia Emerson, Marta Isasa, Richard W. Deibler, Jeffrey R. Simard, David Cocozziello, Brendon Ladd, Linda Lee, Heng Li, Stephen Archer, Mark Fitzgerald, Ryan Michael, Christopher G. Nasveschuk, Eunice S. Park, Gunther Kern, David A. Proia, Andrew J. Phillips and Stewart L. Fisher in SLAS Discovery
Footnotes
Acknowledgements
We thank Mathew E. Sowa and Scott J. Eron for fruitful discussions. The term BiDAC is a trademark of C4 Therapeutics, Inc.
Supplemental material is available online with this article.
Declaration of Conflicting Interests
The authors declared the following potential conflicts of interest with respect to the research, authorship, and/or publication of this article: The authors were employees and equity holders of C4 Therapeutics, Inc. when the work in this article was performed.
Funding
The authors received no financial support for the research, authorship, and/or publication of this article.
References
Supplementary Material
Please find the following supplemental material available below.
For Open Access articles published under a Creative Commons License, all supplemental material carries the same license as the article it is associated with.
For non-Open Access articles published, all supplemental material carries a non-exclusive license, and permission requests for re-use of supplemental material or any part of supplemental material shall be sent directly to the copyright owner as specified in the copyright notice associated with the article.