
Abstract
Antiretroviral therapy is able to effectively control but not eradicate HIV infection, which can persist, leading to the need for lifelong therapy. The existence of latently HIV-infected cells is a major barrier to the eradication of chronic HIV infection. Histone deacetylase inhibitors (HDACis), small molecules licensed for oncology indications, have shown the ability to produce HIV transcripts in vitro and in vivo. The pharmacologic parameters that drive optimal HIV latency reversal in vivo are unknown and could be influenced by such factors as the HDACi binding kinetics, concentration of compound, and duration of exposure. This study evaluates how these parameters affect HIV latency reversal for a series of novel HDACis that differ in their enzymatic on and off rates. Varying cellular exposure, using automated washout methods of HDACi in a Jurkat cell model of HIV latency, led to the investigation of the relationship between pharmacokinetic (PK) properties, target engagement (TE), and pharmacodynamic (PD) responses. Using an automated robotic platform enabled miniaturization of a suspension cell-based washout assay that required multiple manipulations over the 48 h duration of the assay. Quantification of histone acetylation (TE) revealed that HDACis showed early peaks and differences in the durability of response between different investigated HDACis. By expanding the sample times, the shift between TE and PD, as measured by green fluorescent protein, could be fully characterized. The comprehensive data set generated by automating the assays described here was used to establish a PK/PD model for HDACi-induced HIV latency reversal.
Introduction
Since the start of the HIV pandemic, intensive research has resulted in the development of a number of antiretroviral drugs that target different stages of the HIV life cycle. Current therapy uses combined classes of antiretroviral drugs (combined antiviral therapy [cART]) to suppress plasma viremia to below the level of quantification by standard clinical viral load assays. However, in the overwhelming majority of patients, viral recrudescence occurs within 4 to 8 wk of interruption of cART, 1 resulting in a requirement for lifelong and uninterrupted cART to maintain viral suppression. Although cART is effective at preventing viral replication in the periphery, recent reports have indicated that it might be ineffective at preventing replication in some tissues.2,3
HIV infection can also persist in resting memory T cells that harbor fully replication competent proviral DNA but are transcriptionally silent. As a consequence, these latently infected T cells do not express viral antigens and remain invisible to immune surveillance. 4 Upon antigen recognition, latently infected cells are reactivated and proliferate, resurrecting HIV gene transcription and resulting in the production of nascent HIV virions that contribute to viral recrudescence. The half-life of these latently infected resting memory CD4+ T cells has been calculated to be 44 mo,5,6 leading to estimates that it would take more than 70 years of cART therapy to fully eradicate the viral reservoir. As cART therapy does not affect integrated proviral DNA, the persistence of this reservoir represents a major hurdle in the eradication of the virus in chronically infected patients.
Strategies to accelerate the elimination of the latent HIV reservoir have centered on a “shock and kill” approach (also termed “kick and kill”). In this strategy, HIV-infected resting memory CD4+ T cells are first “shocked” with agents that induce HIV gene transcription and production of viral antigens.7–9 An important consideration for shock agents is that they do not induce T-cell activation and cytokine production, as this would lead to detrimental and potentially life-threatening consequences. Once decorated with viral antigens, HIV-infected memory T cells can be distinguished from uninfected cells, rendering them susceptible to strategies that specifically clear (or “kill”) HIV-infected cells.
Jurkat cells containing integrated, but transcriptionally silent, HIV proviruses have been intensively studied as a model system for HIV latency.10–20 Although these model systems do not recapitulate all aspects of HIV latency, HIV gene transcription is activated by most shock agents that have exhibited activity in resting memory T cells from HIV-infected patients. 21 Studies outlined here specifically used the Jurkat 2D10 cell line. 22
HIV transcriptional elongation is influenced by the chromatin structure in latently infected T cells. HDACs (HDAC1, 2, and 3) have been isolated from the HIV promoter and are thought to play a key role in the restriction of HIV gene transcription in quiescent cells.14,16,23–25 The addition of HDAC inhibitors to these cells resulted in measurable changes in cellular histone acetylation (a proximal biomarker of target engagement), disruption of the nuc1 structure, and concomitant activation of HIV gene transcription.26–29
Histone deacetylase inhibitors (HDACi) can induce latent HIV transcription based on key proof-of-concept clinical studies of the licensed oncology HDACis vorinostat,30,31 panobinostat, 32 and romidepsin, 33 which have demonstrated statistically significant increases in HIV mRNA in resting CD4+ T cells,30–33 HIV gag p24 protein expression, 34 and plasma viremia32,33 after drug administration. As these drugs were developed for cancer indications, the key pharmacokinetic (PK)/pharmacodynamic (PD) relationships that drive HIV latency reversal remain unknown.
As the PK profiles and biophysical properties of these molecules differ, we sought to determine the PK parameters that govern HIV latency reversal, as these data would be a key consideration in the design of novel HDACis for HIV latency reversal. To this end, a series of washout experiments were designed to allow variation of HDACi concentration and exposure time in a model system of HIV latency. Initially, a series of plate-based manual washout experiments were performed to determine the impact of concentration and time on HDACi-induced HIV latency reversal. However, such experiments are laborious and low throughput and did not allow convenient, simultaneous capture of multiple parameters. To generate a data set suitable to establish a PK/PD model for HDACi-induced HIV latency reversal, we sought to automate the washout experiment. Although automation is commonplace in PK/PD studies of antibiotics,35,36 no system exists for monitoring HIV latency reversal in a mammalian suspension cell line. The automation of this assay allowed collection of both proximal target engagement (histone acetylation) and HIV latency reversal (enhanced green fluorescent protein [eGFP]expression) over a full-dose response of several novel HDACis at different exposures. This allowed the generation of a PK/PD model to inform on the design of a series of in vivo experiments to establish the tolerability of HDACis at these exposures.
Methods
Cell Culture and Compounds
Jurkat 2D10 cells were used as a model system for HIV latency with eGFP integrated into the cell under control of a transcriptionally silent HIV promoter, which can be induced. 22 Cells were cultured in RPMI 1640 (11835-030, Gibco, Waltham, MA) supplemented with 5% heat-inactivated fetal bovine serum (10082-139, Gibco) and 100 U/mL penicillin 100 µg/mL streptomycin (15140-148, Gibco). Vorinostat, panobinostat, and novel aryl ketone 37 – and ethyl ketone 38 –based HDAC inhibitors in 10 mM DMSO stocks were synthesized in house. Romidepsin powder was commercially sourced (Selleck, Houston, TX) and reconstituted to a concentration of 10 mM in DMSO.
Manual Washout
Jurkat cells (5 × 10⁶ cells in 5 mL of media) were seeded in a T25 flask (Cat. No. 156340, Thermo Scientific USA, Waltham, MA). For each compound, flasks were prepared representing a single point in a 10-point dose titration with a DMSO control flask. Cells were incubated at 37 °C with 5% CO2 with 80% relative humidity. Samples (1 mL) were taken at washout time points, pelleted by centrifugation at 300 × g for 5 min, media aspirated, and cells resuspended in 1 mL of fresh media without drug and plated in a 24-well plate (Falcon). Twenty-four hours after treatment initiation, regardless of exposure time, cells were stained with violet fixable viability dye (Invitrogen, Carlsbad, CA). Viability and percentage positive eGFP cells were determined using an LSRII flow cytometer (BD Biosciences, San Jose, CA) with a 405 nm laser and 440/40 nm band-pass filter and 488 nm laser and 505 nm long-pass dichroic mirror with a 525/50 nm bandpass filter, and data were batch analyzed in FACSDiva Software (BD Biosciences). Gates were placed on viable cells with a secondary gate then placed around eGFP-expressing viable cells.
The effective concentration that elicited 50% of maximal eGFP-positive cells (EC50 values) was calculated based on the concentration or area under the curve (AUC) using GraphPad Prism 8.1.1 software (La Jolla, CA) with a variable slope (four parameters) least-squares fit for analysis.
Automated Washout
The required distribution of time points for appropriate interrogation of PK/PD characteristics was the driving force for workflow automation. The process described in this section was programmed, operationally tested, and biologically validated prior to experimental implementation. All instruments were controlled using the in-house–developed automation software Telios, 39 which would be analogous to Thermo’s Momentum or HRB’s Cellario.
Automation Robotics/Hardware/Driver
The instrumentation used on the physical robotic system included the following: two robotic arms TX90L (Staubli, Pfaffikon, Switzerland), an ATS acoustic dispenser (EDC Biosystems, Fremont, CA), Multidrop Combi (Thermo Scientific USA), Biomek FX (Beckman Coulter Inc., Brea, CA), PHERAstar FS (BMG Labtech, Ortenberg, Germany), Acumen Ex3 (SPT Labtech, Hertfordshire, UK), two GNF Washer Dispensers (GNF, La Jolla, CA), two Vspin plate centrifuges (Agilent, Santa Clara, CA), a Blue Washer (BlueCatBio, Concord, MA), 4 °C automated incubator (Cytomat 2C, Thermo Scientific USA), and cell culture automated incubator (Thermo Scientific USA). Each instrument was controlled by a Telios driver, which used an individual equipment automation property interface. All scheduling was programmed through Telios director software, which allowed for real-time compound and plate tracking through raw data acquisition.
Automated Compound Transfer, Cell Preparation, and eGFP Detection
The automated assay required the preproduction of assay compound plates which contained a 16-pt 1.5-fold serial dilution of each HDACi to be tested. Concentration ranges were selected to encompass previously determined EC50 values, and dilutions were prepared in DMSO from 10 mM frozen stocks using a bravo liquid handler (Agilent). After dilution preparation, 7 µL of compound was immediately transferred on the bravo deck to a barcoded source plate (788876-2B, Greiner, Kremsmünster, Austria), and titration information was associated with the plate barcode. All remaining steps were performed on the fully integrated robotic platform described above.
An ATS acoustic dispenser was used to transfer 100 nL of compound from the source plate in triplicate to the assay plate, a 384-well poly-D-lysine–coated assay plate (789071-T-PDL, Greiner). A compound transfer file, based on the plate barcode, that contained well dispense information was automatically associated with each plate. Twelve replicate assay plates were made, with each plate representing a single time point in the assay as indicated by the arrows in Figure 1 . Jurkat 2D10 cells (100,000 cells/mL) were prepared and maintained under constant agitation with magnetic stirring to prevent cell settling during processing. Using a multidrop Combi, 50 µL of cell suspension (5000 cells per well) was added to each well of the assay plate. Treated cells were incubated at 37 °C, 5% CO2, with 80% humidity in an automated cell culture incubator for time course–appropriate durations. Cells were washed by pelleting the cells by centrifugation for 1 min at 300 × g (VSpin, Agilent), followed by removal of the cell supernatant and addition of 50 µL of fresh media (GNF washer dispenser). This cycle was repeated two additional times. Cell loss was validated by quantification of cellular ATP levels during the dedicated optimization steps (not shown). Efficient compound removal was validated by quantification of a fluorescein dye added as a surrogate for test compounds following each wash step with a 250-fold dilution achieved after final wash (data not shown). Programming maintained an “uninterrupted flow” (i.e., no other plates can access the instrumentation used) when a plate entered this iterative series of centrifugation and washing described. After the final wash, cells were resuspended in a final volume of 40 µL media. As indicated in Figure 1 , plates were either returned to the cell culture incubator until a post–washout time point or incubated at room temperature for 10 min to allow cells to settle prior to imaging. eGFP expression was measured using an Acumen EX3 instrument with a 488 nm laser and 530 nm emission filter. Immediately after eGFP measurements, plates were processed for histone acetylation enzyme-linked immunosorbent assay (ELISA) as described below.
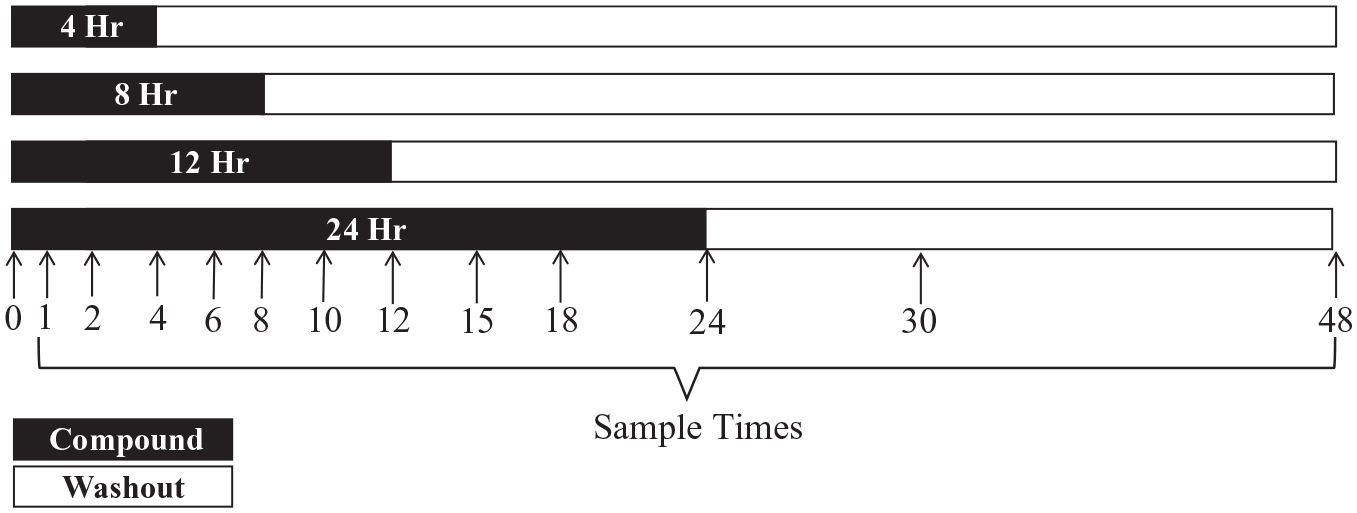
Automated washout design. For each exposure time (shaded area), 12 replicate plates were made. Each plate corresponds to a time point (hours) along the assay duration (arrows). At each time point (except 0), histone acetylation and HIV latency reversal (green fluorescent protein) data were collected for each plate. The shaded area indicates the duration of drug exposure. The light area indicates the washout time points. On each plate, six compounds were tested in 1.5-fold, 16-point titrations in triplicate.
Raw data files were generated in Telios with barcode and time stamp information to track data source and assay time. Data generated for treated cells were normalized to DMSO controls, and analysis was performed to compare data with the manual washout in a similar manner. Time-course graphs for individual concentrations were generated in GraphPad Prism.
Automated Histone Acetylation ELISA
Histone acetylation was measured by sandwich ELISA histone H4 capture and H4K5/8/12/16 detection. 40 The ELISA workflow was decoupled into two steps: coating and assay. The coating step was performed once per week to support several instances of the actual assay portion, because precoated, blocked plates were found to work successfully for many weeks in storage. ELISA plates (Cat. No. 3576, Corning, Corning, NY) were coated with 45 µL of 1:2000 anti-H4 antibody (D214-3, MBL, Tokyo, Japan) in a coating buffer (C3041, Sigma, St. Louis, MO) and incubated at 4 °C overnight. Plates were washed 1X on the BlueWasher with phosphate-buffered saline (PBS) with 0.05% Tween-20 (Sigma). Using a Combi, 50 µL of blocking buffer (3% bovine serum albumin; A9205, Sigma) in PBS was added to each well of the ELISA plate. Blocked plates were sealed on a Plateloc plate sealer (Agilent) and stored at 4 °C in blocking buffer until ELISA was performed (no longer than 1 wk). Cells in the assay plate were lysed with 40 µL of 1% Triton X-100 (Sigma) in PBS. Blocking buffer was removed from the ELISA plate using the Blue Washer. Using a Biomek FX, 25 µL of lysed cell sample was transferred from the assay plate to the uniquely barcoded ELISA plate. A transfer file tracking the cell lysate transfer was automatically generated to track the source of the samples for ELISA evaluation. To each ELISA well, 12.5 µL of 1:500 alkaline phosphatase conjugated anti-acetyl histone H4 (Cat. No. 05-1355, Millipore, Burlington, MA) in blocking buffer was dispensed using the GNF dispenser. The ELISA plate was incubated at 4 °C for 16 h. ELISA plates were washed twice on the Blue Washer using 80 µL PBS with 0.05% Tween-20, ending with an evacuated plate. To measure luminescence, 20 µL Tropix CDP-Star Sapphire II substrate (Cat. No. T2214, Applied Biosystems, Foster City, CA) was added to the washed ELISA plate. Following a 1 h incubation at room temperature, luminescence was measured on a PHERAstar FS.
Raw data files, named with the ELISA plate barcode, were automatically generated and stored by Telios software. ELISA results were normalized to DMSO-only treated plate controls. Time-course graphs for individual concentrations were generated in GraphPad Prism.
Information Tracking and Compiling
All plates used for this assay were uniquely barcoded, and barcodes were used by Telios software to automatically store and associate transfer and data files with plate barcodes. The informational framework streamlined the postprocessing integration by preparing and consolidating data into formats easily integrated and interpreted by modeling software scripts described below. The ATS Telios driver generated tracking files with every plate-to-plate transfer, mapping the source transfer wells to the destination wells. The Biomek FX Telios driver generated a plate-to-plate transfer file for cell lysates to ELISA plates for automated tracking of sample transfer. Ultimately, these tracking files along with data files generated from the Acumen (eGFP) and the PHERAstar (ELISA) were compiled and organized so that a set analysis program could intake this formulated utility output. Following the robotic run completion, the postprocessing script was run for parsing and compiling all raw data with associated assay and compound information as tracked by barcodes stored within the robotic network. Ancillary data such as compound exposure time for each plate needed to be manually added to the script. A csv file formatted for the further processing for relationship analysis was the final product of the robotic run and processing. Data formatting and compilation operation used compound repository information to associate compound information at the plate-well level to link compound information to data generated from both assays, ensuring reliable data and well-information tracking.
PK/PD Relationship Analysis
PK/PD analysis was conducted in both R 3.5.3 41 and GraphPad Prism 8.1.1 using the automated washout experimental data. The AUC was derived using the treatment duration and concentration variables, in which AUC was calculated by multiplying the treatment duration by the compound concentration in each well. The EC50 of each compound from 24 h exposure was used to derive the potency-normalized AUC for each time point. The area under the effect curve of HA (AUECHA) was derived using the trapezoidal rule, measuring the DMSO-normalized fold change in histone acetylation as a function of time for each dose. Each point shown represents the area under the of DMSO-normalized HA effect over time for each dose level per exposure. Likewise, the area under the effect curve of eGFP (AUECGFP) was derived using eGFP time-concentration effect profiles. Exploratory analysis of (1) potency-normalized AUC and AUECHA and (2) potency-normalized AUC and AUECGFP was conducted for all compounds.
Results
In Vitro Activity of HDACis on Purified Enzymes
There are 11 HDAC isoforms expressed in mammalian cells, which are categorized into four classes: class I (HDAC 1, 2, 3, and 8), class IIa (HDAC 4, 5, 7, and 9), class IIb (HDAC 6 and 10), and class IV (HDAC 11). In vitro characterization of novel aryl ketone
37
and ethyl ketone
38
HDACi compounds and 3 licensed HDACis (vorinostat, panobinostat, and romidepsin) against HDAC isoforms 1, 2, 3, 6, and 8 is shown in
Washout Experiments with Vorinostat, Panobinostat, and Romidepsin
The model system employed in these studies used the 2D10 Jurkat cell line, which harbors a transcriptionally silent, minimal HIV1 provirus that includes an eGFP reporter gene. 22 Treatment of this cell line with LRAs activates HIV transcription that can be quantified by measurement of eGFP expression.
Initially, a series of manual washout experiments were performed, in which cells were incubated with a range of HDACi concentrations for either 4 or 24 h. After 4 or 24 h, cells were removed, washed, and then incubated in HDACi-free media. After an additional 24 h, HIV latency reversal was measured via the quantitation of eGFP-positive cells by flow cytometry. Cytotoxicity in 2D10 cells was noted with 24 h exposure at the highest concentrations tested. After a 24 h exposure of HDACi, the Emax (percentage of eGFP-positive cells at the highest drug concentration with no cytotoxicity) of vorinostat, panobinostat, and romidepsin were similar, with 90%, 97%, and 86% eGFP-positive cells, respectively (
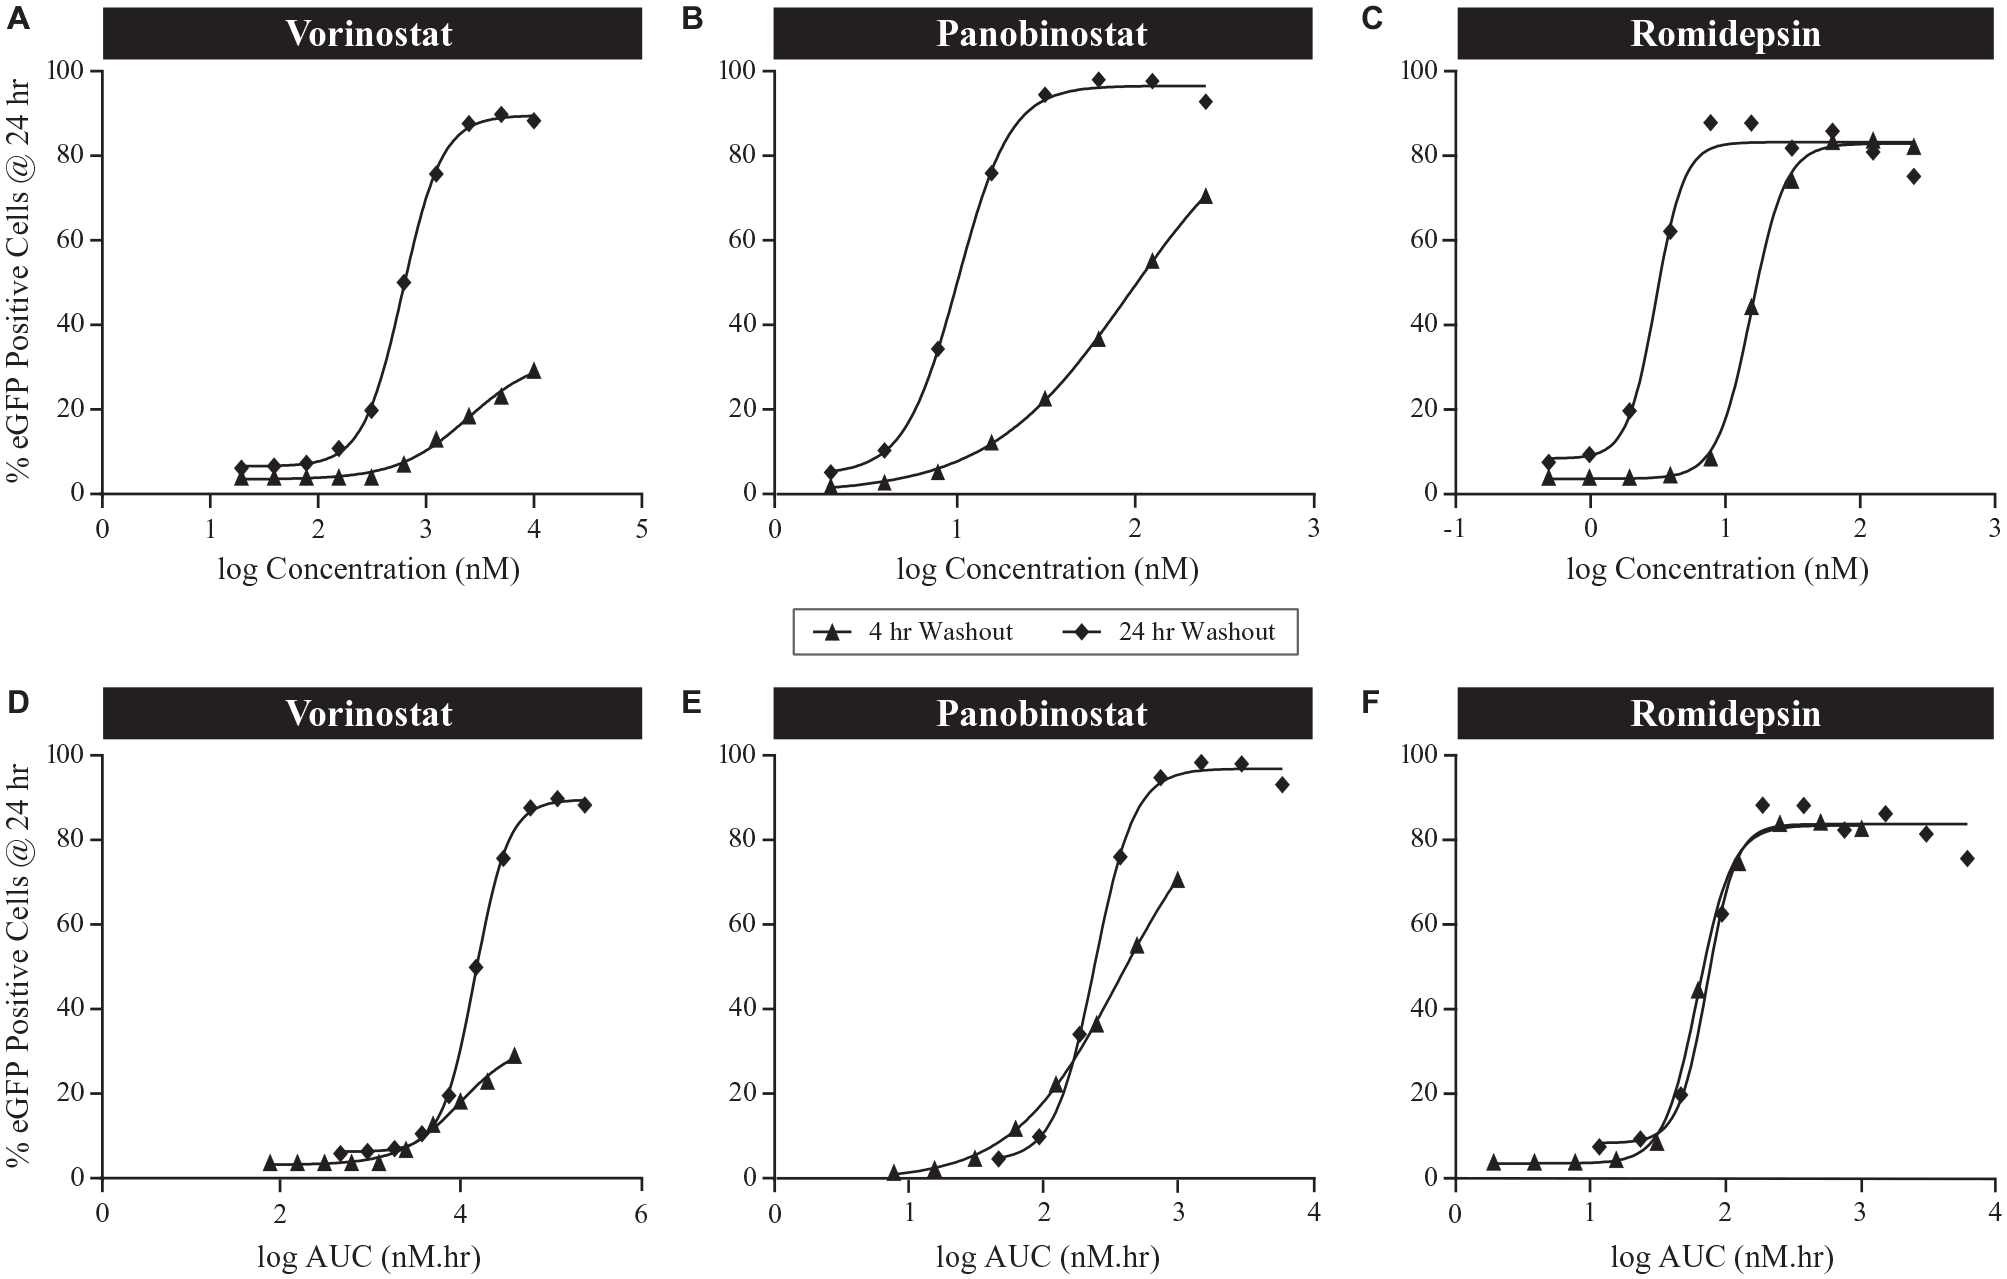
Manual washout. Histone deacetylase inhibitors vorinostat (fast binding kinetics), panobinostat (moderate binding kinetics), and romidepsin (slow off-rate kinetics) were tested with different exposure durations (4 h or 24 h). Enhanced green fluorescent protein (eGFP) responses measured by flow cytometry at 24 h after initial compound treatment. Dose response (
These experiments also allowed the calculation of EC50 values (concentration that elicits 50% of the maximal response) for each compound following either a 4 h or 24 h incubation (
Summary of Assay Data from Manual and Automated Washout Experiments. a
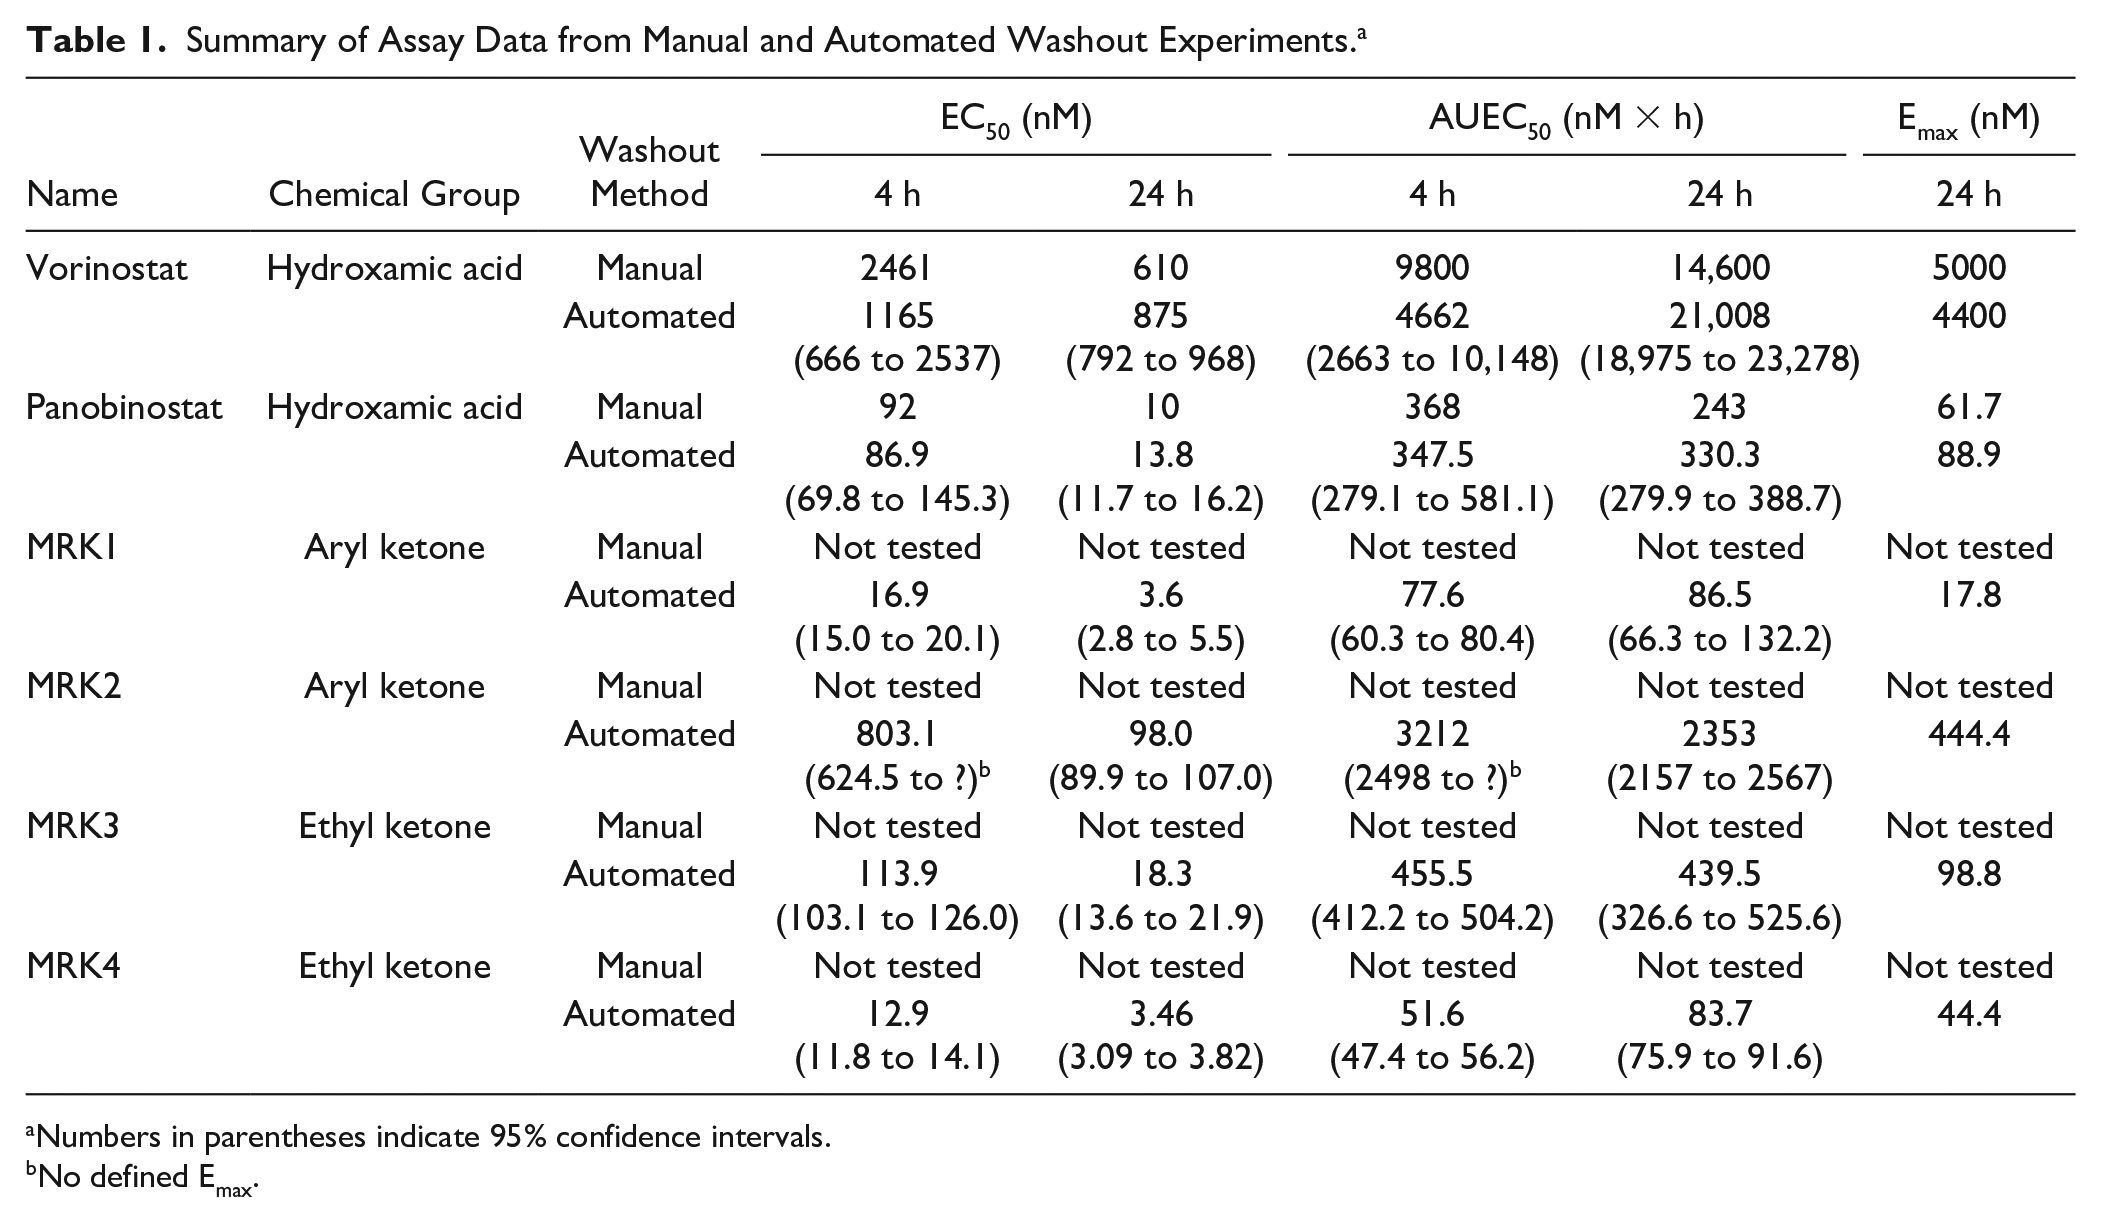
Numbers in parentheses indicate 95% confidence intervals.
No defined Emax.
We next sought to define a PK/PD model of HDACi-induced HIV latency reversal. The goal of this model is to predict in vivo exposures that would result in maximal HIV latency reversal for novel HDACis. Toward this aim, we used vorinostat, panobinostat, and four novel HDACis (MRK-1–4; see the Methods section) that were generated specifically for the analysis of HIV latency reversal37,38 and are selective for HDAC1, 2, and 3 (class I) isoforms. These HDACis belong to 2 different structural classes, defined by their zinc-binding pharmacophore, which dictates the affinity and t½ for the different HDAC isoforms (
To generate an exposure-response model for HDACi-induced HIV latency reversal required a larger data set, including a full dose response over different exposures between 4 and 24 h of each compound. To make the model more robust and help establish the relationship between the timing and magnitude of optimal target engagement for subsequent HIV latency reversal, we additionally sought to quantify histone acetylation as the proximal biomarker for HDACi target engagement. Automation allowed for higher throughput with more time points than could otherwise be managed manually.
Novel Automation and Data Processing for Latency Washout Time Course
Automation of the latency reversal assay allowed miniaturization to a 384-well format from a flask/24-well format and multiplexing with histone acetylation, which significantly increased the throughput of the assay as well as a more complete view of the target engagement and PD relationship. Optimization of the centrifuge, aspirate, and dispense cycle to minimize suspension cell loss but maximize HDACi removal was required to efficiently automate the assay. GFP and histone acetylation were normalized to untreated control wells and expressed as a fold-change over untreated cells. Raw data and relevant assay information were compiled and processed in as single csv file directly incorporated into modeling and analysis tools described in the Methods section.
Automation and programming of the washout enabled around-the-clock processing with data generation and compilation occurring upon completion of individual plates or bulk processing at the end of runs. This allowed for assessment of data during the run for quality control checks as well as bulk processing of all data to generate a single comprehensive tabular file, compiling all assay data over multiple runs and multiple days. Miniaturization and automation of cell plating, compound washout, eGFP reading, and HA ELISA processing allowed for the generation of technical replicates of larger ranges of dose response (single 10 point for manual versus triplicate 16 point automation) at more exposure durations (addition of 8 and 12 h exposures in automation experiments). These data enabled interrogation of time points (12 time points throughout 48 h as described in
Data obtained from the automated assay were similar to that obtained in our manual experiments, as EC50 and EAUC50 values obtained from the manual experiments were within the 95% confidence intervals of technical replicates from the automated assay for vorinostat and panobinostat (
Table 1
;
Hysteresis of Histone Acetylation and eGFP Expression
Inhibition of HDACs causes hyperacetylation of histones by histone acetyltransferases, resulting in chromatin decondensation and gene expression. In oncology clinical trials, histone acetylation is often used as a proximal biomarker of HDACi target engagement. Histone acetylation and HIV reporter gene expression (eGFP expression, a surrogate of HIV latency reversal) were measured throughout the assay and normalized to untreated control cells (arrows in
As the calculated EC50 for the HDACis tested, robust levels of histone acetylation were noted after incubation of cells for 4 h (
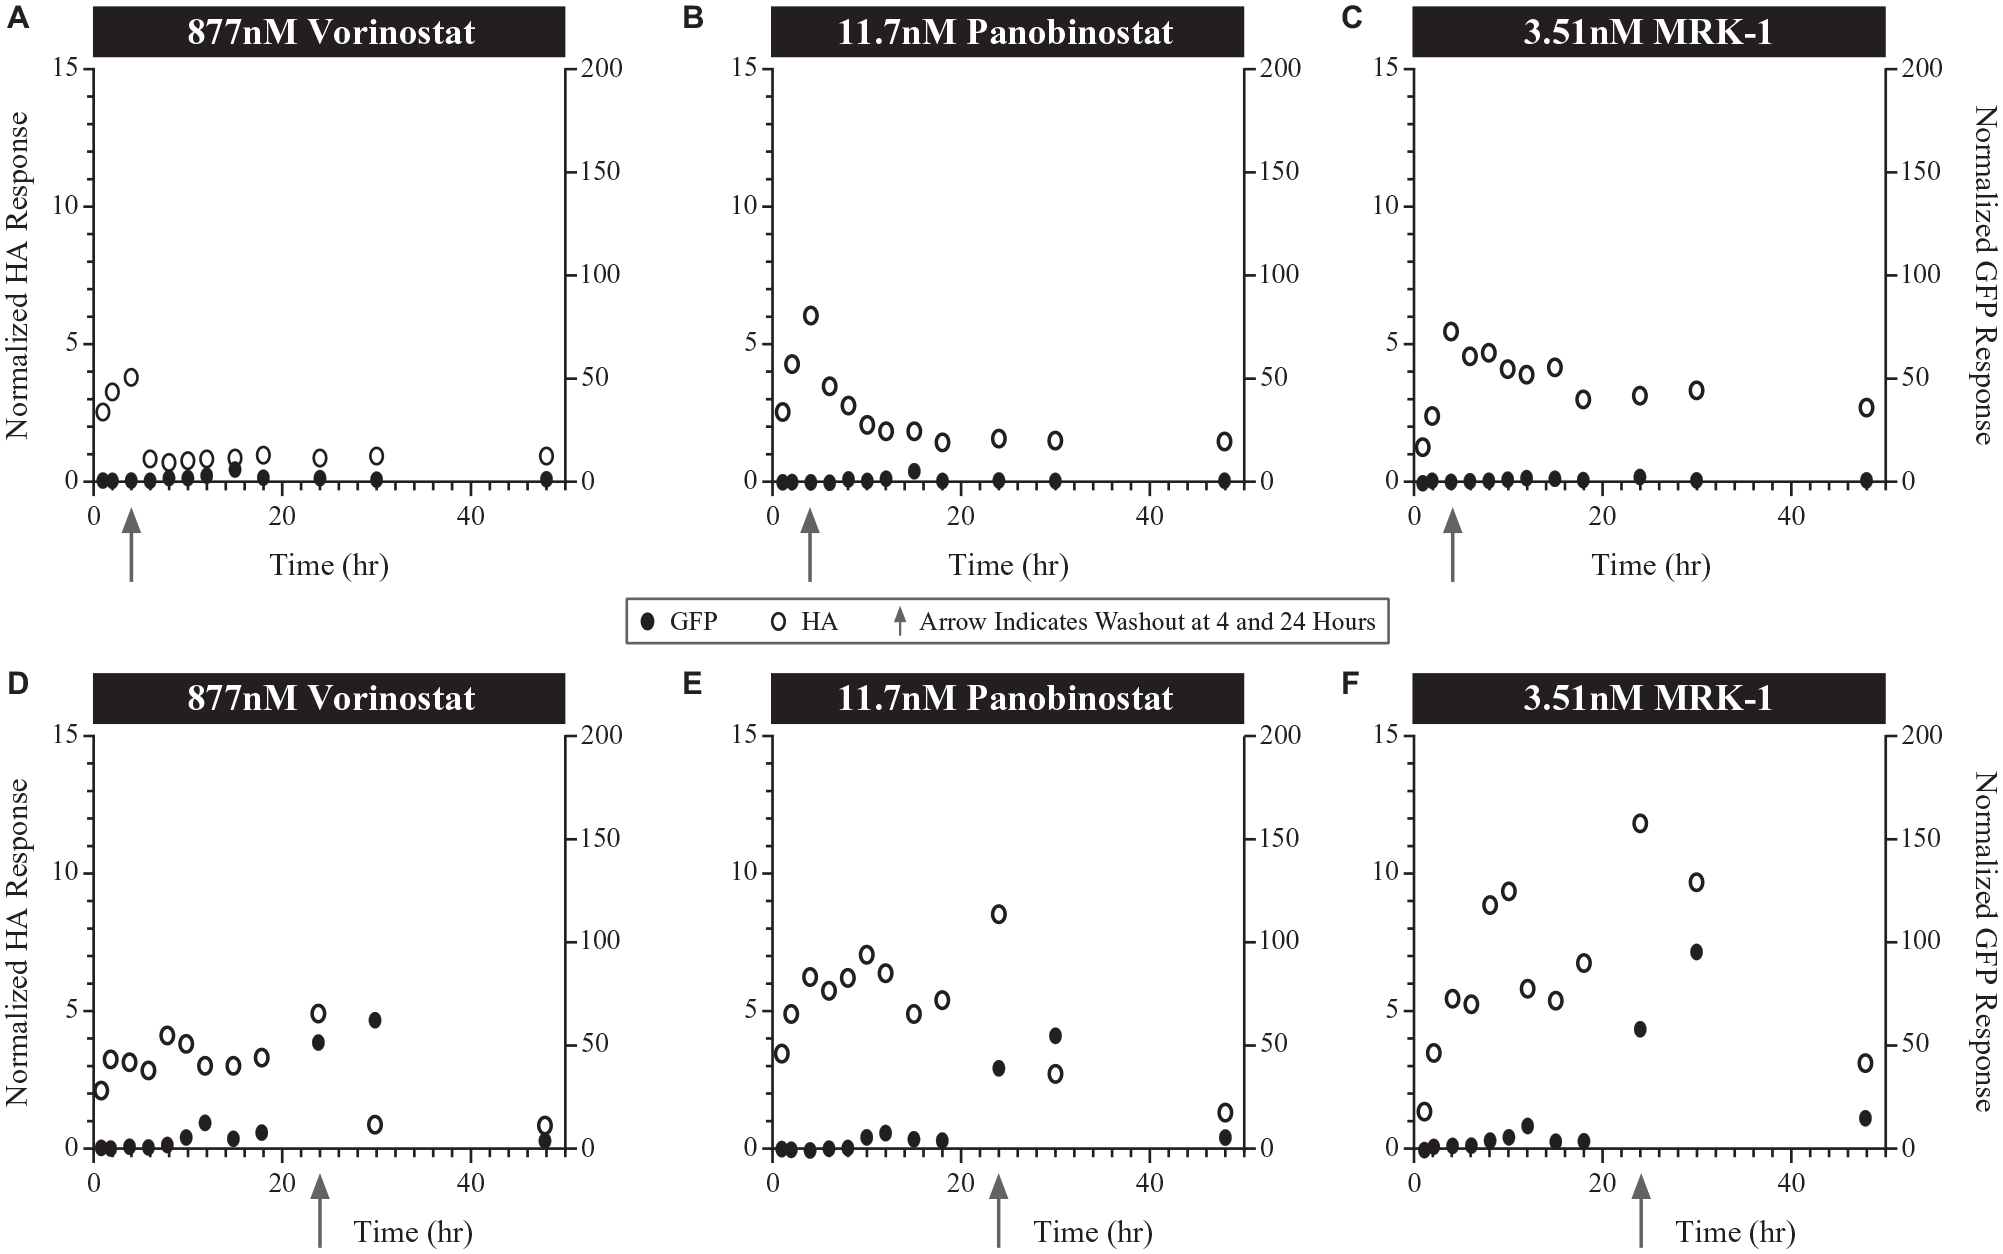
Time course of normalized histone acetylation (HA) and enhanced green fluorescent protein (eGFP) responses from automated washout experiments following exposure to various histone deacetylase inhibitors at their EC50 values in 2D10 Jurkat cells. Washout time point (indicated by arrows) following 4 h exposure with (
As expected, a 24 h incubation at the EC50 for each of the HDACis tested resulted in more prolonged elevation of histone acetylation. However, as with shorter incubations, removal of vorinostat at 24 h led to a rapid decline in histone acetylation levels but a slower decline observed for both panobinostat, MRK1 (
At a 4 h exposure of higher HDACi concentrations (Emax), the time course of histone acetylation noted for each compound was similar to that of the EC50 experiments, with notably higher peak levels of histone acetylation (
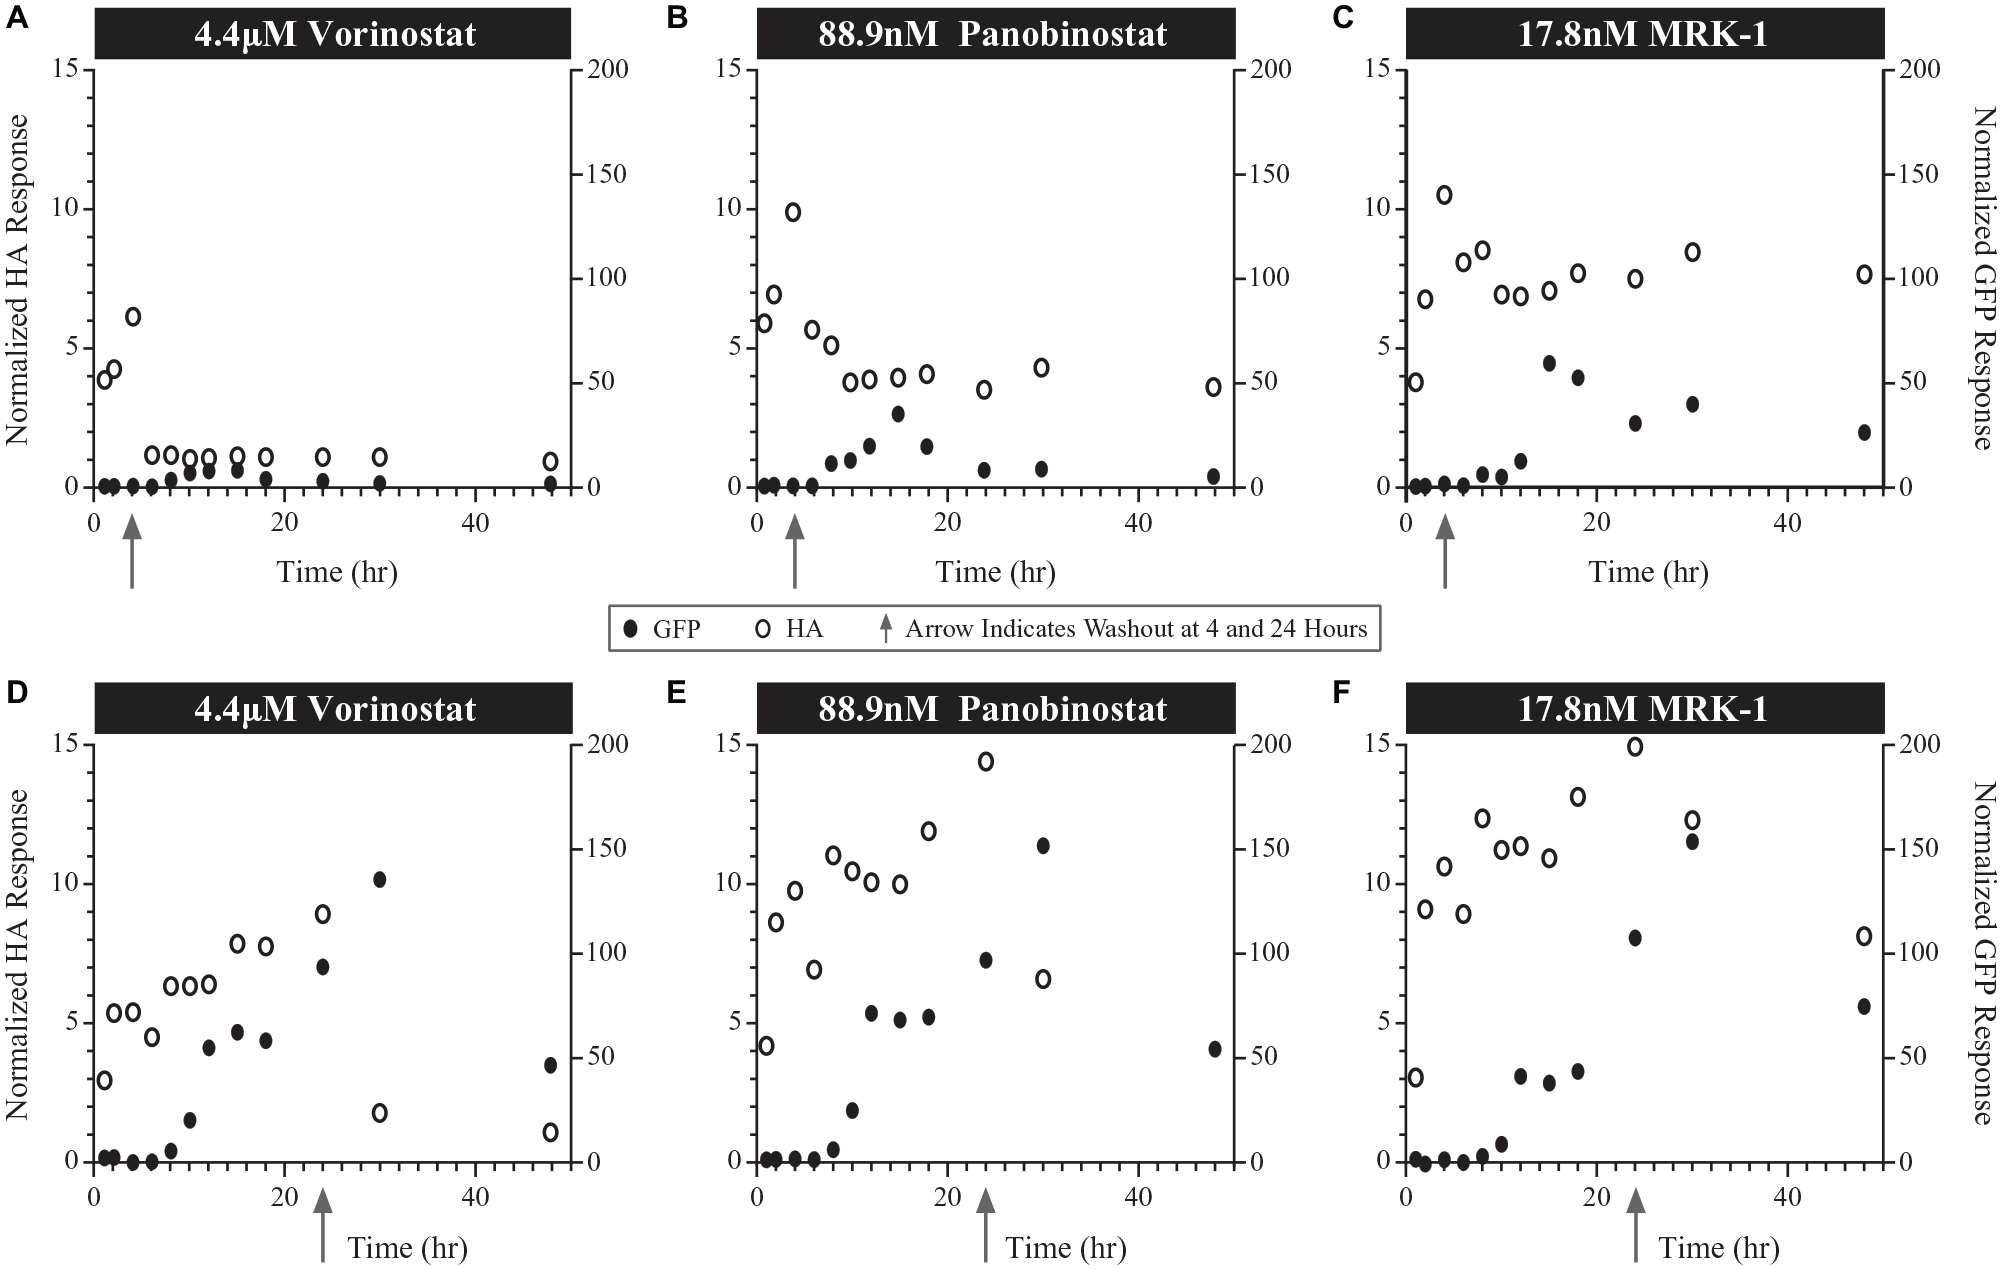
Time course of normalized histone acetylation (HA) and enhanced green fluorescent protein (eGFP) responses from automated washout experiments following exposure to various histone deacetylase inhibitors at their Emax values in 2D10 Jurkat cells. Washout time point (indicated by arrows) following 24 h exposure with (
PK/PD Relationship
Using the robust data set for multiple chemical classes, relationships between exposure and the proximal (histone acetylation) and distal (eGFP) markers of latency reversal were investigated. Exposure metrics such as Cmax and time above EC50 were leveraged as part of the PK/PD exploration. Of the metrics analyzed, only potency-normalized AUC and area under effect curves for HA and eGFP showed significant relationships. Normalizing AUC, using EC50 calculations, allowed the comparison of data from HDACis with different potencies. A relationship could be derived when comparing the AUECHA or AUECGFP to potency-normalized AUC. The relationship between AUECHA and AUECGFP and potency-normalized AUC at 4 h and 24 h exposures is shown in
Figure 5
. The AUECHA (
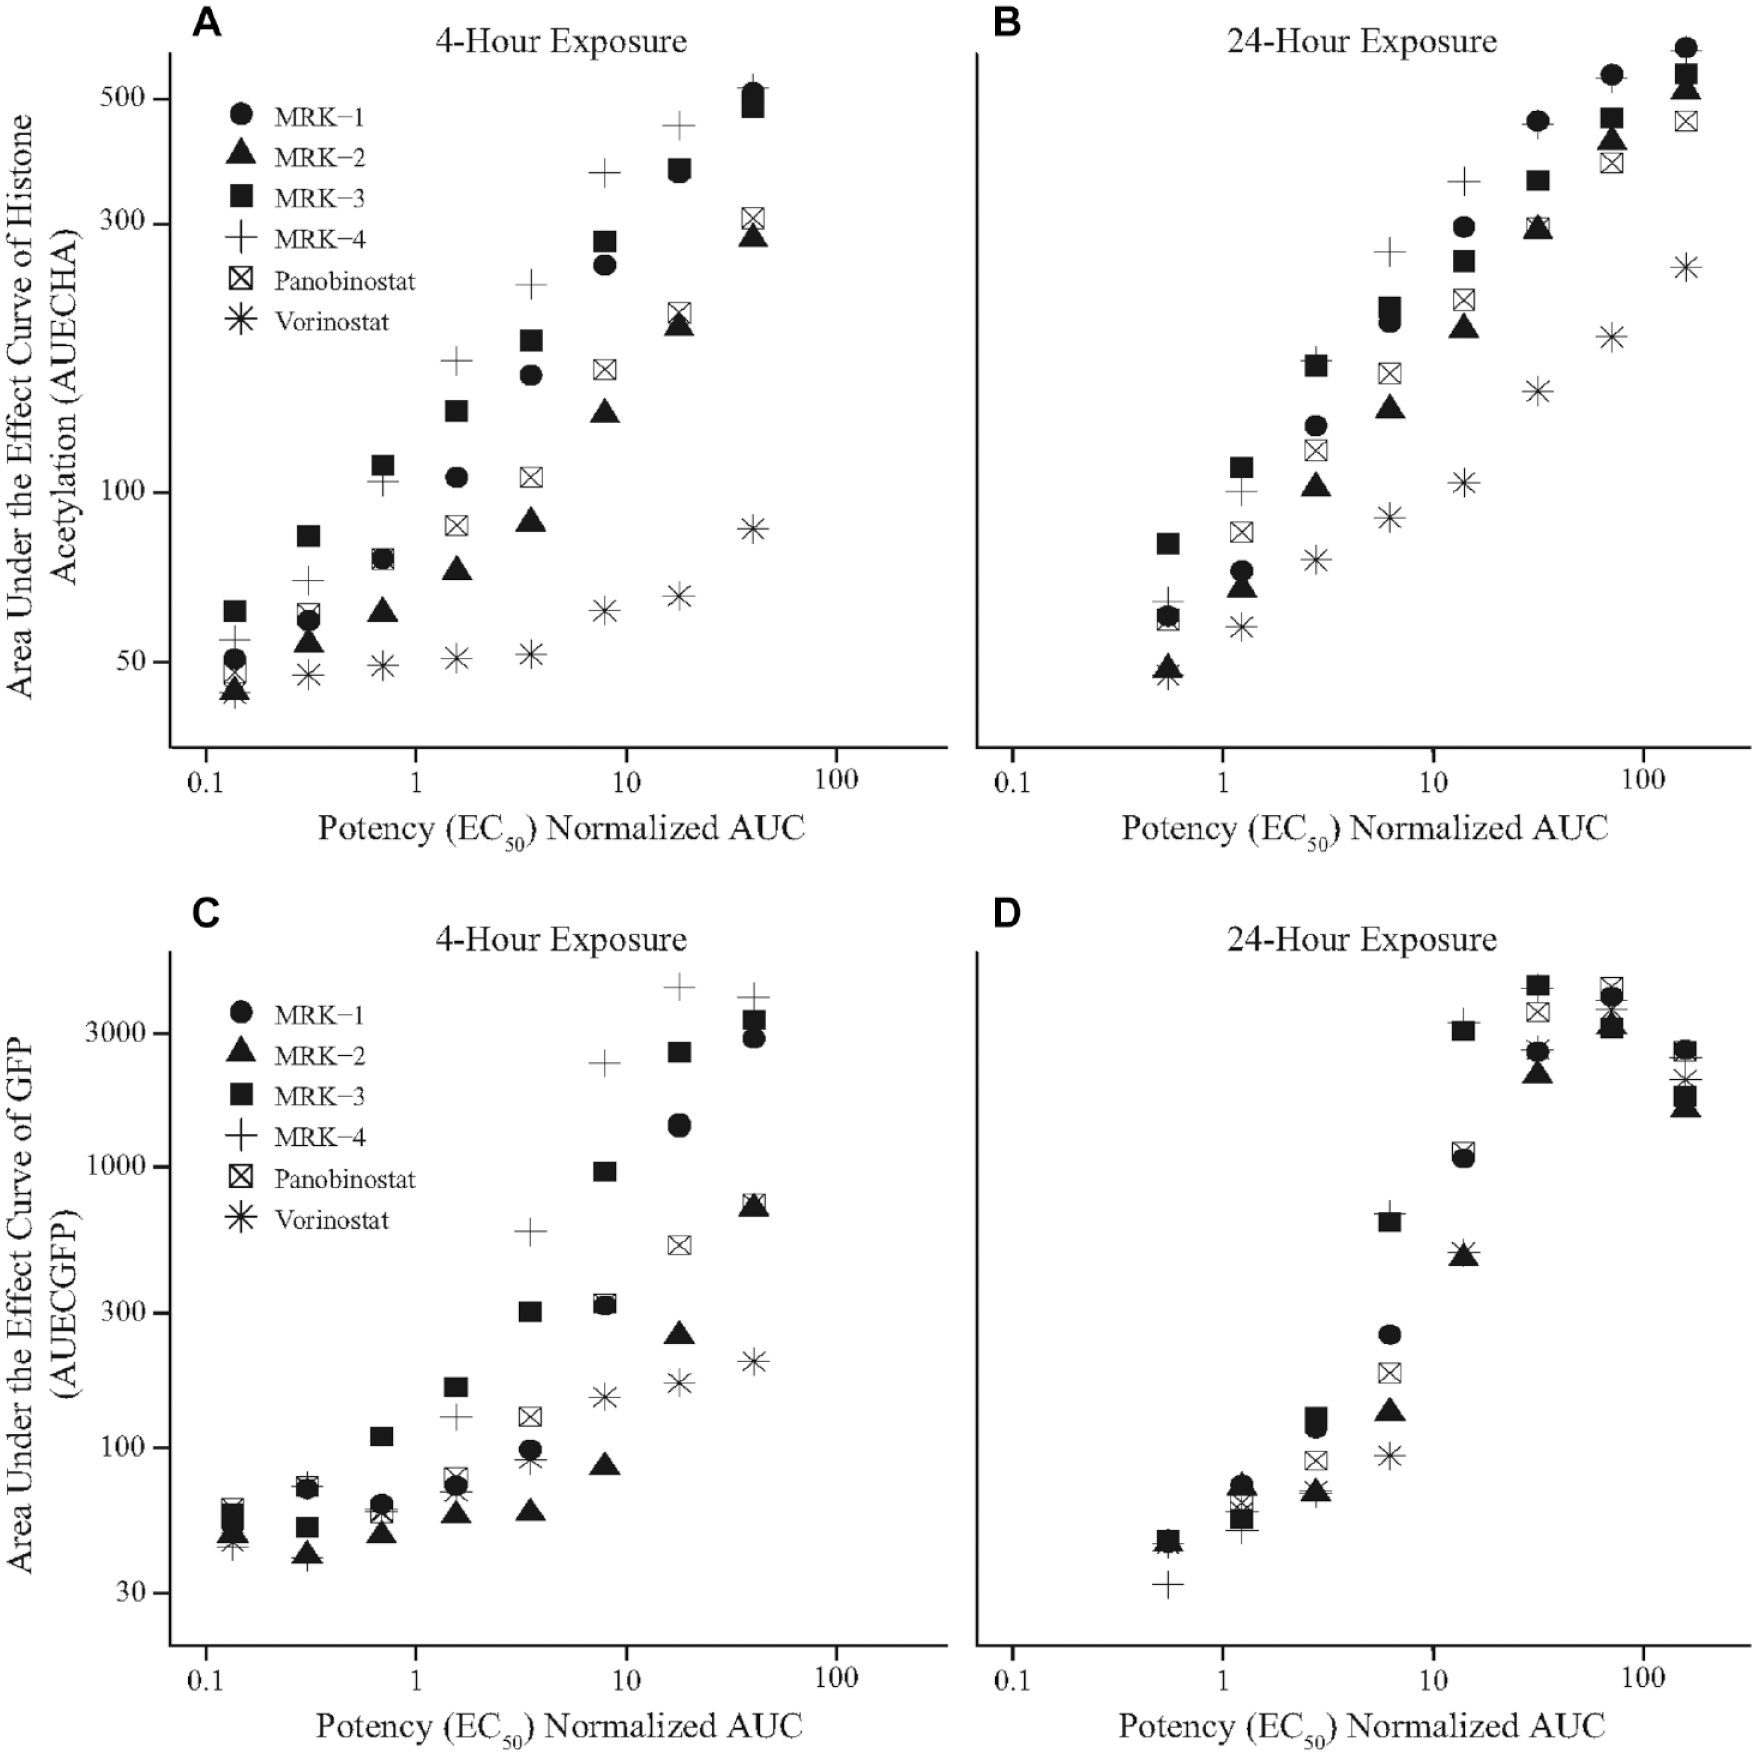
Pharmacokinetic/pharmacodynamic relationships established by comparing histone acetylation (HA) and green fluorescent protein (GFP) response over time to potency (EC50)–normalized exposure. The area under the effect curve of HA (AUECHA) and area under the effect curve of GFP (AUECGFP) were derived using the trapezoidal rule measuring the DMSO normalized fold change as a function of time for each dose. Each point shown represents the area under the DMSO-normalized HA or eGFP effect over time for each dose level. The x-axis is a normalization of AUC, product of treatment concentration and exposure time, to the 24 h treatment calculated EC50 for each compound. The y-axis uses the normalization of HA (
Collectively, these data indicate that target engagement and HIV LRA activity can be modeled for different HDACis based on exposure duration. Automating the assay enabled a larger volume of data points to be collected to more precisely define the relationship between exposure, histone acetylation, and eGFP expression. This model can be used to model HIV latency reversal and establish exposure and target engagement thresholds for subsequent in vivo experiments of novel HDACis at exposures predicted to yield HIV latency reversal. It is noteworthy that these experiments also helped inform on optimal sample times from in vivo experiments to capture the peak of histone acetylation.
Discussion
Here, we sought to determine the PK parameters that defined the exposure/response relationship of HDACis to reverse HIV latency. To accomplish this goal, we performed a series of washout experiments using a Jurkat T-cell model of HIV latency. In many in vitro experiments, designed to assess the extent of HIV latency reversal, compounds are incubated with cells over a 24 h period often at the highest noncytotoxic concentration. As sustained high concentrations of LRAs are unlikely to be achieved over a 24 h period in vivo, such experiments can overestimate the magnitude of LRA activity or toxicity.7–9 Exposure response relationships have been investigated in manual experiments with limited time points 27 and provide only a basic view of the exposure/response relationship.
In response to HDACis, histone acetylation occurs rapidly in the Jurkat T-cell model system of HIV latency and results in removal of the chromatin restriction of transcription. The delay in the peak of histone acetylation and reporter gene detection is likely due to the need to accumulate HIV mRNA transcripts, following removal of the chromatin blockade, that are subsequently translated into protein. Our data demonstrate that the timing of peak reporter gene expression is dictated by both the concentration and duration of HDACi. In this study, we used a Jurkat 2D10 cell line that contains a single integrated HIV provirus. 22 Future studies using a population of cells harboring a number of unique HIV provirus would help determine the impact of different HIV integration sites on HDACi-induced latency reversal. Without automation, it would not have been practical to generate the data set to thoroughly characterize the hysteresis between histone acetylation and eGFP expression.
The model demonstrated that the area under the effect curve was the most relevant target engagement and PD parameter in determining exposure relationships. Our data suggest that compounds with rapid enzyme dissociation rates that are also rapidly cleared from the body are unlikely to achieve sustained HIV transcription in vivo, resulting in a lower level of HIV latency reversal. It is possible that synthesis of HIV TAT, following sustained HIV latency reversal, reaches a threshold that results in a positive feedback loop of HIV transcription. The robust data collected over multiple exposures were used to model PK thresholds for future in vivo studies to assess the tolerability of HDACis at exposures predicted to yield maximal HIV latency reversal. Furthermore, these experiments helped inform on optimal time points from in vivo studies to capture the peak of histone acetylation or HIV LRA activity.
Our studies allowed modeling of peak HIV LRA activity, following HDACi exposure, which would be key to the timing of the introduction of a “kill” agent. Furthermore, our studies demonstrated that the target pharmacologic parameters required for optimal HIV gene expression differs between HDACis with different enzyme residency times. Because HIV gene expression occurs as a function of HDACi concentration and time, the model best fitting the PK/PD relationship measures histone acetylation and latency reversal as a function of potency normalized AUC.
Automating the workflow and data processing enabled washout experiments to be performed to simultaneously generate high-density data sets that included quantifying histone acetylation (proximal biomarker of HDACi target engagement) and GFP (surrogate HIV latency reversal) for six HDACis that represent three different chemical classes. The Telios software platform was used to manage and track assay automation workflow, and data 39 and well results with compound mapping for both ELISA and GFP assays were able to be reformatted, consolidated, and harmonized for PK/PD studies by a custom script generated for this purpose. Flexible data analysis and processing allowed for data tracking in real time, and ultimately, this allowed for expedited analysis of a PK/PD relationship across many compounds with minimal manual interventions. Generation of automated tracking reduces the risks inherent with manual tracking, and processing of multiple plate transfers generated multiple large data sets over time. This comprehensive automated washout protocol can easily accommodate future workflows addressing PK/PD relationships in vitro, including but not limited to other HIV latency reversal compounds, regardless of cells in suspension or adherent. Furthermore, the process described here would be amenable to many automation platforms.
Supplemental Material
sj-pdf-1-jbx-10.1177_2472555220983810 – Supplemental material for In Vitro Pharmacokinetic/Pharmacodynamic Modeling of HIV Latency Reversal by Novel HDAC Inhibitors Using an Automated Platform
Supplemental material, sj-pdf-1-jbx-10.1177_2472555220983810 for In Vitro Pharmacokinetic/Pharmacodynamic Modeling of HIV Latency Reversal by Novel HDAC Inhibitors Using an Automated Platform by William Newhard, Munjal Patel, Jason Cassaday, Jeanine Ballard, Brian Squadroni, Guoxin Wu, Jian Liu, Wensheng Yu, Joe Kozlowski, Paul Zuck, Bonnie Howell, Daria Hazuda, Ryan Vargo and Richard Barnard in SLAS Discovery
Footnotes
Acknowledgements
We thank Steve Carroll, Tracy Diamond, and Julie Strizki for reviewing our manuscript and providing useful input for this work.
Supplemental material is available online with this article.
Declaration of Conflicting Interests
The authors declared the following potential conflicts of interest with respect to the research, authorship, and/or publication of this article: All authors are employed by Merck and Co., and their research and authorship of this article was completed within the scope of their employment with Merck and Co.
Funding
The authors received no financial support for the research, authorship, and/or publication of this article.
References
Supplementary Material
Please find the following supplemental material available below.
For Open Access articles published under a Creative Commons License, all supplemental material carries the same license as the article it is associated with.
For non-Open Access articles published, all supplemental material carries a non-exclusive license, and permission requests for re-use of supplemental material or any part of supplemental material shall be sent directly to the copyright owner as specified in the copyright notice associated with the article.