
Abstract
Since the revolutionary discovery of RNA interference (RNAi) more than 20 years ago, synthetic small interfering RNAs (siRNAs) have held great promise as therapeutic agents for treating human diseases by the specific knockdown of disease-causing gene products. To facilitate the development of siRNA therapeutics, a robust, high-throughput in vitro assay for measuring gene silencing is imperative during the initial siRNA lead sequence identification and, later, during the lead optimization with chemically modified siRNAs. There are several potential assays for measuring gene expression. Quantitative reverse transcription PCR (qRT-PCR) has been widely used to quantitate messenger RNA (mRNA). This method has a few disadvantages, however, such as the requirement for RNA isolation, complementary DNA (cDNA) generation, and PCR reaction, which are labor-intensive, limit the assay throughput, and introduce variability. We chose a high-content imaging assay, bDNA FISH, that combines the branched DNA (bDNA) technology with fluorescence in situ hybridization (FISH) to measure gene silencing by siRNAs because it is sensitive and robust with a short reagent procurement and assay development time. We also built a fully automated liquid-handling platform for executing bDNA FISH assays to increase throughput, and the system has a capacity of generating 192 concentration–response curves in a single run. We have successfully developed and executed the bDNA FISH assays for multiple targets using this automated platform to identify and optimize siRNA candidate molecules. Examples of the bDNA FISH assay for selected targets are presented.
Introduction
RNA interference (RNAi) is a naturally occurring mechanism for sequence-specific gene silencing triggered by double-stranded RNA. The RNAi process starts with the cleavage of a long double-stranded RNA precursor into short RNA duplexes of 21–28 nucleotides by ribonuclease III–type enzyme Dicer. 1 The short RNA duplex is incorporated into the multicomponent pre-RNA-induced silencing complex (pre-RISC), in which the two strands are unwound. The passenger strand (sense) is degraded and released, while the guide strand (antisense) remains bound to form the activated RISC. The guide strand directs the activated RISC to the complementary region of the target messenger RNA (mRNA), leading to the mRNA cleavage by Argonaute endonuclease 2 (Ago 2) in the RISC, followed by mRNA degradation by cellular nucleases and therefore reducing synthesis of the target protein.2,3
Since the reporting by Fire and Mello in 1998 4 that injection of double-stranded RNA into Caenorhabditis elegans could cause efficient gene silencing, RNAi has become a powerful tool to study gene function and holds great promise as a new therapeutic approach to silence disease-causing genes, 5 especially for those targets that are not amenable to conventional therapeutics, such as small molecules, recombinant proteins, and monoclonal antibodies. The first-ever US Food and Drug Administration (FDA) approval of an RNAi therapeutic, patisiran (ONPATTRO), for the treatment of polyneuropathy caused by hereditary transthyretin-mediated amyloidosis, 6 further fueled enthusiasm about developing RNAi therapeutics for the treatment of human diseases.
Small interfering RNAs (siRNAs), also known as short interfering RNAs, are double-stranded RNAs consisting of 21–23 base pairs. 7 They mimic intermediates that are formed during the natural processing of long double-stranded RNAs by Dicer. In 2001, Elbashir et al. introduced synthetic 21-nucleotide siRNA duplexes into mammalian cells for the first time and observed specific endogenous and heterologous gene silencing in cells. 8 Their discovery opened doors for potential therapeutic applications using synthetic siRNAs against human diseases. Not all siRNAs that are cognate to a given target mRNA, however, are equally effective in gene silencing. Furthermore, siRNA can also target other mRNAs containing sequence segments that are partially complementary to itself (off-target effect). Although many bioinformatics tools are available to aid siRNA design, there is no robust in silico solution to accurately predict knockdown efficacy and off-target effects of siRNAs. 7 Therefore, developing experimental approaches to identify potent and selective siRNAs for a given target gene is imperative.
Gene silencing can be measured at the mRNA or protein level, and the potential assays are listed in Table 1 . PCR-based assays, such as quantitative reverse transcription PCR (qRT-PCR), 9 are commonly used methods to quantitate target mRNA. These assays, however, require RNA isolation, complementary DNA (cDNA) generation, and PCR reaction, with the potential to introduce assay variations. Immunofluorescence assays can detect the levels of endogenous proteins or exogenous fusion proteins with the target gene’s coding sequence (CDS) in frame with a small antigen epitope (FLAG, Myc, HA, His, etc.). 10 The critical issue with the immunofluorescence assay for detecting endogenous proteins is the requirement of specific antibodies against the target proteins. In contrast, the exogenous fusion proteins can be detected with commonly available antibodies against the epitope tags. Despite this advantage, activity of siRNAs designed against untranslated regions (UTRs) cannot be evaluated with the fusion construct, since only CDS is included in the cloning of the exogenous fusion protein. The reporter assay detects the exogenous reporter protein and can be performed in a high-throughput manner. The target cDNA can be inserted downstream of the reporter translational stop codon; therefore, only the reporter is translated. 11 The insertion of a long target cDNA may, however, affect reporter expression. In addition, a long distance between the siRNA target site and the reporter coding region may affect observation of the RNAi effect because translation of the reporter gene may still go on after the mRNA is cleaved at the remote siRNA target site. Therefore, multiple constructs with a shorter cDNA fragment may be needed for the reporter assay. Furthermore, there may be a need to reduce assay variation by using a stable cell line expressing the chimeric reporter–target mRNA, which may take up to 3 months to generate. To overcome challenges in the above-mentioned methods, the bDNA FISH assay measures the direct target of siRNAs with single-molecule sensitivity by combining the branched DNA (bDNA) technology with fluorescence in situ hybridization (FISH). 12 Reagents for the bDNA FISH assay are also readily available for most genes (ViewRNA13,14 from Thermo Fisher Scientific, Rockford, IL, or RNAscope15,16 from Advanced Cell Diagnostics, Newark, CA). Furthermore, a standard assay protocol can be used for most genes and cell types with minor modifications, making the assay development time minimal.
Comparison of In Vitro Assays for Measuring Gene Silencing.
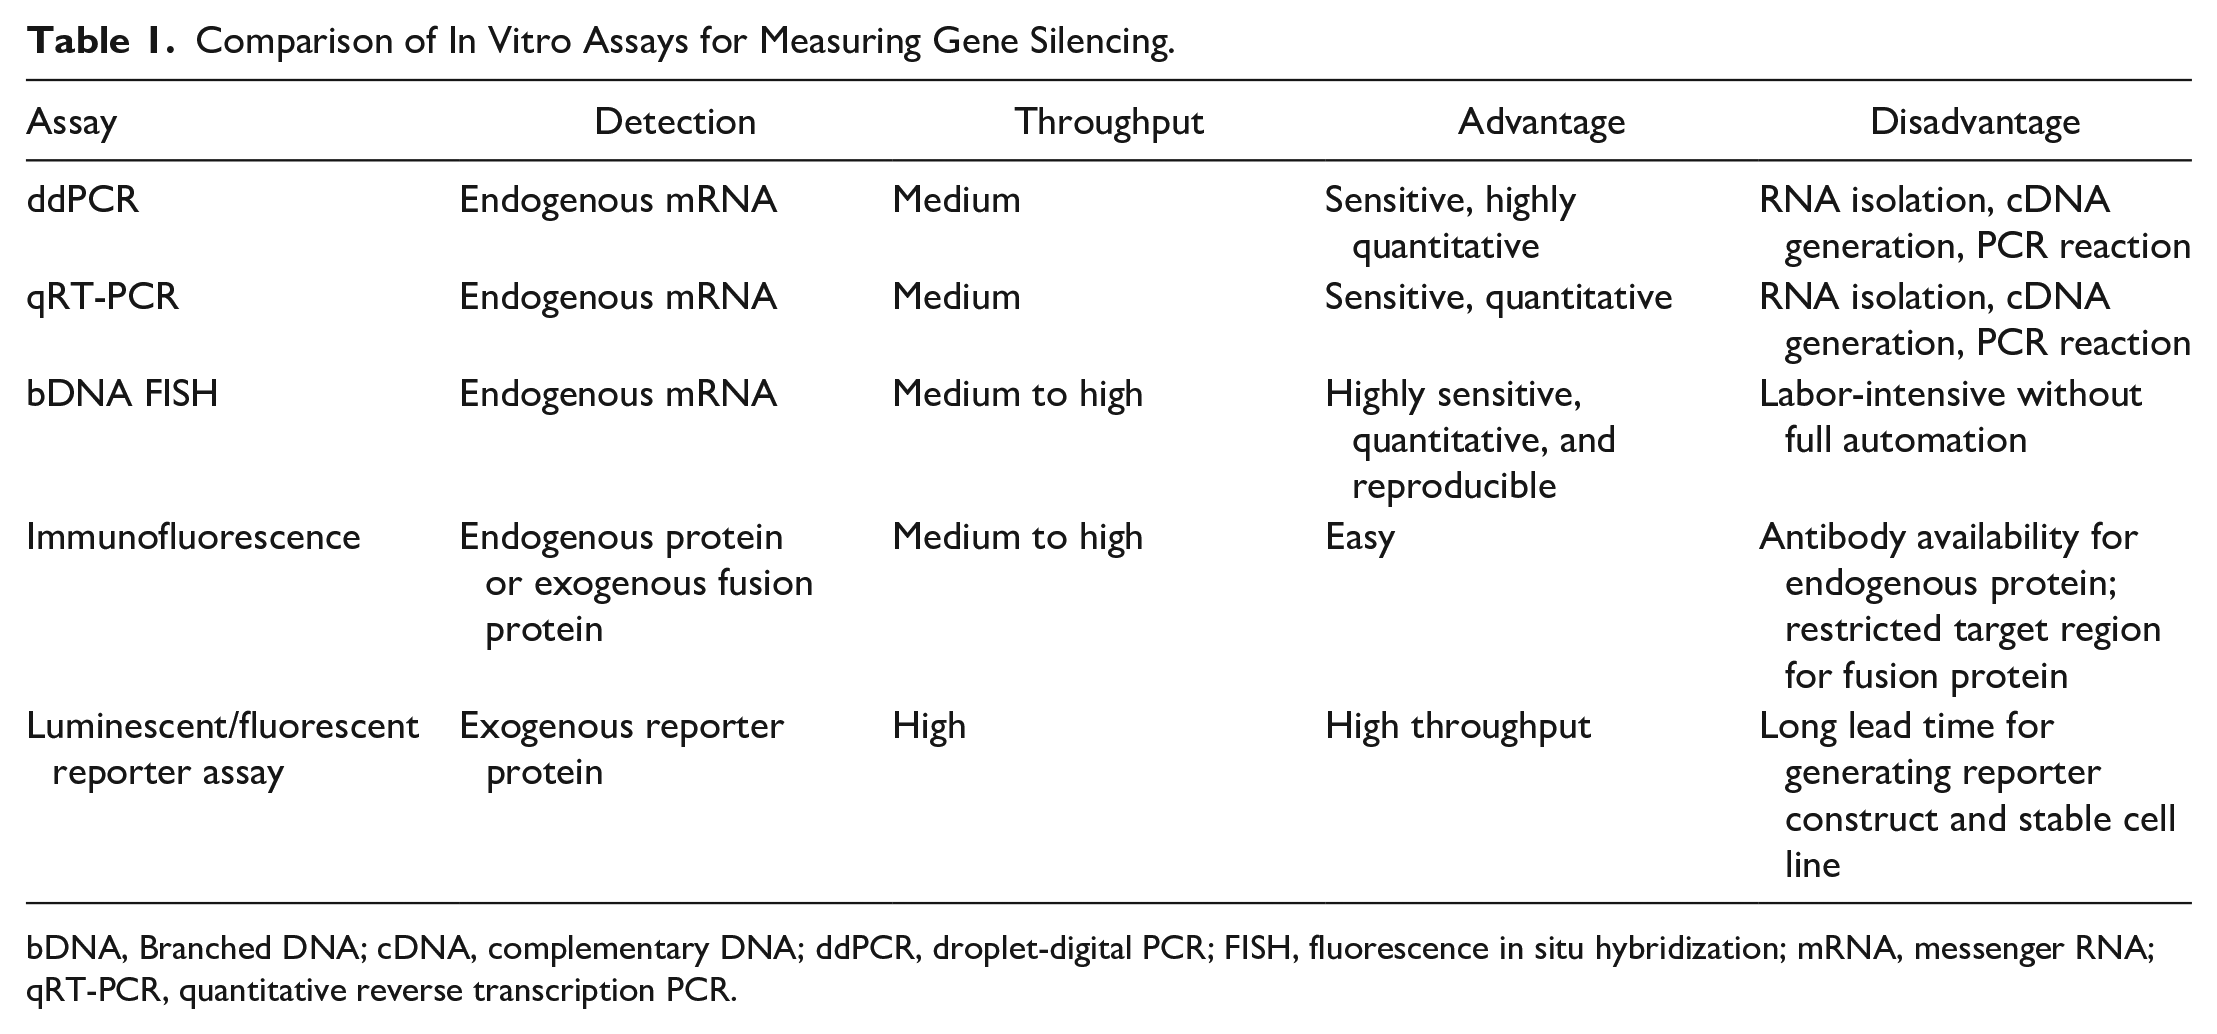
bDNA, Branched DNA; cDNA, complementary DNA; ddPCR, droplet-digital PCR; FISH, fluorescence in situ hybridization; mRNA, messenger RNA; qRT-PCR, quantitative reverse transcription PCR.
Unlike the traditional FISH technique, bDNA FISH uses the bDNA technology for signal amplification 17 to achieve single-molecule sensitivity. A target-specific probe set of approximately 20 oligonucleotide pairs (referred as double-Z pairs) covering about a 1 kb region is designed for each gene. The bottom of the double-Z pair contains a sequence complementary to the target mRNA, while the top of the double-Z pair forms the binding site for pre-amplifiers. The gene-specific double-Z probes bind to the target mRNA, and signal amplification is achieved through the formation of the bDNA structure by sequential hybridizations of pre-amplifiers, amplifiers, and fluorochrome-conjugated label probes. Each fully assembled bDNA structure contains 400 label probes, and total amplification from ~20 bDNA-bound double-Z pairs is about 8000-fold for each target mRNA molecule. 15 This makes the bDNA FISH assay highly sensitive, with a detection limit of 1 transcript per cell. With signal amplification, target mRNA molecules can be visualized as punctate spots, and each spot represents a single mRNA transcript. 15 In addition, multiplexed detection of up to four target mRNAs can be achieved by using multiple signal amplification systems with different fluorochrome-conjugated label probes.
As advantageous as it is, the bDNA FISH assay presents the high complexity of multiple reagents coupled with time, light, and heat sensitivities, and therefore requires a fully integrated automation system for assay execution. For this purpose, we built a fully automated liquid-handling platform for assay execution and have successfully combined the bDNA FISH technology with automation for identification and optimization of siRNA-based therapeutics. Exemplar data are presented in this article.
Materials and Methods
Assembly of a Fully Automated Platform for Execution of bDNA FISH Assays
The automated platform for executing bDNA FISH assays was assembled using common laboratory automation equipment on custom-designed modular tables ( Fig. 1A ). The system consists of seven components: (1) a BenchCel 4R microplate handler (Agilent, Santa Clara, CA) for storage and handling of microplates and pipette tip boxes, (2) a light-shielded Bravo automated liquid-handling platform (Agilent) for reagent aspiration and dispensing, (3) a PreciseFlex 750 microplate-handling robot (Precise Automation, Fremont, CA) for picking and placing microplates and lids, (4) a Cytomat 2 C-LIN automated incubator (Thermo Fisher Scientific) for maintaining microplates at 40 °C during hybridization steps, (5) an EL406 microplate washer/dispenser (BioTek, Winooski, VT) for performing washing steps, (6) static microplate hotels (PerkinElmer, Waltham, MA) for storage of microplates and lids, and (7) an Opera Phenix high-content screening system (PerkinElmer) for image acquisition. The Bravo liquid handler was customized with the addition of opaque shielding and heating pads to protect light- and temperature-sensitive reagents, respectively. The modular design of our platform allows for flexibility in setup and ease of swapping components. The automation equipment was arranged on multiple levels vertically to take advantage of the robotic arm’s height and to reduce the footprint of the platform. Overlord scheduling software (PAA, Colorado Springs, CO) was used to control the equipment. Battich et al. 12 published an automated bDNA FISH assay protocol for processing three 384-well plates. To increase assay throughput, we used an optimized protocol that allowed us to process up to six 384-well plates in parallel in a single run. The bDNA FISH assay procedure and the workflow on this automated platform are shown in Figure 1B . The whole procedure takes 2 days to complete. A six-plate run takes 330 min on day 1 and 310 min on day 2 (cell-imaging time not included).
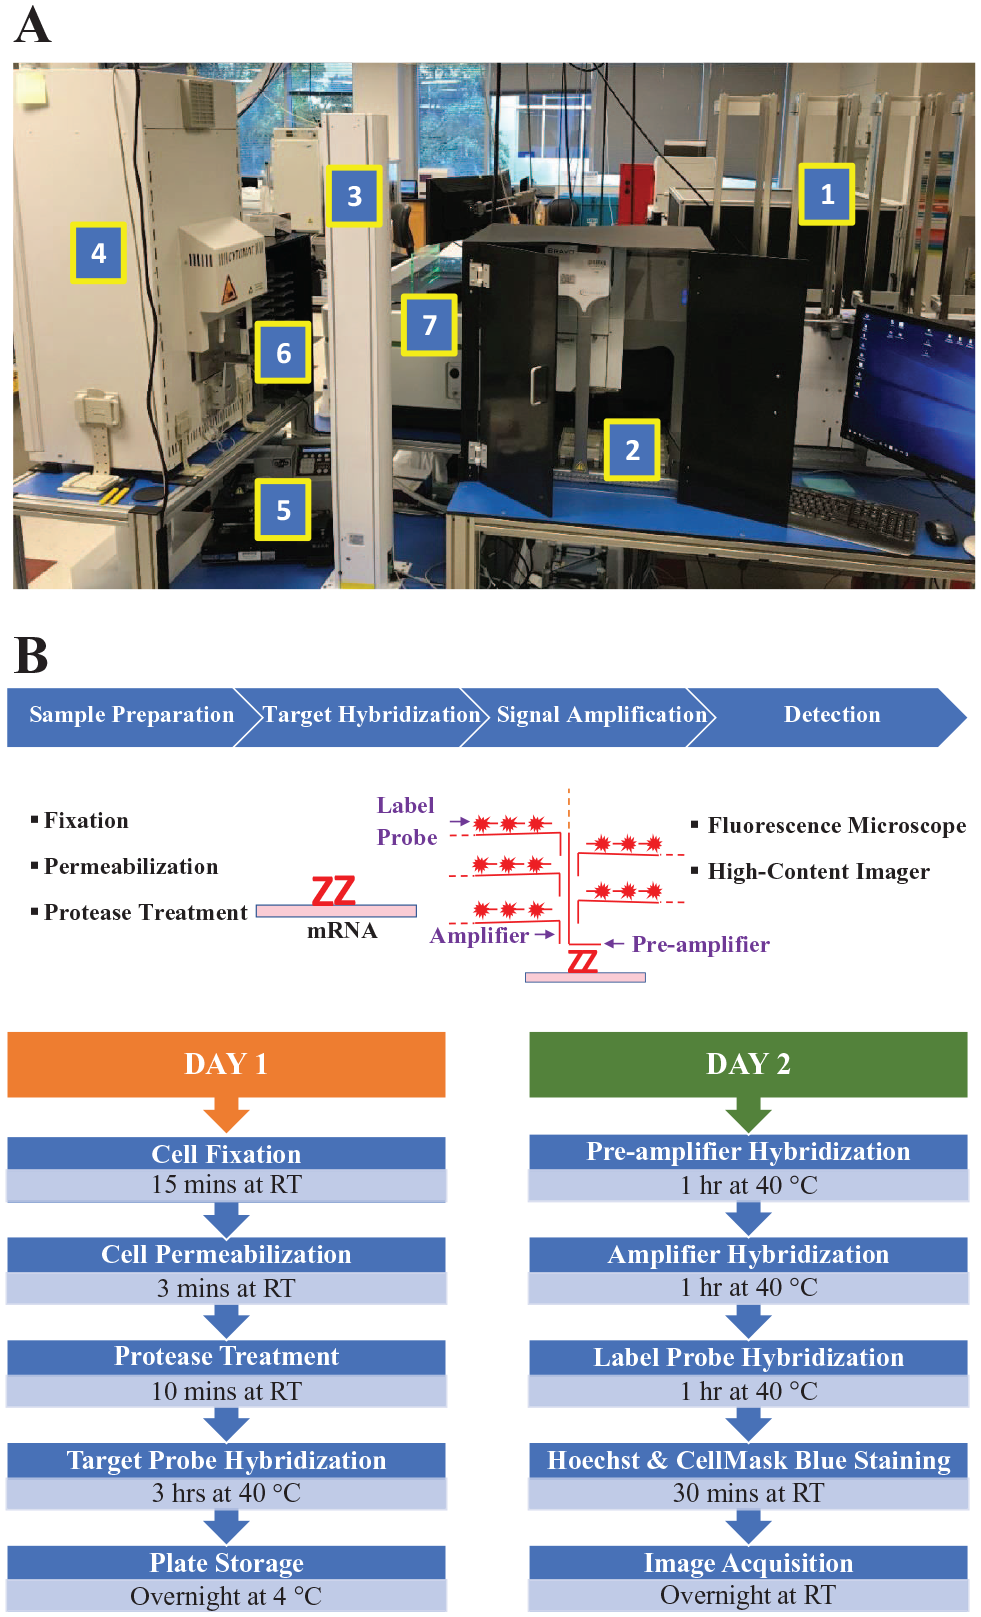
An automated platform for execution of a branched DNA (bDNA) fluorescence in situ hybridization (FISH) assay. (
Cell Culture
Hep3B and HepG2 cells (ATCC, Manassas, VA) were cultured in Eagle’s Minimal Essential Medium (EMEM; ATCC). Chinese hamster ovary (CHO) cells stably overexpressing gene W (produced at Amgen Inc.) were cultured in F-12K medium (Mediatech, Manassas, VA). All media were supplemented with 10% fetal bovine serum (FBS; Sigma-Aldrich, St. Louis, MO) and 1% penicillin–streptomycin (P-S; Corning Life Sciences, Corning, NY). Cells were grown at 37 °C in a humidified incubator supplied with 5% CO2.
siRNA Transfection
siRNAs were transfected into cells by reverse transfection using Lipofectamine RNAiMAX transfection reagent (Thermo Fisher Scientific). 1 µL of test siRNAs (produced at Amgen Inc.) and 4 µL of culture medium without supplements, depending on the cell line used, were added to PDL-coated CellCarrier-384 Ultra microplates (PerkinElmer) by a Biomek FX (Beckman Coulter Life Sciences, Indianapolis, IN). 5 µL of Lipofectamine RNAiMAX, pre-diluted in culture medium without supplements (specifically, 0.035 µL of RNAiMAX in 5 µL of EMEM for Hep3B, 0.06 µL of RNAiMAX in 5 µL of EMEM for HepG2, and 0.1 µL of RNAiMAX in 5 µL of F-12K for CHO), was then dispensed into the microplates by a Multidrop Combi reagent dispenser (Thermo Fisher Scientific). After a 20-min incubation of the siRNA–RNAiMAX mixture at room temperature (RT), 30 µL of cells (1500–2000 cells per well) in culture medium supplemented with 10% FBS and 1% P-S was added to the transfection complex using a Multidrop Combi reagent dispenser. The microplates were allowed to equilibrate for 20 min at RT prior to being placed in an incubator. Cells were then incubated for 72 h at 37 °C and 5% CO2.
In Vitro bDNA FISH Assay
The in vitro bDNA FISH assay was performed 72 h after siRNA transfection using the manufacturer’s assay reagents and protocol (QuantiGene ViewRNA HC Screening Assay from Thermo Fisher Scientific) on the automated FISH assay platform described above. In brief, cells were fixed in 4% formaldehyde for 15 min at RT, permeabilized with detergent for 3 min at RT, and then treated with protease solution for 10 min at RT. Target-specific probes were incubated for 3 h, whereas pre-amplifiers, amplifiers, and label probes were incubated for 1 h each. All hybridization steps were carried out at 40 °C in a Cytomat 2 C-LIN automated incubator. After hybridization reactions, cells were stained with Hoechst and CellMask Blue (Thermo Fisher Scientific) for 30 min at RT. Assay plates were imaged on an Opera Phenix high-content screening system using a 20× water-immersed objective lens. Nine fields of view were acquired for each well. Two or three channels were acquired sequentially depending on the assay: Hoechst and CellMask Blue were imaged using 405 nm laser excitation, an Alexa Fluor 488–conjugated label probe was imaged using 488 nm laser excitation, and an Alexa Fluor 647–conjugated label probe was imaged using 640 nm laser excitation. All channels were acquired with the appropriate emission filters. The images were analyzed using a Columbus image data storage and analysis system (PerkinElmer) to obtain the mean spot count per cell and the total cell number per well. The mean spot count per cell was normalized using Equation (1) to determine the percentage of target transcripts remaining after siRNA treatment:
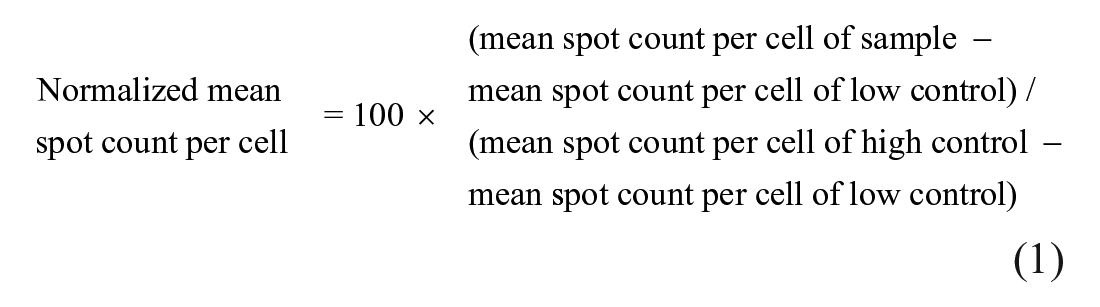
where the high control is phosphate-buffered saline (PBS)-treated wells with target probes, and the low control is PBS-treated wells without target probes. The high and low controls have normalized values of 100 and 0, respectively. The normalized values against the total siRNA concentrations were fitted to a four-parameter sigmoidal model using Genedata Screener data analysis software (Genedata, Basel, Switzerland) to obtain IC50 and maximal-activity values. The concentration–response data were also plotted using GraphPad Prism (GraphPad, San Diego, CA) to generate the high-resolution graphs presented in this article. The Z’ values were calculated according to the equation described by Zhang et al. 18 To evaluate technical variability in IC50 and maximal-activity determinations, a gene X bDNA FISH assay was performed with 32 gene X siRNAs. These siRNAs were tested at 1:3, 10-point serial dilutions in four replicate 384-well plates on the same day to obtain IC50 and maximal-activity values. IC50 values were compared after the logarithmic (base 10) transformation to yield a dataset that more closely conforms to a normal distribution.19,20 The box-and-whisker plots of the log-IC50 and maximal-activity values were generated using GraphPad Prism. The mean (µ) and standard deviation (σ) were calculated using Equations (2) and (3), respectively:


where xi is the logarithm of IC50 or the maximal activity in replicate i, and N is the number of replicates (N = 4 in this case).
In Vivo Knockdown Assay for Gene X
C57Bl6 male mice of 9–10 weeks of age were procured from Charles River Laboratories (Wilmington, MA), housed according to Amgen guidelines and Institutional Animal Care and Use Committee (IACUC) protocols, and cared for in accordance with the Guide for the Care and Use of Laboratory Animals, 8th edition. 21 Mice were housed in individual cages in an air-conditioned room at 22 ± 2 °C with a 12-h light, 12-h darkness cycle. Animals had ad libitum access to a regular chow diet (Envigo, Hackensack, NJ) and to water (reverse osmosis-purified) via an automatic watering system. The animals were randomized according to their body weight, and six were randomly assigned to each siRNA treatment. On day 0, the cohort was dosed subcutaneously once either with PBS or with specific siRNAs at 3 mg/kg body weight. On day 29, the mice were euthanized under CO2, and the left lobe of the liver was harvested from each animal. The tissue was cut into small pieces and immediately snap frozen in liquid nitrogen for later use. At termination, blood was collected by cardiac puncture under deep anesthesia and then, following Association for Assessment and Accreditation of Laboratory Animal Care (AAALAC) guidelines, euthanasia was by a secondary physical method. RNA was isolated using the TRIzol reagent (Thermo Fisher Scientific) according to the manufacturer’s guidelines. 2 µg of RNA was treated with DNase I (Promega, Madison, WI) and subjected to the quantitative PCR (qPCR) reaction using the Taqman RNA-to-Ct 1-Step Kit (Thermo Fisher Scientific). Gene-specific Taqman probes for mouse gene X and GAPDH were used to quantitate the mRNA expression. GAPDH was used as the internal control. The qPCR experiment was performed using the QuantStudio7 Flex Real Time PCR System (Thermo Fisher Scientific). Expression levels were calculated using the delta cycle threshold (Ct) method. Gene X knockdown is a percentage of decrease in the mRNA level of gene X compared to PBS controls.
Results and Discussion
Three siRNA targets—gene X, gene Y, and gene W—were selected as examples to demonstrate different aspects of the automated FISH assay platform in support of siRNA therapeutics development. For gene X, we describe the bDNA FISH assay development and the screening process. For gene Y, we show that bDNA FISH assays can be used to determine the allele-specific activity and the off-target effect of siRNAs. For gene W, we present a case that an siRNA screen was performed with a bDNA FISH assay using stable cells overexpressing the target.
bDNA FISH Assay Development and an siRNA Screen for Gene X
To develop a bDNA FISH assay for gene X, we chose Hep3B cells, for both their optimal expression of gene X and adherence to microplates. The firm adherence of cells to microplates avoids cell loss during multiple washing steps in the bDNA FISH assay procedure and is essential for reliable assay performance.
The manufacturer’s bDNA FISH assay protocol recommends using a 1:50 dilution for target probes and amplification reagents (pre-amplifiers, amplifiers, and label probes). But for the purpose of cost savings, we tested additional dilutions to see if we could reduce reagent concentrations without compromising assay performance. As shown in Figure 2A , we found that the mean spot count per cell did not change significantly under all dilutions of target probes we tested (around 14 spots per cell). We chose 1:100 dilution for target probes and further titrated amplification reagents. Increasing the dilution factor of amplification reagents decreased the number of spots slightly. We decided to use a 1:100 dilution for amplification reagents since this condition reduced reagent consumption while still maintaining a good signal-to-background ratio of 11 and a Z′ value of > 0.8. Cell images under the optimized conditions are shown in Figure 2B . The transcripts of gene X were detected as red punctate spots only in the presence of the target probes, suggesting amplification reagents did not bind nonspecifically to Hep3B cells.
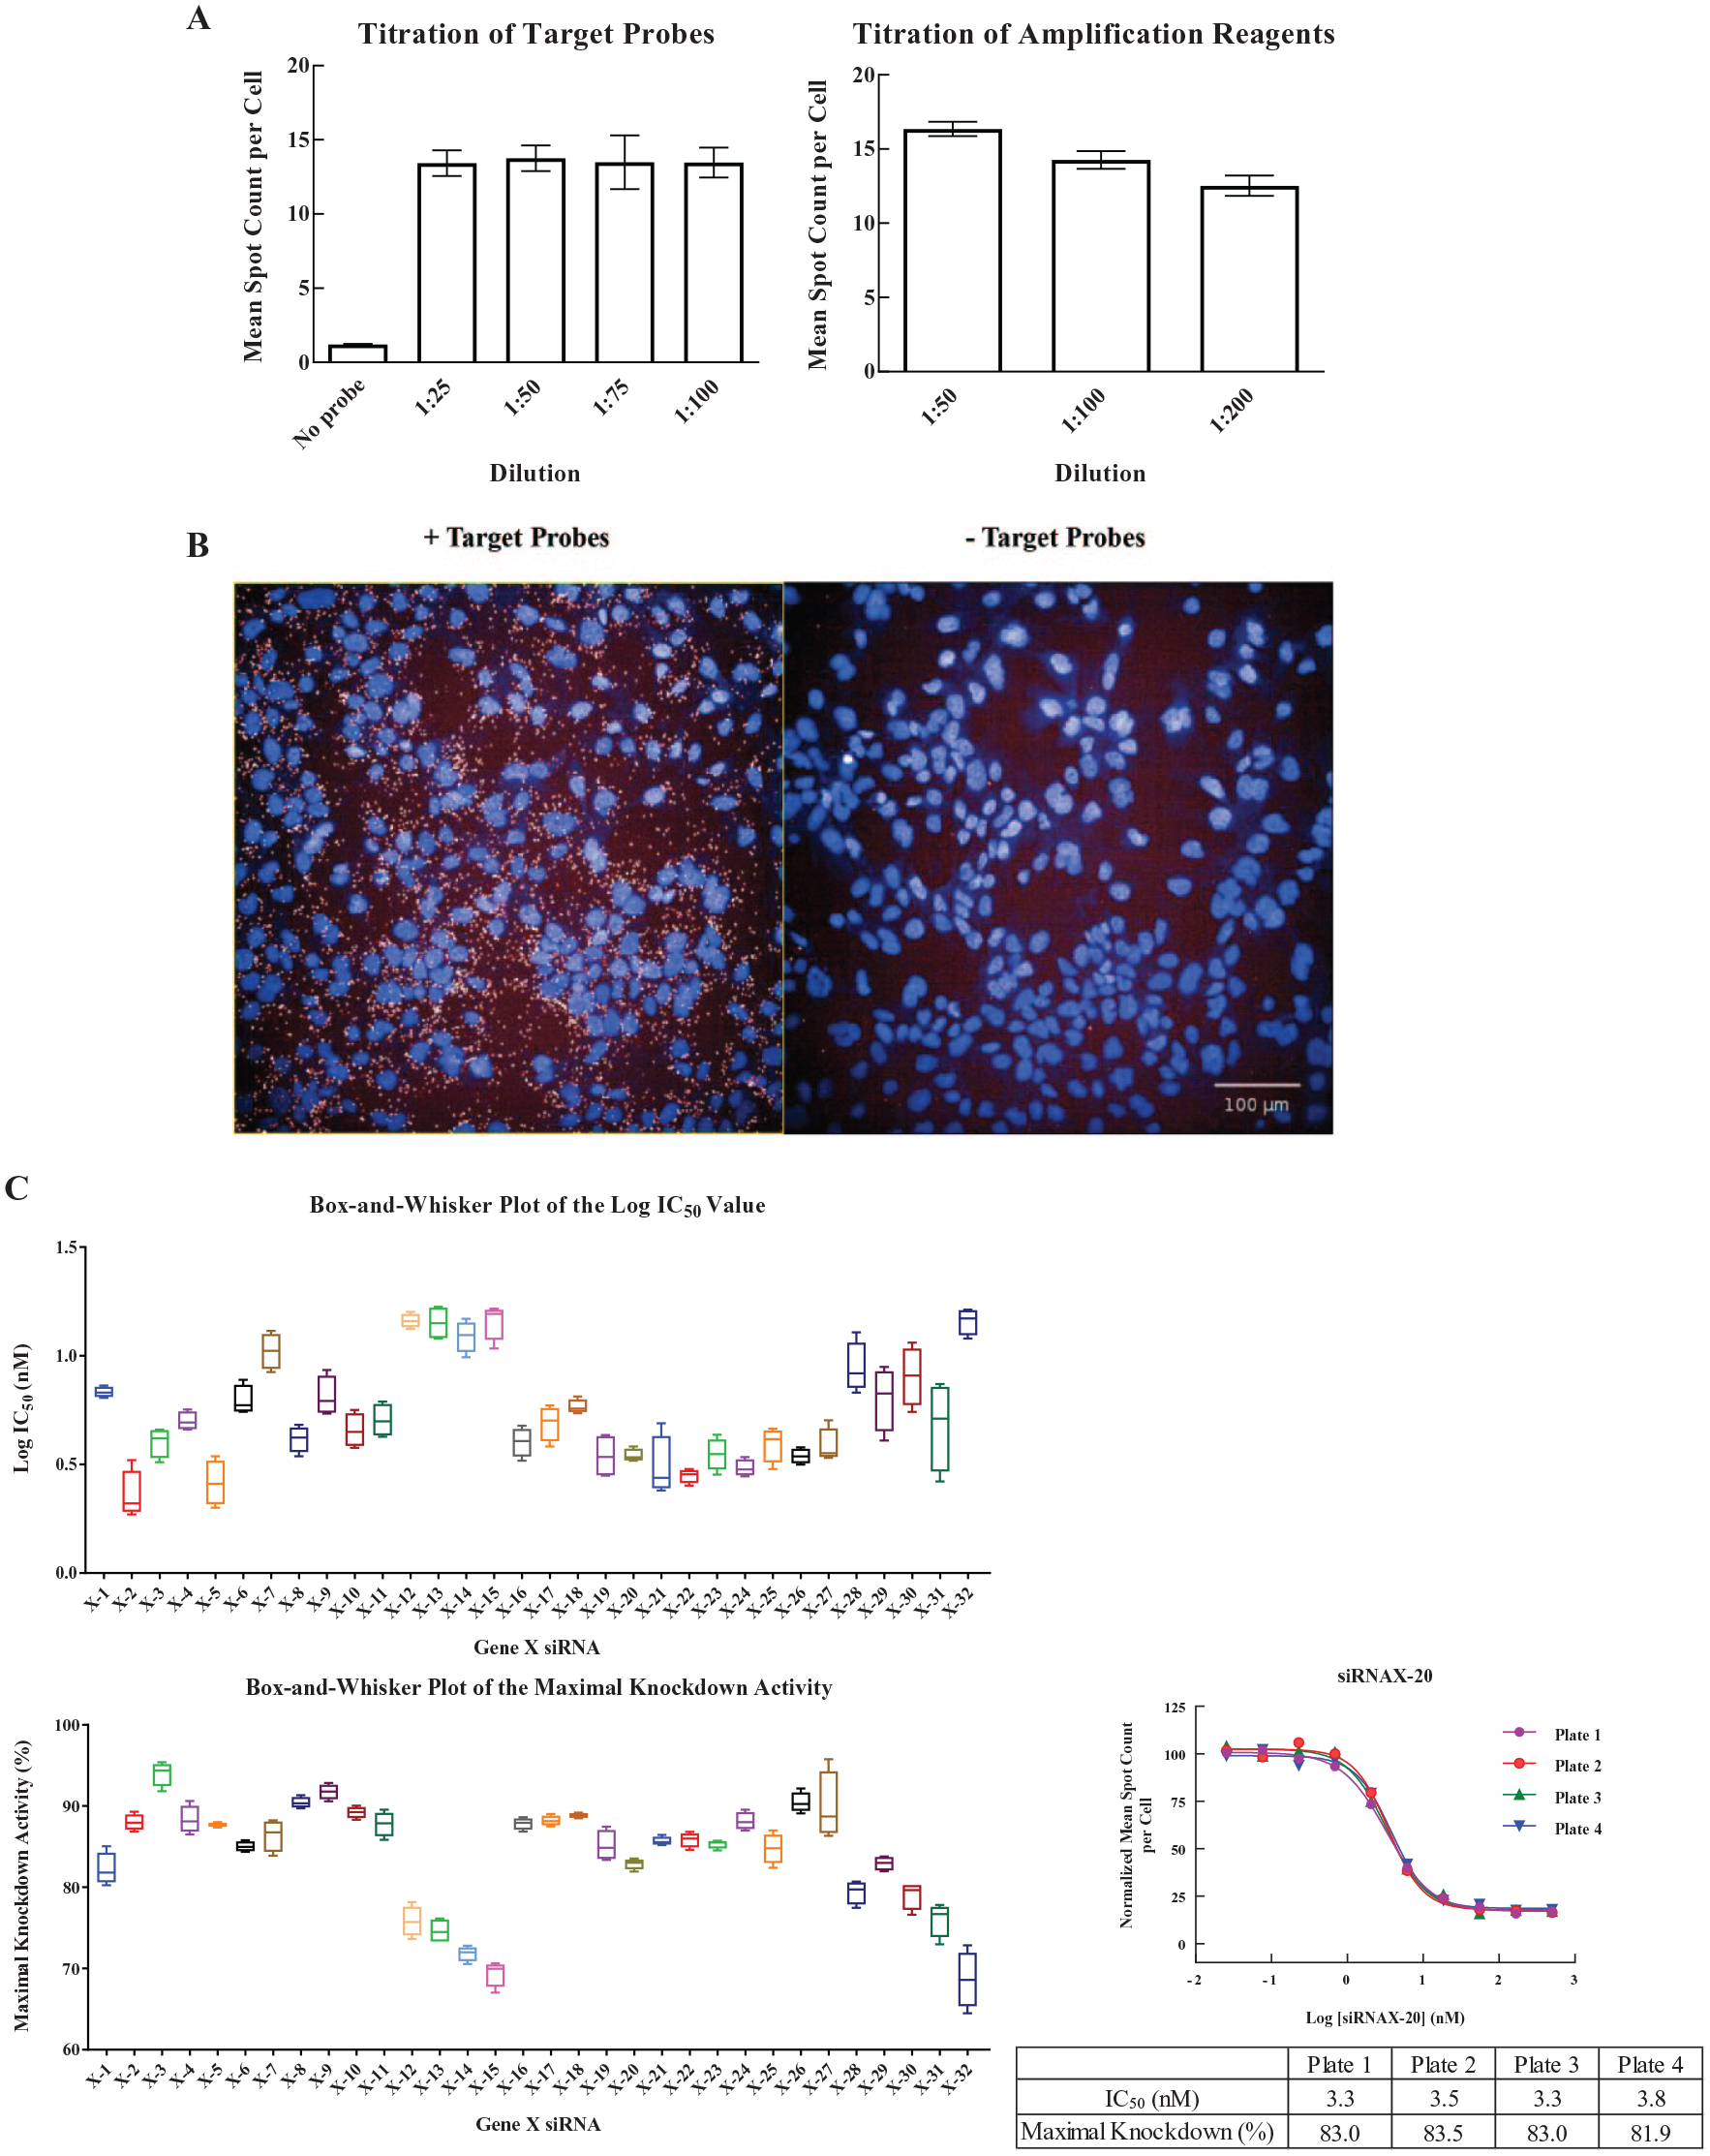
Development of the branched DNA (bDNA) fluorescence in situ hybridization (FISH) assay for gene X. (
To evaluate the technical variability of the gene X bDNA FISH assay executed on the automated platform, we treated Hep3B cells with 32 gene X siRNAs (X-1 to X-32) at 1:3, 10-point serial dilutions in four replicate assay plates on the same day, and determined the IC50 and maximal-activity values for each replicate. The distribution of IC50 values is usually not symmetrical, and the logarithmic transformation of IC50 values yields a dataset that more closely conforms to a normal distribution.19,20 Therefore, we logarithmically transformed IC50 values and then calculated statistical parameters (mean and standard deviation) using Equations (2) and (3). Supplemental Tables S1 and S2 summarize the log-IC50 and maximal-activity values determined from each replicate, along with the statistical parameters for 32 gene X siRNAs. The distribution of the log-IC50 and maximal-activity values among replicates is shown in the box-and-whisker plots ( Fig. 2C ) that display median values, 25/75 percentiles, and minimal/maximal values. For the log-IC50, the difference between the maximal and minimal values among replicates is < 0.47 log units (corresponding to a threefold difference in IC50) for all 32 siRNAs and < 0.30 log units (a twofold difference in IC50) for 28 siRNAs. For the maximal activity, the difference between the maximal and minimal values among replicates is < 10% for all 32 siRNAs and < 5% for 30 siRNAs. The replicate concentration–response curves for one representative siRNA (siRNA X-20) are also shown in Figure 2C . The concentration–response curves of siRNA X-20 from four replicate plates overlap well, with good agreement of IC50 and maximal-activity values among replicates. Taken together, these results indicate that the gene X bDNA FISH assay executed on the automated platform has good reproducibility.
Through bioinformatics analysis, we selected 214 human/mouse cross-reactive siRNA sequences for gene X from approximately 4500 possible sequences. These siRNAs were synthesized and tested in the bDNA FISH assay. Since the number of siRNAs was not large, we screened these siRNAs in a 10-point concentration–response format with a threefold serial dilution of siRNA from 500 nM to 25 pM. 109 siRNAs showed > 65% maximal knockdown of gene X, with IC50 values < 100 nM. siRNAs that caused a decrease in the cell number were deprioritized. Among these 109 sequences, we selected 40 sequences and applied chemical modifications to enhance the in vivo stability of siRNAs. These 40 siRNAs were tested in both the in vitro bDNA FISH assay and the in vivo knockdown assay for gene X. As shown in Figure 3 , with the new chemical modifications, some siRNAs showed reduced knockdown efficacy for gene X in the bDNA FISH assay. Nevertheless, there is a positive correlation (Pearson r = 0.52) between in vitro and in vivo maximal knockdown activities, and most of the siRNAs lie in quadrants I and III. Some siRNAs in quadrant IV showed good in vitro activity but low in vivo efficacy, which may be due to poor pharmacokinetic properties. The six siRNAs in quadrant I (highlighted in red in Figure 3 ) showed > 60% knockdown of gene X in both in vitro and in vivo assays, and they were selected for further optimization with different chemical modifications. Since the number of siRNAs that can be tested in animals is often limited by financial constraints and ethical issues, the in vitro–in vivo data correlation shown in Figure 3 supports that the bDNA FISH assay can be used to prioritize siRNAs for in vivo evaluation.
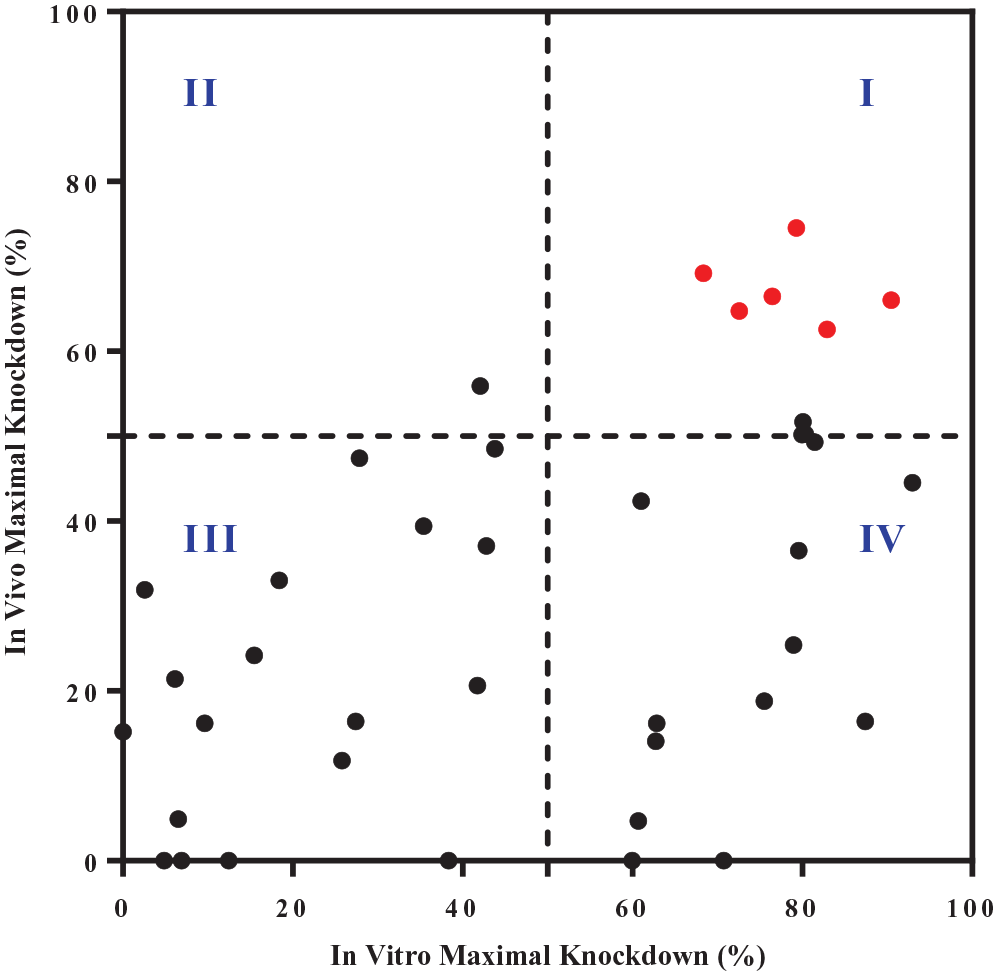
Correlation of in vitro and in vivo maximal knockdown of gene X by small interfering RNAs (siRNAs). The in vitro knockdown of gene X was measured by the branched DNA (bDNA) fluorescence in situ hybridization (FISH) assay 72 h after siRNA transfection into Hep3B cells. The in vivo silencing of gene X was determined by quantitative reverse transcription PCR (qRT-PCR) 29 days after a single subcutaneous injection of siRNAs to male C57Bl6 mice at a dose of 3 mg/kg body weight.
Identification of Gene Y Mutant Allele-Specific siRNAs with Reduced Off-Target Effects by a bDNA FISH Assay
To evaluate siRNA activities against wild-type and disease-associated mutant alleles of gene Y, we identified cell lines that express wild-type or mutant alleles of gene Y and developed bDNA FISH assays for these cell lines. By using an allelic discrimination droplet-digital PCR (ddPCR) assay, we found that HepG2 cells are homozygous for mutant gene Y, while Hep3B cells are homozygous for wild-type gene Y (data not shown). To determine siRNA activities against wild-type and mutant alleles of gene Y, we performed bDNA FISH assays for gene Y using Hep3B and HepG2 cells, respectively. Examples of data are shown in Figure 4A . Gene Y siRNA Y-1 showed 73% maximal knockdown of mutant gene Y in HepG2 cells with an IC50 value of 5 nM, but no activity against wild-type gene Y in Hep3B cells. Therefore, siRNA Y-1 has the desired selectivity for the disease-associated mutant allele of gene Y. In contrast, gene Y siRNA Y-2 knocked down gene Y in both HepG2 and Hep3B cells, and therefore lacks the desired selectivity profile.
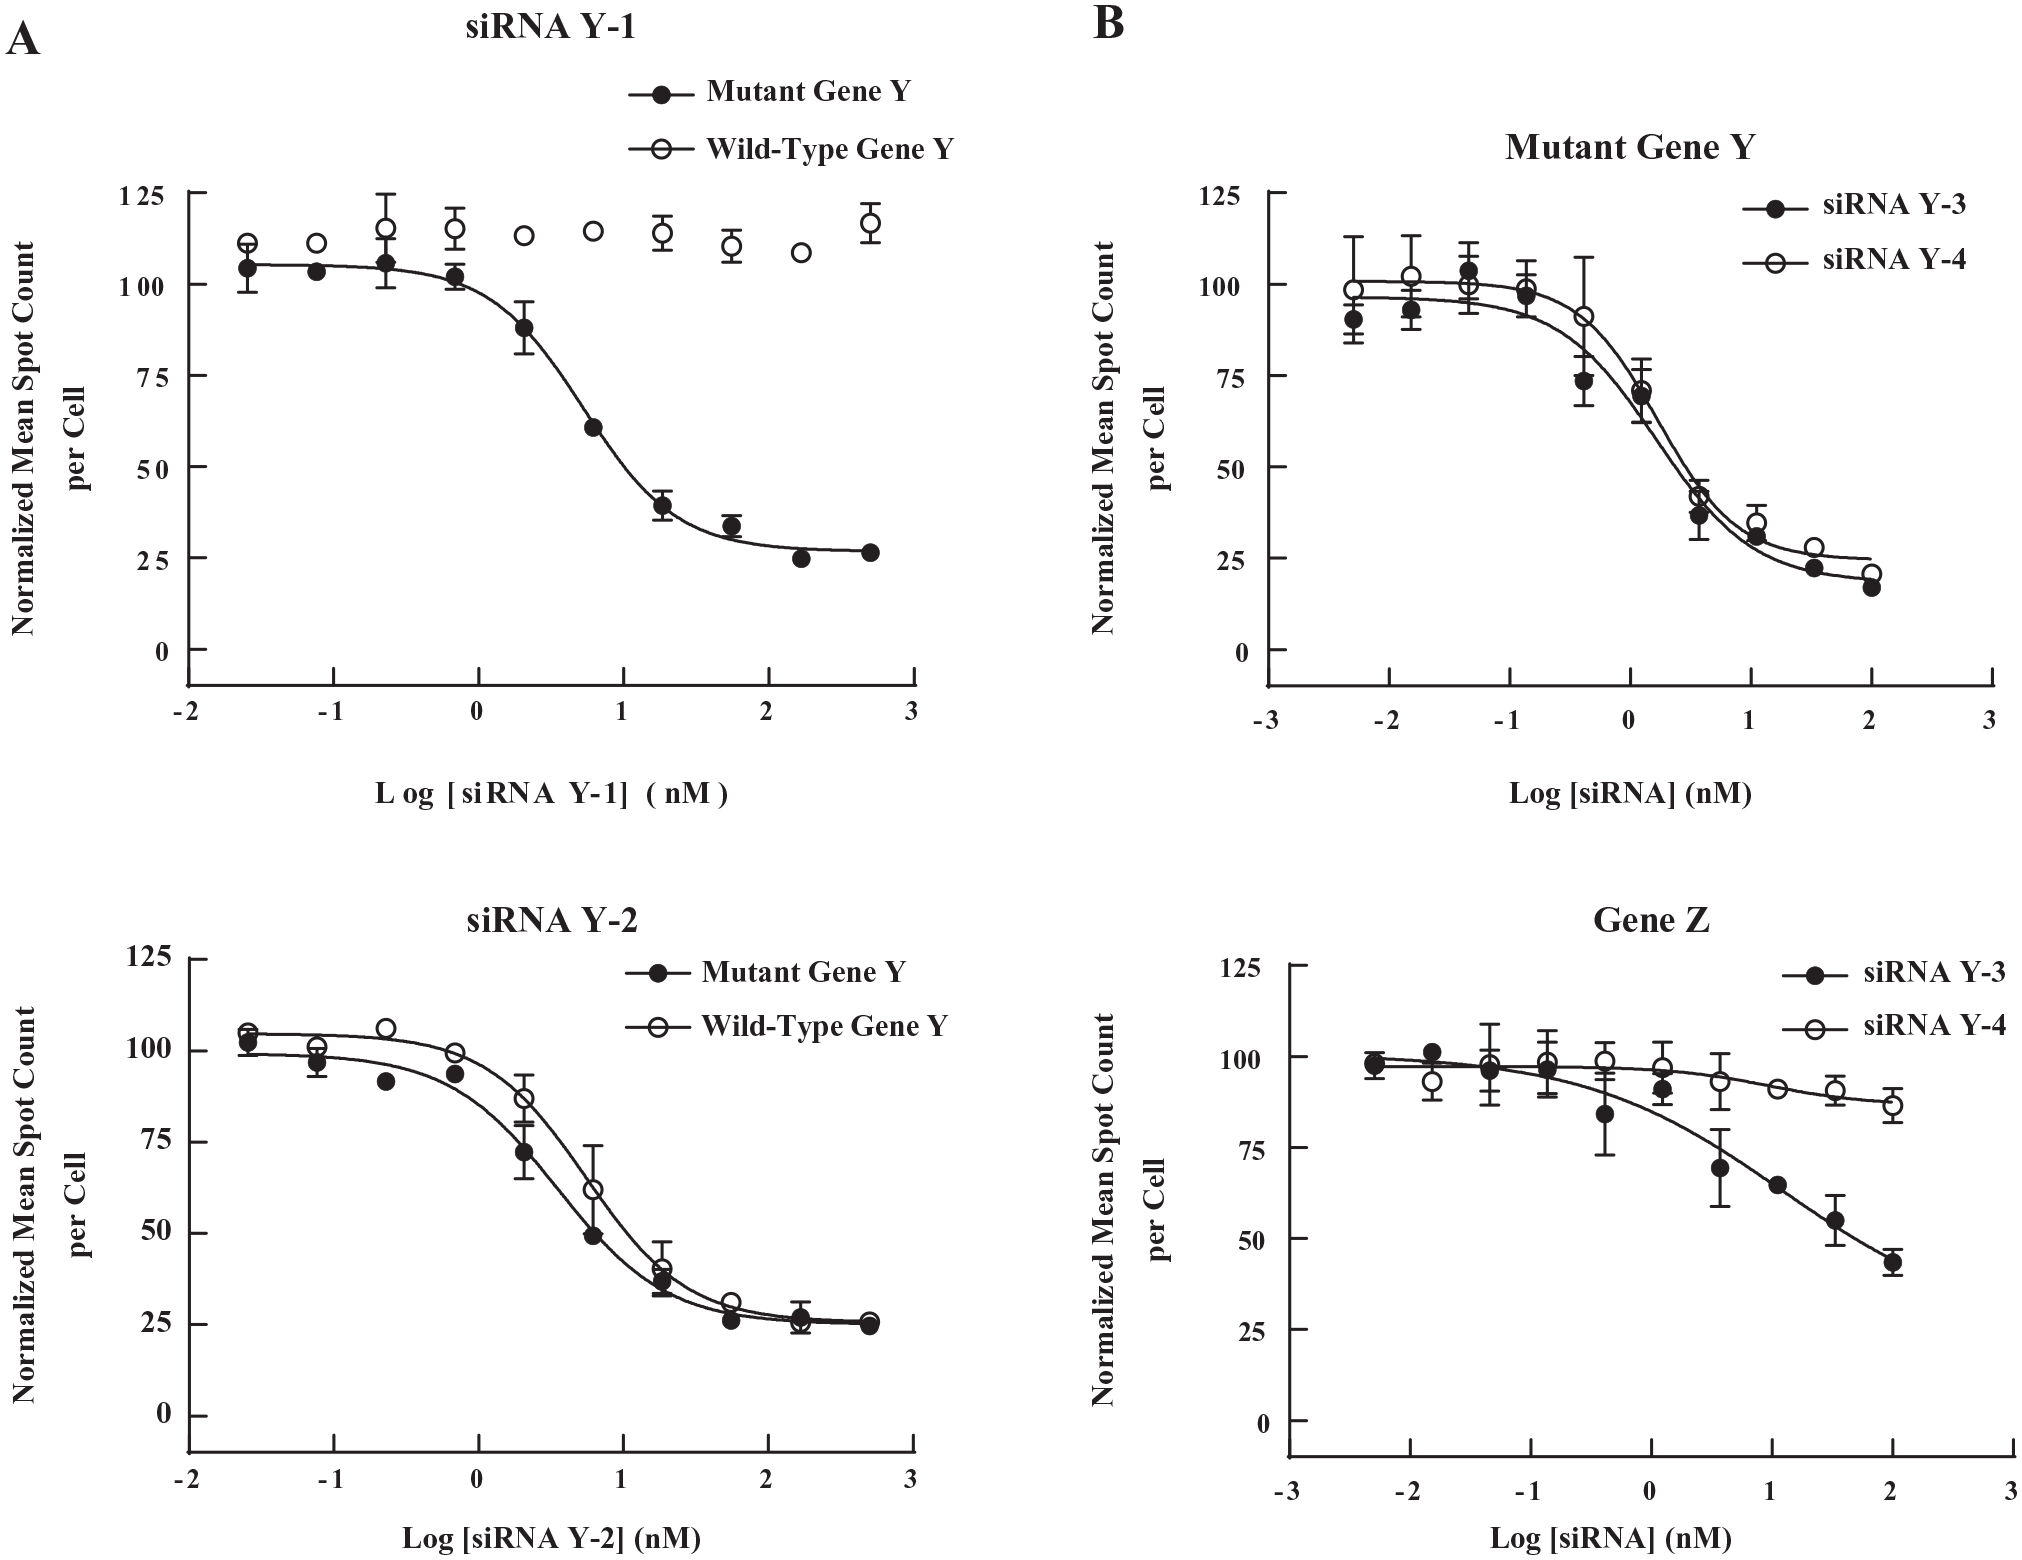
Determination of allele-specific silencing of gene Y and the off-target effect on gene Z by branched DNA (bDNA) fluorescence in situ hybridization (FISH) assays. (
In addition to the desired on-target activity, siRNAs may silence unintended (off-target) transcripts through partial sequence complementarity to off-target mRNAs. 22 The residues at positions 2–8 in the guide strand (seed region) are mostly involved in the base pairing that drives the microRNA-like off-target effects. 23 It was reported that siRNA off-target effects can be reduced by chemical modification of nucleotides in the seed region, particularly by incorporation of 2’-O-methyl ribosyl substitution 24 or introduction of abasic or glycol nucleic acid (GNA) residues in the seed region.25,26
To identify the off-target genes of siRNAs for gene Y, we performed genome-wide profiling experiments using RNA-Seq and identified gene Z as one of the off-targets (data not shown). Since HepG2 cells express both mutant gene Y and gene Z, we can measure the on-target (mutant gene Y) and off-target (gene Z) activities of siRNAs in the same well using a multiplexed bDNA FISH assay with two types of fluorochrome-conjugated label probes. An example of a seed region modification that reduces off-target activity is shown in Figure 4B . siRNA Y-4 has the same sequence as siRNA Y-3 except for a seed region modification in the guide strand. Compared to siRNA Y-3, siRNA Y-4 showed lower knockdown of off-target gene Z while maintaining similar on-target activity for mutant gene Y.
An siRNA Screen for Gene W by a bDNA FISH Assay Using Target-Overexpressing Stable Cells
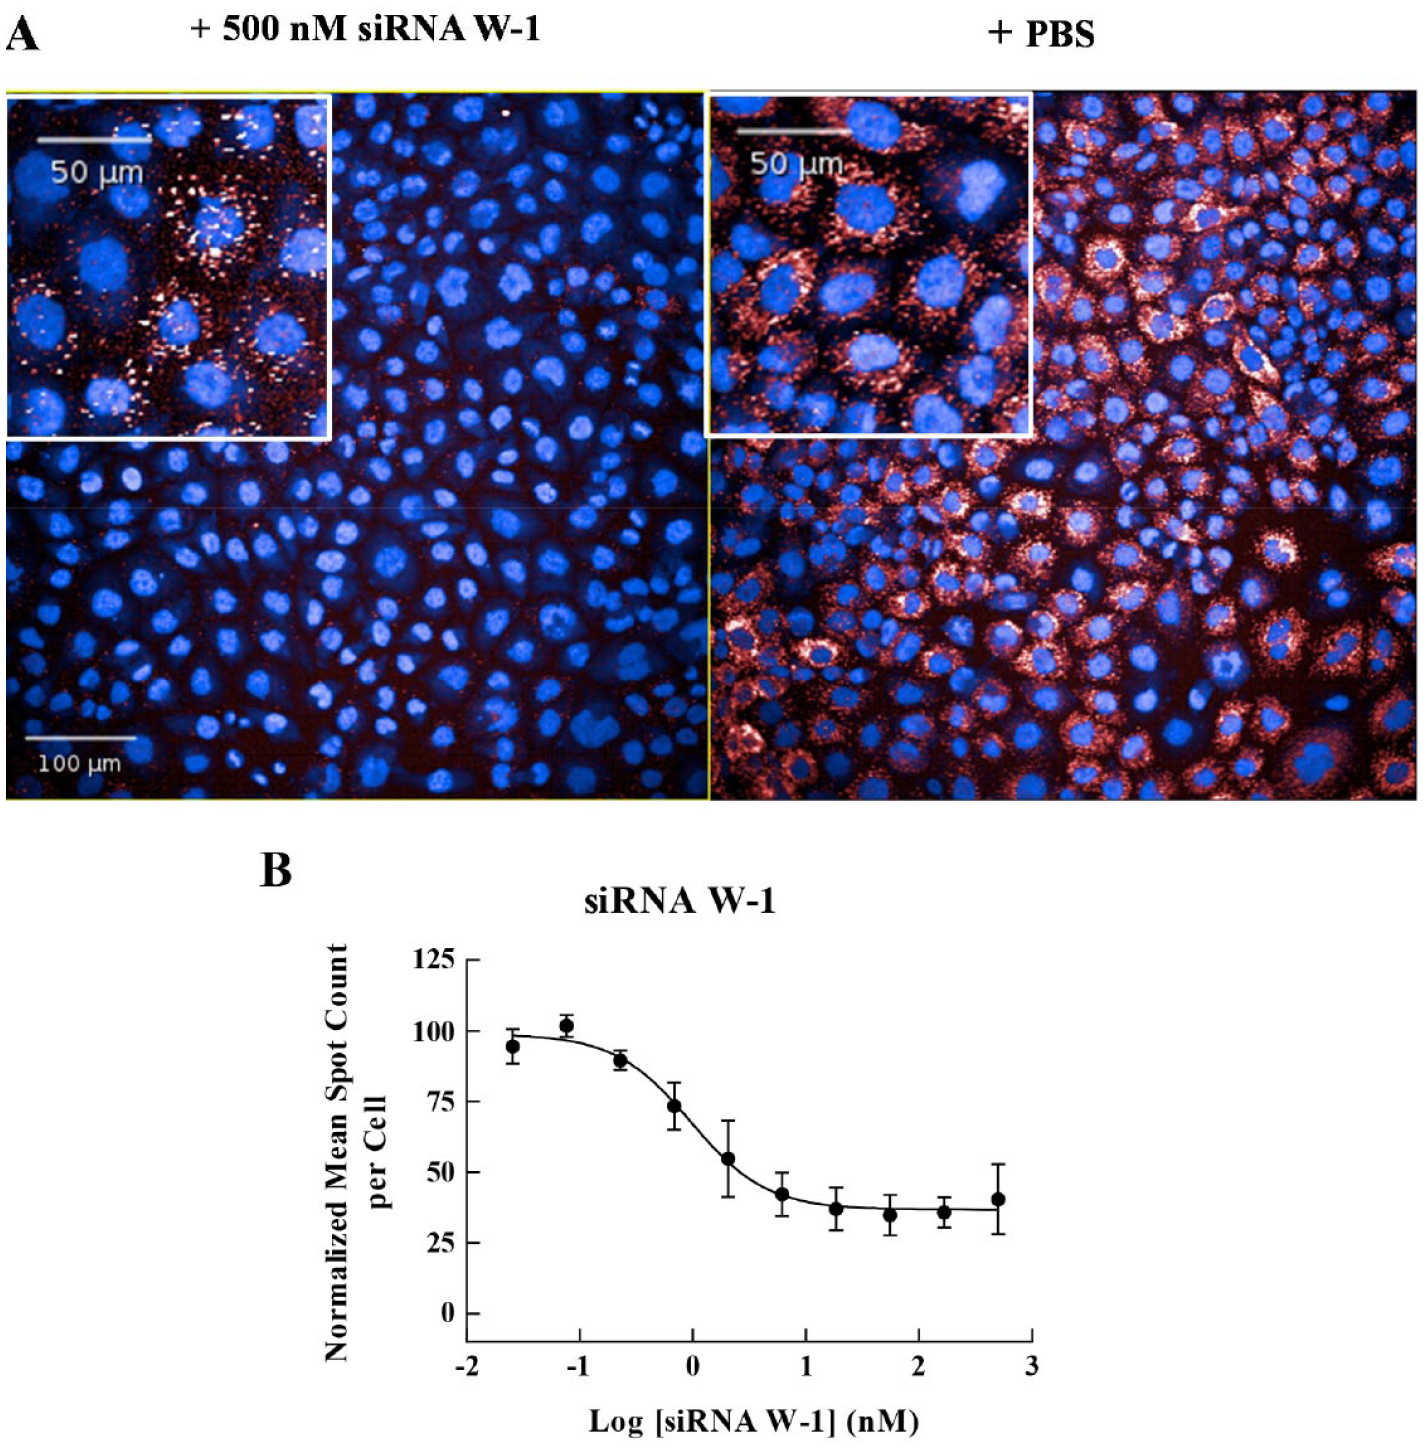
To screen siRNAs for activity against gene W, we needed to use stable cell lines due to lack of cell lines endogenously expressing gene W that were suitable for a bDNA FISH assay. Therefore, we generated CHO cells that stably overexpress gene W and developed a bDNA FISH assay using these cells. As shown in Figure 5 , the mRNA molecules of gene W could be detected in these cells by bDNA FISH assay with approximately 50 spots per cell, and siRNA W-1 showed 64% maximal knockdown of gene W with an IC50 value of 1 nM. In total, 170 siRNAs targeting gene W were screened in a 10-point concentration–response format using the bDNA FISH assay. The assay performed well, with an average signal-to-background ratio of 36 and an average Z’ value of 0.81. Overall, 29 siRNAs showed > 50% maximal knockdown of gene W with IC50 values < 100 nM.
Branched DNA (bDNA) fluorescence in situ hybridization (FISH) assay for gene W. (
In summary, we have assembled an automated FISH assay platform with a capacity for testing six 384-well plates in a single run. Using this platform, we have screened siRNAs in the bDNA FISH assays for multiple target genes and successfully identified siRNAs that have good on-target and reduced off-target effects. We also found that the bDNA FISH assay is sensitive and performs well in various cells with a range of target gene expression levels. The bDNA FISH assay can be performed using either cells with endogenous gene expression or engineered cells expressing target genes; thus, this FISH assay platform can be used to support programs for developing mRNA-regulating therapeutics. In addition, as the bDNA FISH assays for different target genes share the same assay procedure and reagents except for target probes, it is possible to perform the assays for multiple targets in a single run. This is especially useful when the number of test siRNAs from each target is below the capacity of the FISH assay platform.
siRNAs for therapeutic applications are often designed using bioinformatics tools to select sequences that meet certain criteria, such as targeting all relevant transcript variants of the gene of interest, cross-reactivity with preclinical species of interest, dissimilarity from all other genes, and freedom to operate. With the pre-set criteria, the number of designed siRNAs for synthesis and screening is usually small (e.g., < 500 for a gene of interest). Since our automated FISH assay platform has a capacity for testing 192 siRNAs at 10 concentrations in a single run, screening of designed siRNAs for a gene of interest in the concentration–response format can be completed within a few days. In the event that the number of designed siRNAs is large, siRNAs can be screened at a single concentration first, followed by a concentration–response test to resolve the potency and efficacy parameters of siRNAs. If higher throughput is desired, one could also explore the possibility of conducting bDNA FISH assays in 1536-well format.
Supplemental Material
Supplemental_Material_FISH_Dou_et_al – Supplemental material for An Automated High-Throughput Fluorescence In Situ Hybridization (FISH) Assay Platform for Use in the Identification and Optimization of siRNA-Based Therapeutics
Supplemental material, Supplemental_Material_FISH_Dou_et_al for An Automated High-Throughput Fluorescence In Situ Hybridization (FISH) Assay Platform for Use in the Identification and Optimization of siRNA-Based Therapeutics by Hui H. Dou, Rommel Mallari, Andrew Pipathsouk, Amrita Das and Mei-Chu Lo in SLAS Discovery
Footnotes
Acknowledgements
We thank Joseph McGivern and Bhavaani Jayaram for critical reading of the manuscript and Michael Berke for FISH assay platform support.
Supplemental material is available online with this article.
Declaration of Conflicting Interests
The authors declared the following potential conflicts of interest with respect to the research, authorship, and/or publication of this article: All authors are employed by Amgen Inc., and their research and authorship of this article were completed within the scope of their employment with Amgen Inc.
Funding
The authors received no financial support for the research, authorship, and/or publication of this article.
References
Supplementary Material
Please find the following supplemental material available below.
For Open Access articles published under a Creative Commons License, all supplemental material carries the same license as the article it is associated with.
For non-Open Access articles published, all supplemental material carries a non-exclusive license, and permission requests for re-use of supplemental material or any part of supplemental material shall be sent directly to the copyright owner as specified in the copyright notice associated with the article.