
Abstract
Glucose transporter 9 (GLUT9), which transports urate in an electrogenic and voltage-dependent manner, plays an important role in the maintenance of normal blood uric acid/urate levels. In the present study, we established a cell model based on the single-electrode patch-clamp technique for characterization of GLUT9 and explored the inhibitory effects of benzobromarone (BM) and probenecid (PB) on urate-induced currents in mouse GLUT9a (mGLUT9a)–expressing HEK-293T cells. The results showed that uric acid, rather than glucose perfusion, led to a rapid and large outward current by mGLUT9a in dose-, voltage-, and pH-dependent manners. BM prominently and irreversibly inhibited the uric acid–induced currents through mGLUT9a, and PB weakly and reversibly inhibited mGLUT9a. We found that depletion of K+ in the external solution significantly strengthened the blockade of BM on mGLUT9a. In addition, an enhanced inhibitory rate of BM was detected when the pH of the external solution was changed from 7.4 to 5.5, indicating that BM functions optimally in an acidic environment. In conclusion, the combination of the established cell model with patch-clamp techniques first revealed the function properties of GLUT9 inhibitors and may provide potential benefits to the study of GLUT9 inhibitors as antihyperuricemic or antigout agents.
Keywords
Introduction
Hyperuricemia is an abnormally high level of uric acid in the blood and is associated with the risk of developing gout, cardiovascular diseases (such as hypertension), and renal diseases.1–4 Either increased production or decreased excretion of urate contributes to hyperuricemia. Interestingly, 90% of hyperuricemic patients are underexcreters. 5
Kidneys play an important role in the regulation of serum uric acid. Renal urate excretion is determined by the balance between the reabsorption and secretion of urate. A series of urate transporters is responsible for urate reabsorption and excretion, as illustrated in Supplemental Figure S1 .6–8 The reabsorption of uric acid mainly depends on urate-anion transporter 1 (SLC22A12, URAT1), organic anion transporter 4 (OAT4), and OAT10, which are predominantly expressed on the apical brush border membrane of proximal tubule epithelial cells in the kidneys, as well as GLUT9, which is located on the basal membrane of renal tubular epithelial cells.9–11 It is estimated that almost 90% of the uric acid in kidney is transported into the epithelial cells from the renal tubules by URAT1 and reabsorbed into the blood by GLUT9. Then, the uric acid is excreted via urate excretion transporters, such as OAT1/3, sodium-dependent phosphate transport 1/4 (NPT1/4), and adenosine 5′-triphosphate-binding cassette subfamily G member 2 (ABCG2).12–14
Currently, medications used to treat hyperuricemia mainly target the reduction of the reabsorption of uric acid in the kidneys, such as benzobromarone (BM), probenecid (PB), and lesinurad. All of these medications are inhibitors of URAT1. BM is a uricosuric agent often used in Germany, Japan, Singapore, and China. However, because of its low selectivity and hepatotoxicity, BM is still not approved by the Food and Drug Administration (FDA). 15 In addition, PB is not used worldwide because of its poor efficacy and low selectivity. Low selectivity of BM and PB may lead to excessive drug-drug interactions in vivo.16,17 Lesinurad received FDA approval in 2015, and it is used in combination with a xanthine oxidase inhibitor, such as allopurinol (AP) or febuxostat at a dosage of 200 mg or 400 mg, for treating hyperuricemia associated with gout. However, kidney problems frequently occur with this treatment regimen. 18
GLUT9, which is recognized as a uric acid transporter with high capacity and low affinity,19,20 has gained increasing attention for the maintenance of normal blood uric acid levels. It has been widely reported that patients with GLUT9 mutations are more likely to suffer from renal hypouricemia.21–23 Furthermore, GLUT9 has been reported to transport urate in vitro at a rate seven times higher than that of URAT1 in URAT1-expressing oocytes, 24 indicating that GLUT9 plays a more essential role than URAT1 in the regulation of uric acid homeostasis. These findings highlight the importance of GLUT9 as a potential target for the development of urate-lowering medications.21,25,26
However, medications that specifically and selectively target GLUT9 are currently not available, and there are limited studies regarding GLUT9 inhibitors. As previously reported, the well-known uricosurics, BM and PB, are inhibitors of GLUT9,19,24 but the effects and underlying mechanisms of BM and PB on GLUT9 have not been fully elucidated. Until now, the available methods used to study GLUT9 and its inhibitors require the application of [ 14 C]-labeled urate uptake assays or the two-electrode voltage clamp (TEVC) technique using the Xenopus laevis oocyte expression system. In the present study, we established a cell model based on the single-electrode patch-clamp technique using the HEK293T cell line to provide a rapid method for the characterization of GLUT9 and its inhibitors and lay the foundation for the discovery of more potent uricosurics targeting GLTU9 in the future.
Materials and Methods
Chemicals and Reagents
Uric acid, BM, PB, RDEA3170 (3170), and AP were obtained from Sigma-Aldrich (St. Louis, MO). Lipofectamine 3000 was purchased from Invitrogen (Carlsbad, CA). GLUT9 (abs143592) and GAPDH (SAB21612) antibodies (rabbit) were purchased from Proteintech (Chicago, IL) and Santa Cruz Biotechnology (Santa Cruz, CA), respectively. Horseradish peroxidase (HRP)–conjugated goat anti-rabbit antibody was obtained from Fdbio Science (Hangzhou, China).
Cell Culture and Transfection
HEK293T cells were cultured in Dulbecco’s Modified Eagle’s Medium (New York, NY) supplemented with 10% fetal bovine serum and 1% penicillin/streptomycin, and cells were incubated at 37 °C with 5% CO2. To construct the plasmid-expressing mouse GLUT9a (mGLUT9a) cDNA, pcDNA3.1 (−) was used as the expression vector, and the active fragment of the target gene sequence was the full length of GLUT9a (gene ID: 117591). Under the action of T4 ligase, the target gene fragment was cloned into the pcDNA3.1 (−) vector, and the plasmid was transformed into Escherichia coli and cultured at 37 °C for 16 h. A single colony was picked, placed in a prepared liquid culture solution, and shaken for 16 h at 37 °C. The plasmid was extracted after shaking and identified using a double enzyme digestion. The pcDNA3.1 (−)-GLUT9a recombinant plasmid was selected and verified by sequencing (
Quantitative Real-Time PCR (qRT-PCR)
Total RNA was extracted from GLUT9a-transfected cells using the Animal Total RNA Isolation Kit (FOREGENE, Chengdu, China), and a 500 ng aliquot of total RNA was reverse transcribed to cDNA using PrimeScript RT Master Mix (Takara, Japan). mRNA expression levels were determined using Power-Up SYBR Green Master Mix (Thermo Fisher Scientific, Waltham, MA) and the Roche LightCycler480II system (Roche, Basel, Switzerland). The amplification procedures were performed according to the manufacturer’s instructions, and the primers used in the study were synthesized by Sangon (
Western Blot Assays
Membrane and cytoplasm fraction proteins from mGLUT9a-transfected HEK293T cells were separated by the Plasma Membrane Protein Isolation and Cell Fractionation Kit (Invent Biotechnologies, Plymouth, MN). The protein concentrations were determined by BCA reagent (Thermo Fisher Scientific). Equal amounts of protein samples (35 µg) were subjected to 10% sodium dodecyl sulfate–polyacrylamide gel electrophoresis (Beyotime Biotechnology, Jiangsu, China) and transferred to polyvinylidene fluoride membranes. Membranes were probed with the corresponding primary antibodies (GLUT9 at 1:1500 and GAPDH at 1:2000) at 4 °C overnight. The HRP-conjugated goat anti-rabbit secondary antibody was then applied, and the immunoreactive bands were visualized by a gel-imaging system. Densitometric analyses were performed using ImageJ software (National Institutes of Health, Bethesda, MD).
Electrophysiological Recordings
Currents were recorded 29 h after transfection by the whole-cell patch-clamp technique and measured with a MultiClamp 700B patch-clamp amplifier, Digidata 1550B digitizer, and pClamp 10 software (Molecular Devices, Sunnyvale, CA). The sampling rate was 20 kHz and was digitally filtered at 2 kHz. The series resistance compensation was set to 60%. The electrodes were pulled from borosilicate glass capillaries (BF150-110-10, Sutter Instruments, Novato, CA) and had a resistance of 2 to 5 MΩ when filled with intracellular solution. The intracellular solution contained 140 mM KCl, 1 mM MgCl2, 5 mM EGTA, and 10 mM HEPES (pH adjusted to 7.4 with KOH), whereas the extracellular solution was composed of 140 mM NaCl, 5 mM KCl, 1 mM MgCl2, 2 mM CaCl2, 10 mM HEPES, and 10 mM glucose (pH adjusted to 5.5, 7.4, and 8.5 with NaOH). The extracellular solution without K+ was composed of 140 mM NaCl, 5 mM CsCl, 1 mM MgCl2, 2 mM CaCl2, 10 mM HEPES, and 10 mM glucose. BM, PB, 3170, and AP were dissolved in dimethyl sulfoxide. The stock solutions were diluted with extracellular solution containing 1 mM uric acid extracellular solution to obtain the final concentrations before the experiments. During the experiments, a constant perfusion of solution (control or solution containing drugs) was delivered by a homemade perfusion device, allowing a rapid solution exchange with an approximate flow velocity of 2 to 4 mL/min.
Data and Statistical Analysis
Data are shown as the mean ± SEM. Statistical analyses between two groups were performed with unpaired Student t test. IC50 and Km values of urate kinetic analysis were determined from a nonlinear regression. In all cases, a P value less than 0.05 was considered statistically significant. All statistical analyses were performed with GraphPad Prism 8.0 Software (GraphPad Software, San Diego, CA).
Results
mRNA and Protein Expression Levels of mGLUT9 in Transfected HEK293T Cells
To ensure transfection efficiency, qRT-PCR and Western blot analyses were used to examine the mRNA and protein expression of GLUT9a in transfected HEK293T cells. As shown in Figure 1 , the mRNA and crude membrane protein levels of GLUT9 were significantly increased in GLUT9a-transfected HEK293T cells. In addition, GLUT9a was expressed on the crude membrane instead of the cytoplasm, which was in accordance with a previous report. 19 These results indicated that the GLUT9a-expressing cell model was successfully generated and that it could be used to characterize the urate transport of GLUT9a and explore the action mechanisms of potential GLUT9a inhibitors.
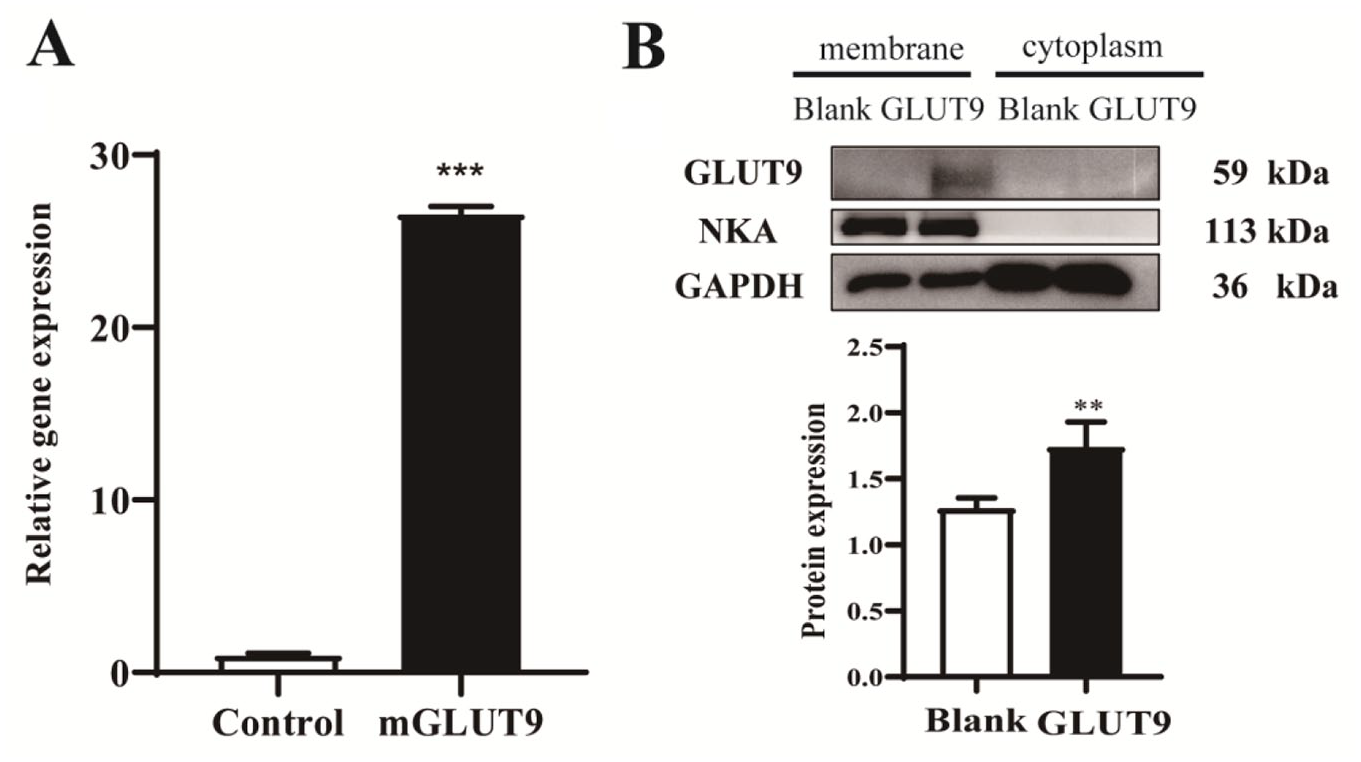
Expression of mouse GLUT9 (mGLUT9) in transfected HEK-293T cells. (
Urate-Induced mGLUT9 Currents in an Electrogenic and Voltage-Dependent Manner
The schematic representation of the protocol for the patch-clamp experiments is shown in
Figure 2A
. To record the currents stimulated by uric acid, we selected conditions, including different cell types (COS-7, CHO, or HEK 293T cells), transfection times, and incubation temperatures (
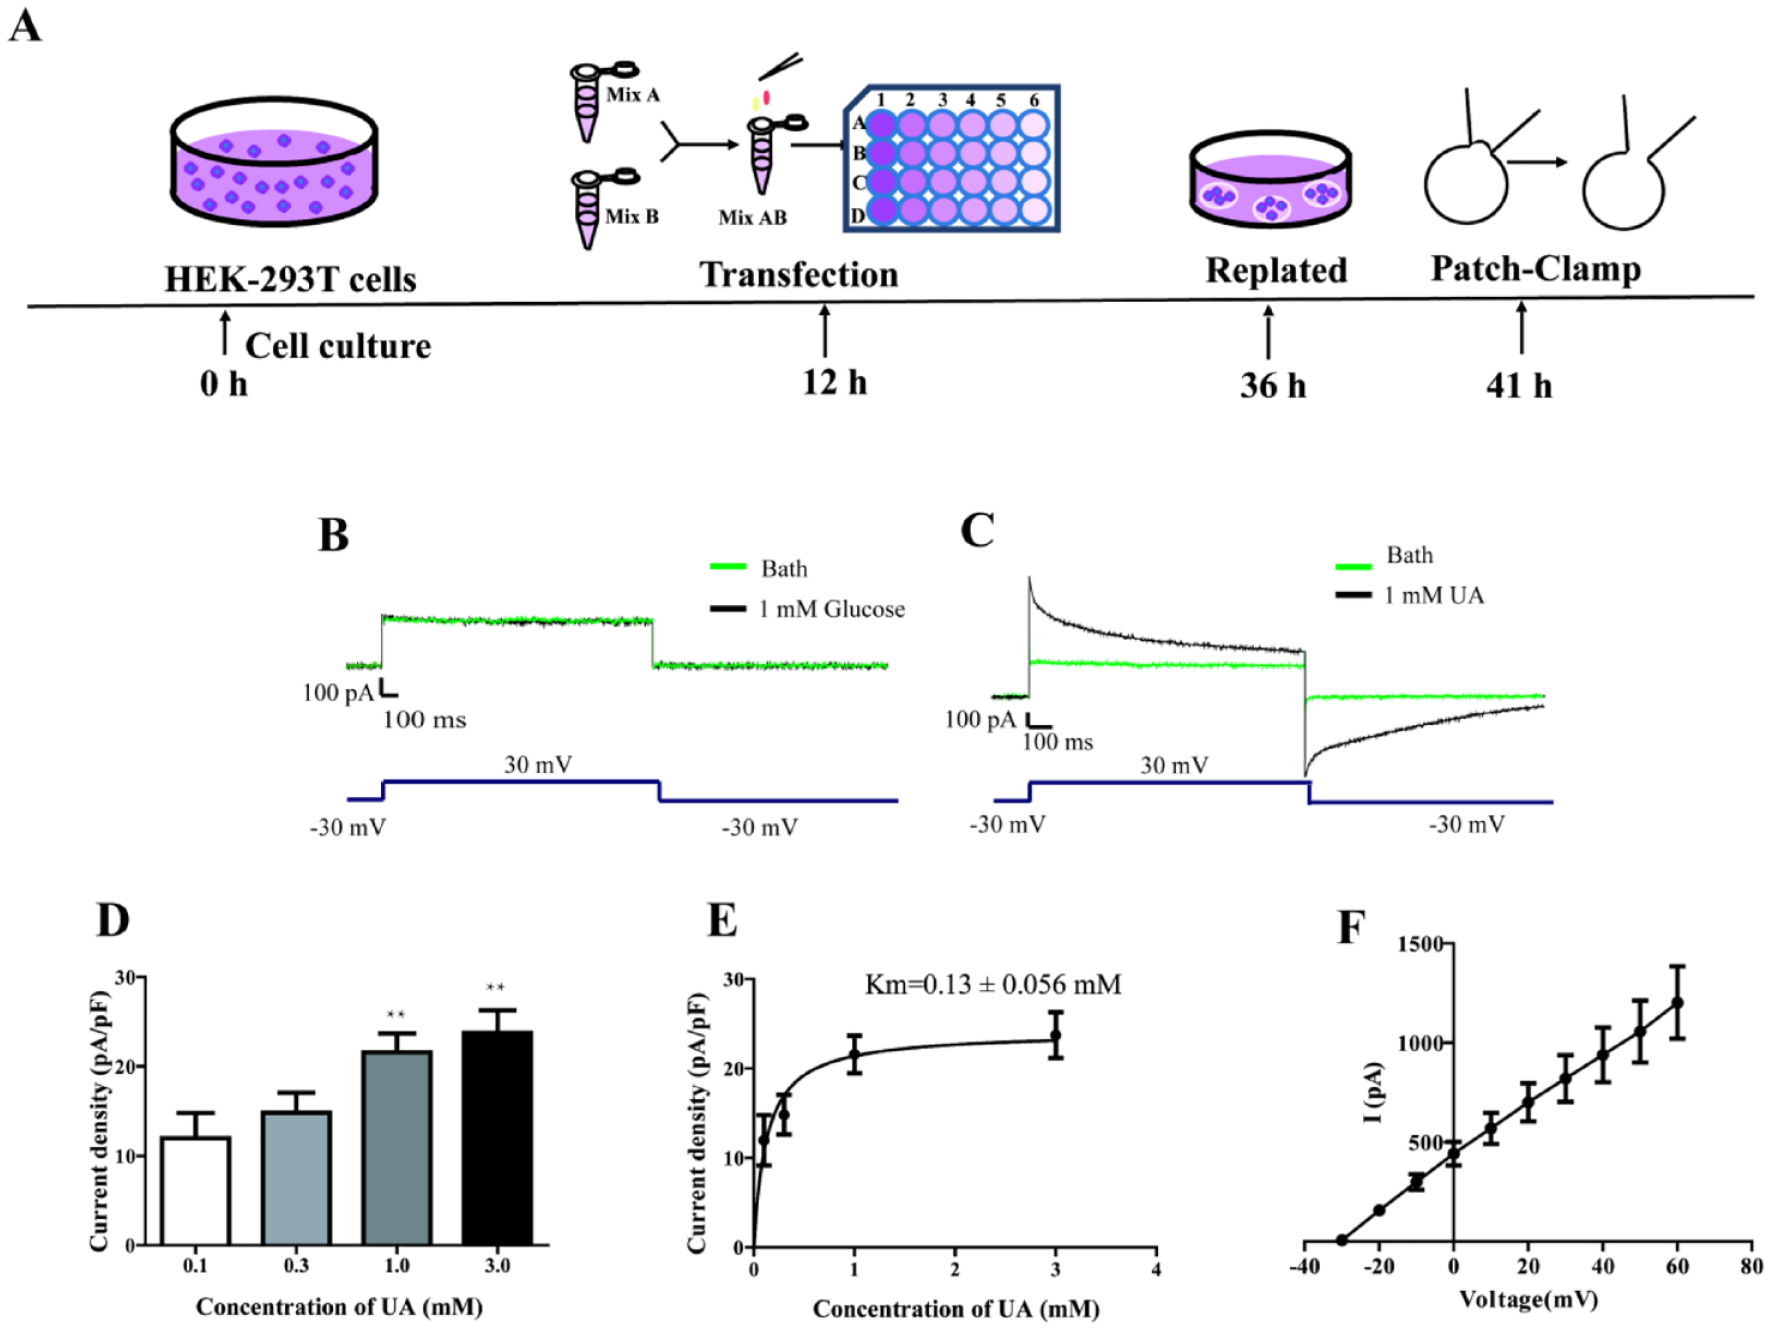
Urate transported via mGLUT9 was electrogenic. (
To verify that the recorded currents were specifically produced by the stimulation of uric acid, 1 mM glucose (another reported substrate of GLUT9) was applied. As shown in Figure 2B , glucose (black trace) failed to induce currents in mGLUT9a-expressing cells. When 1 mM uric acid perfusion was applied, however, it induced a rapid and large outward current (black trace, about 500 pA) compared with the bath perfusion without uric acid (green trace; Fig. 2C ) in a dose-dependent manner ( Fig. 2D ). The evoked currents gradually decreased upon the removal of urate solution. The currents then gradually returned to the baseline level. The obtained data indicated that the mGLUT9a specifically and electrogenically transported urate, rather than glucose. The failure of glucose to induce currents may be attributed to glucose being electrically neutral and to the lack of coupling between GLUT9 glucose transport and ion transport. Furthermore, the current traces were similar to those reported in a previous study conducted in oocytes. 27 The results showed that the Km value of urate transported by mGLUT9a was approximately 0.13 mM according to the rate of transport over a range of urate concentrations ( Fig. 2E ), which was similar to that observed in oocytes. 23 As shown in Figure 2F , the urate-induced currents of mGLUT9a were voltage dependent, and the magnitude of the outward current increased as the membrane potential became more positive (from −30 to +60 mV). These results were in accordance with the previous study conducted by Bibert et al. 17
Urate-Induced Currents through mGLUT9 are K+ and pH Dependent
We further characterized the GLUT9a currents by changing the concentrations of K+ and the pH values in the external solution. Figure 3A shows that the current density of the urate-induced currents through GLUT9 was largely reduced when external K+ was replaced with Cs+, 28 which was in accordance with previous studies by Anzai et al. 19 When the pH of the external solution was changed from 7.4 to 5.5, the current density of GLUT9a was significantly enhanced ( Fig. 3B ), which is in agreement with the results reported by Anzai et al. 19 These data further suggested that this cell model can be used to study GLUT9a properties or its inhibitors.
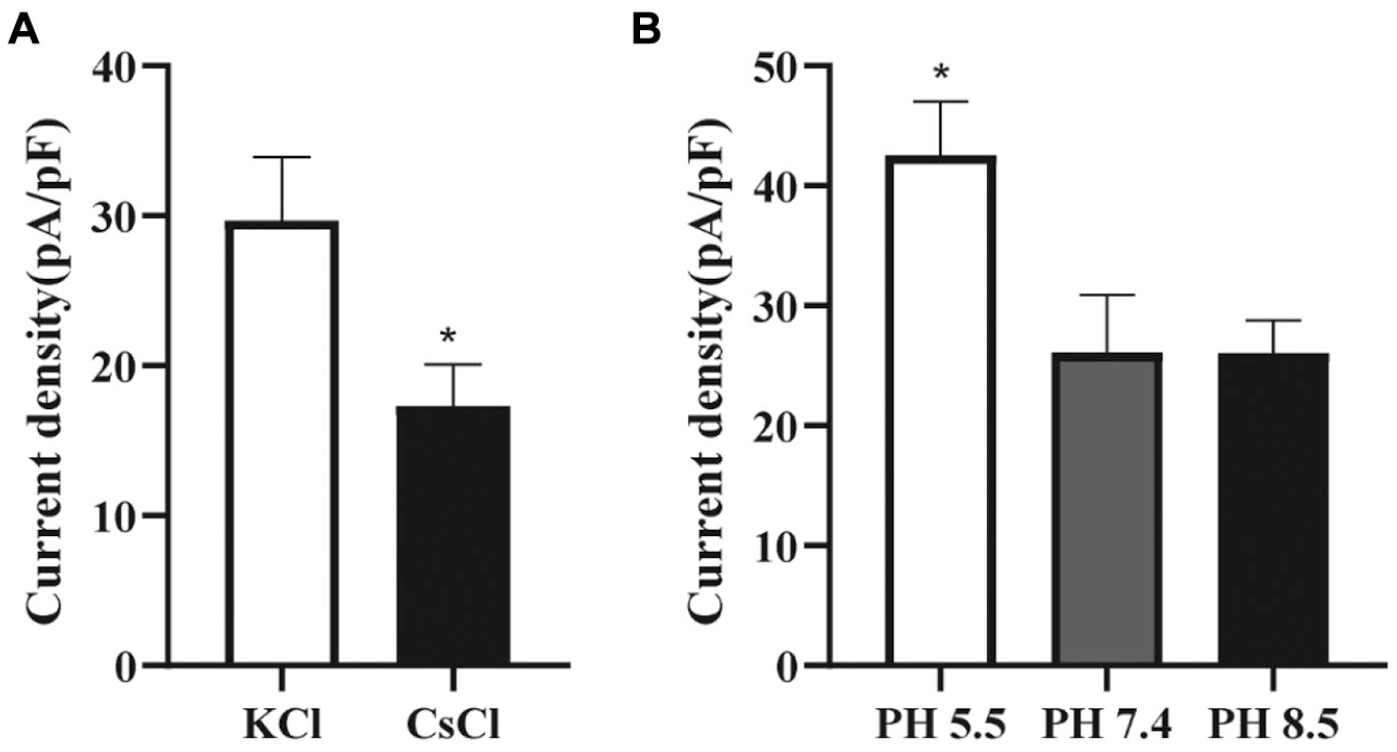
Characterizations of the urate transporter, GLUT9. (
Effects of BM, PB, 3170, and AP on mGLUT9 Currents
To investigate whether the established cell model could be used to study GLUT9 inhibitors, two well-known GLUT9 inhibitors (BM and PB) and two antihyperuricemic medications (3170, a potent and selective URAT1 inhibitor, and AP, an inhibitor of xanthine oxidase) as the negative controls were applied to the cell model. The original current traces with the addition of 1 mM uric acid in the presence (red) or absence (black) of BM (current changed from 400 pA to background value), PB (from 500 pA to 400 pA), 3170 (current not changed), and AP (current not changed) are shown in
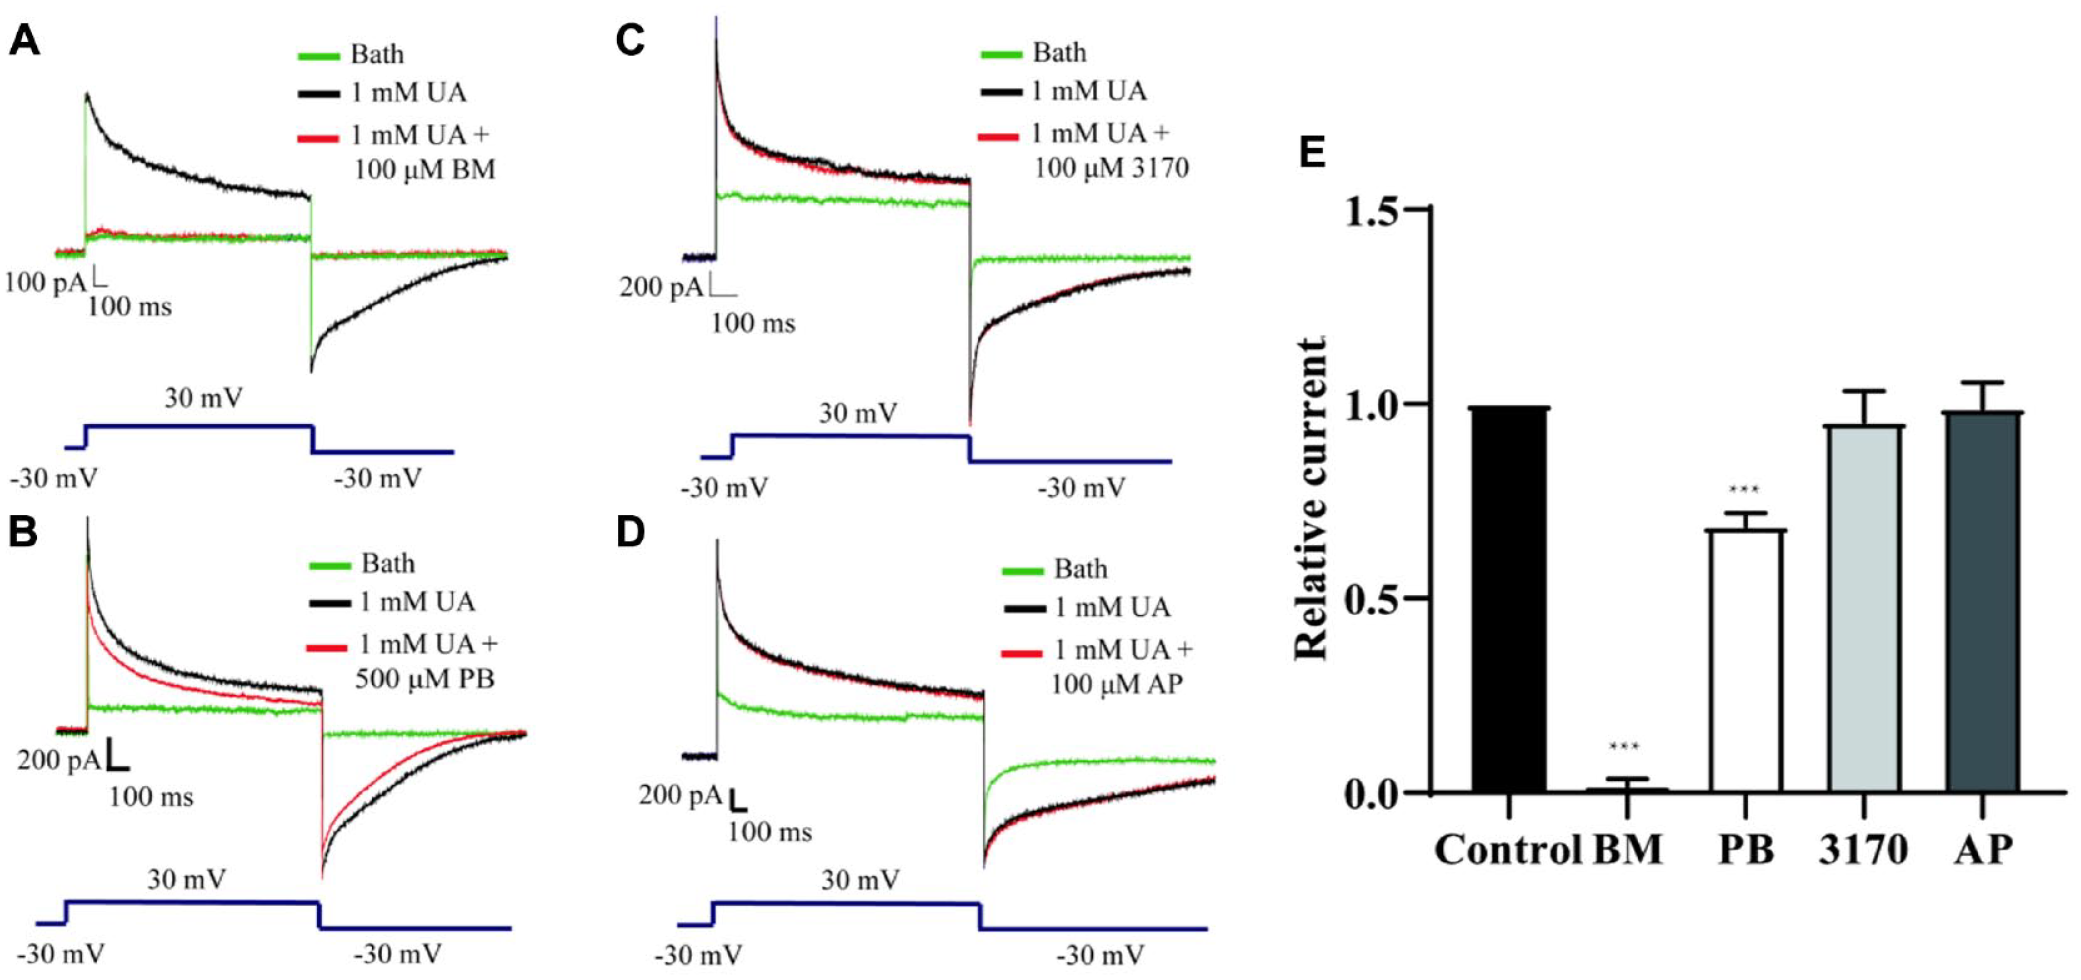
Effects of benzobromarone (BM), probenecid (PB), 3170, and allopurinol (AP) on urate-induced currents mediated by mGLUT9. (
Inhibitory Characteristics of BM and PB on Urate-Induced Currents through mGLUT9
To elucidate the molecular mechanisms of potent GLUT9 inhibitors, the inhibitory effects of BM and PB on mGLUT9 were studied. As shown in
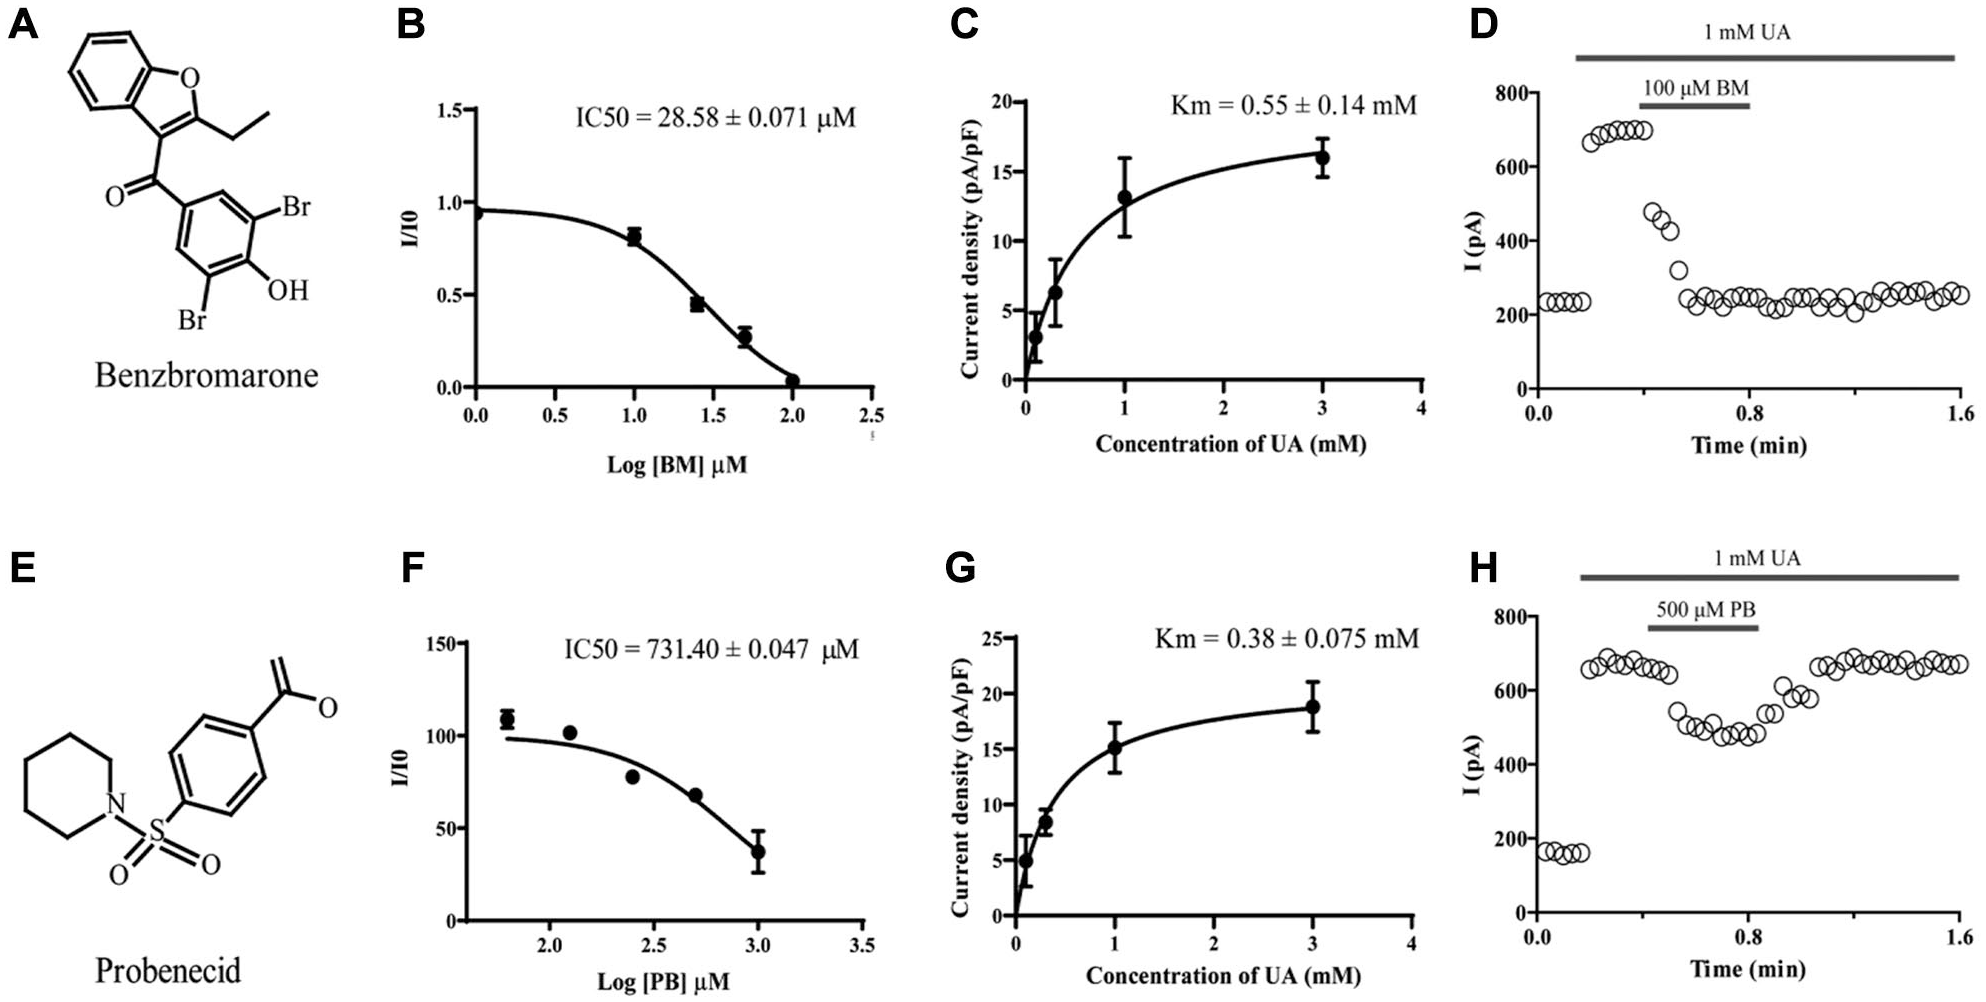
Inhibitory effects of benzobromarone (BM) and probenecid (PB) on mGLUT9. (
Measurements of the Urate Kinetics of GLUT9 in the Presence or Absence of BM and PB.
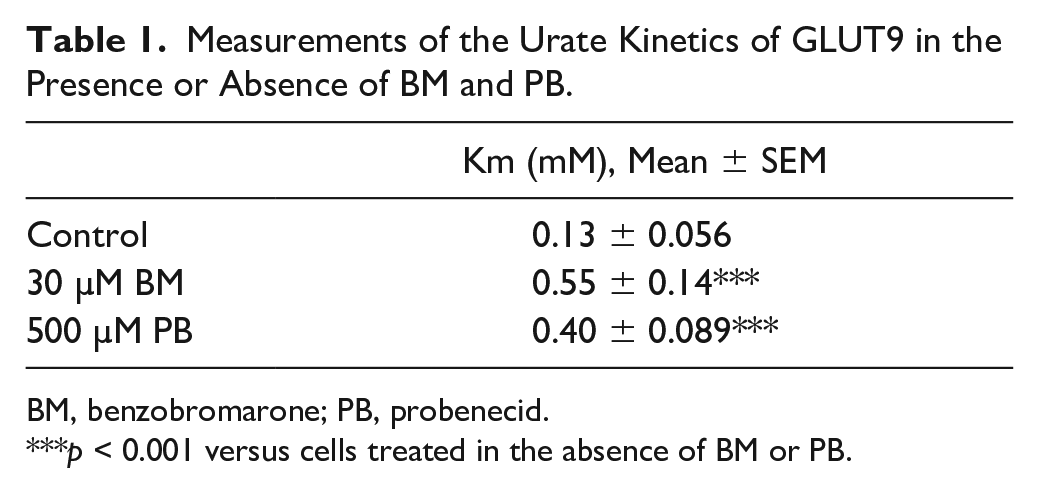
BM, benzobromarone; PB, probenecid.
p < 0.001 versus cells treated in the absence of BM or PB.
To determine the reversibility of urate transporter inhibition of BM and PB on mGLUT9a, HEK293T cells were perfused with BM or PM in a time course. When 100 µM BM was applied, the inhibitory effect of BM on GLUT9a-mediated currents remained unchanged, even after the removal of BM ( Fig. 5D ). The same experiments were performed for PB at the concentration of 500 µM, and inhibition of the currents was not observed after the removal of PB from the extracellular solution ( Fig. 5H ). These results indicated that PB reversibly inhibits mGLUT9a-mediated urate transport but that inhibition of urate-induced currents by BM is irreversible. As shown in Figure 5D , the inhibitory effect of BM on urate-induced currents was detected immediately upon the addition of BM, whereas PB inhibited the currents much more slowly than BM did. To further explore the ion conditions of the inhibitory effect of GLUT9 inhibitors, we investigated the inhibitory characteristics of BM on GLUT9 when the external K+ was replaced with Cs+. Figure 6A shows that the inhibitory effect of BM on GLUT9 currents was significantly enhanced, revealing that the BM-induced inhibition of GLUT9 might be closely related to the ion concentration difference across the cell membrane, as indicated by the replacement of external K+. When the pH of the external solution was changed from 7.4 or 8.5 to 5.5, the BM-mediated blockade of GLUT9 was enhanced ( Fig. 6B ), indicating that the blockade was pH dependent.
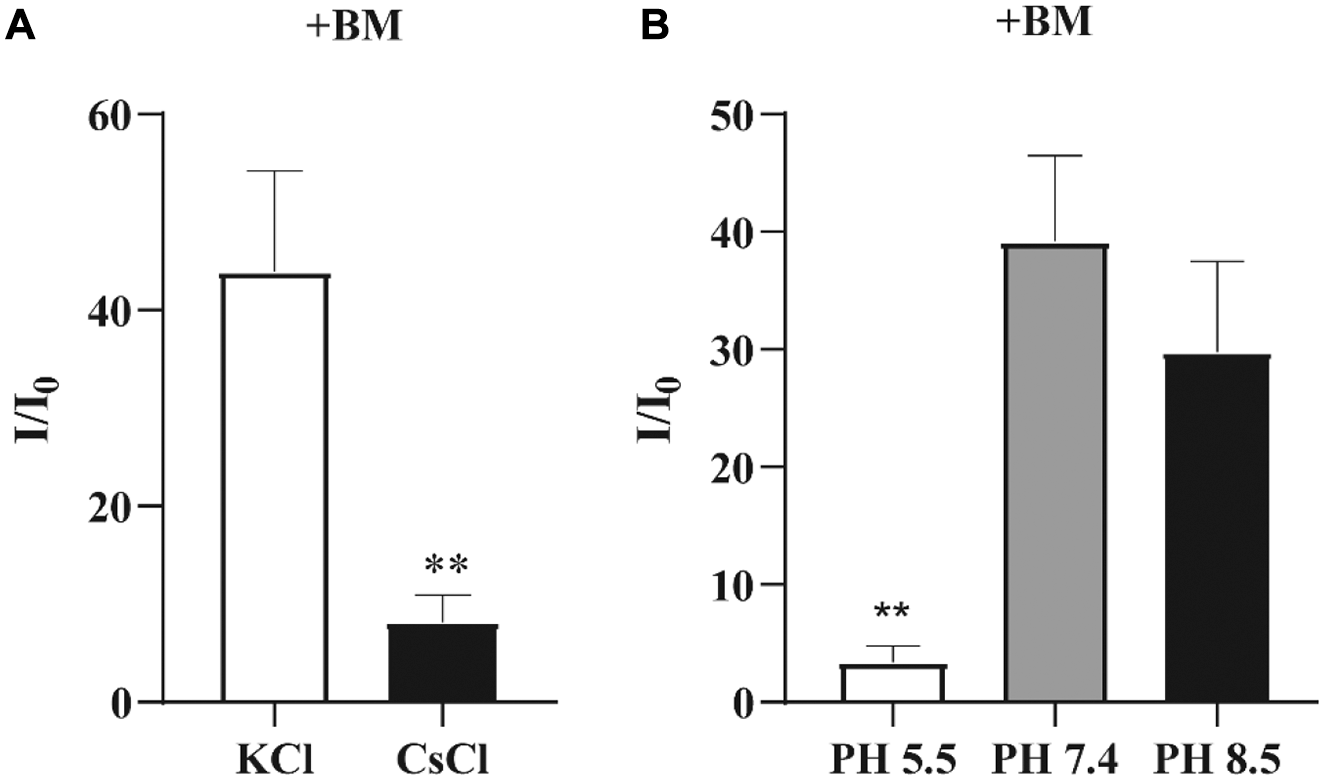
Effects of K+ depletion on the inhibitory effect of benzobromarone (BM) on mGLUT9 currents in different ion conditions. **p < 0.01 versus cells treated with the external solution with K+. (
Discussion
GLUT9, a member of the facilitative glucose transporter gene family (GLUTs), is responsible for exchanging both glucose and fructose. Recently, GLUT9 has gained attention for its essential role in the regulation of urate homeostasis. 24
In addition to GLUT9, URAT1, a transporter that is predominately located in the apical membrane of renal tubular epithelial cells, also plays an important role in urate homeostasis. However, previous studies have found that the urate transport ability of GLUT9-expressing cells is 31 times higher than that of the normal control group and 7 times higher than that of URAT1-expressing cells. 13 It has also been reported that uric acid excretion in patients with URAT1 deficiency ranges from 40% to 90%, which is higher than that in normal controls, and that patients with GLUT9 deficiency have higher uric acid excretion compared with normal controls, with a value reaching 150%, suggesting that GLUT9 plays a more important role in the reabsorption of uric acid than URAT1 did.13,30
Inhibition of GLUT9 may lead to reduced uric acid reabsorption and decreased serum uric acid levels. Therefore, GLUT9 may be a potential therapeutic target for the development of uricosuric agents. 31 Unfortunately, there are still no convenient and rapid methods to explore GLUT9 inhibitors for hyperuricemia. The most commonly used methods to study the activity of GLUT9 involve the [ 14 C]-urate uptake assay or the TEVC technique using the Xenopus laevis oocyte expression system.19,23–27 In the present study, we applied a patch clamp to test the condition inside the cells. This method is convenient because it allows changes to the condition on both sides of the membrane.32,33
GLUT9 has two splice variants, namely, GLUT9a and GLUT9b. However, GLUT9a and GLUT9b share identical functions regarding urate kinetics, as demonstrated by previous reports. 23 Therefore, we used mGLUT9a for our experiments. In addition, GLUT9a and GLUT9b are different only in their N-terminal sequence and location, with GLUT9a expression in the basolateral membrane and GLUT9b expression in the apical membrane. Similar to hGLUT9, mGLUT9 also has two isoforms. Therefore, mGLUT9a may share a similar specificity to hGLUT9a.
Urate transport by GLUT9 has been demonstrated to be electrogenic and voltage dependent.
19
In the present study, we first measured the urate- or glucose-evoked currents under the voltage-clamp conditions. As shown in
To further evaluate the applicability of the established cell model to study GLUT9 inhibitors, two well-known uricosuric agents, BM and PB, were applied. We investigated the inhibitory properties of BM and PB on GLUT9 transport and demonstrated that BM was a more potent GLUT9 inhibitor than PB. We first demonstrated that BM rapidly and prominently inhibited the urate-induced currents at concentrations of 30 µM and 100 µM. PB at a concentration of 500 µM induced only a slow and weak inhibition after perfusion. The reduction in the affinity of urate with GLUT9 was more obvious in the presence of BM than PB, indicating that BM might bind to more prominent residues in mGLUT9, thereby impairing uric acid transport by GLUT9. However, the lack of structural information on GLUT9 prevents further verification of this hypothesis. Furthermore, we found that the BM-mediated blockade of urate transport by mGLUT9 was not abrogated upon the removal of BM, suggesting that the interaction of BM and GLUT9 is not reversible. In contrast, this phenomenon was not observed after PB treatment. All of the above data indicated that BM inhibited mGLUT9 with a distinct mechanism from PB.
In conclusion, we successfully established a cell model by transfecting mGLUT9 into HEK293T cells, and we performed electrophysiological recordings to characterize the urate transporter, GLUT9, and its potent inhibitors using a patch-clamp technique. However, further studies should be conducted to explore the exact binding sites (residues) of BM and PB with GLUT9 to provide references for further design of uricosurics targeting GLUT9 based on the structures of BM and PB. We believe that the combination of the cell model with patch-clamp techniques will contribute to high-throughput screening of potent GLUT9 inhibitors.
Supplemental Material
Supplementary_Materials-revised_20200722_Cyy_edited – Supplemental material for Characterizations of the Urate Transporter, GLUT9, and Its Potent Inhibitors by Patch-Clamp Technique
Supplemental material, Supplementary_Materials-revised_20200722_Cyy_edited for Characterizations of the Urate Transporter, GLUT9, and Its Potent Inhibitors by Patch-Clamp Technique by Yanyu Chen, Zean Zhao, Yongmei Li, Lu Li, Yu Jiang, Ying Cao, Pingzheng Zhou, Ting Wu and Jianxin Pang in SLAS Discovery
Footnotes
Supplemental material is available online with this article.
Declaration of Conflicting Interests
The authors declared no potential conflicts of interest with respect to the research, authorship, and/or publication of this article.
Funding
The authors disclosed receipt of the following financial support for the research, authorship, and/or publication of this article: This work was supported by the National Science Foundation of China (grant Nos. 81974507 and 81773794).
References
Supplementary Material
Please find the following supplemental material available below.
For Open Access articles published under a Creative Commons License, all supplemental material carries the same license as the article it is associated with.
For non-Open Access articles published, all supplemental material carries a non-exclusive license, and permission requests for re-use of supplemental material or any part of supplemental material shall be sent directly to the copyright owner as specified in the copyright notice associated with the article.