
Abstract
The human trace amine-associated receptor 1 (hTAAR1) is a G protein-coupled receptor (GPCR) that is widely expressed in monoaminergic nuclei in the central nervous system and has therapeutic potential for multiple diseases, including drug addiction and schizophrenia. Thus, identification of novel hTAAR1 ligands is critical to advancing our knowledge of hTAAR1 function and to the development of therapeutics for a wide range of diseases. Herein we describe the development of a robust, 3-addition high-throughput screening (HTS) calcium mobilization assay using stable CHO-Gαq16-hTAAR1 cells, which functionally couple hTAAR1 to the promiscuous Gαq16 protein and thus allow signal transduction to occur through mobilization of internal calcium. Our previously established 96-well hTAAR1 assay was first miniaturized to the 384-well format and optimized to provide an assay with a Z′ factor of 0.84, which is indicative of a robust HTS assay. Using the 3-addition protocol, 22,000 compounds were screened and yielded a ~1% agonist hit rate and a ~0.2% antagonist hit rate. Of the antagonist hits, two confirmed hits are the most potent hTAAR1 antagonists identified to date (IC50 = 206 and 281 nM). While scientists have been studying hTAAR1 for years, the lack of suitable hTAAR1 antagonists has been a major roadblock for studying the basic pharmacology of hTAAR1. Thus, these new ligands will serve as valuable tools to study hTAAR1-mediated signaling mechanisms, therapeutic potential, and in vivo functions.
Keywords
Introduction
The human trace amine-associated receptor 1 (hTAAR1) belongs to a family of six aminergic G protein-coupled receptors (GPCRs) that interact with endogenous trace amines, such as β-phenethylamine (PEA), tryptamine, octopamine, and tyramine, which are structurally and metabolically related to the biogenic monoamine neurotransmitters dopamine (DA), serotonin (5-HT), and norepinephrine (NE).1–3 Pharmacologically, hTAAR1 is Gαs coupled and thereby stimulates intracellular cAMP production, but it also activates the β-arrestin-2 signaling cascade independently of G protein activation.1,2,4 TAAR1 is widely expressed in monoaminergic nuclei in the central nervous system (CNS), including the substantia nigra pars compacta (SNpc), ventral tegmental area (VTA), raphe nuclei, and locus ceruleus, and moderately expressed in the nucleus accumbens, dorsal striatum, amygdala, prefrontal cortex, and basal ganglia.1,5,6 Its high expression levels in dopaminergic and serotonergic brain regions make the receptor well positioned to regulate monoaminergic neurotransmission and thus play a significant role in a number of CNS diseases. 7
Multiple lines of evidence have illustrated the utility of hTAAR1 agonists as potential therapeutics for substance abuse disorders and schizophrenia because of their ability to modulate DAergic signaling in the CNS. For example, behavioral studies8,9 conducted with methamphetamine and cocaine in rodents showed that TAAR1 agonists blocked methamphetamine and cocaine self-administration,10–12 reduced methamphetamine-induced locomotor activity, 10 attenuated methamphetamine- and cocaine-stimulated hyperactivity,10,13,14 decreased cue-induced methamphetamine and cocaine reinstatement,11,15,16 and attenuated behavioral sensitization to methamphetamine and cocaine,11,16,17 but did not reduce development of cocaine-induced conditioned place preference (CPP). 16 The TAAR1 agonists used in these studies were not found to be reinforcing and therefore do not appear to have an abuse liability. Hoffman-LaRoche is developing a series of hTAAR1 agonist drug candidates targeting schizophrenia, such as the full agonist (S)-4-((S)-2-phenyl-butyl)-4,5-dihydro-oxazol-2-ylamine (RO5256390) 13 and the partial agonists (S)-4-(3-fluoro-2-methyl-phenyl)-4,5-dihydro-oxazol-2-ylamine (RO5263397) 18 and N-((1H-imidazol-4-yl)methyl)-4-chloro-N-isopropylaniline (RO5073012). 19 TAAR1 agonists tonically decrease mesolimbic DAergic activity and hyperactivity.6,20 Most classical antipsychotics are D2 antagonists that target DA pathways, including the mesolimbic system, so indirect reduction of activity using TAAR1 agonists might achieve the same results as D2 antagonists with fewer side effects. 21 TAAR1 agonists also appear to be potential therapeutics for other disorders, including mood disorders, cognition, metabolic disorders, obesity, and immune system regulation. 8
Therapeutically, many researchers initially believed TAAR1 antagonists would be better drug candidates than agonists, presumably because mechanistically blocking the effects of the endogenous trace amines, possibly resulting in hyperactive monoaminergic neurotransmission, was considered a plausible strategy for treating many CNS-related disorders. 8 This belief was heightened by the fact that drugs of abuse are agonists of TAAR1;2,22 therefore, TAAR1 agonists might be abused (undesired side effect), while TAAR1 antagonists might block some of the behavioral effects of these compounds, perhaps even reinforcement. However, increasing evidence shows that TAAR1 antagonists might have the opposite effect. Several studies have shown that TAAR1–/– mice have a hyper-DAergic phenotype seen as increased sensitivity to DAergic stimuli, increased DAergic neuronal firing, and overactive postsynaptic D2R transmission.6,20,23,24 Given this hyperactive DAergic phenotype, it is not surprising that TAAR1–/– mice exhibit enhanced locomotor activity in response to single and repeated administration of amphetamine and methamphetamine and acquired methamphetamine-induced CPP earlier compared with wild-type mice.25,26 These data suggest that TAAR1 antagonists would not be a good therapeutic strategy for treating hyperactive DAergic-related disorders, such as schizophrenia, or for treating substance use disorders (SUDs), but instead may be useful for hypo-DAergic disorders such as Parkinson’s disease.27–29
Collectively, all these studies demonstrate the significant impact TAAR1 has on a multitude of diseases, thus showing how critical it is for researchers to discover novel TAAR1 ligands that can be used as probes to study TAAR1’s unique pharmacology. Unfortunately, the discovery of TAAR1 ligands has yielded mixed results thus far. TAAR1 agonists have been readily identifiable (for a detailed review, see Gainetdinov et al. 7 ). The endogenous ligands of TAAR1 are biogenic trace amines, such as β-phenethylamine and tyramine, possessing the common phenethylamine privileged motif observed in many CNS-related ligands, particularly drugs of abuse. 30 It makes sense that screening libraries, especially ones targeting CNS receptors, would have ligands that bind to TAAR1 and that act as agonists. The primary issue with TAAR1 agonist ligand discovery has been selectivity over receptors with phenethylamine-containing endogenous ligands such as DA and noradrenergic receptors and transporters. The discovery of unique agonist lead scaffolds that can be developed into selective TAAR1 agonist drug candidates remains essential to novel agonist probe and drug development. This may be even more important when considering the possibility of biased TAAR1 agonist development. 4 On the other hand, the discovery of TAAR1 antagonists or inverse agonists has been surprisingly difficult. 31 To date, the only well-characterized TAAR1 antagonist is Hoffman-LaRoche’s compound, N-(3-ethoxyphenyl)-4-(pyrrolidin-1-yl)-3-trifluoromethylbenzamide (EPPTB), which is potent at mouse TAAR1 but not at human TAAR1, highlighting species selectivity issues. 32 The lack of antagonist ligands is curious and remains a major impediment to understanding the role of TAAR1 in the CNS.
Herein, we describe the development of a high-throughput screening (HTS) assay for hTAAR1 using the calcium mobilization platform, including the miniaturization of our previously established 96-well assay to a 384-well format. We also present results of a 22,000-compound screen using the optimized 384-well assay, including data for four confirmed compound hits (two agonists and two antagonists).
Materials and Methods
Materials
PEA was purchased from Sigma Aldrich (St. Louis, MO), and cell culture reagents were purchased from Fisher SSI (Oak Ridge, TN). Calcium 5 dye kits were purchased from Molecular Devices (Sunnyvale, CA). Consumables for screening were purchased from Phenix Research Products (Haywood, CA). The compound screening library was purchased from ChemBRIDGE (San Diego, CA). The stable CHO-Gαq16-hTAAR1 cells used for all studies reported herein were previously generated and validated by our laboratory in a 96-well format. 33
384-Well Z′-Factor Determination Using 3-Addition Protocol
Stable CHO-Gαq16-hTAAR1 cells were maintained at 37 °C, 5% CO2, in Ham’s F12 medium supplemented with 10% fetal bovine serum (FBS), 1× penicillin/streptomycin (P/S), 400 μg/mL G418, and 200 μg/mL hygromycin. The day before the assay, 7500 cells were plated in each well of a 384-well, black, clear-bottom polystyrene plate (Greiner) in a 30 μL total volume in Ham’s F12 medium supplemented with 1% FBS and 1× P/S using a MicroFlo Select dispenser fitted with a 5 µL cassette (BioTek). The cells were allowed to incubate overnight (12–16 h) at 37 °C, 5% CO2. The next day, Calcium 5 dye (Molecular Devices bulk kit) was reconstituted according to the manufacturer’s instructions and diluted 1:20 in prewarmed (37 °C) assay buffer (1× HBSS, 20 mM HEPES, 2.5 mM probenecid, pH 7.4 at 37 °C). Dye was added to the assay plate (30 μL volume), and the cells were incubated for 45 min at 37 °C, 5% CO2. During the incubation, two separate 384-well polypropylene compound plates were prepared. The agonist compound plate contained PEA (8-point concentration–response curve and bulk 10 μM concentration, both prepared at 10× the desired final concentration in 1% DMSO/assay buffer) and vehicle (1% DMSO/assay buffer). The antagonist compound plate contained PEA (8-point concentration–response curve, bulk 10 μM, and bulk EC80 [400 nM], all of which were prepared at 10× the desired final concentration in 1% DMSO/assay buffer) and vehicle (1% DMSO/assay buffer). After the dye-loading incubation period, 8.5 μL of 8% DMSO/assay buffer was added with the Biomek NX (addition-1). The assay plate and agonist compound plate were incubated for 15 min at 37 °C. After this incubation period, the assay plate was read with a Fluorescent Imaging Plate Reader (FLIPR) Tetra (Molecular Devices). Calcium-mediated changes in fluorescence were monitored every 1 s over a 60 s time period, with the Tetra adding 8.5 µL of material from the agonist compound plate (addition-2) at the 10 s time point (excitation at 470–495 nm, detection at 515–575 nm). The assay plate and antagonist compound plate were then incubated for 15 min at 37 °C, after which the plate was read again, with the Tetra adding 8.5 μL of material from the antagonist compound plate (addition-3) at the 10 s time point as described.
HTS of 22,000 Compounds
Ninety-six-well library daughter plates containing 1.3 μL of compound (10 mM in 100% DMSO) were compressed into 384-well plates, and the compounds were diluted to 10× the desired final concentration in assay buffer to yield a final DMSO concentration of 1% using the Biomek NX. Compound plates were heat sealed with an Agilent Technologies PlateLoc sealer and stored at −20 °C for no longer than 1 week. Columns 1, 2, 23, and 24 were left empty during the compression process for assay controls. All compound library plates were barcoded for tracking purposes; plate barcodes link compound identities in RTI International’s institutional database, ChemCart (DeltaSoft).
On each day of the primary screen, the compound plates were thawed, mixed, spun at 1,000 rpm for 3 min, and unsealed. Assay controls, consisting of a concentration–response curve of PEA, 10 µM PEA, PEA EC80 (400 nM), and 1% DMSO/assay buffer, were added to columns 1, 2, 23, and 24 of each plate, and each plate was kept at 37 °C as described. The assay was run and the data were collected as described for the Z′-factor experiments.
Compound hits were cherry-picked from the previously prepared library daughter plates using the Packard MultiPROBE IIEX. An 8-point concentration–response curve of each compound hit was prepared at 10× the desired final concentration in 1% DMSO/assay buffer by the MultiPROBE in 384-well polypropylene plates. The same controls used for the primary screen were added to columns 1, 2, 23, and 24. Plates were heat sealed and stored at 20 °C for no longer than 1 week. On the day of confirmatory analysis, the cherry-picked compound plates were thawed, mixed, spun at 1000 rpm for 3 min, and unsealed. The 3-addition protocol was run according to the standard procedure described.
96-Well Calcium Mobilization Assays for Confirmatory Analysis
Confirmed hits from the 384-well assay were purchased from ChemBRIDGE and further analyzed to obtain statistically relevant EC50 or IC50 values using the 96-well assay. The same stable CHO-Gαq16-hTAAR1 cells were plated in 96-well, black, clear-bottom polystyrene plates (Greiner) at 30,000 cells/well (100 μL volume) in Ham’s F12 supplemented with 10% FBS and 1× P/S on the day prior to the assay. After an overnight incubation at 37 °C, 5% CO2, Calcium 5 dye (Molecular Devices bulk kit) was reconstituted according to the manufacturer’s instructions and diluted 1:40 in prewarmed (37 °C) assay buffer (1× HBSS, 20 mM HEPES, 2.5 mM probenecid, pH 7.4 at 37 °C). The cells were washed with 100 μL of warm assay buffer, and the dye was added to the assay plate (200 μL volume). The dye-loaded cells were incubated for 45 min at 37 °C, 5% CO2.
For agonist (EC50) assays, serial dilutions of the test compounds were prepared at 10× the desired final concentration in 1% DMSO/assay buffer, aliquoted into polypropylene plates, and incubated for 15 min at 37 °C. After the dye-loading incubation period, the cells were pretreated with 25 µL of 9% DMSO/assay buffer and incubated for 15 min at 37 °C. After the pretreatment incubation period, the plate was read with a FLIPR Tetra (Molecular Devices). Calcium-mediated changes in fluorescence were monitored every 1 s over a 60 s time period, with the Tetra adding 25 µL of the test compounds at the 10 s time point (excitation at 470–495 nm, detection at 515–575 nm).
For antagonist (IC50) assays, the same procedure was followed except that cells were pretreated with test compound dilutions (prepared at 10× the desired final concentration in 9% DMSO/assay buffer) for 15 min and the Tetra added the PEA EC80 (200 nM, prepared at 10× in 1% DMSO/assay buffer).
For curve shift assays, the same procedure was followed except that cells were pretreated with a single concentration of antagonist (prepared at 10× the desired final concentration in 9% DMSO/assay buffer) for 15 min and the Tetra added the PEA 8-point concentration–response curve (prepared at 10× in 1% DMSO/assay buffer).
Data Analysis
Data were collected by the Tetra in ScreenWorks version 3.2 (Molecular Devices). The bias was subtracted on image 8, and the maximum–minimum relative fluorescence units (RFU) statistic was exported to Excel.
High-Throughput Screening
The Z′ factor 34 was calculated using the equation Z′ = 1 – [(3 × (SDpos + SDneg))/(meanpos – meanneg)], where SD is the standard deviation, PEA is the positive control, and 1% DMSO/buffer is the negative control. The signal-to-noise ratio (S/N) was calculated with the equation S/N = (meanpos – meanneg)/(SDneg), and the coefficient of variation (%CV) was calculated with the equation %CV = (SD/mean) × 100. 34 For the agonist HTS, the raw RFU for each compound was converted to %PEA Emax using the equation %Emax = (RFUcmpd/RFUPEA) × 100. For the antagonist HTS, the raw RFU for each compound was converted to %PEA EC80 inhibition using the equation % inhibition = [1 – (RFUcmpd/RFUPEA EC80)] × 100.
Confirmatory Assays
The log of compound concentration was plotted against the RFU. The data were fit to a three-parameter logistic curve to generate EC50 (concentration of test compound that produces half-maximal response) or IC50 (half-maximal inhibitory concentration) values using the equations Y = Bottom + (Top – Bottom)/(1 + 10^(LogEC50 − X)) or Y = Bottom + (Top – Bottom)/(1 + 10^(X − LogIC50)) (GraphPad Prism).
Curve Shift Assays
The data were fit to a three-parameter logistic curve to generate EC50 values using the equation Y = Bottom + (Top – Bottom)/(1 + 10^(LogEC50 − X)) (GraphPad Prism). Apparent Ke values were calculated using the equation Ke = [L]/((A′/A) – 1), where [L] is the concentration of antagonist, A′ is the EC50 value of PEA in the presence of antagonist, and A is the EC50 value of PEA in the absence of antagonist. Ke values were considered valid when the ER was at least 4.
Schild Plot
The curve shift assay data were used to determine log ((A′/A) – 1) values, which were plotted with the negative log of each corresponding antagonist concentration using a linear regression analysis (GraphPad Prism).
Results
384-Well Assay Miniaturization
The primary assay for this HTS campaign was previously developed by our group in a 96-well format. This assay utilized a stable CHO-Gαq16-hTAAR1 cell line that was engineered by overexpression of hTAAR1 in CHO-RD-HGA16 cells (Molecular Devices), which overexpress the promiscuous Gαq16 and thus allow signal transduction to occur through mobilization of internal calcium. 33 In order to conduct HTS for the hTAAR1 receptor, the current 96-well calcium mobilization assay required miniaturization to a 384-well format. For these studies, a final DMSO concentration of 1% was used. This concentration is necessary in order to screen libraries at 10 μM final concentration because RTI’s commercial compound libraries are supplied as 10 mM stocks in 100% DMSO. However, when the 96-well hTAAR1 calcium mobilization assay was originally established in 2006, the effect of DMSO on the PEA signal was tested, and it was found that 1% DMSO alone produced very large calcium-mediated changes in fluorescence (baseline RFU = 9926 for 1% DMSO, compared with 250 RFU for 0% DMSO). 33 Since then, our group has developed numerous calcium mobilization assays for multiple targets and found that pretreating cells for 15 min prior to compound addition and simultaneous data acquisition dramatically reduces the initial cellular response to DMSO.35–38 Thus, when this pretreatment protocol was applied to the hTAAR1 assay during the initial development stage, a concentration of 1% DMSO did not elevate the baseline (baseline RFU = 243 for 1% DMSO, compared with 250 RFU for 0% DMSO).
Next, cell density was examined to determine if decreasing the density fourfold from 30,000 cells/96 wells to 7500 cells/384 wells would cause a decrease in signal window. These studies were carried out by comparing the 96-well historical EC50 value and signal window with the values obtained in the 384-well format. We found that the assay’s performance was not critically affected by the transition from 96-well to 384-well format ( Fig. 1 ). With 7500 cells/well, PEA has an EC50 value of 151 nM in the 384-well assay, which is only 1.6-fold less potent compared to the 96-well assay (EC50 = 95 nM). The 384-well assay has a signal window of 9970 RFU, which is slightly larger than that of the 96-well assay (7510 RFU). Two other cell densities were examined (10,000 and 5000), but 10,000 cells/well resulted in overcrowding and an unhealthy appearance in the wells, while 5000 cells/well resulted in low confluency. These unfavorable appearances repeated after several plating experiments. Therefore, dividing the 96-well density by 4 resulted in the optimal density for the 384-well assay.
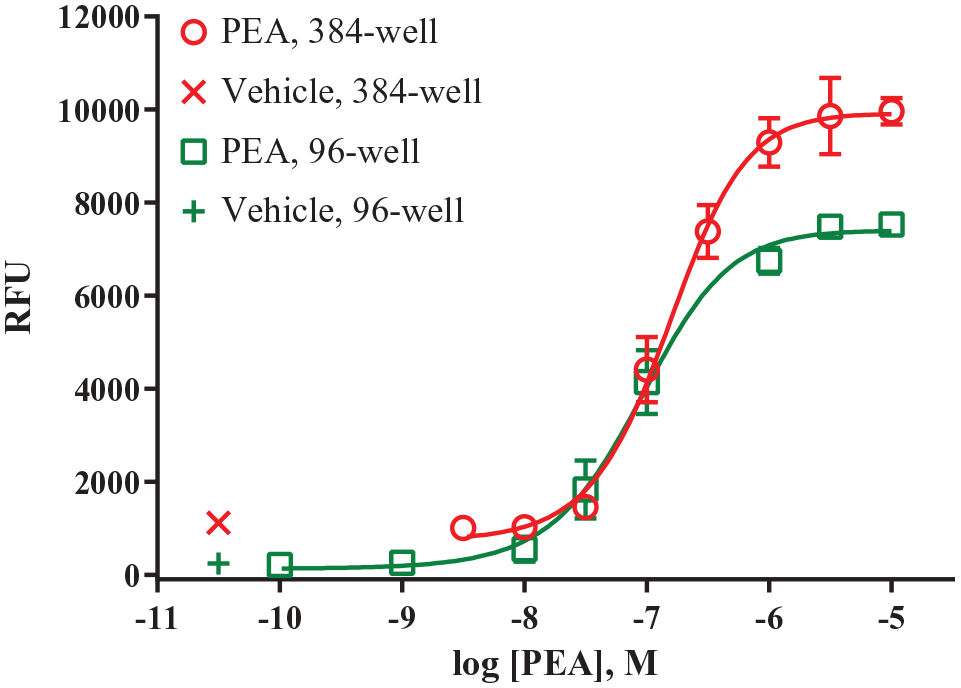
PEA response in 96-well and 384-well assays. A concentration–response curve of PEA was run in CHO-Gαq16-hTAAR1 cells in 96-well (30,000 cells/well) and 384-well (7500 cells/well) formats, as described in Materials and Methods. Each data point is the mean ± SEM of at least three independent experiments conducted in duplicate. These data show that the previously established 96-well hTAAR1 calcium mobilization assay is amenable to miniaturization.
With the positive data obtained from the initial miniaturization of the hTAAR1 assay, the incorporation of automated liquid handling equipment and the 3-addition protocol were examined. Cells were plated with a MicroFlo Select dispenser to determine whether automated cell dispensing caused changes in cell health. On the Biomek NX and the FLIPR Tetra, compound dispense heights and speeds were optimized to ensure proper dispensing without disturbing the cell monolayer. No adverse effects from including automation were noted in the assay’s performance, so the 3-addition protocol was tested next. This protocol was developed in our laboratory to allow for screening for both agonists and antagonists using the same assay plate, thereby decreasing the consumable cost and the time for screening by half. In this protocol ( Fig. 2 ), cells are plated in microplates and incubated overnight (step 1). A calcium-sensitive dye is then added to the cells (step 2), and after 45 min, the cells are pretreated with DMSO (step 3, addition-1). After 15 min, the FLIPR Tetra adds library test compounds to the cells while simultaneously reading fluorescence to screen for agonist activity (step 4, addition-2, agonist screen). The antagonist screen is then conducted by incubating the same assay plate, containing cells and test compounds, for another 15 min, after which the FLIPR Tetra adds a challenge concentration of PEA (EC80) to the cells while simultaneously reading fluorescence to screen for antagonist activity (step 5, addition-3, antagonist screen). In this assay protocol, agonists are detected by increases in fluorescence, while antagonists are detected by reductions in PEA-induced fluorescence. In both additions, wells containing 10 μM PEA and 1% DMSO/buffer are included to serve as positive and negative controls, respectively. Assay performance was measured by calculating three parameters (Z′ factor, S/B, and %CV) ( Suppl. Table S1 ). In general, a Z′ factor > 0.5, S/N of ≥10, and ≤10% CV are considered acceptable for a screening assay. 34 For our assay, the average Z′ factors (± SDs) for addition-2 and addition-3 across five days were 0.84 ± 0.09 and 0.79 ± 0.07, respectively. As shown in Figure 3 , there is a good separation of positive and negative control signals, and the data points cluster well together for both additions. The S/N values for addition-2 and addition-3 were 87 ± 15 and 253 ± 85, respectively, and the %CV values were 4 ± 3 and 6 ± 2, respectively. No major intraday and interday variations in the PEA potency were observed throughout the optimization process, as the PEA potencies from 30 plates (6 plates on each day for 5 individual days) clustered well around the initial 151 nM value obtained from the original miniaturization ( Suppl. Table S2 ). The three assay parameters fall within the acceptable ranges for HTS, and the inter-/intraday variability was low; therefore, the hTAAR1 assay was considered robust enough to proceed to screening.
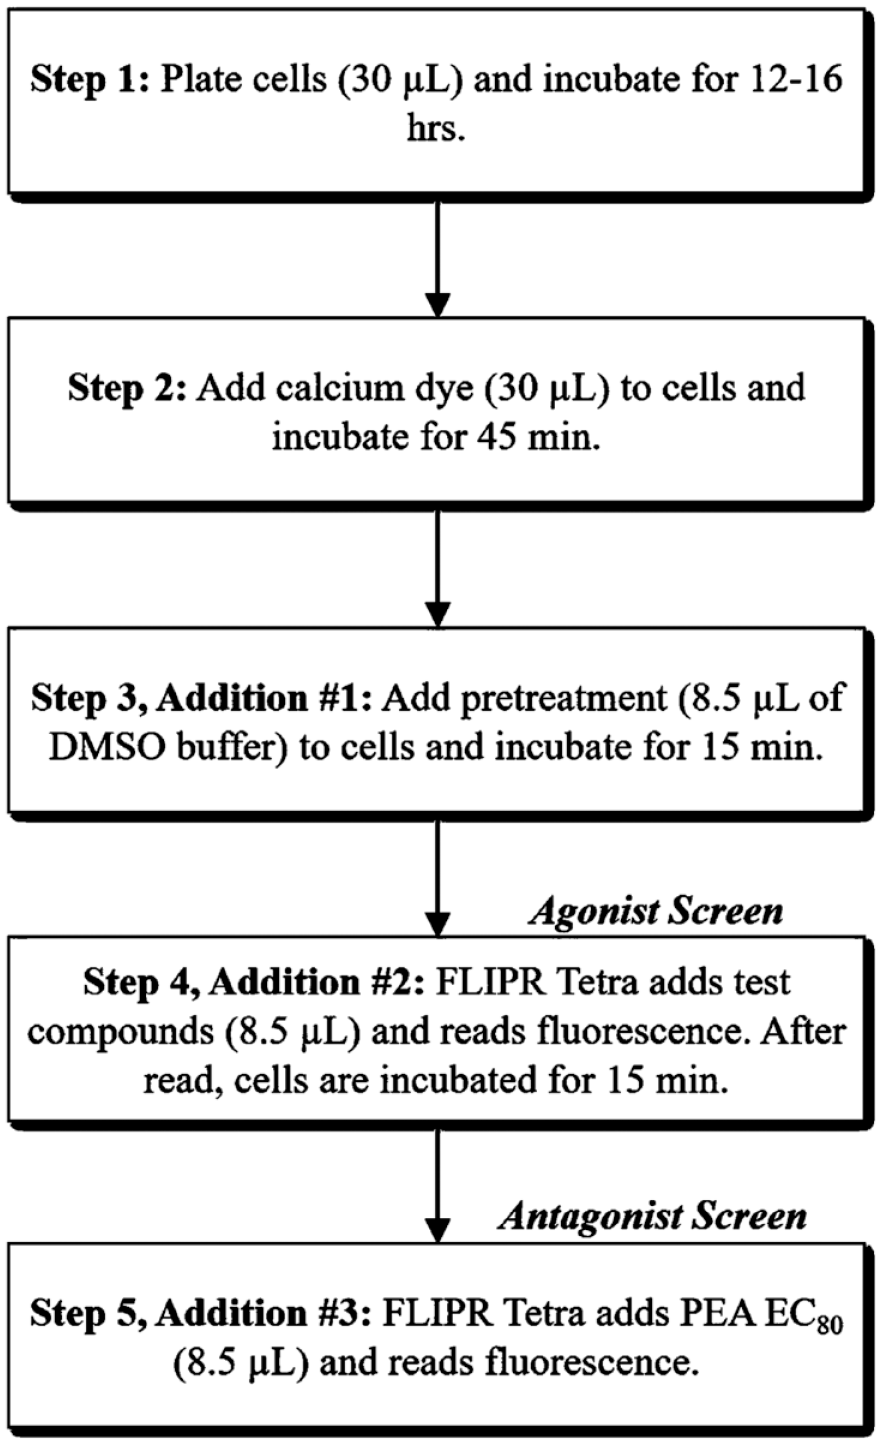
Flowchart depicting the 3-addition screening protocol used in this study. Each step of the screening process, along with the incubation time, is described.
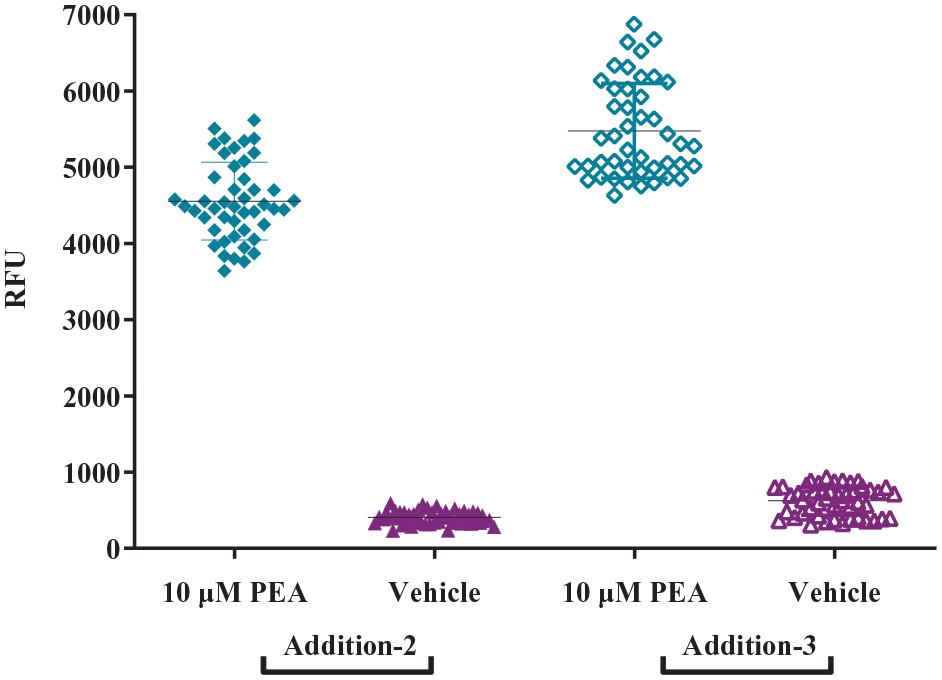
Z′ factor of 384-well assay. The Z′ factor was determined for the automated 384-well calcium mobilization assay by using 10 μM final PEA as the positive control and 1% final DMSO as the negative control on at least two plates each day for 5 individual days using the 3-addition protocol, as described in Materials and Methods. Representative data are shown, and each data point is the response from a single well on one plate. The average Z′ factors ± SDs for addition-2 and addition-3 across 5 days were 0.84 ± 0.09 and 0.79 ± 0.07, respectively.
The optimized hTAAR1 calcium mobilization assay was screened against RTI’s 22K ChemBRIDGE diversity library, which is a subset of both the ChemBRIDGE EXPRESS-PICK and CORE library stock collections. This library is composed of highly diverse scaffolds and was designed to provide lead compounds for new targets as well as enable in-house scaffold hopping. The content and properties of the diversity set were critically appraised for screening against GPCRs based on maximum diversity, optimal ADME parameters, novelty (minimal overlap with scaffolds found in known GPCR ligands and drugs), and pharmacophoric and fingerprint compliance with characteristics prototypical of GPCR ligands. Compounds were supplied in 96-well mother plates as 10 mM stocks in 100% DMSO. Prior to the primary screen, each mother plate was replicated into multiple daughter plates containing 1.3 μL of each library compound. These daughter plates were designed to be used once in order to minimize freeze–thaw cycles. Positive and negative controls were included on each assay plate to allow for tracking of the assay’s performance throughout the screen. Both agonist and antagonist screening data were collected and converted to %Emax and percent inhibition, respectively. As illustrated in Figure 4 , there is a good separation between positive and negative controls, and agonist hits clearly signal well outside of the ± 3× SD range. Figure 5 shows antagonist screening data from one assay plate. Despite the compound results having a larger spread compared with the agonist screening data, antagonist hits clearly signaled well outside of the ± 3× SD range. In this example, there are two pure antagonist hits (i.e., no agonist response seen in addition-2 of the process) and one false positive (i.e., compound that produced an agonist response in addition-2). The data were imported into RTI’s institutional database ChemCart, a web-based application that interfaces with RTI’s Oracle database, which is used to store, track, and retrieve chemical structures and assay results.
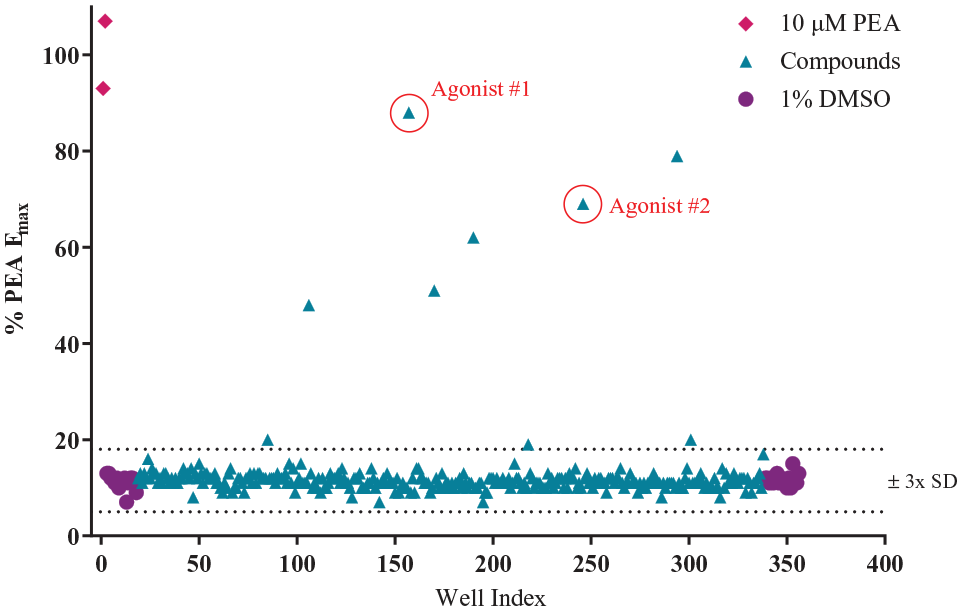
Scatterplot of agonist screen (addition-2). Each data point represents a single well on a single 384-well plate collected during the primary HTS, as described in Materials and Methods. PEA and 1% DMSO are included as positive and negative controls, respectively.
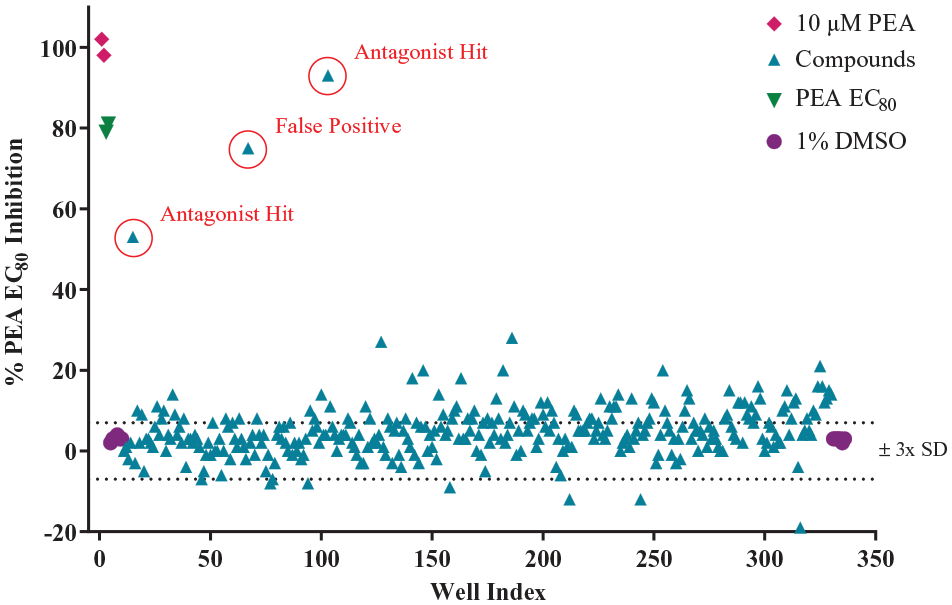
Scatterplot of antagonist screen (addition-3). Each data point represents a single well on a single 384-well plate collected during the primary HTS, as described in Materials and Methods. Compounds were screened against the PEA EC80 concentration; the data are presented as %PEA EC80 inhibition. The positive (10 µM PEA) and negative (1% DMSO) control data are reported as %PEA Emax in the plot. These controls were included on each screening plate.
The hit rate for the agonist portion of the HTS was ~1% (>40% PEA Emax), while the hit rate for the antagonist portion of the HTS was ~0.2% (>40% PEA EC80 inhibition). For the confirmatory analysis, agonists (222 compounds) and antagonists (38 compounds) were cherry-picked, and 8-point concentration–response curves were prepared using a MultiPROBE IIEX. Each compound curve was tested in singlicate in the hTAAR1 calcium mobilization assay.
Based on these confirmatory results, an initial selection of the most potent agonists (20 compounds) with confirmed activity was purchased in powder form from ChemBRIDGE and further tested in the 96-well calcium mobilization assay to obtain statistically relevant potency values (n = 3). These compounds were additionally tested in the CHO-Gαq16 parental cells to determine if any of the compounds elicited nonspecific calcium responses. Data from two of the more potent agonists are shown in Figure 6A . In this assay, the control PEA has an EC50 value of 57 nM. Agonists 1 and 2 had EC50 values of 314 and 1590 nM, respectively, which are 5.5-fold and 28-fold, respectively, less potent than PEA. At the highest concentration, agonists 1 and 2 had %PEA Emax values of 92% and 89%, respectively. In the primary HTS, agonists 1 and 2 signaled at 88% and 69%, respectively, of the PEA Emax value, indicating that the results obtained from the primary screen translate well to confirmatory results, thus further validating the usefulness of our HTS assay. In the CHO-Gαq16 parental cells, PEA did not elicit a response at any concentration tested, while both agonists elicited a very small response (~200 RFUs) at 10 μM only ( Suppl. Fig. S1 ). This response was deemed negligible compared with the response elicited in the hTAAR1 cells (~8000 RFUs).
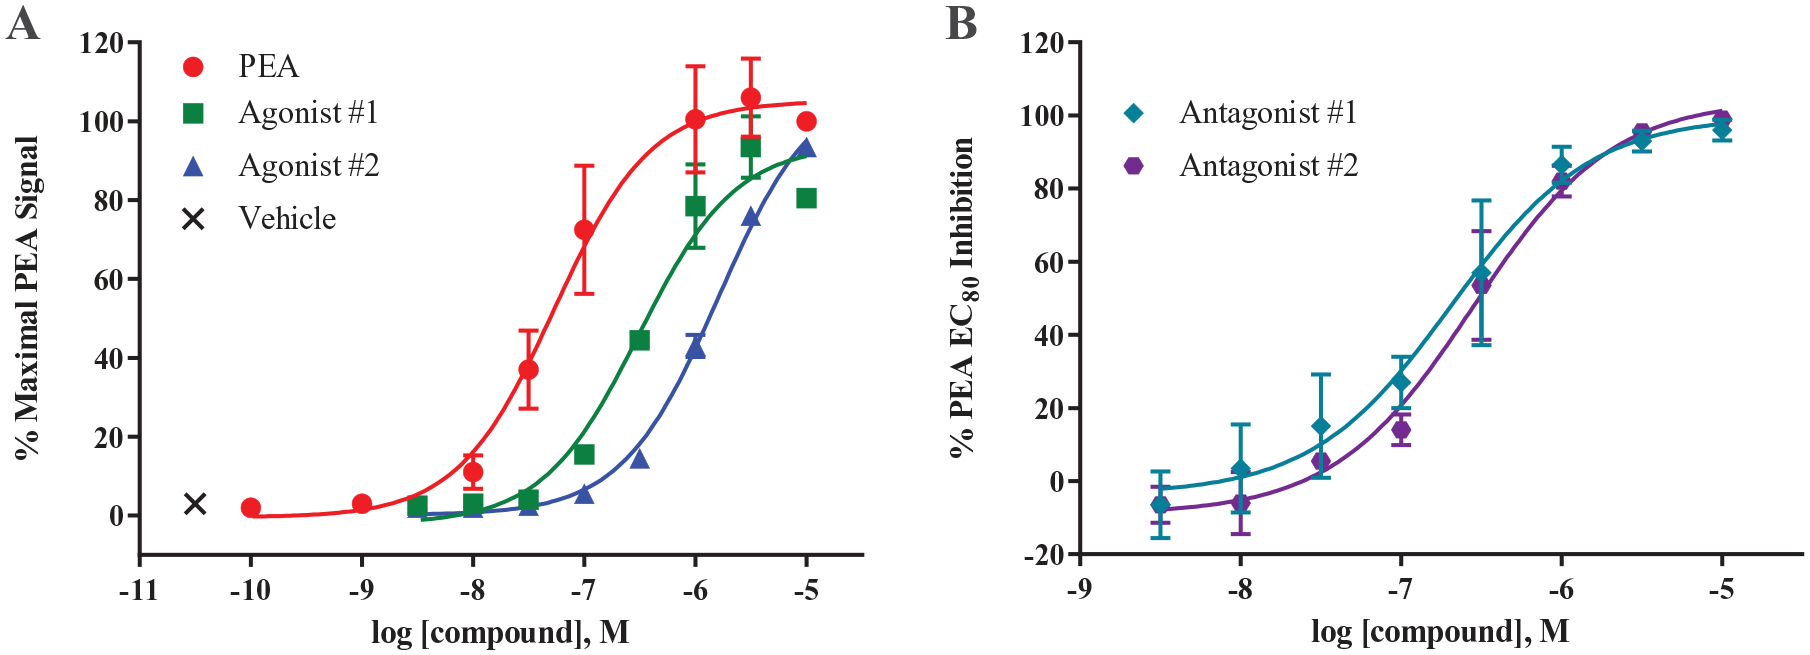
Response of two confirmed agonists and antagonists in CHO-Gαq16-hTAAR1 cells. (
The majority of the antagonist hits from the primary screen were not confirmed in the follow-up confirmatory assays; however, two compounds had potent activity. These compounds were unavailable from ChemBRIDGE; however, compounds in the same structural class as the initial hits were available, so we purchased the powders for both compounds and tested them in the hTAAR1 and parental cells, as we had done with the agonist powders. Figure 6B shows the data obtained with the two antagonists. Antagonist 1 has an IC50 value of 206 nM, and antagonist 2 has an IC50 value of 281 nM. At the highest concentration tested (10 µM), antagonists 1 and 2 have percent inhibition values of 96% and 99%, respectively. Both antagonists did not show hTAAR1 agonist activity at 10 µM final concentration or activity in CHO-Gαq16 parental cells ( Suppl. Fig. S2 ).
To further evaluate the antagonists, we calculated apparent Ke values by performing curve shift assays, which evaluate the ability of an antagonist to shift the control agonist concentration–response curve rightward. An 8-point concentration–response curve of PEA was tested in the presence of a single concentration of antagonist. Apparent Ke values were calculated using the equation Ke = [L]/((A′/A) – 1), where [L] is the concentration of test compound, A′ is the EC50 value of PEA in the presence of antagonist, and A is the EC50 value of PEA in the absence of antagonist.35,37,39–43 Ke values were considered valid when the ER was at least 4. In the curve shift assay, antagonist 1 has a Ke value of 110 nM, while antagonist 2 has a Ke value of 159 nM. The curve shift data were also subjected to a Schild analysis, 44 which showed that antagonists 1 and 2 have linear plots with slopes of −0.75 and −1.2, respectively, thus indicating that antagonist 1 may be noncompetitive, while antagonist 2 may be competitive ( Suppl. Fig. S3 ). These results are consistent with the Ke assay data ( Suppl. Fig. S4 ). Both antagonists shift the PEA curve rightward, but antagonist 1 causes a decrease in the PEA maximal response, while antagonist 2 does not. Our group has previously shown that in these Ke assays, a competitive antagonist will shift the control curve rightward without changing the maximal response, while a noncompetitive or insurmountable antagonist will shift the control curve and diminish the maximal response. 45
Discussion
Herein, we have described the development of a 384-well calcium mobilization-based hTAAR1 in vitro assay and its use in a 22,000 compound screen to identify novel agonists and antagonists. To the best of our knowledge, this is the first report describing HTS calcium mobilization-based assay development for this GPCR. Our previously established 96-well assay 33 was miniaturized and optimized to a 384-well format for HTS applications by testing multiple variables (cell density, automation, 3-addition protocol). Decreasing the cell density to accommodate the smaller well volumes of a 384-well plate and introducing automated liquid handling equipment to perform cell plating and assay additions did not adversely affect the assay’s performance. Applying our laboratory’s 3-addition calcium mobilization protocol to the hTAAR1 assay also did not affect performance. This 3-addition protocol allows for screening for both agonists and antagonists using the same assay plate, thereby decreasing the consumable cost and the time for screening by half. The fully optimized and automated assay had a Z′ factor (± SD) of 0.84 ± 0.09 and was deemed acceptable to proceed to the 22,000 compound HTS, which resulted in the identification of multiple, confirmed agonist and antagonist hits. These positive results illustrate the utility and applicability of our HTS assay.
This assay uses stable CHO-Gαq16-hTAAR1 cells to measure receptor activation via mobilization of internal calcium. Since the original report describing the development of this assay, 33 we further optimized the protocol to accommodate 1% DMSO without adversely affecting the assay’s performance by adding a preincubation with solvent, a practice now standard in our laboratory. With this current protocol, the 96-well PEA EC50 is 95 nM, which compares well (1.6-fold more potent) with the previously published PEA potency (EC50 = 160 nM), obtained from running the assay with 0.5% DMSO. 33 The 384-well PEA EC50 (151 nM) compares very well with the previous 96-well data. Other assays using either HEK293 cells or Cos7 cells report PEA EC50 values around 300 nM,1,3 thus potentially illustrating the improved sensitivity of our assay, although making comparisons across cell types and stable/transient cells can be difficult.
Through this HTS campaign, multiple hTAAR1 agonists were discovered with a range of potencies. Two agonists highlighted in this report are both less potent compared with PEA (5.5-fold and 28-fold) but have unique scaffolds compared with current agonists in the literature. Because the selectivity of TAAR1 agonists over receptors and transporters with phenethylamine-containing endogenous ligands, such as DA and NE, is an issue in advancing agonist lead compounds, the identification of unique hTAAR1 ligands that may lack those selectivity issues is promising. Our laboratory is currently investigating the selectivity of our newly identified hTAAR1 agonists in a panel of in vitro assays. While the identification of these agonists from our HTS is promising, the more groundbreaking discovery from this screen is the identification of two potent hTAAR1 antagonists with no agonist activity, which is a novel finding.
While a wide range of endogenous and synthetic hTAAR1 agonists have been identified over the years, the identification of hTAAR1 antagonists remains elusive. 8 Currently, the Hoffman-La Roche compound EPPTB remains the only well-characterized TAAR1 antagonist in the literature. EPPTB is a potent antagonist at mTAAR1 (IC50 = 27.5 nM) but is 165-fold and 272-fold less potent at rTAAR1 (IC50 = 4.5 μM) and hTAAR1 (IC50 = 7.5 μM), respectively. 27 While EPPTB has a desirable brain/plasma ratio of 0.5 and was successfully used in a variety of animal studies looking at DA neurotransmission, 27 it has a high clearance, which limits its use in vivo. 32 Further, there are questions as to whether EPPTB is an inverse agonist, as mTAAR1 cAMP studies revealed a potential inverse agonist activity profile. 27 These issues, along with its low potency at hTAAR1, limit the extent of research that can be performed with EPPTB.8,31 A few additional antagonists (Cmpd 3, ET-92, ET-78)46,47 have been identified in the literature, but none have been fully characterized and all suffer from potency issues (Cmpd 3: hTAAR1 IC50 = 9 µM, ET-92: rTAAR1 IC50 = 3 µM, ET-78: rTAAR1 IC50 = 4 µM). The discovery of our antagonists is groundbreaking, as our compounds are the most potent hTAAR1 antagonists identified to date (hTAAR1 IC50 = 206 and 281 nM). Initial Schild plots revealed that one antagonist appears to be competitive, while the other appears to be insurmountable. Further research into the mode of antagonism is ongoing, as we, along with other groups, have shown that insurmountable antagonism can also be the result of competitive orthosteric antagonists with slow dissociation rates.39,45,48
The human, rat, and mouse TAAR1 orthologs share a relatively low degree of homology (76% for human and mouse, 79% for human and rat, 87% for mouse and rat). 1 Therefore, the large potency differences observed for EPPTB at the human, rat, and mouse TAAR1 orthologs are not surprising. However, they do highlight the difficulty with the development of TAAR1 ligands, especially TAAR1 antagonists, because so few antagonist scaffolds have been identified. For example, compounds that are potent ligands of mTAAR1, but not hTAAR1, cannot be developed into therapeutics for humans because they lack the necessary potency. Similarly, compounds that are selective ligands of hTAAR1, but not mTAAR1, are difficult to develop because many of the vital preclinical efficacy assays are run in mice. These ligands would additionally be difficult to use as probes to study TAAR1 pharmacology because the necessary in vivo assays to elucidate TAAR1 pharmacology are performed in mice or rats. As illustrated with EPPTB, species differences with inverse agonists or antagonists can be quite dramatic, at times being several orders of magnitude different between species. Although species differentiations are also observed with TAAR1 agonists, they are not as extreme, and many scaffolds, including the Hoffman-LaRoche TAAR1 agonists, do not possess significantly different activity, which undoubtedly helped with their development.13,18,19 The discovery of TAAR1 antagonist scaffolds without large species differences would be ideal from a drug development pharmacological tool perspective.
Current efforts in our laboratory are focusing on structure–activity relationship (SAR) analyses of the unique agonist and antagonist scaffolds identified from our HTS. We are currently developing an hTAAR1 cAMP assay to measure activity of newly synthesized ligands. While our calcium mobilization-based HTS assay is capable of measuring hTAAR1 activation, the assay uses a promiscuous Gαq16 protein 49 that allows hTAAR1 signal transduction to occur through mobilization of internal calcium. The cAMP assay would measure hTAAR1 signal transduction through its native Gαs coupling and might also reveal ligand bias. Compounds will also be assessed for species differences using mTAAR1 and rTAAR1 assays, which are also under development.
In summary, we have developed a high-throughput 384-well hTAAR1 calcium mobilization assay using a 3-addition protocol that allows compounds to be screened as agonists and antagonists in a single plate, thus decreasing consumable and labor costs by half. This robust assay (Z′ factor > 0.80) was used to screen 22,000 novel compounds for activity; the screen resulted in several confirmed agonist and antagonist hits, which are currently undergoing SAR analyses in our laboratory. Two antagonist hits are the most potent hTAAR1 antagonists known to date. Because hTAAR1 plays a role in a number of physiological conditions, identification of novel agonists and antagonists for this unique receptor could aid in the development of therapeutics for diseases such as drug addiction, Parkinson’s disease, and schizophrenia. Further, having potent hTAAR1 antagonists would prove valuable to research on the basic pharmacology of hTAAR1 and its therapeutic potential.
Supplemental Material
Supplemental_Material_hTAAR1_HTS_Decker,__et_al – Supplemental material for Validation of a High-Throughput Calcium Mobilization Assay for the Human Trace Amine-Associated Receptor 1
Supplemental material, Supplemental_Material_hTAAR1_HTS_Decker,__et_al for Validation of a High-Throughput Calcium Mobilization Assay for the Human Trace Amine-Associated Receptor 1 by Ann M. Decker, Kelly M. Mathews, Bruce E. Blough and Brian P. Gilmour in SLAS Discovery
Footnotes
Acknowledgements
We would like to thank Ms. Tiffany Langston for valuable technical assistance.
Supplemental material is available online with this article.
Declaration of Conflicting Interests
The authors declared no potential conflicts of interest with respect to the research, authorship, and/or publication of this article.
Funding
The authors disclosed receipt of the following financial support for the research, authorship, and/or publication of this article: The work presented in this report was supported by an internal strategic investment fund provided by RTI International.
References
Supplementary Material
Please find the following supplemental material available below.
For Open Access articles published under a Creative Commons License, all supplemental material carries the same license as the article it is associated with.
For non-Open Access articles published, all supplemental material carries a non-exclusive license, and permission requests for re-use of supplemental material or any part of supplemental material shall be sent directly to the copyright owner as specified in the copyright notice associated with the article.