
Abstract
High-content screening to monitor disease-modifying phenotypes upon small-molecule addition has become an essential component of many drug and target discovery platforms. One of the most common phenotypic approaches, especially in the field of oncology research, is the assessment of cell viability. However, frequently used viability readouts employing metabolic proxy assays based on homogeneous colorimetric/fluorescent reagents are one-dimensional, provide limited information, and can in many cases yield conflicting or difficult-to-interpret results, leading to misinterpretation of data and wasted resources.The resurgence of high-content, phenotypic screening has significantly improved the quality and breadth of cell viability data, which can be obtained at the very earliest stages of drug and target discovery. Here, we describe a relatively inexpensive, high-throughput, high-content, multiparametric, fluorescent imaging protocol using a live-cell method of three fluorescent probes (Hoechst, Yo-Pro-3, and annexin V), that is amenable to the addition of further fluorophores. The protocol enables the accurate description and profiling of multiple cell death mechanisms, including apoptosis and necrosis, as well as accurate determination of compound IC50, and has been validated on a range of high-content imagers and image analysis software. To validate the protocol, we have used a small library of approximately 200 narrow-spectrum kinase inhibitors and clinically approved drugs. This fully developed, easy-to-use pipeline has subsequently been implemented in several academic screening facilities, yielding fast, flexible, and rich cell viability data for a range of early-stage high-throughput drug and target discovery programs.
Introduction
High-throughput screening (HTS) is an essential component of fully integrated drug and target discovery screening regimes, with high-content screening (HCS) becoming an increasingly important part of the discovery process, from early-stage development and screening to hit validation and candidate selection. 1 Cell-based HCS provides data-rich, physiologically relevant information that has proven to be a powerful tool in the search for high-quality small-molecule leads. 2 The power of HCS originates from the fact that cell imaging, using multiplexed fluorescent probes targeting distinct cellular structures or events, allows characterization of complex phenotypes that are directly relevant to disease pathology, including cell stress pathways and cell death induction. HCS can also facilitate early absorption, distribution, metabolism, and excretion–toxicity (ADMET) profiling, as well as target the prediction of a novel candidate molecules. 3
In the context of oncology screening, correctly assessing cell viability and determining mechanisms of cell death is critically important. Standard methods of assessing cell viability commonly utilize metabolic proxy assays including tetrazolium-based assays (e.g., MTT) and resazurin or total protein assays, such as streptavidin-based systems (SBSs). 4 Although easy to set up and inexpensive, such readouts are limited, providing only a simplistic, one-dimensional readout of complex, heterogeneous cell populations that fails to accurately reflect a comprehensive range of potential cellular phenotypes, including the induction of quiescence, senescence, cellular stress, and cell death mechanisms. Because they do not provide detailed information on the mechanism of action, they often produce misleading or invalid data, which can consume considerable time and resources validating spurious primary screening results.
Additionally, these assays are often susceptible to environmental factors including cell density, nutrient availability in growth media, pH, compound–substrate interactions, toxicity, constraints of reagent turnover, refeeding, and multiple read points over long-ranging assays, which can diminish their utility and physiological relevance. In our experience, and the experience of others, 5 -7 these factors require significant validation, especially when investigating metabolic or radiotherapeutic targets for cancer therapy where mutations in mitochondrial DNA, dysfunctional metabolic enzymes, and deregulated gene expression leading to altered 8 metabolic function can severely compromise metabolic proxy assays that monitor metabolic activity via oxidative phosphorylation (OXPHOS).
Because of the limitations of homogenous, metabolic proxy assays, especially in the field of oncology-based screening, we initiated the development of a high-throughput/high-content assay with the goal of measuring cell viability and proliferation while simultaneously investigating cell death mechanisms. Several HCS methods exist, ranging from the very powerful “Cell Painting” technique 9 for morphological profiling of small compounds, functional pathway grouping, and identification of signatures of disease, to simpler protocols using two fluorophores to monitor cell viability mechanisms. 10 While Cell Painting requires significant downstream data evaluation efforts, simpler methods do not have the capacity to measure cell viability and proliferation while simultaneously investigating cell death mechanisms, in a cost-effective manner, as a live-cell protocol.
Here, we describe a fast, flexible, and relatively inexpensive multiplexed HTS protocol employing the simplicity of an add-mix-read three-stain multiparametric method. This optimized high-content imaging (HCI)-based method avoids many of the issues observed in metabolic proxy assays, including potential artifacts generated by compromised metabolic pathways in cancer cell models, by providing direct single-cell analysis. We have validated the protocol against several cancer cell lines of different tissue origin using an FDA-approved oncology drug panel comprising a range of mechanisms of action as well as a small library of kinase inhibitors. The protocol produces a robust and reproducible high-content readout for cell viability across different cancer cell lines while simultaneously profiling heterogeneous cell populations for small-molecule induced toxicity mechanisms, including apoptosis at the early induction phase or late stage, and necrosis. Further flexibility is offered in this protocol as additional fluorophores or expression vectors can be added in the available spectrum (
Materials and Methods
Compound Library Preparation
The compound stocks of an FDA-approved oncology small-compound library, containing 101 compounds representing a range of mechanisms of action (
Cell Screening Liquid Handling Protocol
HeLa and AGP-01 cells were plated at a density of 600 (24 and 48 h time points) or 300 (72 h time point) cells/well, while MDA-MB-231 cells were plated at a density of 2000 (24 and 48 h time points) or 1000 (72 h time point) cells/well. PANC-1 cells were plated at a density of 500 cells/well. For all cell lines, cell seeding densities were optimized to achieve 70% confluence at the endpoint/readout for both 96- and 384-well plates to permit optimum cell segmentation for analysis. Cells were plated in a volume of 55 µL of culture medium/well in 384-well flat-bottom plates (CellCarrier; PerkinElmer) and incubated for 24 h prior to the addition of 5 µL of compound, using a Janus MDT automated liquid handler (PerkinElmer). For PANC-1 cells, the compound was directly transferred to the individual wells using an Echo acoustic dispenser. Cells were incubated with compound at 37 °C at concentrations of 10–0.9 μM for 24, 48, and 72 h prior to staining and experiment evaluation. The compound library contained compounds with varied mechanisms of action. As such, endpoints/readouts at 24, 48, and 72 h were selected for all compounds and cell lines to capture both rapid and slow-onset cell death mechanisms.
To minimize the effect of DMSO toxicity, a final concentration of 0.05% DMSO was used, which showed little to no effect on cell proliferation. 11 Control wells containing no DMSO and 0.05% DMSO were included in all plates and used for normalization of the data, thus providing an internal control for DMSO sensitivity of the cells. DMSO concentration was the same for all wells, independent of the concentration.
HighVia Labeling Protocol
To retain all cells for imaging, including loosely adherent and floating cells, plates were centrifuged at 400g/3 min, and 20 µL media was removed at an aspiration rate of 3 μL/s without disturbing the monolayer and replaced with 20 μL/well staining media (Hoechst 33342, 1 μM; Yo-Pro-3, 1 μM; and annexin V Alexa 488, 0.3 μL/well diluted in complete media) (excitation [Ex] and emission [Em] in
Resazurin Whole-Well Viability Assay
Following HCI, staining media was removed without disturbing the monolayer and replaced with 50 µL of resazurin (10 ng/mL; Sigma) in phenol-free media. Plates were incubated for 2 h at 37 °C, prior to fluorescent reading on an Envision multiformat plate reader (PerkinElmer) at Ex 579 nm/Em 584 nm for comparison between cell viability protocols.
Fluorescent Image Acquisition
Operetta (PerkinElmer)
Image acquisition was performed using a 10× air objective, collecting two fields per well: digital phase contrast, 25 ms, transmitted light at 50%; brightfield, transmitted light at 50%; Hoechst, 35 ms exposure, Ex 360–400 nm/Em 410–480 nm; annexin V Alexa 488, 45 ms exposure, Ex 460–490 nm/Em 500–550 nm; and Yo-Pro-3, 35 ms exposure, Ex 560–580 nm/Em 650–760 nm.
IN Cell Analyzer 6000 (GE)
Image acquisition was performed, using a 20× 0.45NA plan Fluor ELWD air objective, collecting four fields of view and the following settings (excitation laser followed by emission filter and exposure time): Hoechst staining, UV_DAPI 500 ms; annexin V Alexa 488, Blue_FITC 1500 ms; and Yo-Pro-3, Red_Cy5 1000 ms and TL_Brightfield_DsRed 800 ms.
CQ1 (Yokogawa)
Image acquisition of one field per well was performed using a 10× dry microscope (UPLSAPO10). The following parameters were used: for brightfield images, transmitted light at 70%, 50 ms exposure; for Hoechst staining, Ex 405 nm at 50%, Em 447/60, exposure 100 ms; for annexin V Alexa 488 staining, Ex 488 nm at 40%, Em 525/50, exposure 50 ms; and for Yo-Pro-3 staining, Ex 561 nm at 40%, Em 617/73, exposure 100 ms.
The expected throughput for 384-well-format whole-well homogenous readouts of cell viability employing high-throughput four-camera high-content imagers can be 45–60 min/plate.
Fluorescent Image Segmentation
Full details of image segmentation are described in
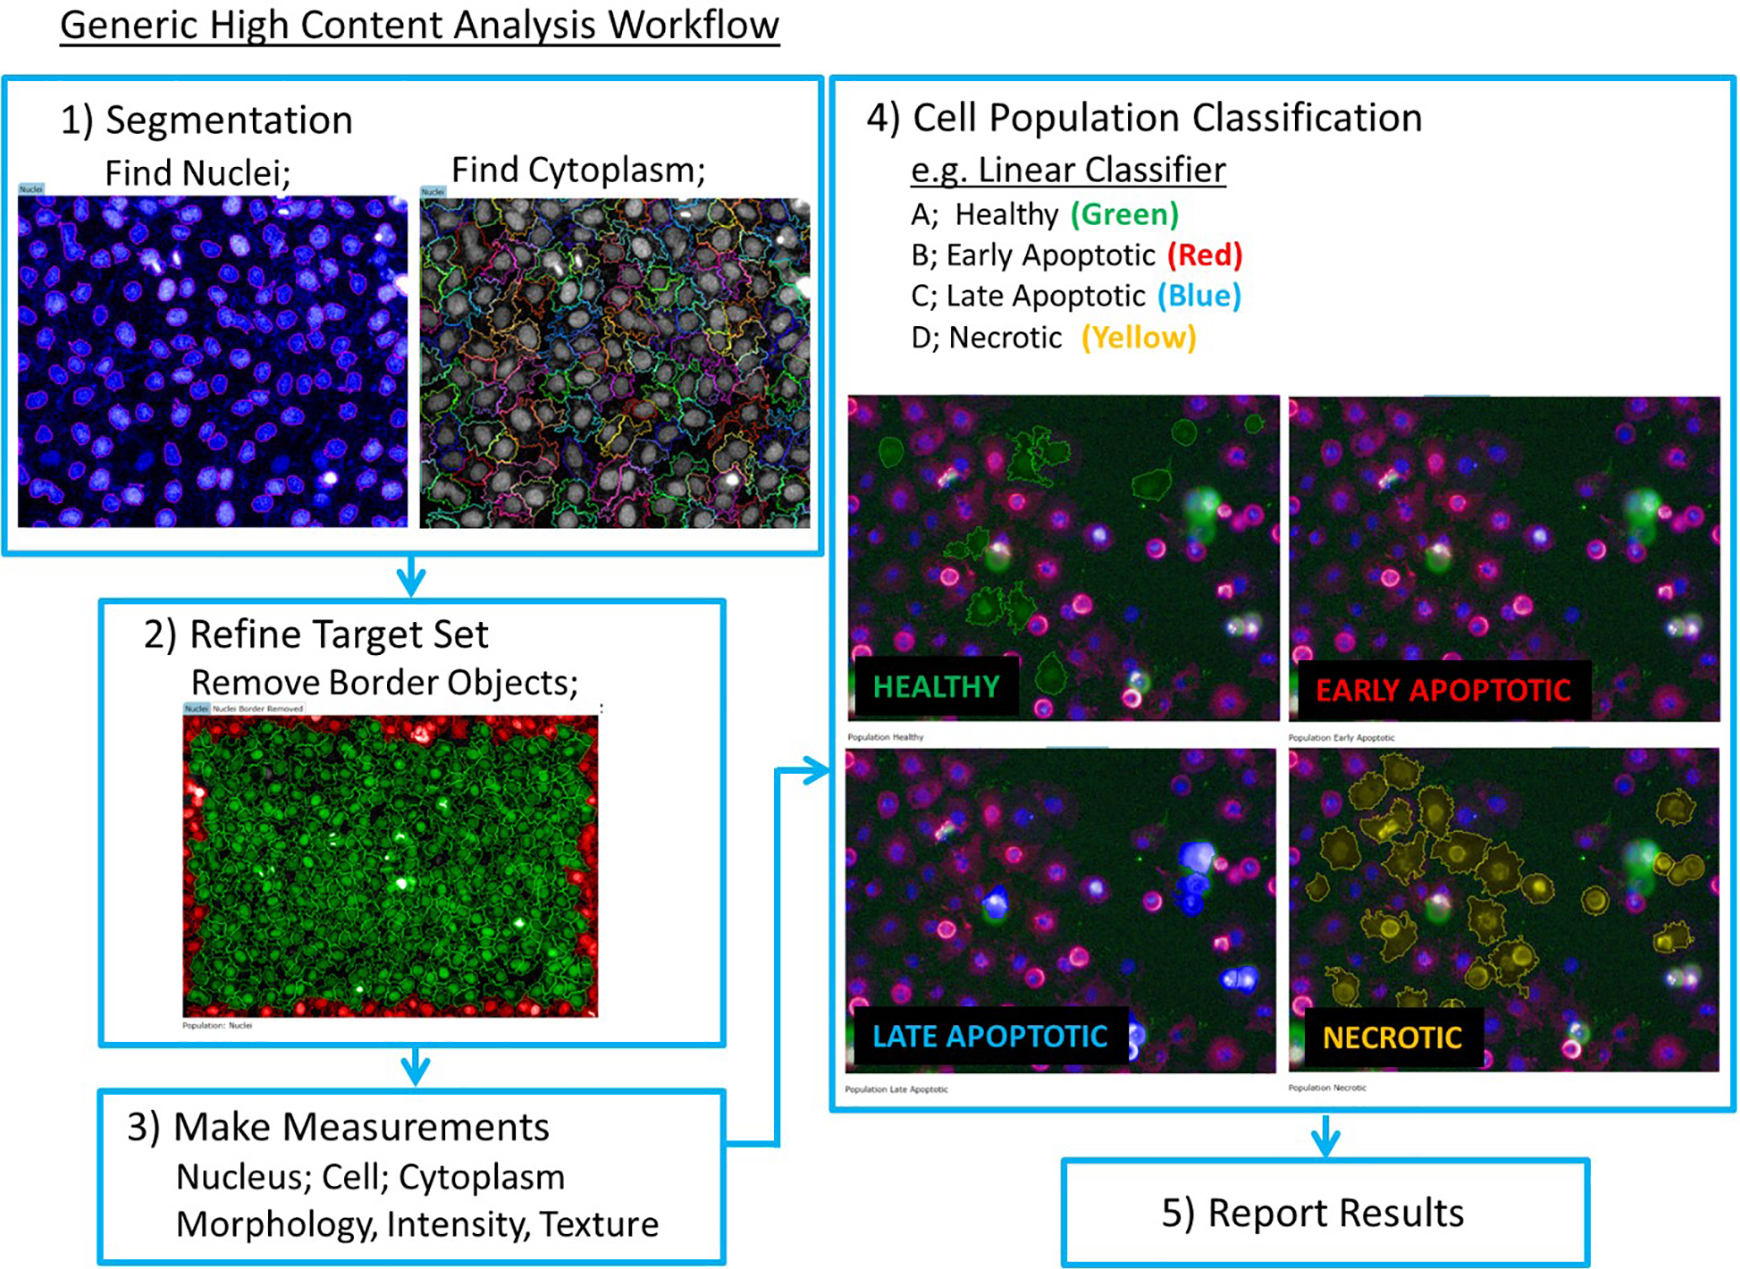
Generic workflow for high-content image segmentation.
Cytoplasmic regions were determined using previously defined “nuclei” (Hoechst) as the starting point; the region “cytoplasm” must be linked to defined nuclei to be detected. It is critical to define the cytoplasm region surrounding defined nuclei with high confidence at this stage.
These image analysis steps create three distinct cell regions for analysis: “nuclei,” “cytoplasm,” and “cell,” respectively. A fourth region of “nuclei border eroded” was created, comprising the “nuclei” region with a 5% erosion from the outer border, providing increased confidence in selecting features within the nuclei region.
Any cells with nuclei on the image border were removed from analysis to ensure that only whole cells were analyzed. For each of the four regions, “nuclei,” “cytoplasm,” “cell,” and “nuclei border eroded,” a comprehensive list of measurements were collected: morphology (e.g., area and roundness), intensity (e.g., mean intensity and standard deviation of intensity within the object), and texture (e.g., SER features—spots, edges, and ridges).
Classification of Cell Death Modalities
To enable automated and robust identification of different cell death modalities, three techniques were employed; the first was a simple gating/decision tree protocol using intensity and morphology features, the second a machine learning linear classifier called PhenoLOGIC (PerkinElmer), and the third a supervised classification. The linear classifier and supervised classification techniques employ user-defined cell population annotation to allow each software package to combine the most meaningful parameters to achieve accurate classification of cells. Three techniques enable the end user to evaluate each classification technique and adopt or modify the technique most suitable for their application. A detailed discussion of each technique is found below.
Data Analysis and Statistics
Using HCI data and resazurin, a concentration at which 50% growth inhibition (IC50) occurred was calculated for each cell line in GraphPad Prism 5 (La Jolla, CA) and displayed as the percentage of healthy cells within the population. Statistical significance was calculated in GraphPad Prism using an unpaired t test. Any p values of ≤0.05 were considered statistically significant.
Results and Discussion
Development and Optimization of Live-Cell HCI Assay, HighVia
Cell death is a highly complex, dynamic process influenced and induced by multiple pathways with a high degree of molecular cross-talk. 12 An effective means for determining cellular response to small-molecule treatment is through HCI, which allows image capture at multiple drug concentrations and time points, combining features of multiple viability assessments in a single well, rather than “single-take,” late-stage, static readout viability assays. The early application of an HCI protocol in cell viability screening allows rapid profiling of known and unknown compounds and offers an early-stage, robust validation step for candidate selection whereby ineffective or off-target toxic compounds may be rapidly de-selected. Large primary screens can routinely employ small compound libraries of >500,000 compounds, even in the academic screening setting, 13 often yielding several hundred positive “hits.” HCI is one way to help sort through and prioritize a hit list from an HTS. HCI can also be used in lead optimization programs to further understand the mechanism of action of key compounds. HCI is being applied in the late stages of discovery programs to ensure that drug candidate molecules do not have inappropriate toxicities or surprising unwanted effects.
It is from this context of broad-scale utility that we sought to implement a robust, easy-to-use, and information-rich HCI protocol. To construct a high-content, multiparametric, fluorescent imaging protocol capable of profiling multiple cellular mechanisms in the same well, it was critical to consider cost, efficiency, throughput, and, above all, optimization of extracting the maximum information available per well.
The first step of our protocol involved mapping the available excitation and emission spectra using Spectra Viewer
14
to the filter sets available in the PerkinElmer Operetta (
Critical to the staining protocol was accurate segmentation of nuclei and cell membrane using live-cell stains. Hoechst was selected to stain nuclei at the outset. To determine necrotic cells, Yo-Pro-3 was used, which is impermeable to cells with intact nuclear membranes. This provided a two-color fluorescent readout to determine dead or live cells but lacked the required sensitivity to discriminate more subtle cell death mechanisms.
To accurately segment the cellular membrane, Life Technologies CellTracker Green CMFDA and CellTracker Violet BMQC CellTrace CFSE (Green) Cell Proliferation Kit and CellTrace Violet Cell Proliferation Kit were explored. Both dyes permeate the cell membrane and are cleaved to a cell-impermeable fluorescent product. CellTrace offers a more brilliant signal than CellTracker, although both produce single-peak fluorescence and are highly suited to multiplexing. We found that the staining was very weak in serum containing media and exhibited high background after staining, requiring media changes before and after staining. For these reasons, CellTracker and CellTrace were excluded from use in the staining set. Instead, by simply increasing the incubation time with Hoechst from 1 to 2 h, we were able to accurately segment both the nuclei and external membrane using intensity thresholding, rendering the need for a specific, and costly, cytoplasm staining dye unnecessary.
Next, we began to investigate dyes specific to apoptosis. Caspase and phosphotidylserine (PS) directed dyes are most commonly used and available as no-wash, live-cell dyes. We first tested CellEvent Caspase-3/7 Green Detection Reagent (Life Technologies). The bright fluorescence allows for easy detection, and the dye requires no wash steps, retaining fragile or detached cells. Although caspase kits are widely used, the sensitivity to determine early and late apoptosis was not achievable, and we therefore tested PS detection using the annexin V Alexa 488 conjugate as an apoptosis marker.
We also investigated the use of tetramethylrhodamine methyl ester perchlorate (TMRM) for assessing mitochondrial activity. TMRM is readily sequestered into active (depolarized) mitochondria and is a useful measure of apoptotic induction and mitochondrial health. Initial experiments gave promising results; however, to retain the lowest costs and most streamlined image analysis protocol, the use of TMRM was subsequently omitted from HighVia, but could easily be added to the protocol if desired.
Finally, we used the brightfield transmitted light to capture cell shape. This was not used for image analysis but provided a useful visual check to ensure accurate image segmentation. The use of digital phase or contrast imaging may allow label-free segmentation techniques to be developed; this is to be investigated in more detail in the future.
Cell Population Classification Methods.
For reference image details, see
Classification 1: Population profiling—population gating using a decision tree (GE Investigator 1.6.2; multitarget analysis protocol or Yokogawa Pathfinder software)
The simplest method to profile cell populations was to apply a gating protocol to classify cells into populations according to Yo-Pro-3 and annexin V stain intensity and localization within cells. Nuclear and cytoplasm regions were segmented using the Hoechst channel. Measurements of staining intensity, object/background intensity ratios, localization, texture, and morphology were profiled for Hoechst, Yo-Pro-3, and annexin V channels for each defined region of the cell. Characterization of Yo-Pro-3 staining within the “nucleus” region and annexin V staining within the “whole cell” region (cytoplasm and nuclear region combined) were used to determine the population classifier for each cell.
For the gating procedure, cells were initially sorted into “late and necrotic” or “healthy and early” populations by plotting histograms of nuclear intensity that were Yo-Pro-3 positive against the nuclear area. Cells with a Yo-Pro-3 intensity twofold above that of the background in the “nucleus” region were labeled as the “late and necrotic” population; cells with a Yo-Pro-3 intensity <2-fold above that of the background were labeled as the “healthy and early” population.
The “late and necrotic” and “healthy and early” populations were then gated into two further populations. The “late and necrotic” population was gated according to annexin V presence or absence in the “whole cell” region. Cells with an annexin V intensity >2-fold above the background in the “whole cell” region were labeled “late apoptotic,” and the remaining cells were labeled “necrotic.” The “healthy and early” population was likewise gated according to the presence or absence of annexin V in the “whole cell” region. Histograms of annexin V intensity in the “whole cell” region were plotted against the Hoechst channel nuclei area. Cells with an annexin V staining intensity >2-fold above that of the background in the “whole cell” region were labeled “late apoptotic,” and the remaining cells were labeled “necrotic.” Image labeling should be checked carefully against image sets to ensure accurate labeling; adjustments should be made accordingly and checked between different time points and cell types. This simple method is used to rapidly assess cell death mechanism induction in small-compound screens. A more detailed profiling can be achieved as described below.
Classification 2: Population Profiling—Linear Classifier (PerkinElmer)
After the initial segmentation of nuclear and cytoplasm boundaries, features of staining intensity, localization, texture, and morphology were profiled within each region. Characterization of Yo-Pro-3 staining within the “eroded nucleus” region and annexin V staining within the “cytoplasm and nuclei” region was also determined. Using PhenoLOGIC (PerkinElmer), a training set of reference images containing at least 40 cells representative of each of the populations, we manually selected healthy, early, late, and necrotic populations. These reference image sets were used by the Columbus linear classification algorithm to profile the remaining images into the four defined populations.
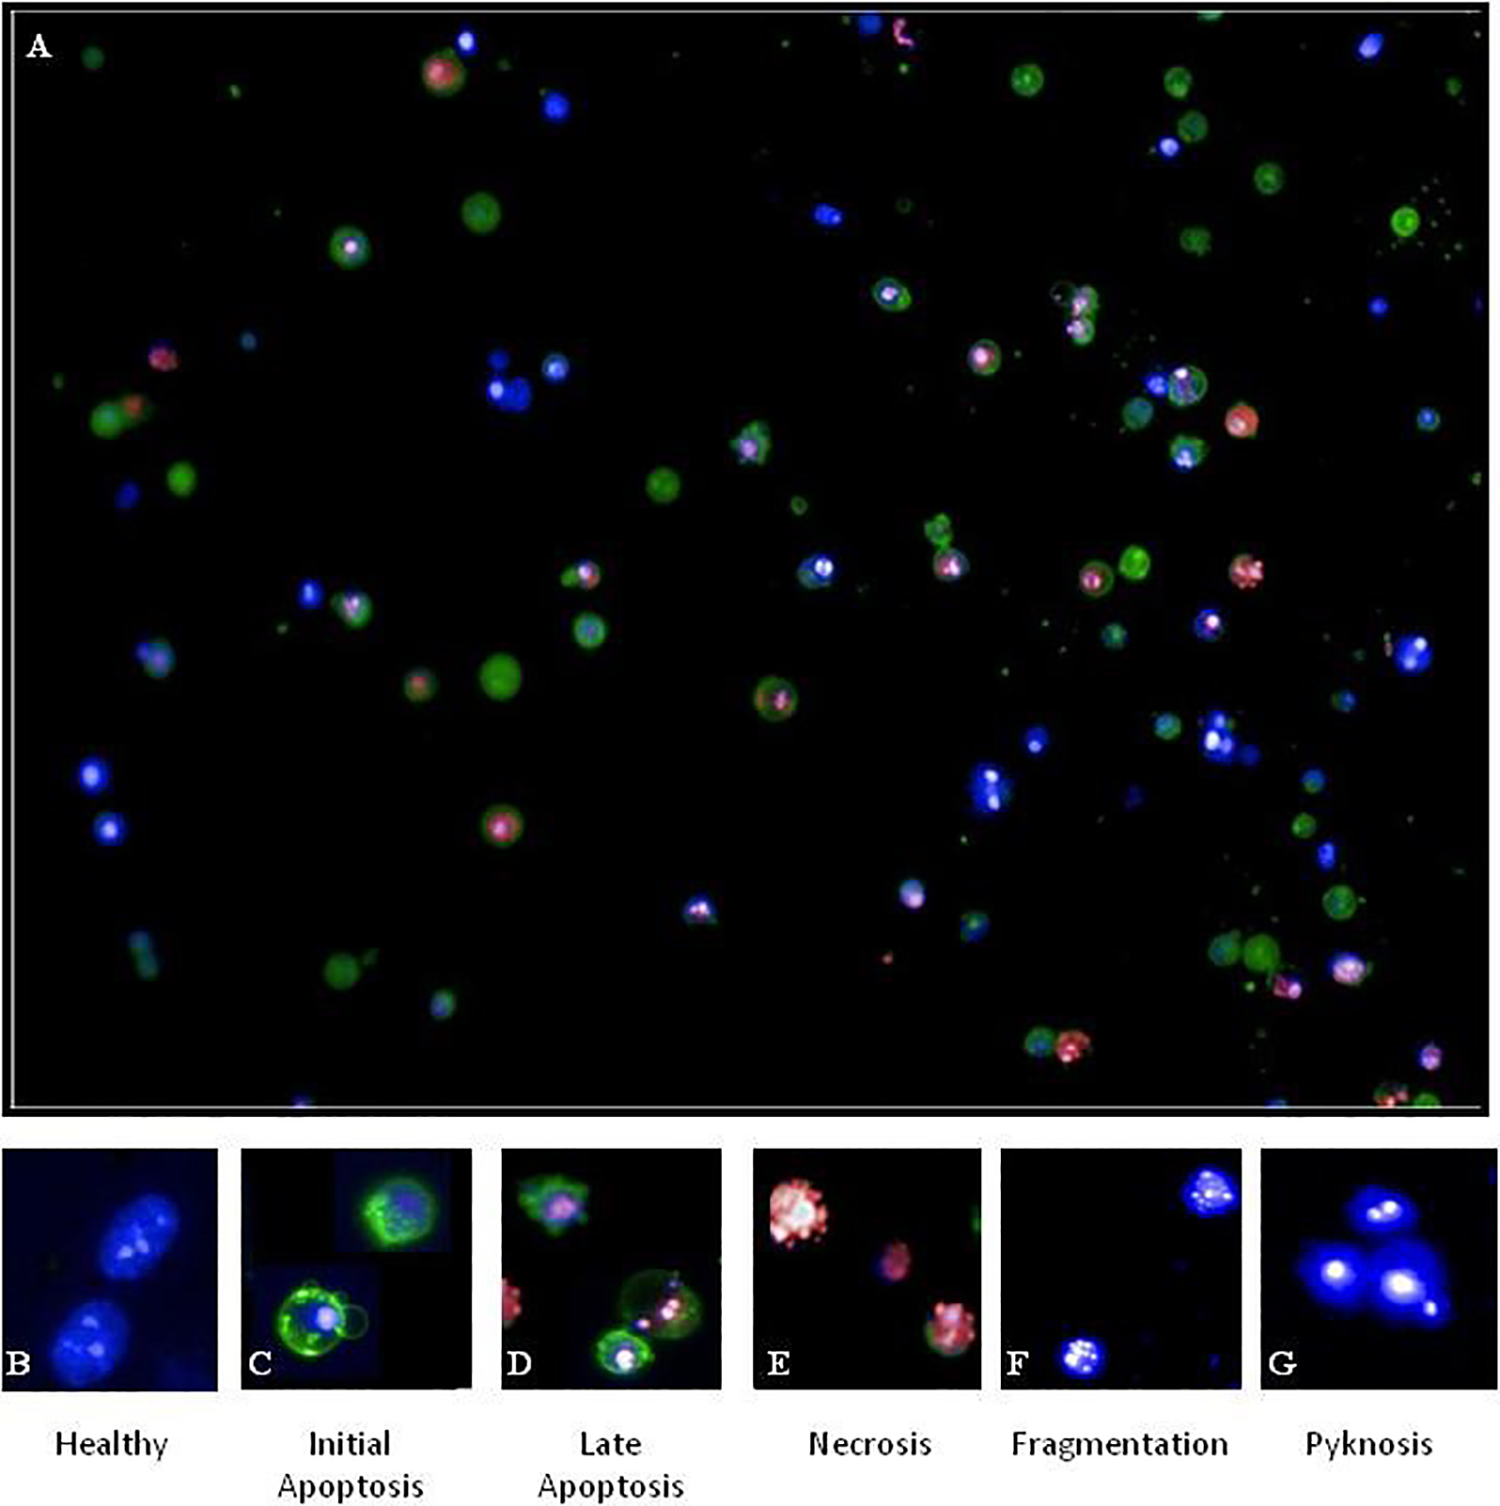
Population Healthy
Reference images selected from DMSO control wells to determine cellular features of healthy cell size, shape, and Hoechst intensity features were used. Features of healthy cells were a Yo-Pro-3 intensity <2-fold above the background within the “nucleus” region and an annexin V intensity <2-fold above the background within any part of the cell, while maintaining a distinct nuclear/cytoplasm ratio relationship. The circularity of the cells and nuclear region should be <0.8 of the nuclear area, and the intensity should be within normal range for the cell lines. This can be determined by plotting histograms of individual features and excluding any cells that fall within extreme regions of the plots. Labeling should be checked against reference images (
(
Population Initial Apoptos
Features of initial apoptosis were Yo-Pro-3 staining <2-fold above the background within the “eroded nucleus” region; annexin V intensity >2-fold above the background within the “whole cell” region; nuclear collapse to small, homogenous, and intensely stained region; collapse of the nuclear/cytoplasm ratio; and irregular cytoplasm shape (circularity score of <0.8) with membrane blebbing.
Population Late Apoptosi
Features of late apoptosis were intense Yo-Pro-3 staining within the “eroded nucleus” region; a minimum Yo-Pro staining >2-fold above the background; an annexin V intensity >2-fold above the background across the “whole cell” region; nuclear collapse to small, homogenous, and intensely stained nuclear region (Hoechst channel); collapse of the nuclear/cytoplasm ratio; increasingly irregular cytoplasm shape; and increased formation of blebbing and/or apoptotic bodies. Possible fragmentation of the nucleus may occur, and care should be taken when segmenting nuclei in the Hoechst channel to ensure that oversegmentation does not occur.
Population Necrosis
Features of necrosis were intense Yo-Pro-3 staining within the “eroded nucleus” region, co-localized with Hoechst staining; absence of annexin V staining across the “whole cell” region; nuclear collapse to small, homogenous, and intensely stained nuclear region (Hoechst channel); collapse of the nuclear/cytoplasm ratio; increasingly irregular nuclear and cytoplasm shape with increased formation of apoptotic bodies; and dissociation of apoptotic bodies. Fragmentation of the nucleus may occur, and care should be taken when segmenting nuclei in the Hoechst channel to ensure that oversegmentation does not occur.
Classification 3: Supervised Classification
In our third classification technique, we performed supervised classification of single-cell measurements. Using the Cell Pathfinder software (Yokogawa), experienced cell biologists annotated cells from a reference experiment by eye as healthy, early apoptotic, late apoptotic, or necrotic/dead (
Each cell was divided into two objects, cell body and nucleus, with the requirement that each cell body contain at least one nucleus. The cell body was detected via digital phase contrast in addition to the fluorescent dyes. We extracted 16 features for the nucleus and 6 features for the cell body, including intensities of the dyes and morphology characteristics like size and roundness (
To validate our machine learning gating algorithm, we plotted the count of healthy cells against the logarithmic inhibitor concentrations and calculated IC50 values. Correct cell gating resulted in a decrease of the number of healthy cells and an increase of apoptotic and necrotic/dead-cell fractions in a dose-dependent manner. Interestingly, we noted different morphological features of apoptotic cells after treatment with different inhibitors. However, the gating algorithm was able to correctly assign these varying phenotypes as apoptotic or necrotic. In addition, by comparing the total cellular and nuclear area and the Hoechst intensity of healthy cells, we were able to observe a significantly increased cell body and nuclear area. This machine learning-guided approach proved to be easily adopted onto different adherent cell lines, highly accurate, and particularly user-friendly. These results confirm the validity of our approach in classifying cell death stages in different cell lines.
Screening of Libraries and Hit Confirmation
We next tested HighVia on different compounds. First, we used compounds from the FDA-approved oncology drug library, which exhibited an antiproliferative effect across four different cell lines in the resazurin assay using the Operetta and IN Cell 6000. These compounds were selected based on a range of antioncogenic mechanisms. A more detailed classification of cytotoxic effects is reflected in
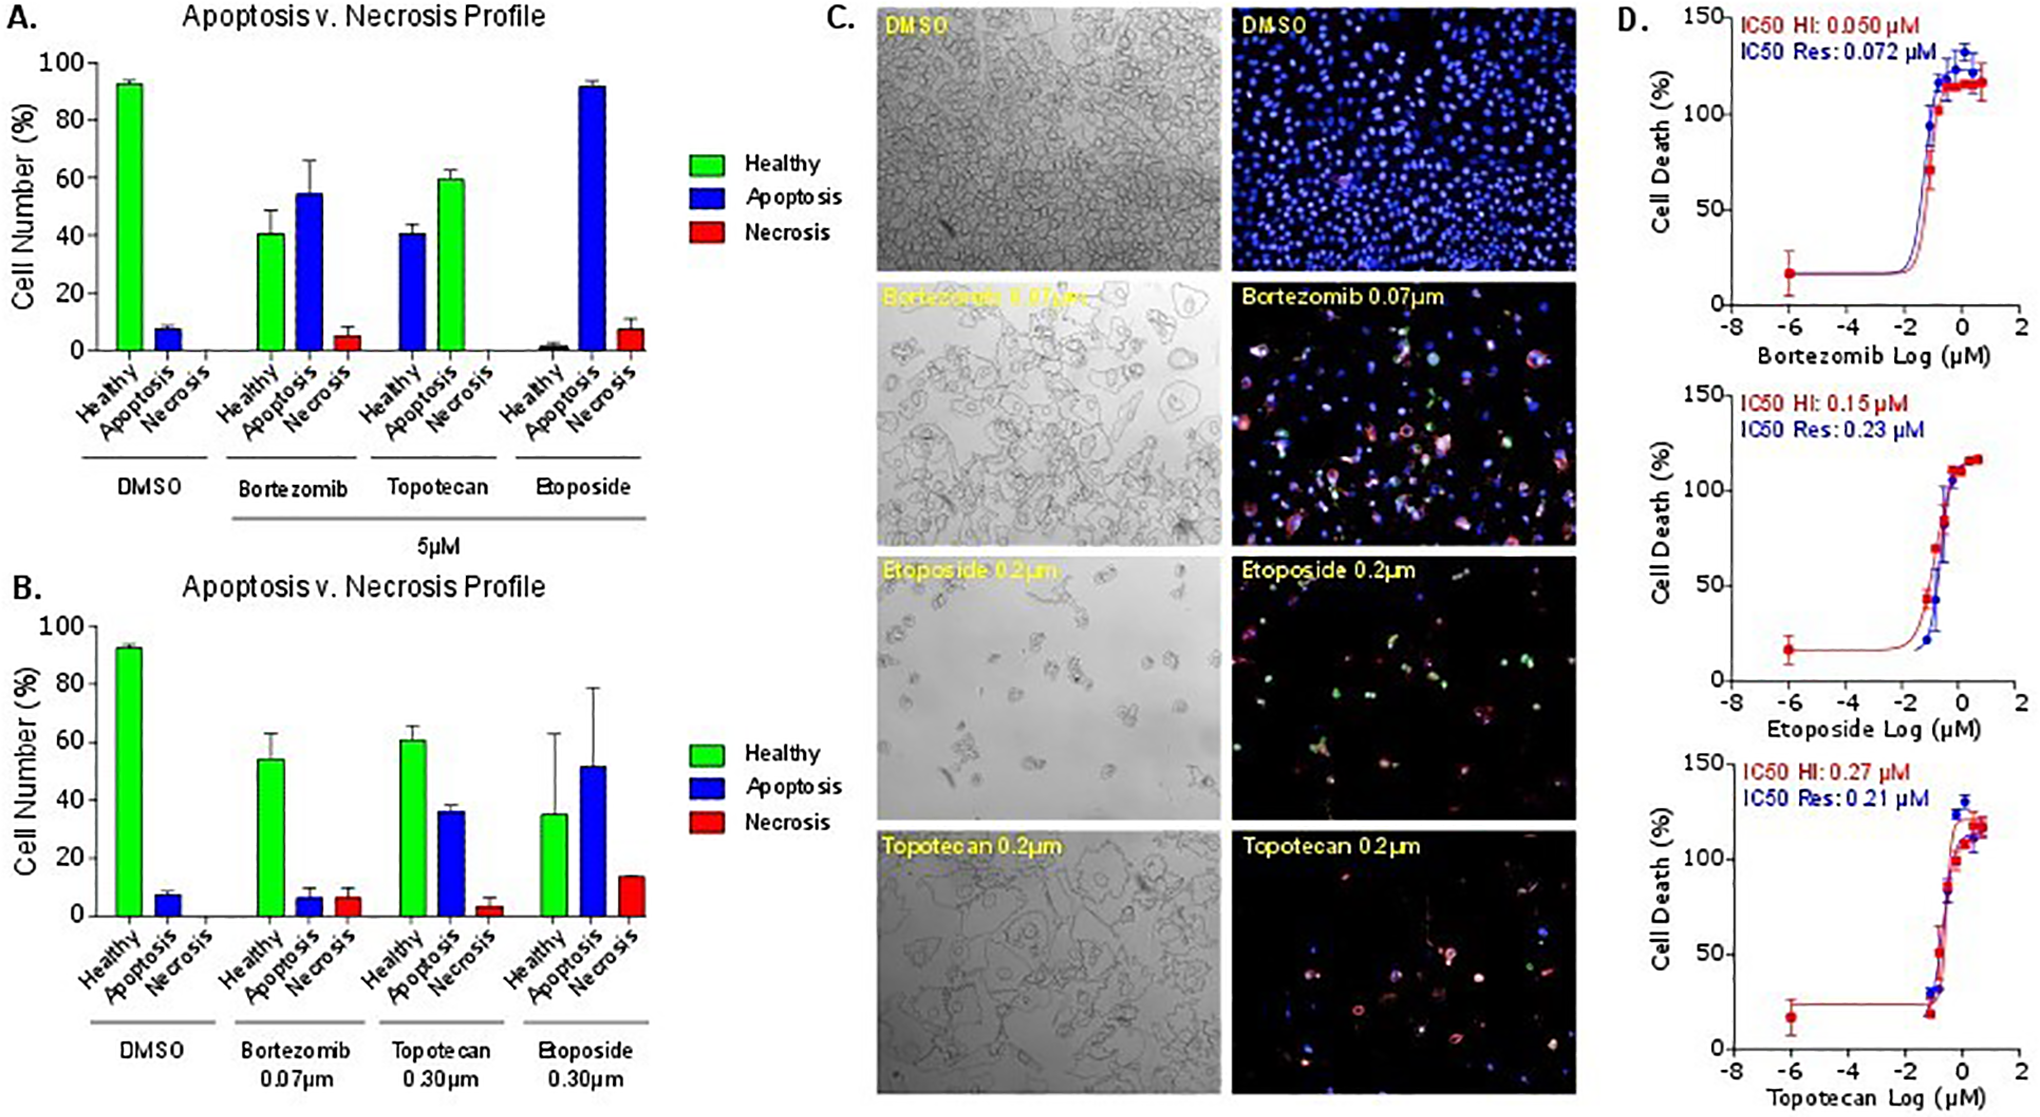
In vitro cytotoxic activity of three clinically approved anticancer drugs in AGP-01 after 72 h of exposure using population profiling—linear classifier. Percent of cells after treatment with control (DMSO) or bortezomib, topotecan, and etoposide, respectively, at (
As expected, there is overall a good correlation between the IC50 values determined in the resazurin assay compared with HighVia (
Our protocol can accommodate a more detailed analysis of this feature. For example, senescence using SA-BGal,
15
cell number, size and shape profiling, vesicle formation, and cycle arrest using nuclear Hoechst intensity could be integrated.
We further evaluated the developed method with a larger set of compounds using the CQ1. We utilized the KCGS available from the SGC. This is a set of 187 narrow-spectrum kinase inhibitors
16,17
that can be used in phenotypic screens to help identify vulnerabilities of particular kinases to this set of inhibitors. We tested KCGS on the pancreatic cancer cell line PANC1. Cells were treated with the compound library at 10 µM for 24 h (
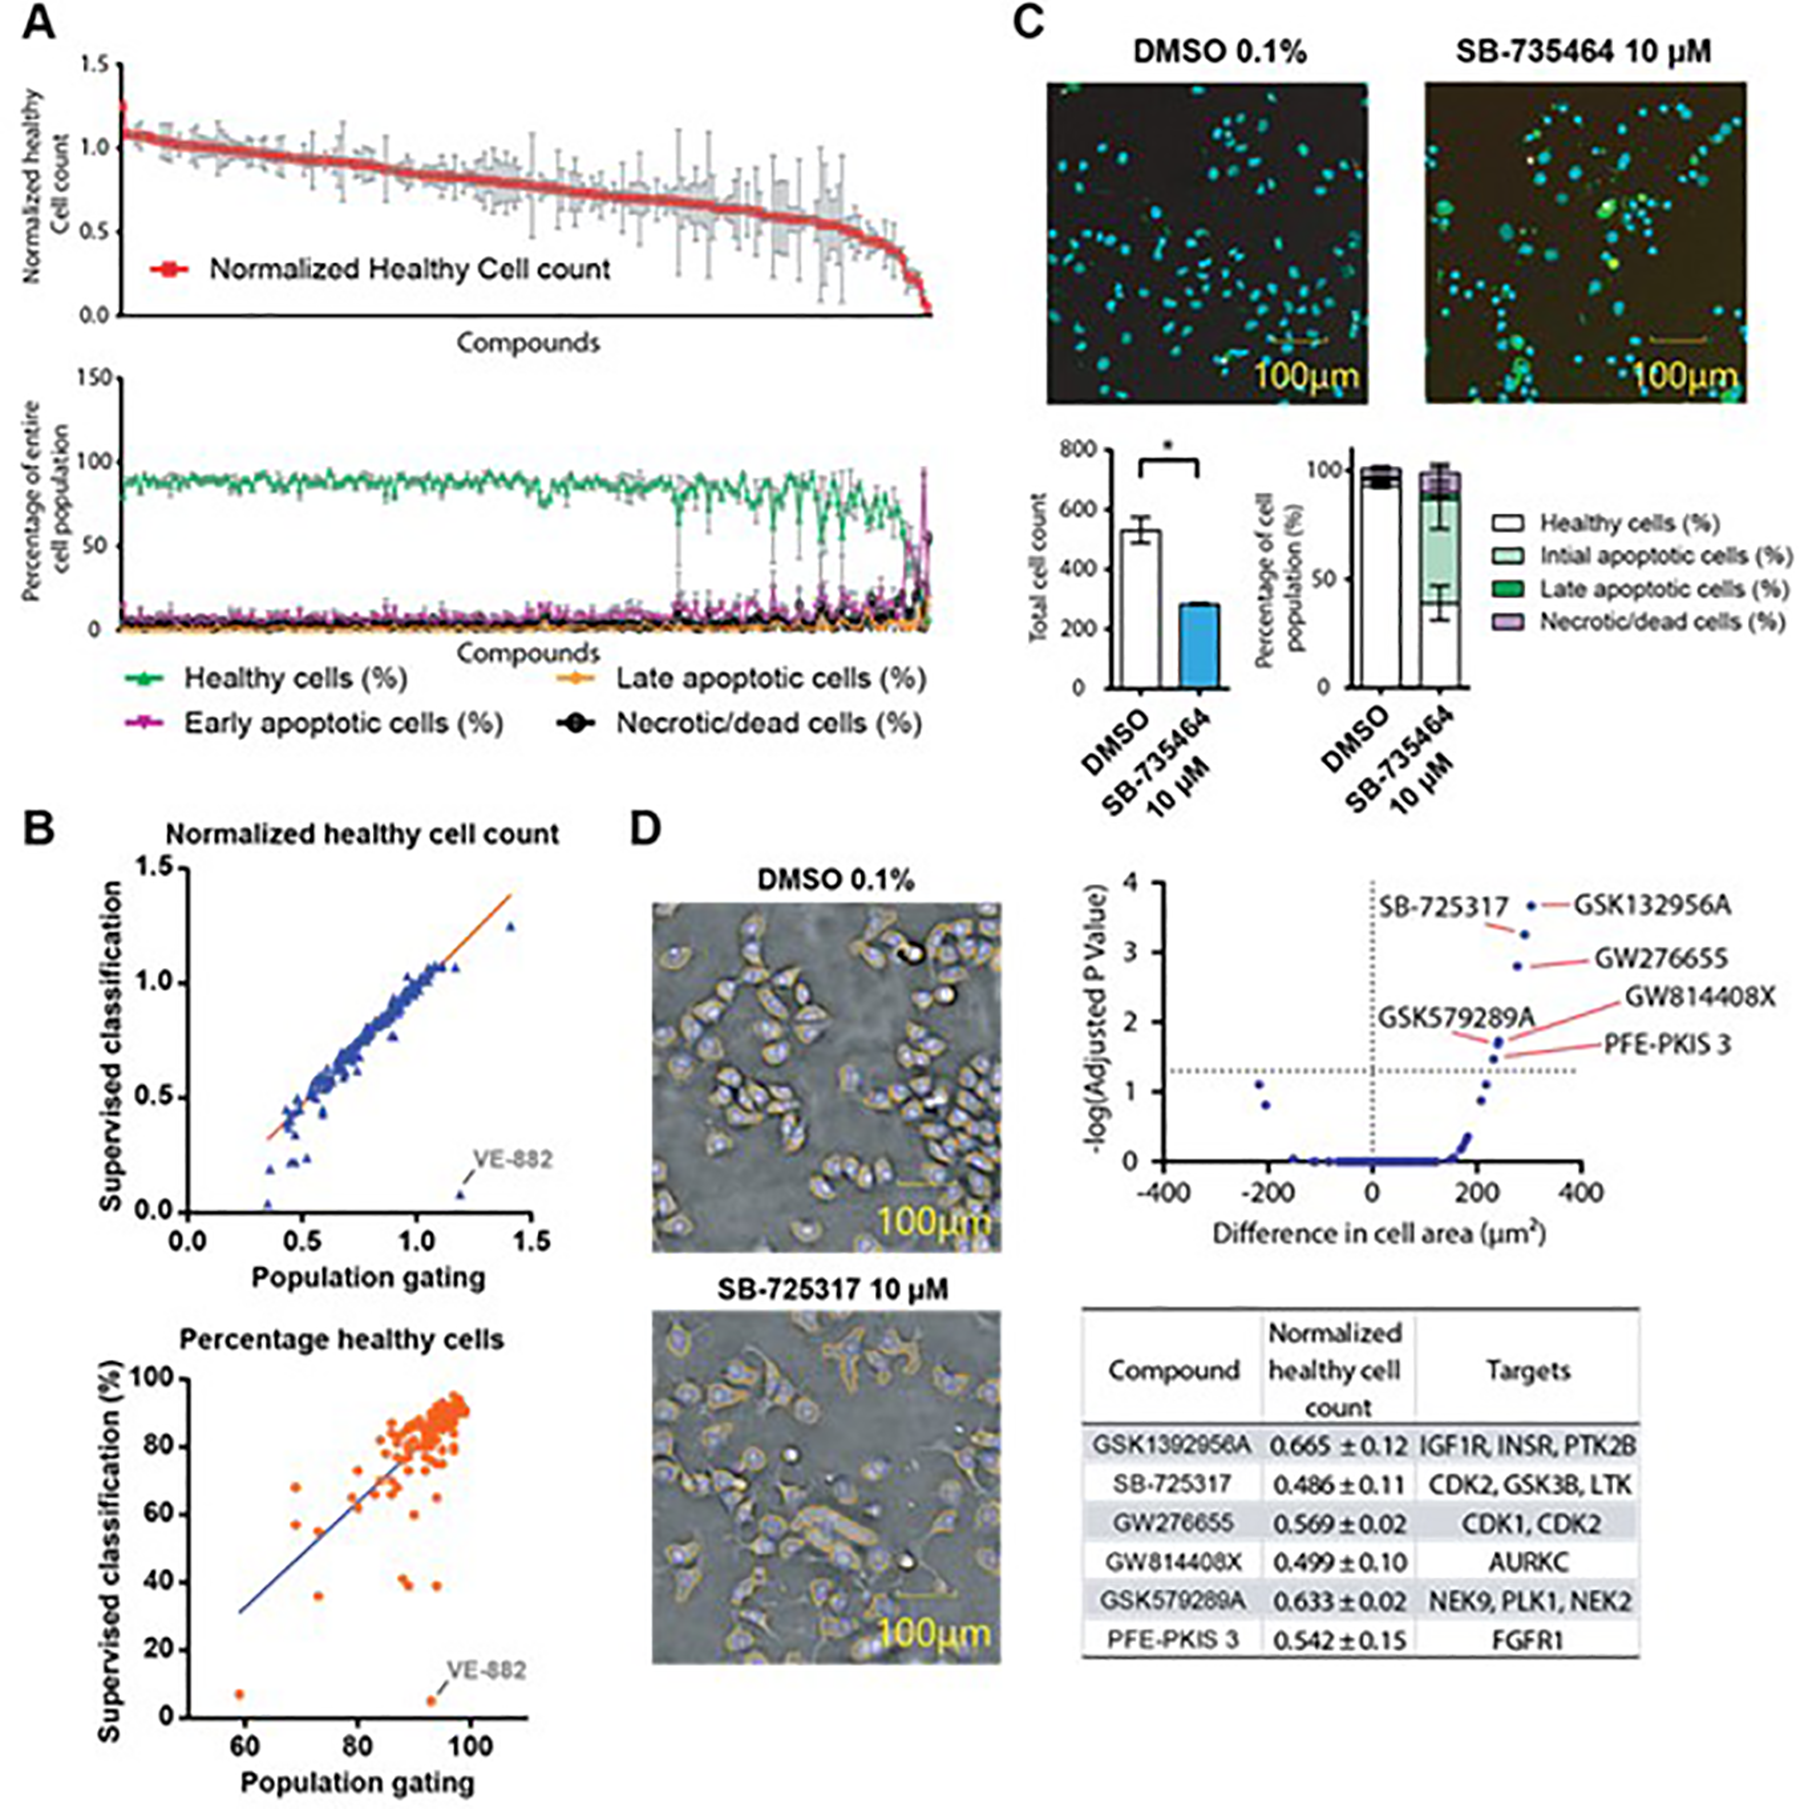
(
Most compounds in KCGS were relatively nontoxic, with only a few compounds leading to 20% or more unhealthy cells. A number of key features can be extracted from this experiment. For example, the compound SB-735464 showed increased numbers of cells in initial apoptosis compared with the DMSO control (
Including the cell area in the supervised analysis, compounds like GSK1392956A, an inhibitor for the kinases IGF1 R, INSR, and PTK2B, or SB-725317 and GW276655, both inhibiting CDKs, were identified (
In summary, we describe a high-throughput, high-content, multiplexed assay with a detailed analysis protocol. The protocols described are adaptable for use with multiple high-content readers and image analysis protocols—making the assay accessible to all laboratories with high-content imagers or to biomedical research scientists screening for cell viability/proliferation/cell death mechanisms through widely accessible academic screening facilities. 13,19 Importantly, it is relatively inexpensive. Standard MTT assay costs are ∼£0.12/well, and those of HighVia are only 2.3× higher at ∼£0.28/well.
The toolbox of three fluorophores and transmitted light allows the detailed profiling of cellular viability and is applicable to multiple screening platforms including small compounds, as described here, in addition to siRNA and CRISPR platforms. Additional analysis parameters may be built into the analysis sequence, allowing further profiling and indications of additional cellular pathway inductions. The protocol is flexible and can be easily adapted to multiple cell types, whenever the cell segmentation protocols are robust. In addition to the cells described here, we have also validated the protocol in stem cells and neurons (unpublished data). Using HighVia, we can achieve a detailed understanding of the mechanism of cell death induced by libraries of test compounds, facilitating the search for novel and repurposed therapeutics. In addition to an IC50 value for compound toxicity, the image analysis offers additional insight into mechanisms of cell death, ranging from apoptosis to necrosis, as well as providing insight into additional compound effects, such as nuclear size and cell shape, thus allowing conclusions regarding the biological effect of the used compounds. Finally, these imaged data sets, once archived, can be reanalyzed to extract additional information if necessary.
Supplemental Material
Supplemental Material, HighVia_Manuscript_Supplemental_FINAL_PUB - HighVia—A Flexible Live-Cell High-Content Screening Pipeline to Assess Cellular Toxicity
Supplemental Material, HighVia_Manuscript_Supplemental_FINAL_PUB for HighVia—A Flexible Live-Cell High-Content Screening Pipeline to Assess Cellular Toxicity by Alison Howarth, Martin Schröder, Raquel C. Montenegro, David H. Drewry, Heba Sailem, Val Millar, Susanne Müller and Daniel V. Ebner in SLAS Discovery
Footnotes
Acknowledgments
The work on the CQ1, especially the analysis, was supported by Michael Schell (Cenibra) and Mahomi Suzuki (Yokogawa).
Declaration of Conflicting Interests
The authors declared no potential conflicts of interest with respect to the research, authorship, and/or publication of this article.
Funding
The authors received financial support for the research, authorship, and/or publication of this article: The authors are supported by the SGC, a registered charity (no. 1097737) that receives funds from AbbVie, Bayer Pharma AG, Boehringer Ingelheim, Canada Foundation for Innovation, Eshelman Institute for Innovation, Genome Canada, Innovative Medicines Initiative (EU/EFPIA) (ULTRA-DD grant no. 115766), Janssen, Merck KGaA Darmstadt Germany, MSD, Novartis Pharma AG, Ontario Ministry of Economic Development and Innovation, Pfizer, São Paulo Research Foundation—FAPESP, Takeda, and Wellcome (106169/ZZ14/Z).
Supplemental material for this article is available online.
References
Supplementary Material
Please find the following supplemental material available below.
For Open Access articles published under a Creative Commons License, all supplemental material carries the same license as the article it is associated with.
For non-Open Access articles published, all supplemental material carries a non-exclusive license, and permission requests for re-use of supplemental material or any part of supplemental material shall be sent directly to the copyright owner as specified in the copyright notice associated with the article.