
Abstract
Cytoplasmic dynein-1 (hereafter dynein) is a six-subunit motor complex that transports a variety of cellular components and pathogens along microtubules. Dynein’s cellular functions are only partially understood, and potent and specific small-molecule inhibitors and activators of this motor would be valuable for addressing this issue. It has also been hypothesized that an inhibitor of dynein-based transport could be used in antiviral or antimitotic therapy, whereas an activator could alleviate age-related neurodegenerative diseases by enhancing microtubule-based transport in axons. Here, we present the first high-throughput screening (HTS) assay capable of identifying both activators and inhibitors of dynein-based transport. This project is also the first collaborative screening report from the Medical Research Council and AstraZeneca agreement to form the UK Centre for Lead Discovery. A cellular imaging assay was used, involving chemically controlled recruitment of activated dynein complexes to peroxisomes. Such a system has the potential to identify molecules that affect multiple aspects of dynein biology in vivo. Following optimization of key parameters, the assay was developed in a 384-well format with semiautomated liquid handling and image acquisition. Testing of more than 500,000 compounds identified both inhibitors and activators of dynein-based transport in multiple chemical series. Additional analysis indicated that many of the identified compounds do not affect the integrity of the microtubule cytoskeleton and are therefore candidates to directly target the transport machinery.
Introduction
Cytoplasmic dynein-1 (dynein) is a 1.4 MDa motor complex that plays an essential role in cellular organization. Dynein moves toward the minus ends of microtubules in association with a large variety of cellular constituents—including endosomes, lysosomes, protein aggregates, mitochondria, and mRNAs—and thereby mediates their polarized trafficking. 1 Neurons are particularly dependent on efficient dynein-based cargo transport due to their long processes, as illustrated by the association of mutations in the dynein transport machinery with neurodevelopmental and neurodegenerative diseases. 2 Pathogenic viruses such as HIV and herpes virus have also evolved the ability to engage the motor complex for translocation through the cytoplasm. 1,3,4 In addition, dynein organizes microtubule arrays during interphase and mitosis, for example, by generating pulling forces on microtubule ends at the cell cortex. 5 -7
Dynein comprises six subunits, each present in two copies per complex. 1 Microtubule binding is mediated by the heavy chain, which also contains ATPase activity. Repeated conformation changes in this subunit, which are coupled to cycles of ATP hydrolysis, drive the motor complex toward the microtubule minus end. In mammalian cells, the motility of the dynein complex is activated by association with another multisubunit complex, dynactin, and one of a number of specialized coiled-coil proteins bound to cargoes (termed “activating adaptors”). Dynein, dynactin, and the activating adaptor form a mutually dependent triple complex that can move in vitro over a distance of many microns. 1,8 -10
The activities of dynein in cells are only partially understood, and many academic groups are working to address this issue. Because of dynein’s numerous roles, a key challenge is discriminating between direct and indirect effects when the function of the motor complex is manipulated using genetic tools. For this reason, the ability to acutely inhibit or activate dynein-based transport using small molecules is highly desirable. Dynein inhibitors may also be useful in antiviral or antimitotic therapies, whereas activators could be used in animal models to explore the hypothesis that enhanced microtubule-based transport in axons can alleviate age-related neurodegenerative diseases. 11 -16 Small molecules that inhibit dynein have previously been reported, but questions remain about their potency, selectivity, or mode of action. 17 -24 To our knowledge, no molecules have been described that are specific activators of dynein-based transport.
Here, we present the first cellular high-throughput screening (HTS) assay and associated analytical tools for the identification of candidate small-molecule modulators of a model dynein–dynactin–activating adaptor complex. Such a system opens the possibility of finding molecules that affect specific aspects of dynein biology in vivo, including regulation by dynactin and activating adaptors, as well as by signal transduction pathways. This chemical equity would allow a more nuanced approach to manipulating dynein function in academic and applied settings.
The opportunity to develop such an assay has arisen from the innovative agreement in place between the Medical Research Council (MRC) and AstraZeneca, whereby academic groups in the UK can apply for funding from the MRC and gain access to the infrastructure within the UK Centre for Lead Discovery (UKC4LD). This has created a unique combination of biological knowledge, financial support, and screening know-how to progress novel targets in a collaborative setting. 25 -27
The HTS assay is based on a previously described strategy in which active dynein motors are inducibly recruited to fluorescent peroxisomes in order to elicit their relocalization within the cell 28,29 ( Fig. 1A ). The N-terminal region of the activating adaptor BicD2 (BicD2N) 30 is recruited in a rapamycin-dependent manner to the surface of peroxisomes using the FRB-FKBP heterodimerization system. 31 This leads to the association of these organelles with dynein and dynactin complexes and their translocation toward microtubule minus ends, which are concentrated at the microtubule organizing center (MTOC) in the perinuclear region. 28,29 The ability of the peroxisome relocalization assay to report on dynein-mediated transport has been further corroborated by live imaging of cells deficient for the dynein activator Lissencephaly-1. 32
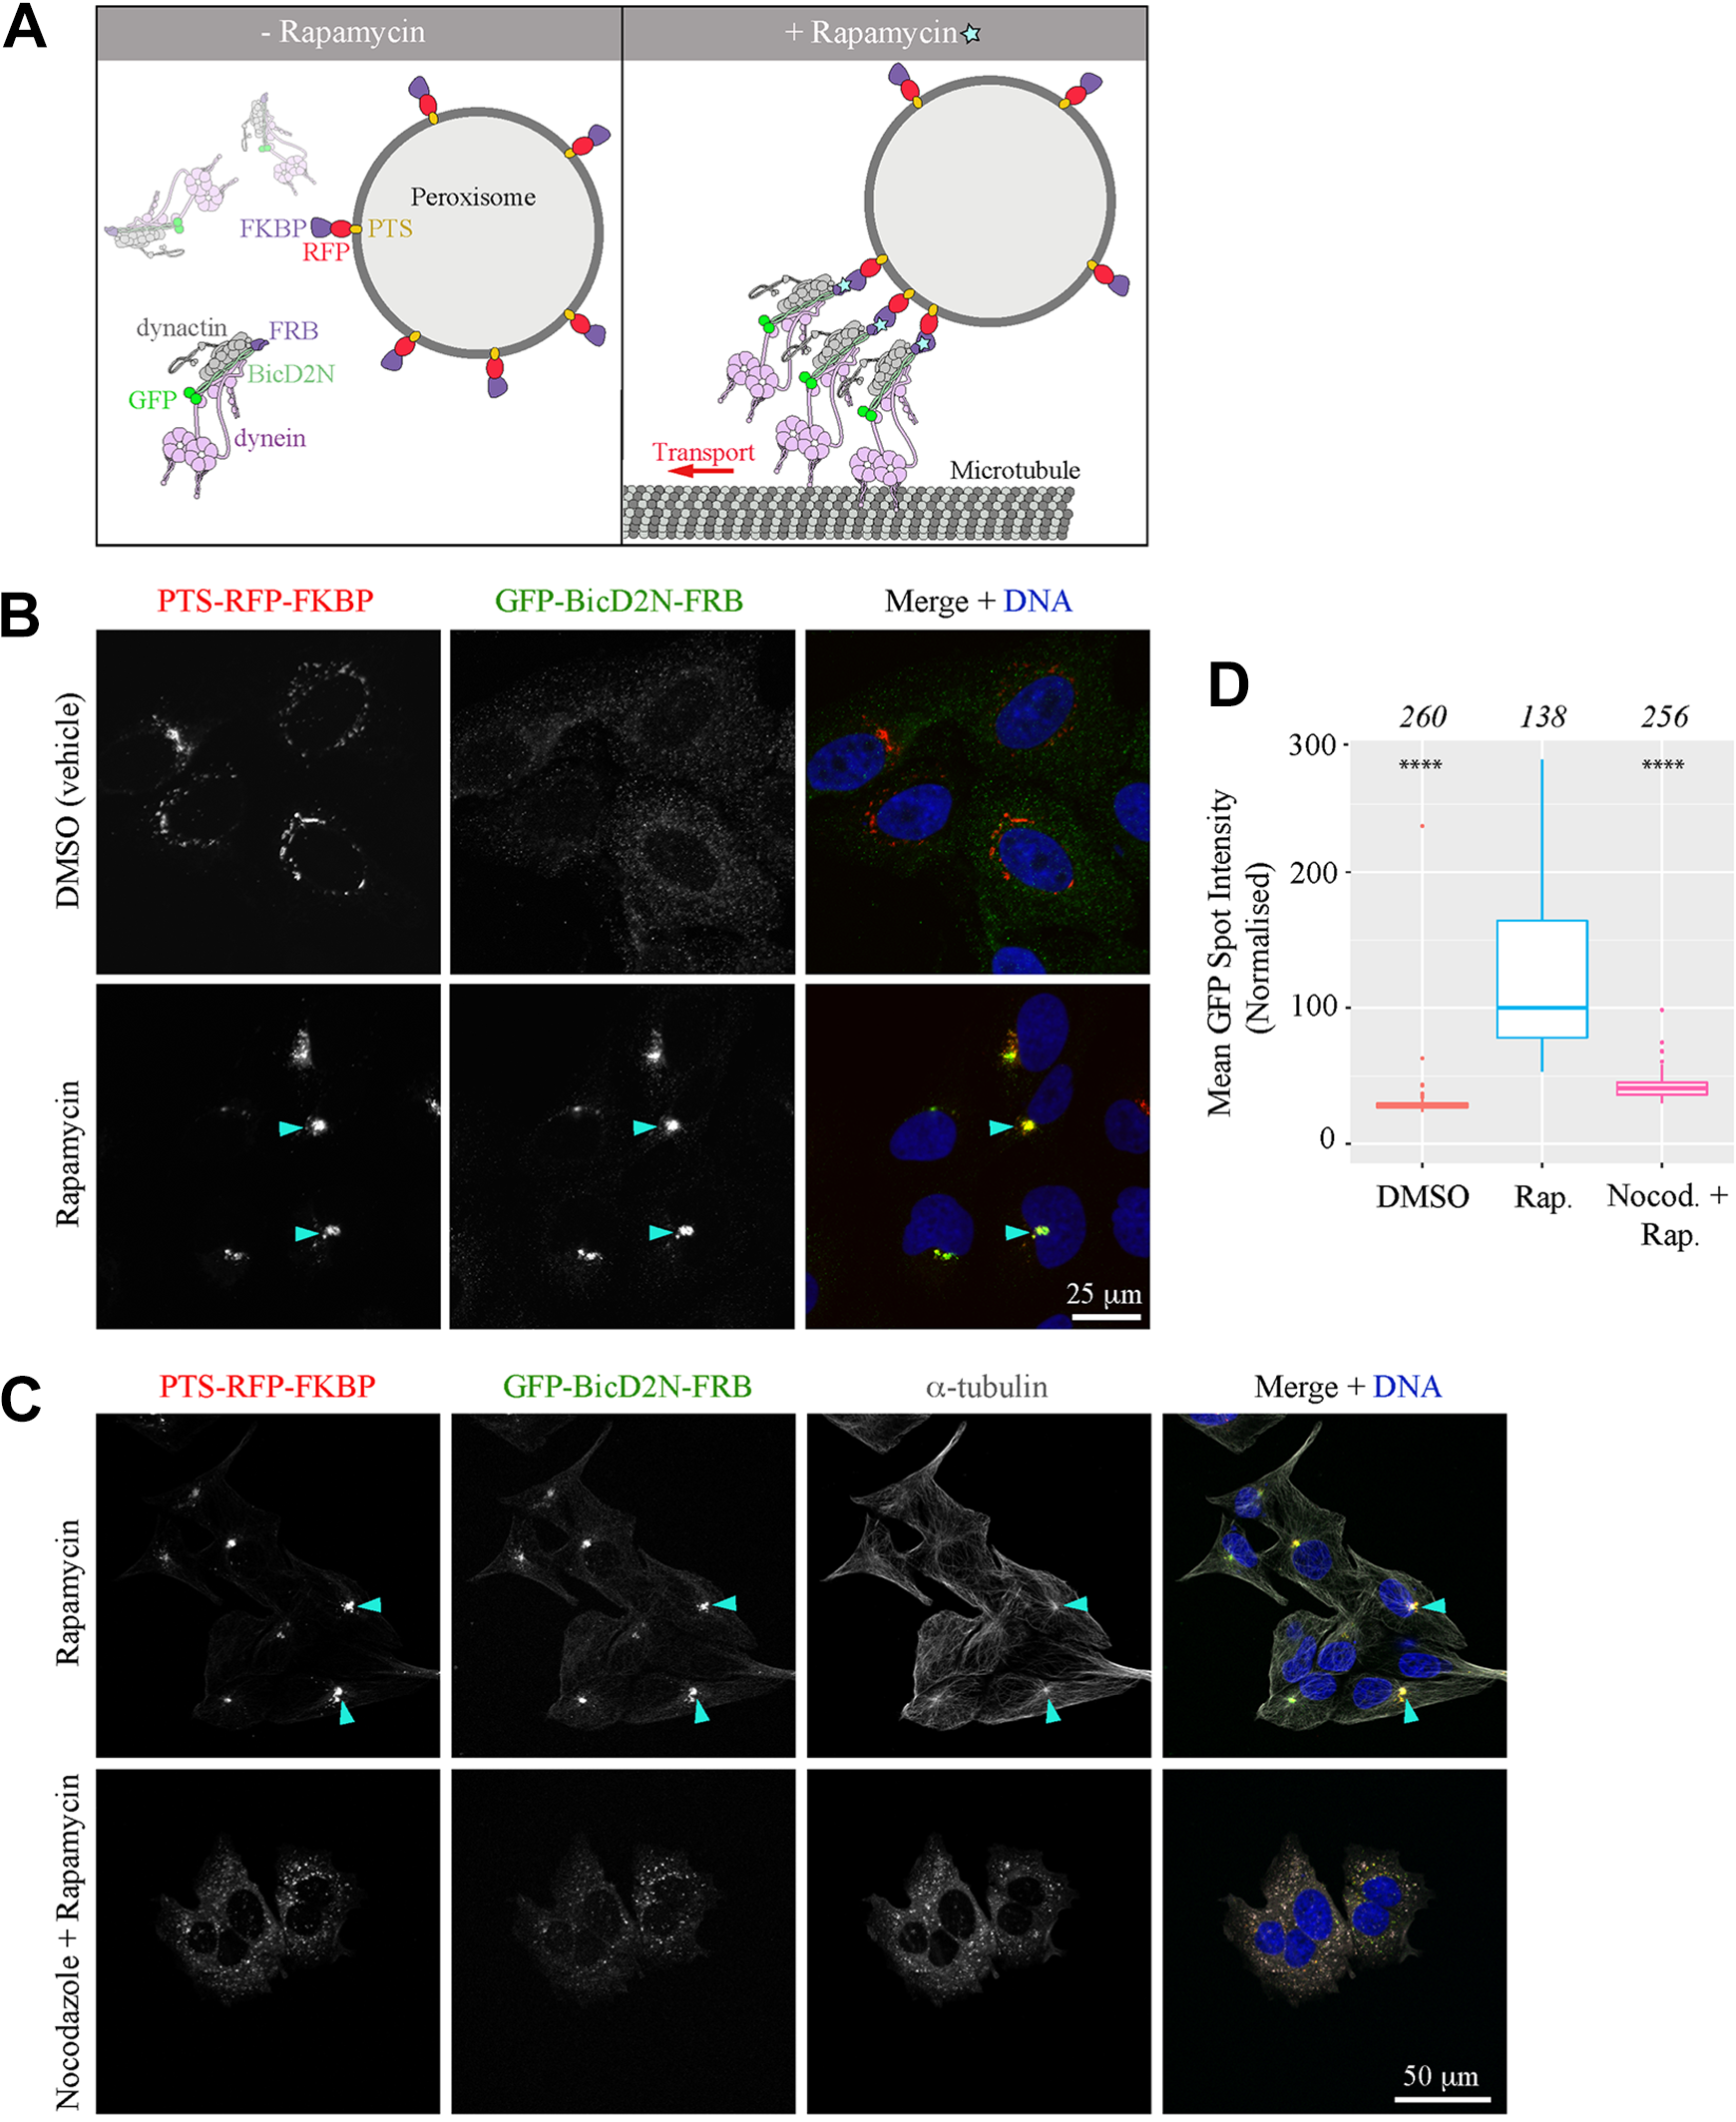
Dynein–dynactin–BicD2N–peroxisome trafficking assay. (
We reasoned that because kinetics of peroxisome relocalization can be tuned by varying the assay endpoint and concentration of the chemical inducer of FRB and FKBP association, 28 it may be possible to design an assay that identifies agonists and antagonists of dynein-based transport in a single screen. Previously, the peroxisome relocalization assay was carried out manually using high-magnification objectives in order to image a small number of cells over time in great detail. 28,29 This approach was not practical for the compound numbers necessary to screen the chemical diversity in the AstraZeneca compound collection. A 384-well plate-based assay format, with a low magnification objective and semiautomated liquid handling and microscopy, together with optimized image analysis procedures, allowed a suitably high throughput to be achieved. Testing of more than 500,000 compounds identified multiple inhibitor and activator series that can be analyzed in the future in assays that deconvolute their specific modes of action. We demonstrate this point by categorizing hits that affect the integrity of microtubules and are therefore candidates to modulate dynein-based transport indirectly, and by identifying undesirable activator hits that function in the absence of rapamycin or are inherently fluorescent.
Materials and Methods
High-Throughput Screening
A total of 505,500 compounds from the AstraZeneca collection were screened using the high-throughput inducible peroxisome relocalization assay. This involved a combination of liquid handling work cells and manual manipulation, with a three-channel fluorescence endpoint read on an automated dual CX5 CellInsight setup: a Cart-to-Cart system involving two CellInsight CX5 High Content Screening Systems (Thermo Fisher Scientific, Waltham, MA) fed from a Steristore incubator via a CoLAB Flex A-Cell robot (HighRes Biosolutions, Beverly, MA) (
A U-2 OS human bone osteosarcoma cell line stably expressing GFP-BicD2N-FRB and peroxisome targeting sequence (PTS)-RFP-FKBP (see Results) was grown in continuous culture in selective antibiotics prior to use for screening. PTS-RFP-FKBP, which was under the control of the cytomegalovirus promoter, was selected with geneticin, whereas GFP-BicD2N-FRB, which was under the control of the chick β-actin promoter, was selected with hygromycin. Cells were grown in bulk in multilayer tissue culture T175 flasks and plated manually into black 384-well cell culture plates (cat. 781090, Greiner Bio-One, Kremsmünster, Austria) using a Multidrop Combi (Thermo Fisher Scientific). Cell culture conditions are provided in
Plates were read on an automated system comprising two CellInsight CX5 machines, using a three-channel image acquisition (for GFP, RFP, and Hoescht signals) and the analysis method described below. Each 384-well assay plate included 16 neutral controls (DMSO only) and 16 inhibitor controls (10 μM nocodazole, a known microtubule targeting agent, in DMSO). The median and robust standard deviations of these controls were used to generate robust Z′ (RZ′) statistics to determine plate variability. To calculate the percent inhibition of test compounds in the inhibitor assay, a normalization using the compound wells as neutral controls and nocodazole-containing wells as inhibitor controls was used. This approach assumed that, due to the large number of inactive compounds being tested, the compound wells would be a more robust set of neutral controls than the limited number (n = 16) of DMSO-only wells. For the activator assay, a single-point normalization based around the compound controls only was used due to the lack of an activating control. The primary screen was carried out at a compound concentration of 10 µM, with a robust z-score determination (see below) for each compound used to select primary screening hits with robust z-score cutoffs of –5 (inhibitors) and +5 (activators).
Genedata Screener software (version 14.0.7-Standard, Genedata, Basel, Switzerland) was used for data analyses following CellInsight image acquisition. Primary hits were plotted in a 10-point XC50 (where X equals either I [inhibitory] or E [effective] concentration) dose response from 1 nM to 30 µM in half-log intervals. A near-neighbor compound set (i.e., with related chemical structures) was generated from XC50 screening hits and tested in dose–response format to generate structure–activity relationship (SAR) data. Data were fitted to a four-parameter logistic model to obtain XC50, Hill slope, minimum inhibition (S 0), and maximum inhibition (Sinf ). Curves were categorized based on statistical measures to highlight those with the best fit. In cases where fitting failed, the Sinf and/or S 0 parameters were fixed, resulting in a three- or two-parameter curve fit.
All XC50 plates were restained using a rat anti-α-tubulin primary antibody (Abcam Ab6160, Abcam, Cambridge, UK, diluted 1:2000) and an Alexa Fluor 680-conjugated goat anti-rat IgG secondary antibody (Invitrogen A21096, Invitrogen, Carlsbad, CA, diluted 1:1000) and read on the CellInsight CX5 systems in the far-red channel. Images were analyzed using Columbus software (PerkinElmer, Waltham, MA) to assess the degree of microtubule disruption caused by the tested compounds. The user-developed Columbus algorithm calculated a number of features for each identified cell, which were based around intensity and textural appearance (ridges, spots, etc.) and the distribution of these textures within the cell (rotational symmetry, location from center to edge of cell). These features were used to train a linear classifier to identify cells as “Normal” or “Nocodazole Disrupted” using manually selected training examples in the presence and absence of nocodazole within Columbus. From this linear classifier we used the regression score between “Normal” and “Nocodazole Disrupted,” averaged over a well, as a continuous value quantifying the degree of microtubule disruption, which could then be used to generate XC50 curves.
Data Capture Using the CellInsight High-Content Screening Platform
HTS data were acquired using two CellInsight CX5 HCS imagers on an automated HighRes CoLAB Flex Cart-to-Cart system. Image acquisition using an Olympus (Shinjuku City, Tokyo, Japan) 10× UPlanFL air objective (0.3 NA) was optimized on the CX5 to allow increased throughput by shorter imaging time without compromising data quality. Plates were read in three channels—blue for cell nuclei staining (Hoescht), green for BicD2N fluorescence (GFP), and red for peroxisome fluorescence (RFP)—using six fields of view per well. Image exposure was set at approximately 25% of saturation to prevent over- and underexposure. Exposure times for each channel were optimized based on maximum (DMSO) and minimum (10 μM nocodazole in DMSO) control wells across a number of plates on the day of reading. Cells that had lost expression of the PTS-RFP-FKBP transgene were gated out by setting a minimum threshold of RFP fluorescence. GFP expression in the form of average spot area per cell per well in the perinuclear region was calculated for valid objects to generate a feature value (MEAN_CircSpotAvgAreaCh2) for analysis in Genedata Screener (version 14.0.7-Standard).
HTS Data Analysis
Compound screening data were analyzed through two separate Genedata Screener (version 14.0.7-Standard) sessions to allow the detection of both activators and inhibitors of dynein-based transport. A robust z-score normalization was applied using a single control well group as a reference distribution. Robust z score was calculated for each well using a formula where the standard deviation and mean are replaced by the robust standard deviation and median, respectively. For a single plate the median and robust standard deviation of the raw values were obtained from the central reference well type. As described above, the compound wells on the microtiter plate were used as the central reference with the assumption that only a very small proportion of these would be active and so effectively acted as neutral controls. For each well, the median was subtracted from its raw value and this was divided by the robust standard deviation to obtain the robust z score:

where x is the raw data value of the well to be standardized, m is the median of the chosen control well group, and RSD is the robust standard deviation for the chosen control well group. Robust standard deviation is defined as the median absolute deviation×1.483.
The single-plate robust z-score normalization was used to remove an offset and a multiplicative distortion per plate.
As described above, robust z-score cutoffs of –5 (inhibitors) and +5 (activators) were used to select compounds for further testing. The generation of an RZ′ factor was used as a measure of plate quality. Compound wells were again assumed to act as neutral controls and so were used in the normalizations for inhibitors (compounds minus inhibitors) or activators (compounds). Data were transferred to Genedata Screener by a connected link with the AstraZeneca CellInsight Oracle database and mapped to compounds directly via an internal AstraZeneca compound database.
High-Resolution Confocal Imaging
The primary data were obtained with a Zeiss 780 confocal microscope (Oberkochen, Germany) using a 40× PlanApo Oil objective (1.3 NA). Where indicated, microtubules in PTS-RFP-FKBP/GFP-BicD2N-FRB U-2 OS cells were visualized with mouse anti-α-tubulin antibody DM1A (Abcam Ab7291, diluted 1:500) and an Alexa Fluor 647-conjugated goat anti-mouse IgG secondary antibody (Invitrogen A21235, diluted 1:500). RFP and GFP signals in PTS-RFP-FKBP/GFP-BicD2N-FRB U-2 OS cells were imaged as follows (see legends for details of rapamycin and compound treatments; note that when compounds were absent, DMSO was used as a vehicle control). With the exception of
Quantification of Fluorescent Signals in High-Resolution Confocal Images
For the quantification of high-resolution imaging data, 10–16 images (212 × 212 µm each) were analyzed per condition using a custom ImageJ script. For each image, the channel corresponding to the DAPI label was preprocessed using a 3 × 3 median filter and a rolling ball background subtraction. Segmentation of nuclei was achieved by setting a threshold level with a probability of false alarm of 0.01 using the median and median of absolute deviation as a robust estimate of the mean and variance of the image. A set of signed distance maps was computed for each segmented object and used to define cellular regions associated with each nucleus. The green channel was preprocessed using a Laplacian of Gaussian and the threshold set using the same strategy as described above, thus providing a segmentation for the GFP-BicDN-FRB signal. For each region associated with a nucleus contained entirely in the field of view, the total intensity of each segmented green object was computed and a mean value was calculated per cell. To account for different methods of GFP signal detection between experimental series, values within one experimental series were normalized to the median value for the category with the largest median value in that series. Statistical analysis of the results was performed in R.
Results
Cell Line Generation and Characterization
A series of cell lines that use the rapamycin-inducible FKBP/FRB heterodimerization system to control the recruitment of activated dynein complexes to peroxisomes were created. This work was performed by SAL Scientific (Fordingbridge, UK) under an agreement with Aurelia Bioscience Ltd (Nottingham, UK). The composition of expression plasmids was based on the work carried out previously by Kapitein et al., 28 with sequence/plasmid manufacture for transfection further outsourced to Oxford Genetics (Oxford, UK). Multiple U-2 OS human osteosarcoma cell lines stably expressing FKBP linked to the human PEX3 PTS and RFP (PTS-RFP-FKBP), as well as FRB linked to mouse BicD2N (residues 1–400) and GFP (GFP-BicD2N-FRB), were established. The U-2 OS cell line was chosen for its low risk (class 1), good transfection efficiency, large cytoplasm, and previous use in dynein studies. 33
Cell lines containing both constructs were assessed for expression levels and localization of fluorescent proteins in the presence and absence of rapamycin (
HTS Assay Development
An outline imaging assay was created by Aurelia Bioscience Ltd. who used the selected GFP-BicD2N-FRB/PTS-RFP-FKBP U-2 OS line to establish an appropriate cell revival protocol, selective growth conditions, and seeding density for use. Further preliminary experimentation by Aurelia Bioscience Ltd. that was aimed at producing an optimal assay window for the rapamycin response demonstrated the benefits of starving cells of serum for 24 h after an initial 24 h of settling and growth. Removal of protein and growth factors in this manner facilitated cell synchronization and robust peroxisome relocalization when rapamycin was added compared with serum-containing conditions. No serum starvation, or starvation periods longer than 24 h, generated variable data with an unworkable assay window.
Assay development within the UKC4LD determined a requirement for cells to be washed in situ to remove sufficient media for effective serum starvation. Assay variability was greatly affected by the number and stringency of washes and the equipment used, so multiple washing systems and protocols were explored before selecting the Biotek EL406 plate washer. The final conditions involved gentle removal of approximately 90% of cell media and replacement with serum-free media, which minimized cell loss and greatly reduced well-to-well variability in peroxisome relocalization.
We next assessed the ability of the CellInsight imaging system to evaluate peroxisome relocalization. First, images were generated by confocal microscopy with an Olympus 40× air objective (UPLS apo, 0.95 NA) using the Yokogawa (Yokogawa Electric, Musashino, Tokyo, Japan) CV7000 (
Fig. 2A,B
). This system allowed detection of the concentration of GFP-BicD2N-FRB and PTS-RFP-FKBP at the MTOC in rapamycin-treated cells. Comparison of these images with the widefield images taken using the CellInsight system with a 10× air objective (UPlanFL, 0.3 NA) showed concordance (
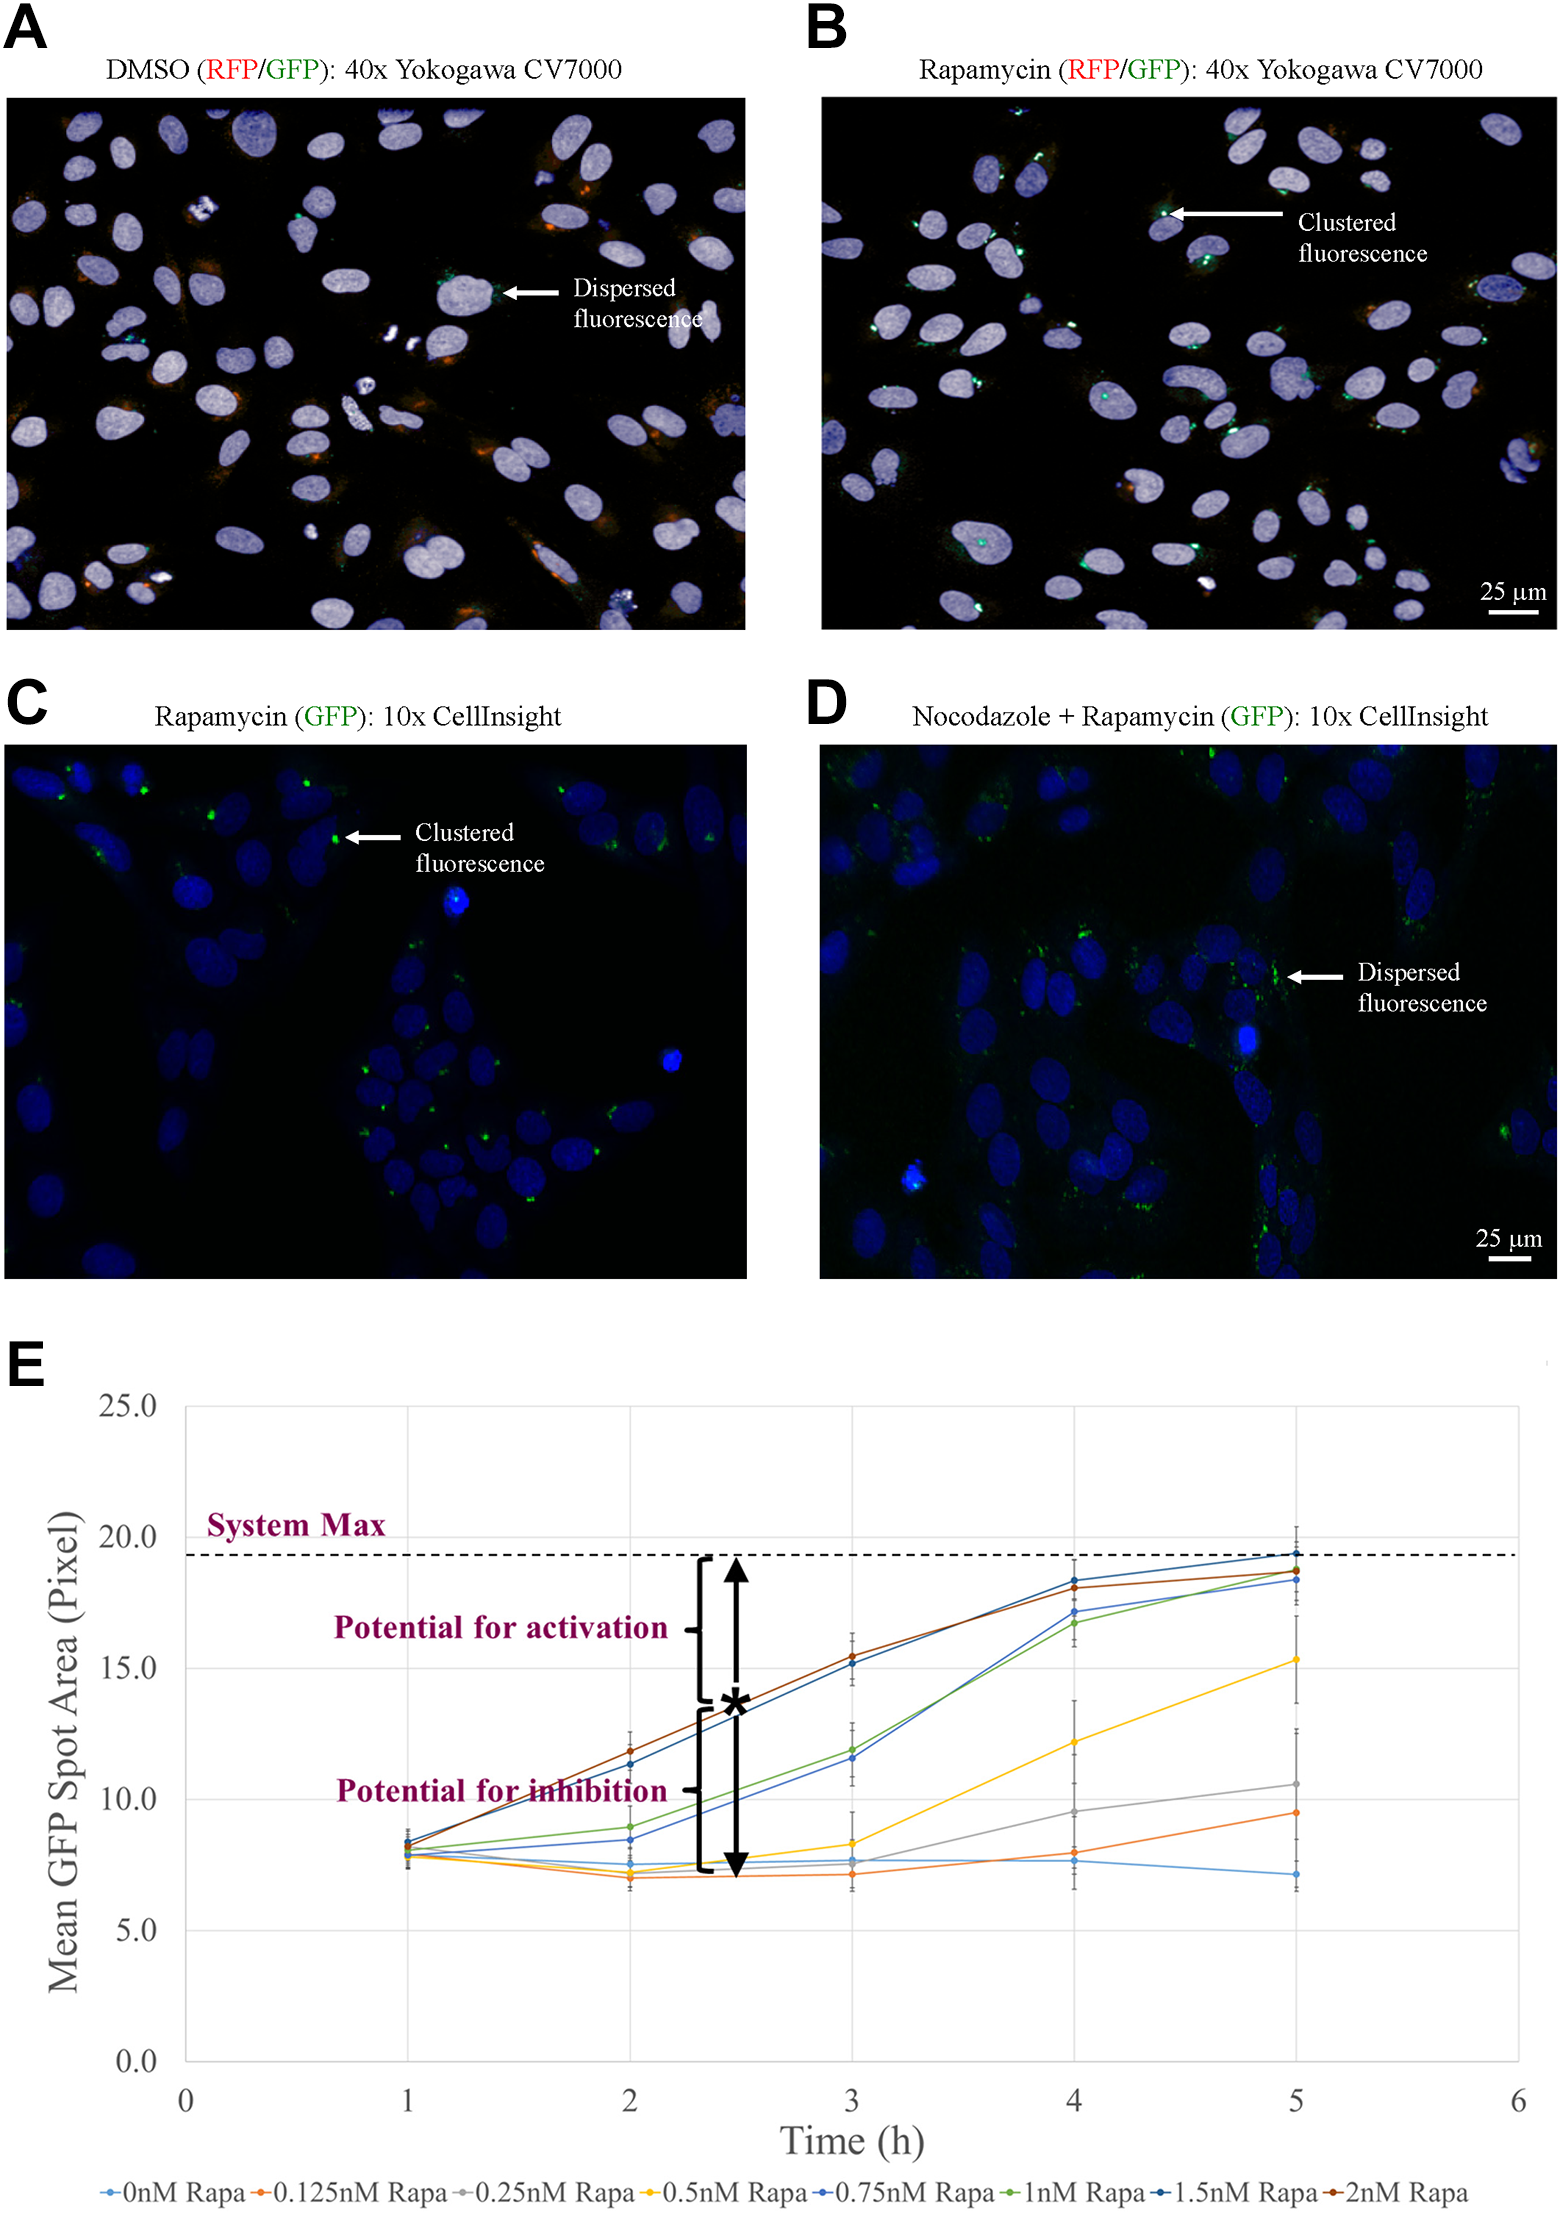
Confirmation of utility of CellInsight imaging and establishment of screening parameters. Images generated by high-magnification confocal microscopy were compared with low-magnification widefield images from the CellInsight. (
To generate a suitable assay endpoint measure, test data comprising unstimulated wells, rapamycin-stimulated neutral control wells (DMSO treated), and rapamycin-stimulated inhibitor control wells (10 µM nocodazole in DMSO) were generated. Analysis of these data was carried out using Columbus image analysis software to create an output that could be assessed using a principal component analysis (PCA) method within Genedata Screener. All output features generated by Columbus were assessed for control separation and found to be most significant for components related to compactness of the fluorescent signal of GFP-BicD2N-FRB (
We reasoned that by configuring the cell system using a submaximal rapamycin concentration and/or an early time point, it should be possible to create an assay window permissive for detecting activators and inhibitors of dynein-based transport in a single assay. Optimization of assay conditions resulted in the establishment of parameters that gave a similar activity window size for both activators and inhibitors for use as an HTS (150 min incubation with 2 nM rapamycin) ( Fig. 2E ).
HTS Assay Validation and Screening
To determine whether the optimized assay met the AstraZeneca HTS validation criteria for single-shot screening, 35 a preliminary set of 1500 compounds followed by a statistically more powerful set of 7000 compounds were screened in duplicate on different days. Cells were preincubated with compounds at a single-point concentration of 10 μM for 30 min, followed by a further 150 min of incubation in the presence of 2 nM rapamycin. Results were compared using a set of statistical tools created in Spotfire (Tibco). The average RZ′ was 0.53, with an average percent coefficient of variation (%CV) of 7 across a plate of neutral controls, which meets our validation criteria (RZ′ > 0.5 and %CV < 10). The level of agreement between the data from the duplicate runs was visualized using a Bland–Altman plot, where the mean of the data for each compound was plotted on the x axis against the difference between the two results on the y axis. The data generated showed good agreement between assay runs and validated the ability of the assay to detect both inhibiting and activating compounds ( Fig. 3A ). The mean of the difference between the data sets was close to zero, indicating very little intrinsic run-to-run variation. The limits of agreement (the 95% limits of agreement give the expected difference between the two measurements for 95% of future measurements) were quite large (approximately ±35%), but in general the compounds classed as inhibitors and activators showed good agreement.
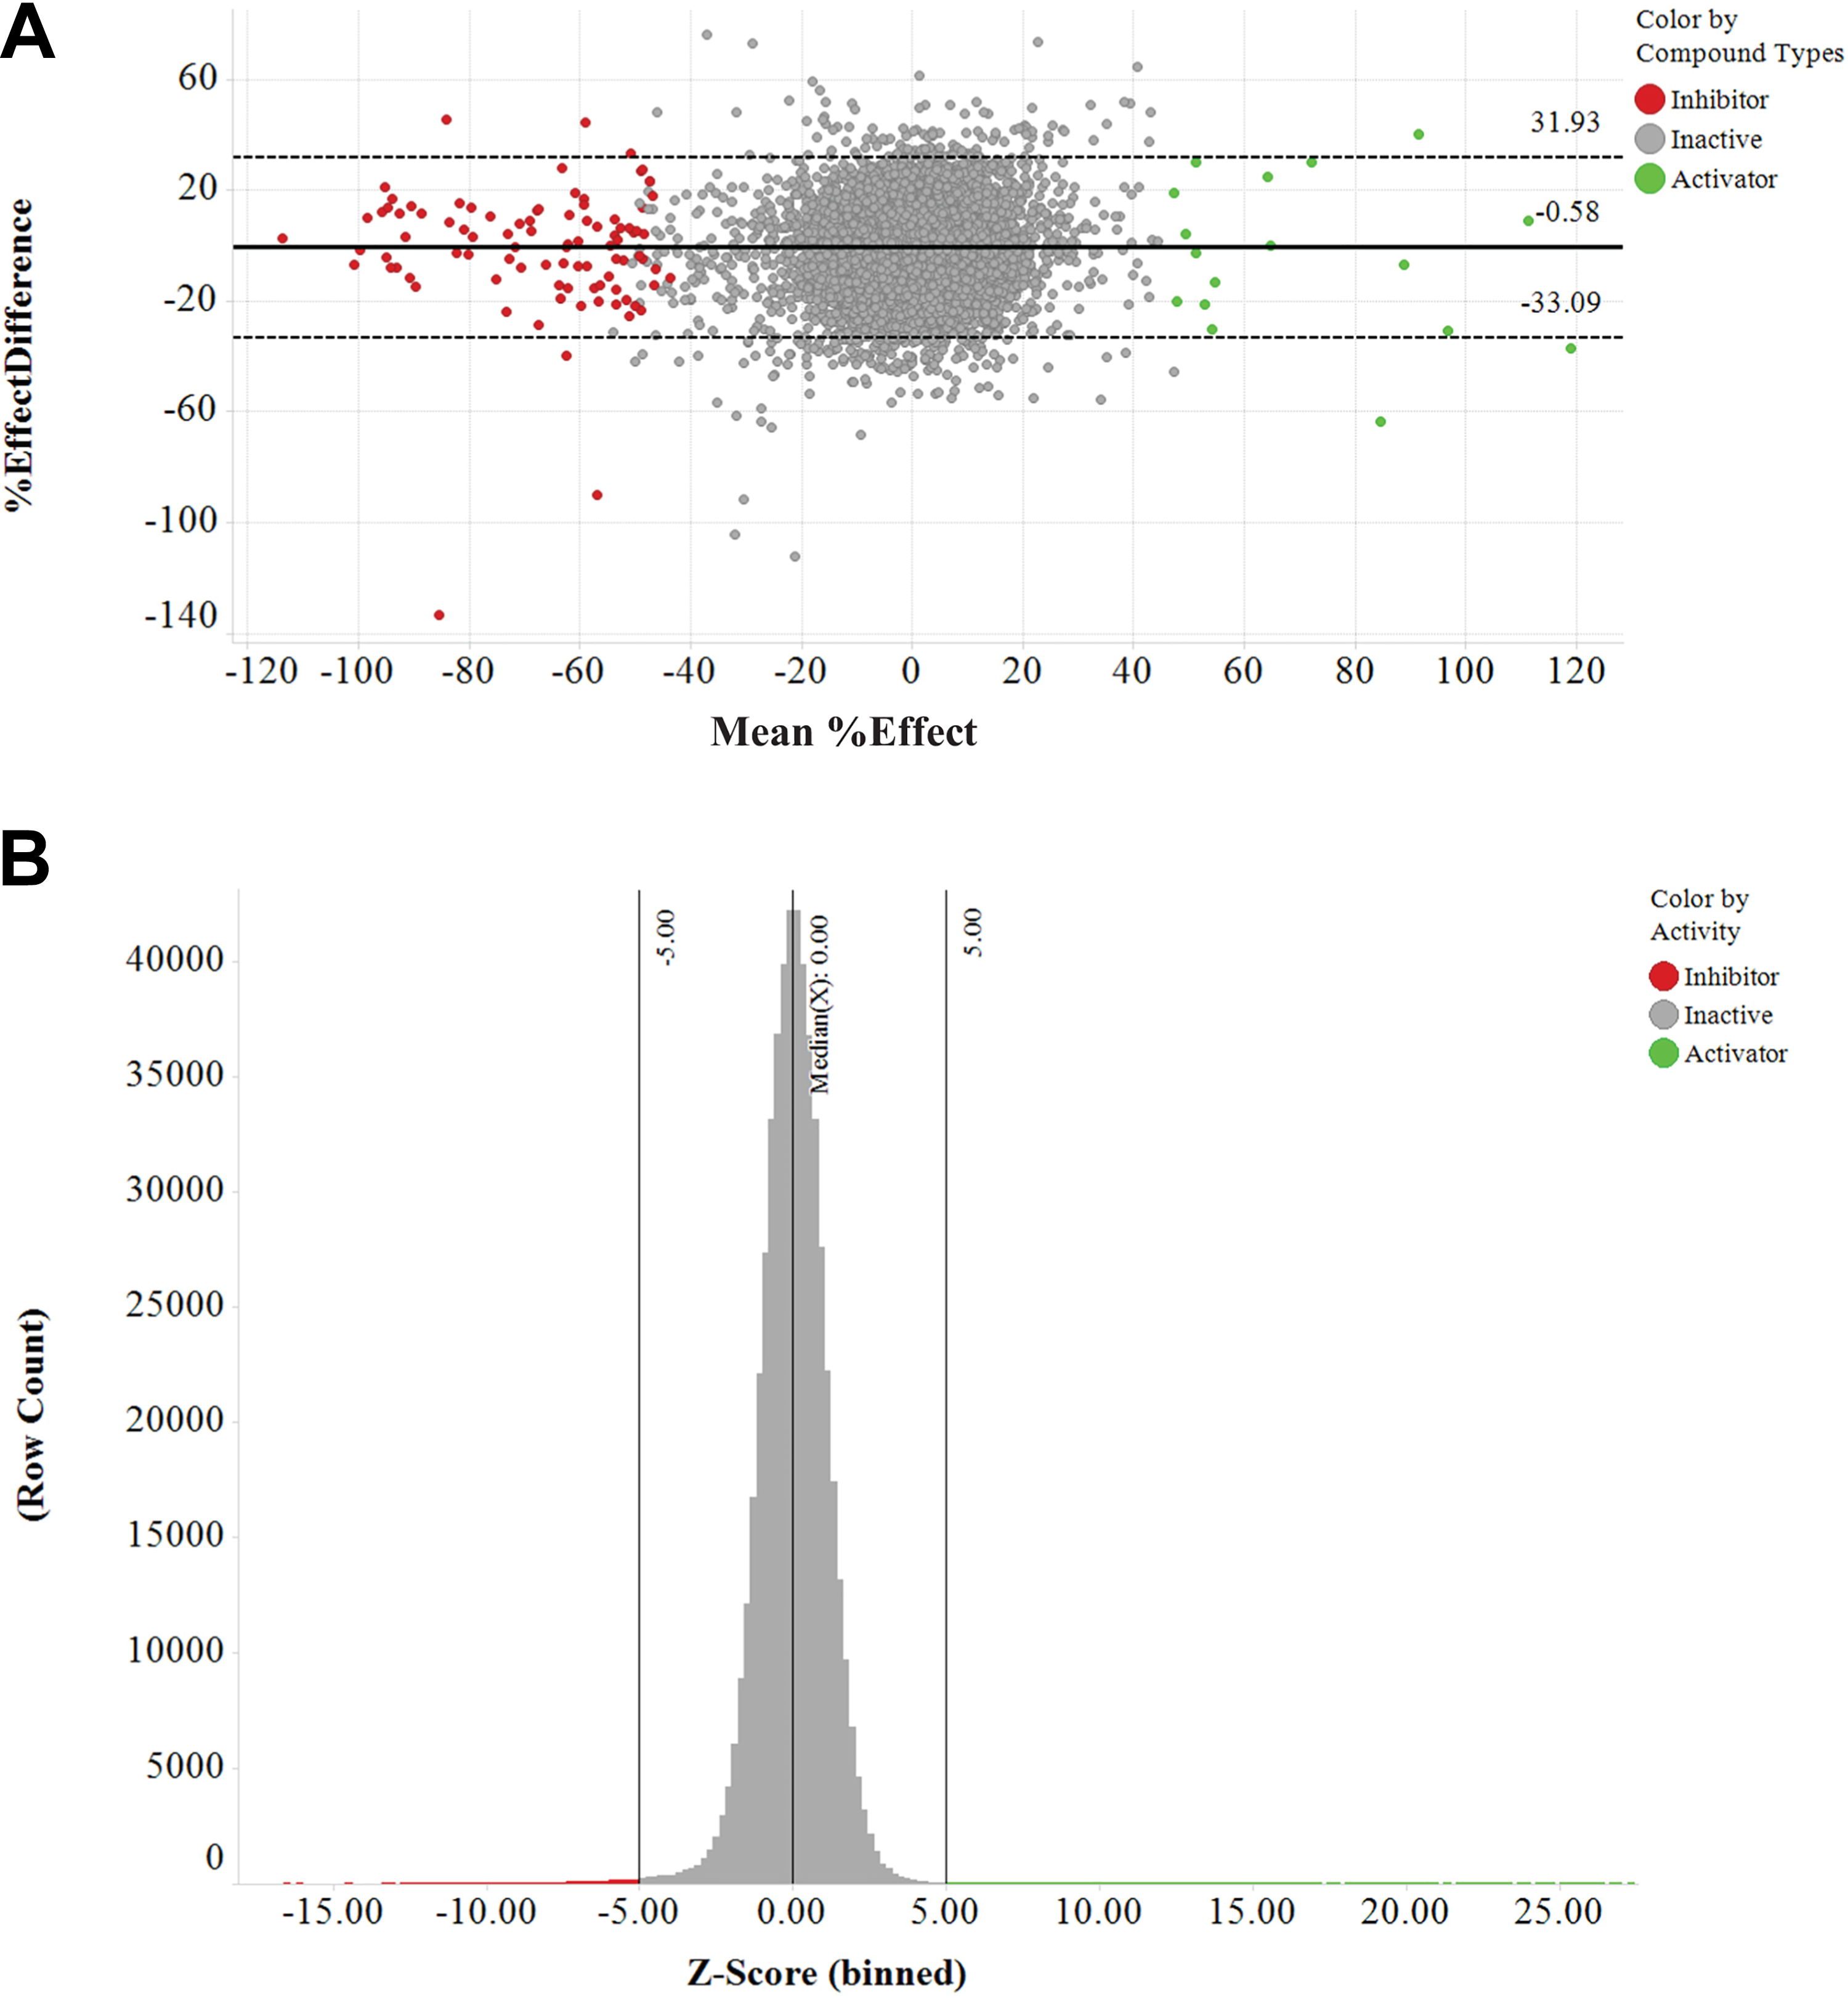
Validation and primary screen data summary. (
In total, 505,500 compounds from the AstraZeneca collection were then screened using the developed assay. The average hit rate was 0.46% for inhibitors (2105 compounds) and 0.10% for activators (430 compounds) using a robust z-score cutoff of –5 for inhibitors and +5 for activators (
Fig. 3B
,
HTS Assay Performance
HTS was carried out over a series of 30 runs, with an average RZ′ value of 0.44 (±0.10) and an average assay window of 2.1 (±0.2) across the campaign. Use of the HighRes CoLAB Flex Cart-to-Cart CellInsight system (
Hit Confirmation by XC50 Screening and High-Resolution Imaging
XC50 validation screening was carried out as a 10-point half-log dilution series with a top and bottom concentration of 30 µM and 1 nM, respectively. Data were processed using Genedata Screener. In XC50 testing, 1786 inhibitors (85%) and 308 activators (72%) from the original HTS were confirmed as active (>30% inhibition or activation at top dose; for data examples, see
Fig. 4A,B
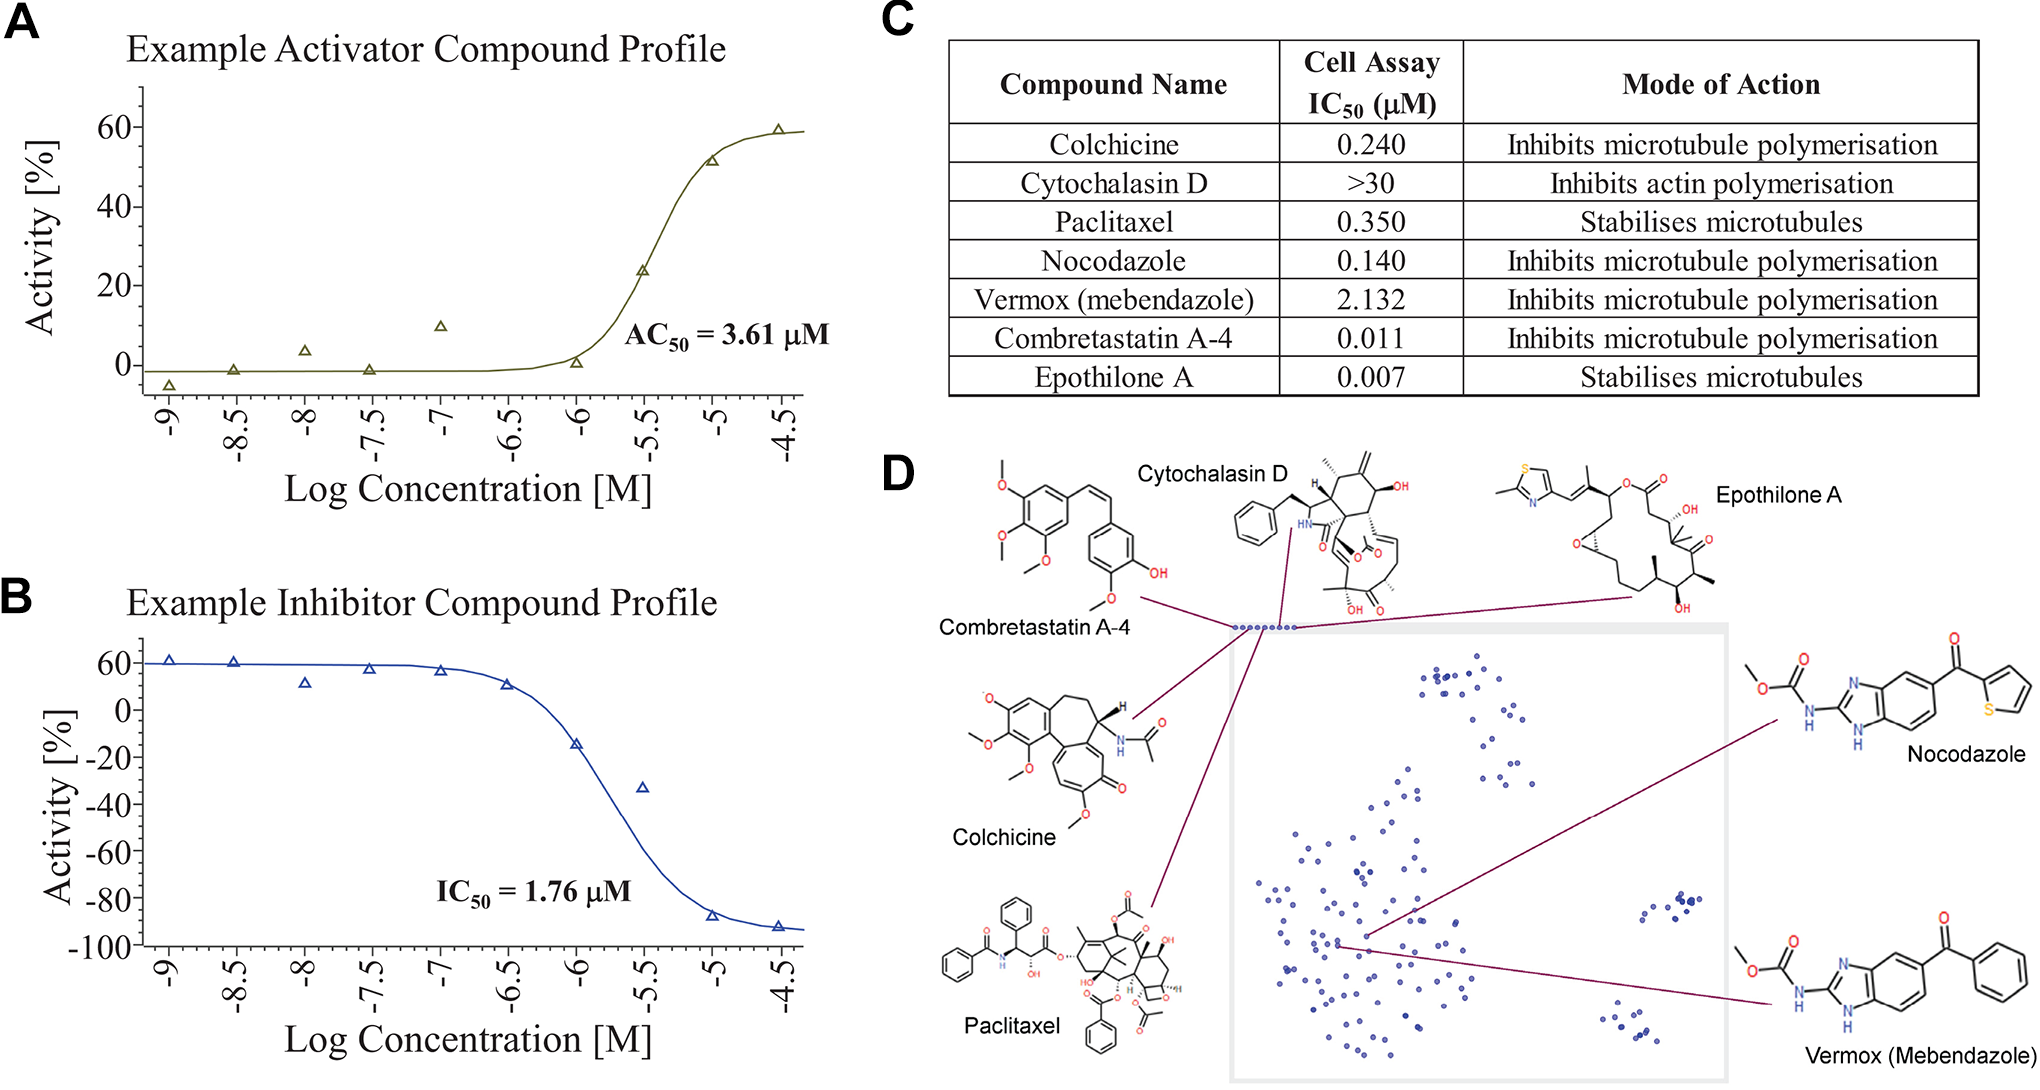
Example curve data, summary of positive controls, and compound clustering. Example XC50 curve data for an activator (
Inhibitor XC50 compound plates were rescreened in a tubulin immunostaining assay to identify and eliminate disruptors of microtubules, which will inhibit dynein-based transport indirectly. Plates were stained with a primary antibody to tubulin and a far-red fluorescent secondary antibody, before imaging using the CellInsight system. The fine, filamentous nature of microtubules meant that it was not straightforward to analyze their integrity using low-magnification, widefield microscopy and automatic image processing methods. However, we were able to develop a method that discriminated between control and nocodazole-treated cells using Columbus software (see Materials and Methods). Using this procedure, 1352 of the 2481 inhibitor hits (54%) from the XC50 assay plates and near-neighbor screen were scored as microtubule disruptors (
The accuracy of the CellInsight-based microtubule analytics was further assessed by manually treating cells with a subset of compounds and assessing microtubule targeting activity by high-resolution confocal imaging (40× oil objective, 1.3 NA) (
From the set of activator compounds and those inhibitor compounds scored as not disrupting microtubules in the CellInsight data, structure clustering and chemistry triaging were carried out to remove those with undesirable structures (e.g., quaternary ammonium salts, metal-chelating complexes, and surfactants) and physicochemical properties (e.g., MW < 600, cLogP < 5.5) or low purity (cutoff of <85%). A filter for frequent-hitter analysis was also applied, which eliminated compounds with abnormally high frequency of activity in previous HTS screens at AstraZeneca (active in >15% of previous screens) and are therefore candidates to have pleiotropic effects. Potential dyes (e.g., coumarin-based dyes) and compounds with structures that closely resembled rapamycin were also removed. A short list for follow-up testing was generated that contained 842 inhibitors and 37 activators (
The activity of a small number of short-listed activator compounds was confirmed by testing them in further XC50 screens containing varied amounts of rapamycin ( Table 1 ). Two of 12 compounds tested were scored as activators of peroxisome relocalization in the absence of rapamycin, meaning that they potentially act analogously to rapamycin by recruiting GFP-BicD2N-FRB to these organelles. One other compound did not reproducibly activate peroxisome relocalization in the presence of rapamycin. Treatment of the parental, unmodified U-2 OS cell line allowed the detection and removal of two additional compounds that were fluorescent and therefore gave false-positive results. In summary, these analyses indicate that 7 of the 12 tested compounds are strong candidates to be bona fide activators of dynein-based transport. Extrapolating from these results, a substantial fraction of the remaining 25 short-listed activator compounds will also be in this category.
Summary of Compound Activities and Modes of Action for Potential Activators of Dynein-Based Transport When Screened in Different Cell Lines at Varying Rapamycin Concentrations.
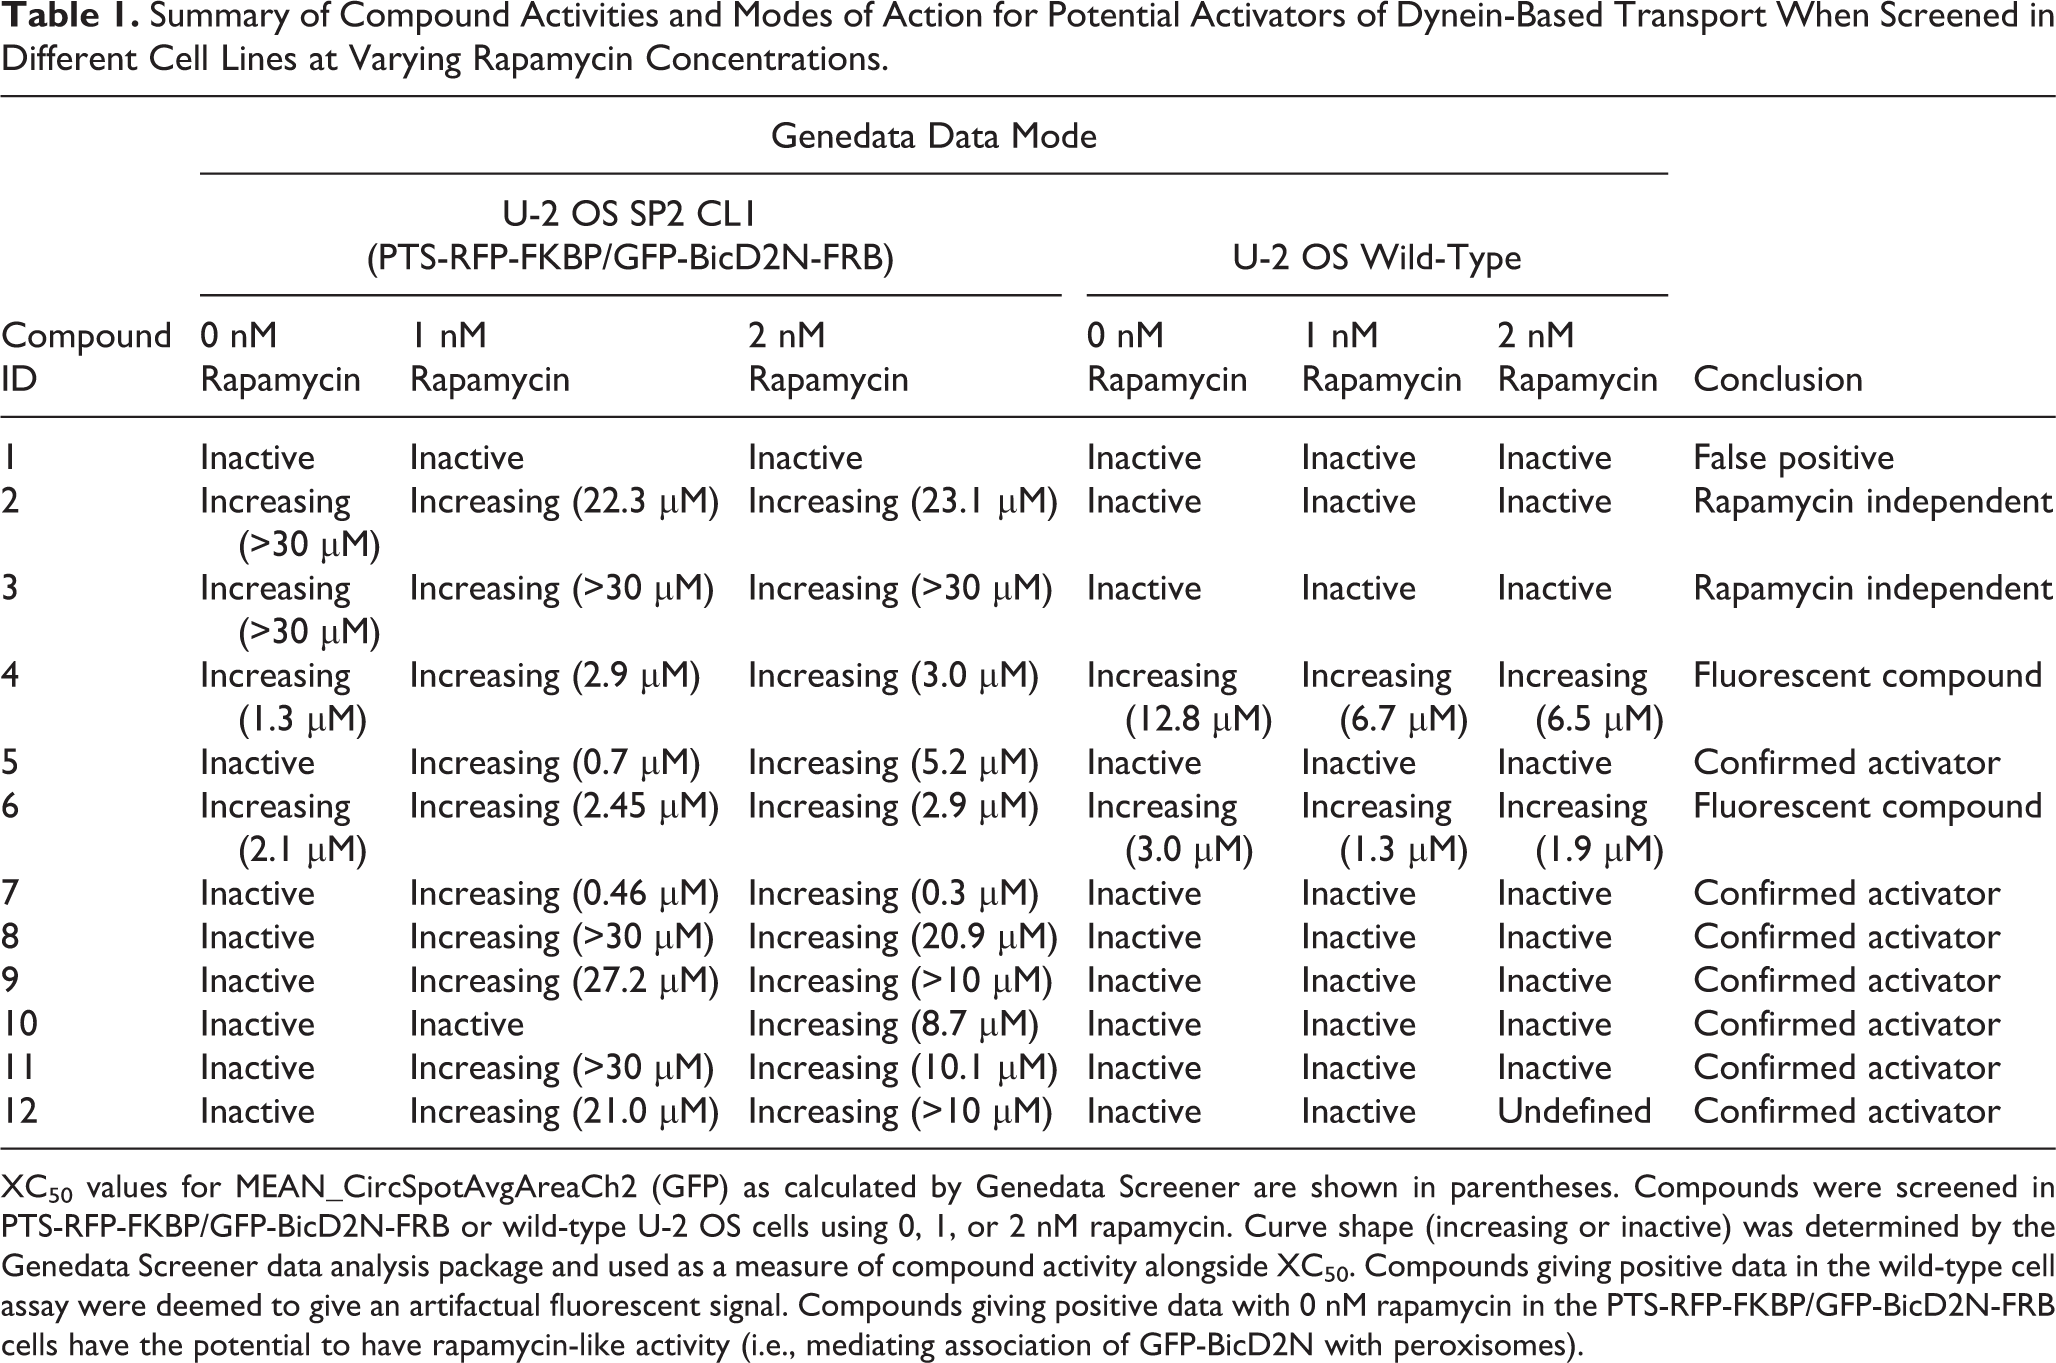
XC50 values for MEAN_CircSpotAvgAreaCh2 (GFP) as calculated by Genedata Screener are shown in parentheses. Compounds were screened in PTS-RFP-FKBP/GFP-BicD2N-FRB or wild-type U-2 OS cells using 0, 1, or 2 nM rapamycin. Curve shape (increasing or inactive) was determined by the Genedata Screener data analysis package and used as a measure of compound activity alongside XC50. Compounds giving positive data in the wild-type cell assay were deemed to give an artifactual fluorescent signal. Compounds giving positive data with 0 nM rapamycin in the PTS-RFP-FKBP/GFP-BicD2N-FRB cells have the potential to have rapamycin-like activity (i.e., mediating association of GFP-BicD2N with peroxisomes).
Finally, we further validated short-listed compounds in new peroxisome relocalization assays that were analyzed using high-resolution confocal imaging (40× oil objective, 1.3 NA). We first selected four inhibitor compounds that were not related to each other structurally and were among those found not to disrupt microtubules in our previous high-resolution analysis. Strong inhibition of dynein-based transport by each of these compounds was evident in the raw images (
Fig. 5A
), and this was confirmed by automated analysis of mean GFP spot intensity per cell (
Fig. 5B
). We next selected one short-listed activator and confirmed that it accelerates dynein-based trafficking to the MTOC in the peroxisome relocalization assay using the same analysis pipeline (
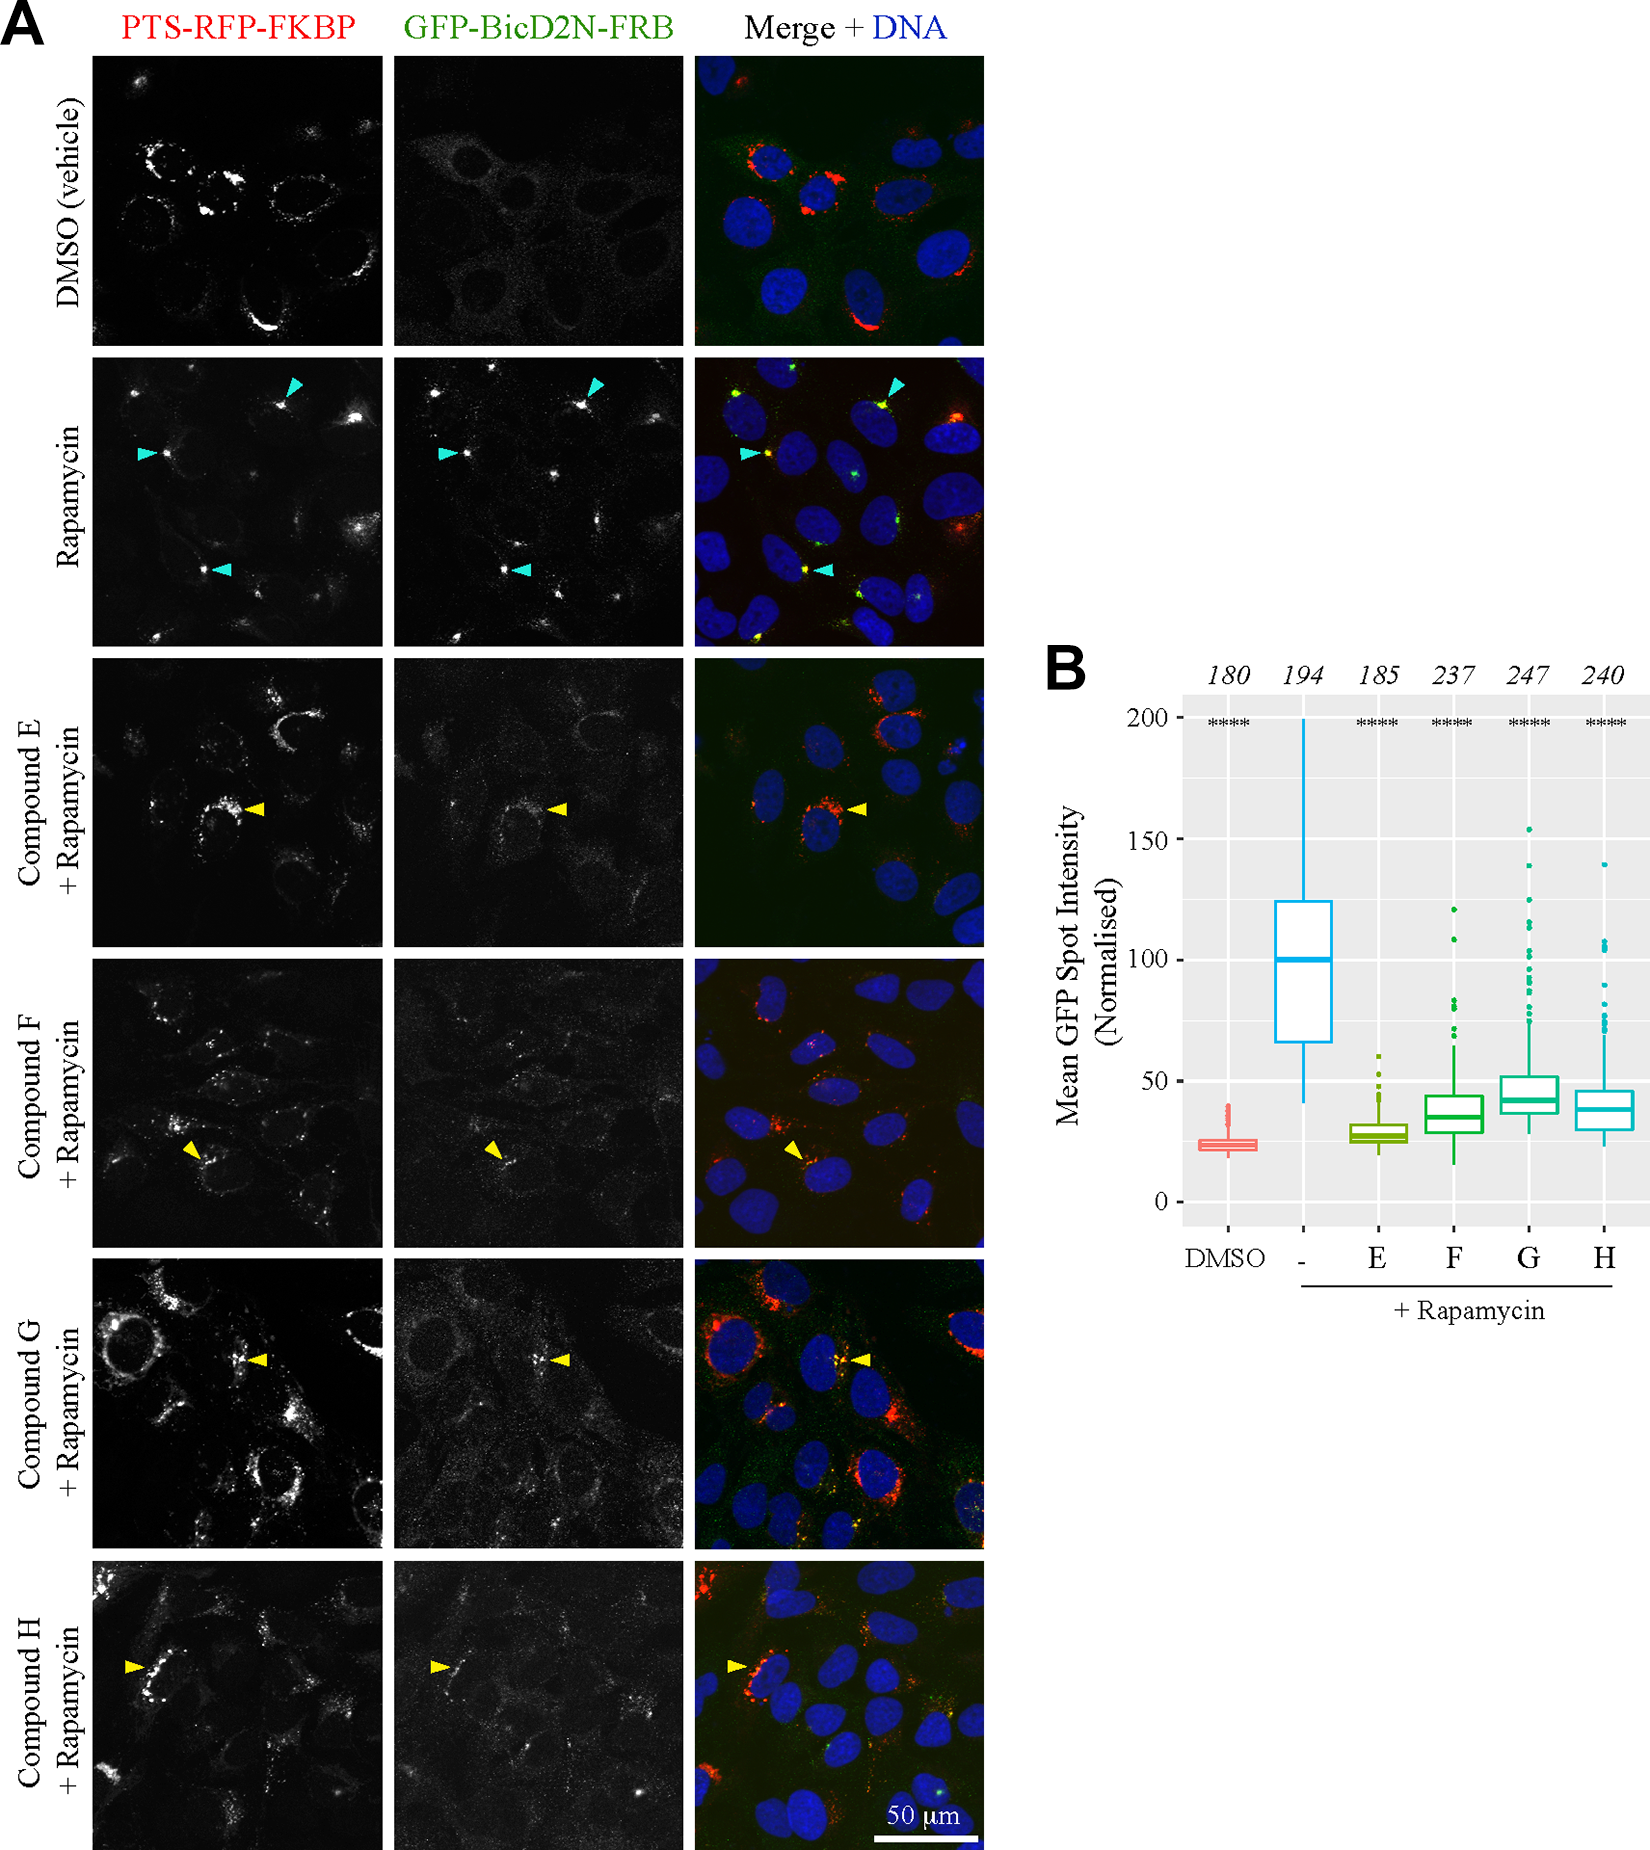
Further validation of a subset of inhibitors with high-resolution imaging. (
Discussion
A dual-labeled cell line expressing a rapamycin-inducible system for linking activated dynein complexes to peroxisomes was generated to monitor dynein-based transport within live cells. Corroborating previous results, 28,29 chemically controlled tethering of dynein to peroxisomes with this system allowed tightly regulated translocation of these organelles toward the perinuclearly positioned MTOC.
Developing an imaging assay that can identify both the inhibition and activation of dynein-based transport and is suitable for screening more than 500,000 compounds required several adjustments to previously described protocols. Robust and reproducible peroxisome relocalization was achieved by serum starvation, while the use of multiple imaging platforms allowed validation of data acquisition and selection of features in image analytics that ensure a robust assay (RZ′ ∼ 0.5). This report is the first demonstration of the HighRes CoLAB capability to generate complex workflows through a flexible combination of different automation and instrumentation. The use of these systems in this project demonstrates that a high level of reliability can be achieved, which is compatible with out-of-hours operation.
Following successful assay validation, a 500,000-compound HTS was completed, resulting in the identification of 2105 candidate inhibitors and 430 candidate activators. XC50 screening (30 μM top dose) confirmed the activity of 1786 inhibitors and 308 activators (>30% activity) from the original screen and 695 inhibitors and 113 activators from a near-neighbor screen.
The hits from the XC50 analysis were assessed using a high-throughput tubulin immunostaining assay to identify potential microtubule disruptors. Future work will involve using high-resolution confocal imaging to confirm which short-listed compounds have microtubule-disrupting activity. While such compounds would be excluded from efforts to develop direct inhibitors of the dynein transport machinery, they may be candidates to develop as microtubule targeting agents for therapeutic purposes. 36,37
Inhibitors of dynein-based transport that were not scored as microtubule disruptors, and activators confirmed through XC50 screening, were assessed by a process of triaging to remove compounds with undesirable structures and poor physicochemical properties or which were frequently found in other cellular HTS screens. This resulted in 842 inhibitor and 37 activator compounds.
The short-listed molecules were subjected to clustering analysis based on structural similarity using a Tanimoto distance cutoff of <0.3. Whereas all activators were singletons, a large number of diverse clusters (>50) were observed for the inhibitors (
We also established methods for the identification of undesirable activation modes in the assay for dynein-based transport, including the ability of compounds to activate transport in the absence of rapamycin or give an artifactual fluorescent signal. These assays will be extended to the full set of activators from the XC50 analysis in the future.
Finally, we performed additional analysis of a subset of short-listed inhibitors and activators with high-resolution confocal imaging, which corroborated the ability of the screening platform to identify interesting lead compounds.
In summary, innovative assay development, the use of cutting-edge HTS automation, and sophisticated imaging analysis tools resulted in a robust assay capable of detecting two outcomes in a single screen: activation and inhibition of dynein-based cargo transport in cells. Identified compounds were subjected to a series of cascade assays that iteratively provide information about compound mode of action. The primary objective for the future will be to characterize the molecular mechanisms by which the short-listed activating and inhibiting compounds modulate dynein-based transport. This work is ongoing and includes in vitro assays for the activity of compounds toward the purified dynein motor in the presence and absence of dynactin and activating adaptors. It is anticipated that this project will yield further publications and form the basis of an expanded drug discovery collaboration between AstraZeneca and academic partners.
Supplemental Material
Supplemental_Material_Dynein_Screen_Vincent_et_al - A High-Throughput Cellular Screening Assay for Small-Molecule Inhibitors and Activators of Cytoplasmic Dynein-1-Based Cargo Transport
Supplemental_Material_Dynein_Screen_Vincent_et_al for A High-Throughput Cellular Screening Assay for Small-Molecule Inhibitors and Activators of Cytoplasmic Dynein-1-Based Cargo Transport by John Vincent, Marian Preston, Elizabeth Mouchet, Nicolas Laugier, Adam Corrigan, Jérôme Boulanger, Dean G. Brown, Roger Clark, Mark Wigglesworth, Andrew P. Carter and Simon L. Bullock in SLAS Discovery
Footnotes
Acknowledgments
We acknowledge the work carried out by Aurelia Bioscience Ltd., which was employed to manage the transfected cell line generation, create bulk volumes of a selected line, and conduct preliminary assay development work. We also acknowledge SAL Scientific, which was employed by Aurelia Bioscience Ltd. to generate a number of transfected cell lines for selection.
Declaration of Conflicting Interests
The authors declared no potential conflicts of interest with respect to the research, authorship, and/or publication of this article.
Funding
The authors disclosed receipt of the following financial support for the research, authorship, and/or publication of this article: All work within this publication has been funded by the Medical Research Council in collaboration with AstraZeneca as part of the agreement to form the UK Centre for Lead Discovery. Additional work in the laboratories of A.P.C. and S.L.B. is supported by core funding from the Medical Research Council (file reference numbers MC_UP_A025_1011 [A.P.C.] and MC_U105178790 [S.L.B.]).
Supplemental material is available online with this article.
References
Supplementary Material
Please find the following supplemental material available below.
For Open Access articles published under a Creative Commons License, all supplemental material carries the same license as the article it is associated with.
For non-Open Access articles published, all supplemental material carries a non-exclusive license, and permission requests for re-use of supplemental material or any part of supplemental material shall be sent directly to the copyright owner as specified in the copyright notice associated with the article.