
Abstract
Adequate characterization of chemical entities made for biological screening in the drug discovery context is critical. Incorrectly characterized structures lead to mistakes in the interpretation of structure–activity relationships and confuse an already multidimensional optimization problem. Mistakes in the later use of these compounds waste money and valuable resources in a discovery process already under cost pressure. Left unidentified, these errors lead to problems in project data packages during quality review. At worst, they put intellectual property and patent integrity at risk. We describe a KNIME workflow for the early and automated identification of these errors during registration of a new chemical entity into the corporate screening catalog. This Automated Structure Verification workflow provides early identification (within 24 hours) of missing or inconsistent analytical data and therefore reduces any mistakes that inevitably get made. Automated identification removes the burden of work from the chemist submitting the compound into the registration system. No additional work is required unless a problem is identified and the submitter alerted. Before implementation, 14% of samples within the existing sample catalog were missing data on initial pass. A year after implementation, only 0.2% were missing data.
Introduction
For an industry that is already under significant cost pressures, any efficiency gain to the process of discovering new drugs is desirable. 1 The sequential processes of hit to lead and lead optimization take a known chemical starting point through to a clinical candidate. Around 2000 compounds are typically synthesized and tested for their desired activity in order to derive a clinical candidate. Throughout this process, it is critical to ensure that the compounds under test are structurally correct, pure, and uniformly present. Incorrectly characterized structures, even though they may be tested and discarded due to inactivity, result in the misinterpretation of structure–activity relationships. This greatly confuses an already complex process of optimizing in vitro and in vivo bioactivity, ADME (absorption, distribution, metabolism, and excretion), and toxicity. These internally synthesized compounds are frequently reused on other projects within the context of the hit identification process. Hit identification is the search for good-quality starting points on new projects. Multi-million-sample compound libraries from externally purchased and internal sources are usually screened against suitable disease models.2–4 This data-intense process again necessitates high-quality characterization of the compounds under test.5,6 The advent of new machine learning and artificial intelligence methods is predicated on large amounts of data to produce powerful predictive models. In this context, the data quality of even historical closed projects has a powerful reuse value. The promise to unlock old data in Pharma companies to produce new insights and streamline the discovery of chemical entities will be limited by the quality of the models. These in turn are limited by the quality of the data, including the compound characterization. Left unidentified, characterization errors can endanger intellectual property, such as the recent case of the oncology drug ONC201, where an incorrect structure in a patent filing resulted in a complex and costly legal dispute. 7
For every sample synthesized and registered into the corporate collection at Eli Lilly, the minimum requirements for characterization can be defined as a liquid chromatography–mass spectrometry (LCMS)8,9 and 1H nuclear magnetic resonance (NMR) spectrum of sufficient quality. Additional data such as multiple NMR experiments for mixed isomers or enantiomeric excess/optical data for chiral molecules may also be gathered. For nonchromophoric compounds, an LCMS is still required to show purity and correct mass. It is also necessary for these spectra files to be unambiguously found. When registering a newly synthesized batch of a compound into the corporate collection, the synthetic chemist is required to submit a 2D-drawn chemical structure. This is assigned a unique identifier (a Lilly Serial Number [LSN]) and a lot number (batch). If multiple batches of the same compound have been synthesized over time, a single LSN will have multiple associated batch identifiers. Each batch identifier will also cross-reference any lab book number and associated analytical data files. A core feature of the Lilly registration system is this link between the structure, its assigned LSN and associated lot number(s), and the file name of any instrument analysis data. For legacy reasons, it was not possible to enforce checking of this full association and file existence upon registration. Before 2016, no process was in place to validate that the instrument analysis data were in place and that the data matched the claims.
The traditional approach to verification of structures made in medicinal chemistry efforts is for the synthesizing chemist or analyst to run orthogonal characterization methods (typically LCMS and NMR). This is then followed up with a manual assignment of data to determine the consistency of the registered structure. Computational tools are required to deal with the large number of samples when checking the validity of these assignments, or to make determinations in a high-throughput manner. Many computational tools exist that help with the interpretation of analytical data. At one end of the spectrum, NMR prediction software generates spectra that can be compared manually to the experimentally derived spectra. Typically, this is done by a database approach, using a large database of assigned NMR structures, together with Hierarchically Ordered Spherical Environment (HOSE) codes 10 to select relevant ones from that database based on similarity. Semiempirical and ab initio approaches also exist.11,12 The latter have been of increasing importance in recent years, but the speed of the database approach is important in high-throughput environments. At the other extreme, Computer-Aided Structure Elucidation (CASE) 13 programs take a complete set of LCMS and 1D and 2D NMR data and generate all structures consistent with the spectra.
Perhaps the most useful approach within the context of validating structures, though, is Automated Structure Verification (ASV).14–17 The process does not answer the question, “What is the structure?” but instead answers the question, “Are the analytical data consistent with the proposed structure?” Although this is a less precise question, it is typically a much more pragmatic question to ask, considering that the outcome of the reaction used to synthesize a product is likely to be known. This seems an even more reasonable simplification if we consider the typical errors made—a question that will be addressed later in this work.
Given the concerns over such characterization errors, we developed a Konstanz Information Miner (KNIME) workflow that could integrate multiple systems to cross-check this analytical data with the proposed structure. The workflow can automatically run at the time of registration. It can also be applied retrospectively across the corporate collection. Automation removed the burden of work from the chemist submitting the compound into the registration system. Automation at scale also saved many hours of work back-checking compounds in the corporate compound library.
Materials and Methods
Infrastructure
Many ASV systems, both commercial and academic, have been developed over the years, and the approach itself is not new. However, such software typically runs as a stand-alone desktop application with visual interaction required by the end user. Integration points into wider systems, required for an automated enterprise-level system, are not always obvious. Using web services to create a service-oriented architecture is a well-established way to enable separate systems to be connected together to create new applications. 18 Web services provide the core functionality of a software application over web protocols via an application programming interface (API) rather than a visual interface. To this end, a web service wrapper was created for a console version of the MestReNova software package. 19 This web service allowed the reuse of the verification functions in different applications via the API. Verification is ideally suited to this approach as it takes simple inputs, such as an analytical data file and putative chemical structure file, and produces a simple output, chief among which is the score.
Web services were already available for both the corporate registration system (structures) and the system that stores all sample analytical data files named ATPortal. The web service for the corporate registration system provides a chemical structure in SMILES or SDF format for any given LSN. The ATPortal service provides a Uniform Resource Location (URL) for any analytical instrument file (NMR and LCMS) associated with a sample. The returned URLs are a direct reference to a file store location from which the physical file can be retrieved. All web services and the file share are protected by an authentication layer to prevent unauthorized users from accessing company confidential information. In the workflow described below, all system and data access was carried out from KNIME via the relevant web service.
Structure Verification Workflow
A multistep process has been put in place, encoded in a single KNIME 20 workflow that added a robust verification on top of the existing compound registration process. Every night, an automated workflow runs on the KNIME server to look for new registrations in the corporate collection. The workflow then reads from a database of results from previous ASV runs, which tracks the current status for all entries (named the ASV Database). For each new entry that has not been assessed using ASV, or that needs reassessment, the associated chemical structure and analytical data files are retrieved from ATPortal. Samples with missing data are immediately flagged for review and the entry failed. If instrumentation files are present, they are retrieved and submitted into the automated ASV service. This returns the match of the analytical data to the proposed structure as a score. If multiple supporting data are available from a given analytical method, all results are assessed. Only the best result is kept and used for the final scoring. The resulting score indicates how likely it is that the structure is correct. If a registered structure lot passes the threshold score described above, it will pass with no action. Should the registered structure lot fail this process, it is immediately flagged for review and the lot failed. In the case of a lot failing and being marked for review, an email is immediately sent to the submitter to alert them of the problem. If individual failures are sent to the submitter (synthetic chemist), a full report of all structures and their assessment outcome is sent to the analyst for review. In all cases, the results are stored in the ASV Database to allow quick access to the complete list of samples needing review by an analyst. If simple problems have occurred such as mislinked analytical data, a synthetic chemistry submitter can edit and relink the supporting data back in the registration tool. In subsequent runs, the workflow will reassess the new data and repeat the process of passing the lot or reflagging it for review. This entire process is shown in Figure 1 .
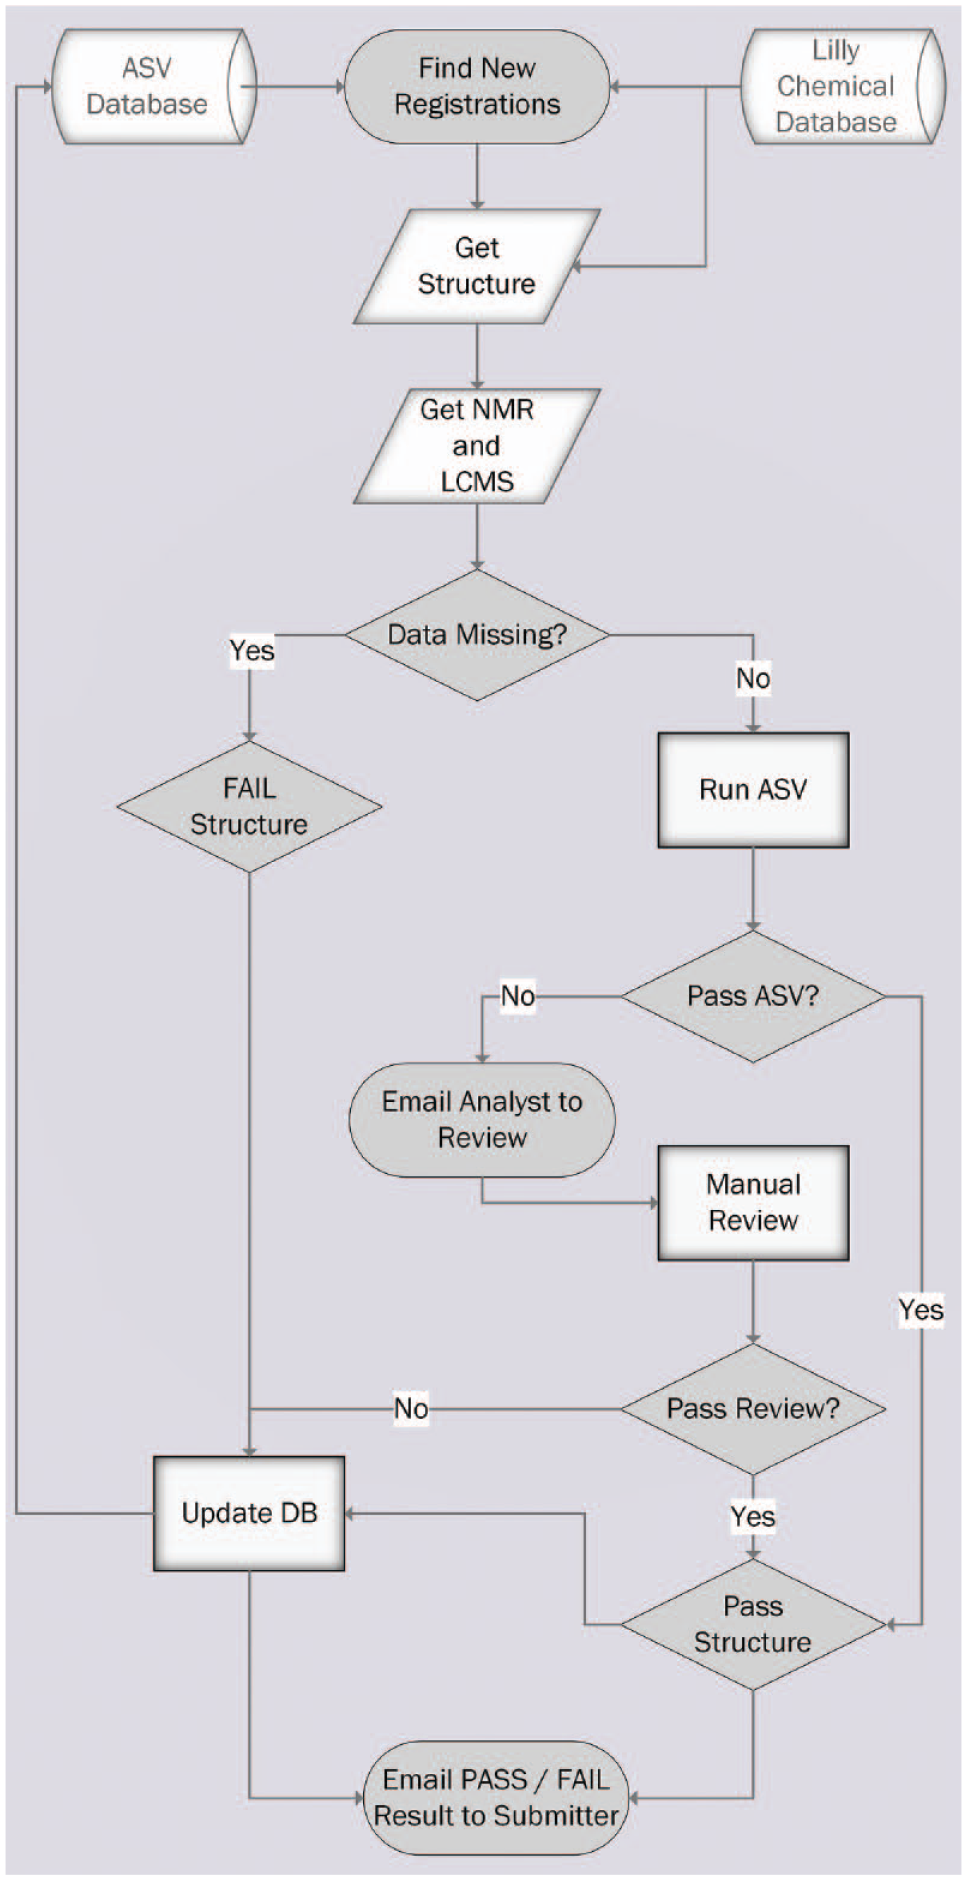
Automated Structure Verification process flow diagram.
KNIME Workflow Development
The workflow was written using the KNIME client version 3.3. Once complete, the workflow was deployed and scheduled to run once every 24 h on the corresponding version of the KNIME server. The KNIME Database Connector nodes were used to read and write from the ASV Database. The Generic Webservice Client node and REST nodes were used to connect to the various web services. The Authenticated File Reader node was used to get analytical instrument files from the specified URLs. During the handling of all sample chemical structures, the RDKit nodes were used to remove common salts. The Row Filter node was used to apply the threshold score for pass or fail decisions. The String and Data Manipulation nodes were used throughout, to clean and manipulate data into the desired format. The Email node was used at the end of the workflow run, to inform submitters of any failed samples. Due to the open-source nature of the KNIME product, it was highly amenable to internal development efforts, producing modifications of existing nodes or new in-house nodes using an agile development approach. Custom Java development was done to add authentication handling code to the Generic Webservice node. This Java code was open sourced to KNIME and has been incorporated into KNIME version 3.0 onward. The Authenticated File Reader node was also developed internally for this workflow and has been released within the Erl Wood open-source node collection. 21 The workflow took around 8–12 weeks to develop and test excluding any Java code or database development. Later versions of the workflow, used internally, had nodes developed for each of the web services being accessed. These internal custom nodes allow greater ease of use when this and other related workflows were developed, but essentially encapsulate the same functionality as the Generic Webservice nodes.
Setting the Threshold for Action from Validation Data
Most packages that implement automated structural verification provide a score of some kind, which is a measure how well the data fit the proposed structure. This score is key to deciding actions for samples, with a threshold being set for decisions on what to do with individual samples. For this work, we used the score metric from the MNova Verify software package. 22 Our strategy was to use a simple two-state system of pass or fail. But regardless of the details of any individual ASV score, there will clearly always be a trade-off in performance between avoiding false positives (where the structure is wrong but we conclude it is correct based on the score) and reducing false negatives (where the structure is correct but we conclude it is wrong based on the score). In other words, if we raise the threshold that triggers an action, this will reduce the number of false positives but increase the number of false negatives. Conversely, lowering the threshold will give more false positives but less false negatives. Perhaps a better way to consider the output is to ask what false-negative rate we are willing to tolerate, and what false-positive rate this would imply.
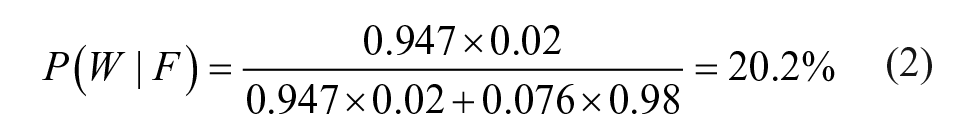
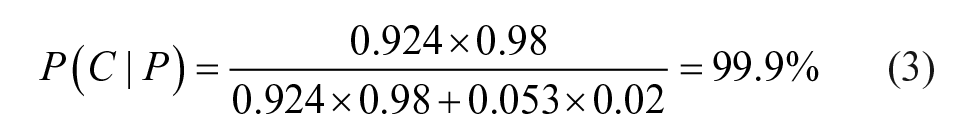
The score threshold for triggering actions therefore needs to be chosen carefully. To investigate this, we used a validation set of 1400 spectra (with their associated compound structure) that had been manually graded by an experienced spectroscopist. The compound structure pairs labeled as correct were tested directly by ASV. A threshold was applied to the resulting score to arrive at a probability that a compound would fail ASV, given that it is correct, P(F|C). As these were all confirmed correct pairing, they are not useful to obtain a false-positive rate. Instead, to arrive at the probability that a structure will pass given that it is wrong, P(P|W), we cross-validated a matrix of incorrect structure/spectra pairings. As above, a threshold was applied to the score to arrive at a probability. The ASV score from MNova is scaled from −1 to +1, so an initial default score threshold of 0 was used to classify samples, but we also studied how the performance varied as a function of the threshold.
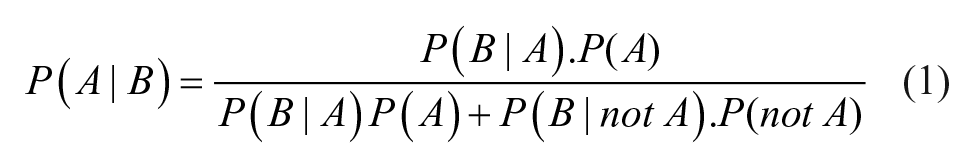
For a given score threshold, we can therefore determine P(P|W) or the probability of a sample being labeled a “pass” despite being wrong (false positive). We can also calculate P(F|C) or the probability of a sample being labeled a “fail” despite being correct (false negative). However, these probabilities can be misleading as they neglect the intrinsic probability that a structure is correct. What we require is the probability that a structure is wrong given that the ASV score is a pass (P(W|P)), and the probability that it is correct given that it is an ASV fail (P(C|F). Such an inversion requires the use of Bayes formula, where P(A|B) represents the probability of event A, given B, as in eq 1:
Manual analysis of this initial validation set showed the prior probability of a structure being wrong, termed P(W), as 2%. Conversely, the probability of it being a correct structure was 98%, termed P(C). This needs to be considered to arrive at a threshold that will result in a manageable number of follow-up actions.
Results and Discussion
Validation Set
Using an initial score threshold of zero, the false-negative rate P(F|C) was 7.6%, whereas the false-positive rate P(P|W) was 5.3%. Inserting these numbers into the above formula, the probability that an ASV fail is really the wrong structure is shown in eq 2:
The probability that an ASV pass is really the correct structure is shown in eq 3:
The net result of this analysis is that an ASV pass is almost certainly a true pass. Conversely, most negatives turn out to be false negatives, because negatives are very rare in the data set anyway. This realization led us to conclude that we had no alternative but to manually review fails. This becomes a policy of review by exception, where all passes are left unchecked, but any fails are reviewed by a chemist or an analyst. This is exacerbated by the fact that customers of the system are likely to be highly intolerant of submissions being flagged as suspect when they deem them to be correct.
From the above analysis, we concluded that, using the default thresholds, the likely number of reviews would be more than we had the resources to carry out: with a P(W|F) of only 20%, only one in five samples flagged for review would truly be fails. By choosing a threshold of −0.3 for the score, P(W|F) and P(C|P) change to 35.5% and 99.8%, respectively. That is, now only one in three samples are predicted to be false negatives. Thus, for only a modest decrease in uncertainty over positives, we will have significantly fewer false negatives, resulting in a much reduced level of manual review. We effectively balanced the likelihood that most structures are correct, the need to avoid false positives, and the review burden to a level we thought was acceptable. There is, of course, no correct answer for the threshold—only one that optimally balances the resource one is prepared to spend and the risk one is willing to take.
Historical Compliance
One of the drivers for setting up ASV was a survey of historical compliance. From a manual assessment of several hundred compounds, it was determined that around 12% had missing NMR or LCMS data. Further, around 20% of samples had ambiguous data, where it was not immediately clear which NMR or LCMS had been used for characterization. In addition, manual analysis revealed that around 5% of samples had issues according to the analytical data. The majority of these were poor purity, but around 2% overall had an incorrect structure registered. Although the issue was not huge, the consequences of these errors could be far reaching in the future, from either incorrect compounds making their way into screening collections, incorrect SAR deductions, or potential intellectual property implications. Any process to check such data will never completely remove this risk. Instead, we sought to reduce the risk without creating a large work overload for a synthesizing chemist or reviewing analyst.
Postimplementation Impact
One year from implementation, the system had processed more than 38,000 samples. The statistics for compliance were very similar to those in the initial survey carried out before implementation. Fourteen percent of samples were missing data on initial pass, but only 0.2% were missing data at the end of the period; that is, the notification system had made the submitter fix the problem in the majority of cases. A total of 6.4% of the samples were flagged for review by the ASV score. Of these, approximately 0.5% were found to be incorrect. Although this is a small overall number, as mentioned above, the consequence of such errors could be disproportionately large. In a typical example, one of the first compounds flagged for review by the system had an incorrect mass. This indicated a mass unit 1 greater than the expected base structure. After consultation with the chemist, a drawing error was identified where a “CH” had not been changed to an “N” in the 2D chemical sketch. Indeed, a review of the reasons for failure showed that such drawing errors were the main reason for the mistakes, rather than a gross misinterpretation of the data. Other typical errors included mixing up two physical samples, using the incorrect lot number on registration, assigning a lot to the wrong structural identifier, or running the analytical data with an incorrect lot number. Such errors are all based on minor typographical problems that people easily make but are hard to detect. Computers, on the other hand, excel at such tasks. Figure 2 shows the score and analytical data for a correct and highly scored compound. Figure 3 shows some typical errors that were observed for low-scoring compounds.
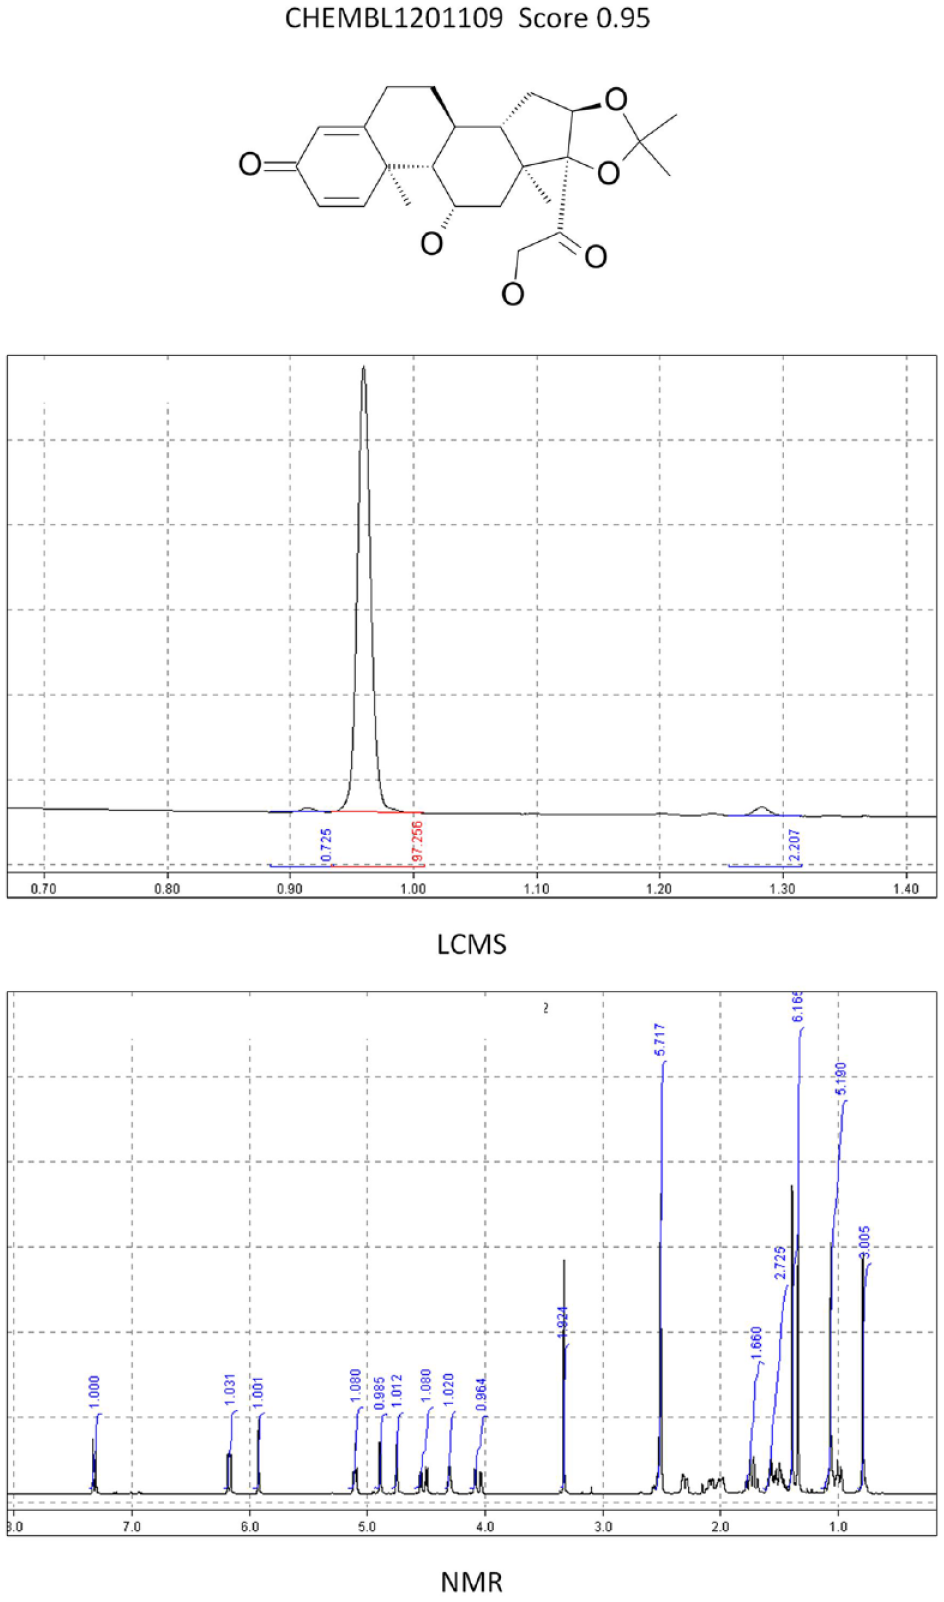
Eample of an ASV pass (CHEMBL1201109). NMR and LCMS match the supplied structure with a good score.
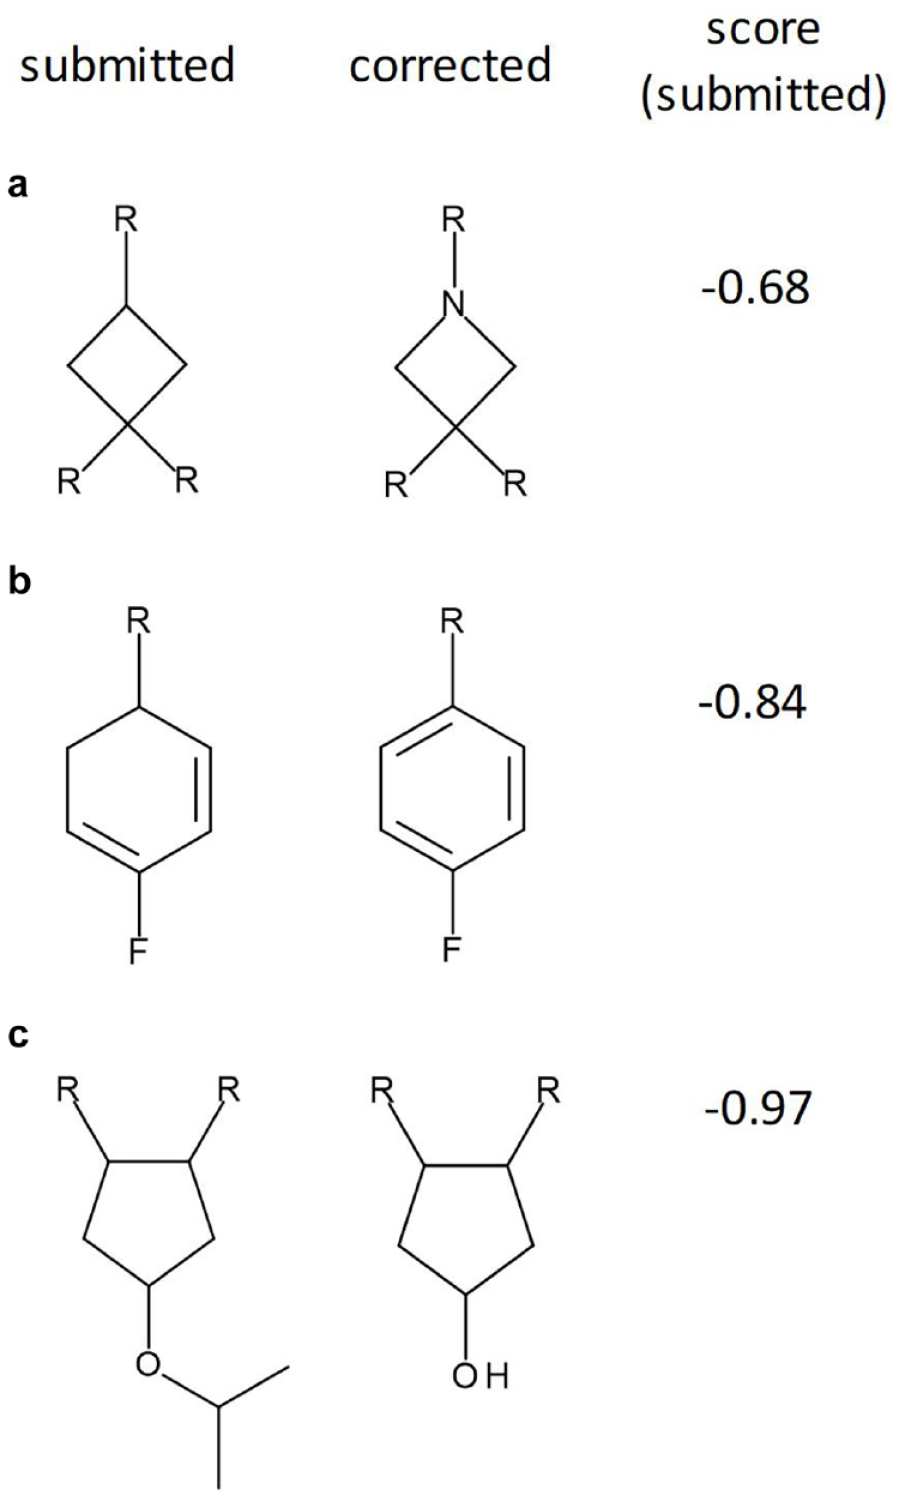
Examples of failed structures detected by the system. Submitted (left) and corrected (right) structures are shown with the ASV score for the submitted sample. (a) The result of a drawing error where the submitter has not converted a carbon atom to a nitrogen. (b) The result of a drawing error with a missed double bond. (c) The result of a sample mix-up. In all three cases, mismatches between the m/z and 1H NMR chemical shifts and the number of peaks prompted the low scores.
We have built a system based on an automated KNIME workflow that routinely checks new compound registrations for data availability and consistency. Provided a synthetic chemist links the right amount of accurate analytical verification data, the process has no overhead for the chemist and very limited overhead for the analyst within the analytical technology group. The system delivers improved compliance and greater confidence that can support synthetic claims with robust analytical data.
Footnotes
Acknowledgements
Declaration of Conflicting Interests
The authors declared the following potential conflicts of interest with respect to the research, authorship, and/or publication of this article: Carlos Cobas and Michael Goebel declare they are employed by Mestrelab Research, the company that provides the MestReNova software package used in this work, and their research and authorship of this article was completed within the scope of their employment with Mestrelab Research. James A. Lumley, Gary Sharman, Thomas Wilkin, and Matthew Hirst are employed by Eli Lilly and Company, and their research and authorship of this article was completed within the scope of their employment with Eli Lilly and Company.
Funding
The authors received no financial support for the research, authorship, and/or publication of this article.