
Abstract
Three-dimensional (3D) cell culture models are thought to mimic the physiological and pharmacological properties of tissues in vivo more accurately than two-dimensional cultures on plastic dishes. For the development of cancer therapies, 3D spheroid models are being created to reflect the complex histology and physiology of primary tumors with the hopes that drug responses will be more similar to and as predictive as those obtained in vivo. The effect of additional cell types in tumors, such as stromal cells, and the resulting heterotypic cell–cell crosstalk can be investigated in these heterotypic 3D cell cultures. Here, a high-throughput screening-compatible drug testing platform based on 3D multicellular spheroid models is described that enables the parallel assessment of toxicity on stromal cells and efficacy on cancer cells by drug candidates. These heterotypic microtissue tumor models incorporate NIH3T3 fibroblasts as stromal cells that are engineered with a reporter gene encoding secreted NanoLUC luciferase. By tracking the NanoLUC signal in the media over time, a time-related measurement of the cytotoxic effects of drugs on stromal cells over the cancer cells was possible, thus enabling the identification of a therapeutic window. An in vitro therapeutic index parameter is proposed to help distinguish and classify those compounds with broad cytotoxic effects versus those that are more selective at targeting cancer cells.
Keywords
Introduction
Drug discovery is a process that requires large and high-risk investments in scientific research and preclinical and clinical development.1–3 It is therefore crucial to have compound activity data that accurately predict the effects in patients sooner early in the drug development process. Traditionally, the drug discovery process for anticancer agents has relied on in vitro cell proliferation models in which cancer cell lines are cultured as monolayers that adhere to plastic surfaces.4,5 However, it is becoming more evident that such two-dimensional (2D) cell culture models, although very amenable to high-throughput screening (HTS) of large collections of compounds, do not reproduce the physiological complexity of a tumor in vivo. As a consequence, compounds having promising pharmacological effects in 2D cultures often fail to produce an effect in a clinical setting.5–7 Born from this gap in predicting efficacy, three-dimensional (3D) cell assay systems are being explored to create more clinically relevant models of tumors for drug development.4,5,8–11 In contrast to 2D cell cultures, 3D culture conditions can better mimic the multicellular interactions within the tumor and with the microenvironment of tumors, which has a significant impact on the cellular behavior and pharmacological responses.12–16 In this regard, inclusion of stromal cells in heterotypic cell models has been shown to stimulate the proliferation of cancer cells and affects their intercellular signaling and gene expression.5,17–19 Therefore, the use of a heterotypic 3D model may offer substantial advantages for investigating the effect of potential anticancer agents in a system that more accurately represents the in vivo tumor microenvironment.
The overall goal of this work was to develop a model system that allows for the discrimination of cell viability patterns of two cell types within a heterotypic microtissue tumor model, and to classify the cytotoxic effects of the compounds tested on each cell type in the context of the entire microtissue system. The expected benefit of such a discrimination in the differential effect between the specific case of cancer and stromal cells in vitro is to predict the therapeutic window of a drug in vivo. This 3D multicellular heterotypic spheroid model is amenable to HTS and enables the parallel assessment of drug efficacy on cancer cells and unspecific cytotoxicity on tumor-integrated stroma cells of drug candidates. Homo- and heterotypic ovarian and pancreatic microtissue models were developed and used for the screening of a focused set of anticancer compounds targeting different mechanisms considered the hallmarks of cancer. 20 One pancreatic and two ovarian cell lines were used for the development of the microtissue tumor models. Although pancreatic and ovarian cancers are relatively rare diseases, pancreatic cancer is the fourth leading cause of cancer-related mortality, and ovarian cancer is the most common cause for gynecological cancer death.19,21 The introduction of a secreted NanoLUC luciferase reporter gene into a fibroblast stromal cell allowed direct discrimination of cytotoxic effects between these nonproliferative cells and the proliferating cancer cells within a heterotypic tumor spheroid. An in vitro therapeutic index parameter resulting from a 3D anticancer drug screening is proposed to help distinguish and classify those compounds with broad cytotoxic effects versus those that are more selective in targeting cancer cells.
Materials and Methods
General Cell Culture
The HEY cell line is a human ovarian carcinoma cell line and was derived from a xenografted tumor (HX-62). The ovarian cancer xenograft was originally grown from a peritoneal deposit of a moderately differentiated papillary cystadenocarcinoma of the ovary. The HEY-GFP cell line was obtained from Dr. Ernst Lengyel, University of Chicago. The HEY-GFP cells were cultivated in RPMI 1640 medium with 10% fetal bovine serum (FBS), 1% penicillin/streptomycin (pen/strep), and 25 mM HEPES. The SKOV3 cell line was obtained from the American Type Culture Collection (ATCC; Manassas, VA) and is a human ovarian cancer cell line that was established from a 64-year-old female patient, suffering from ovarian adenocarcinoma. The SKOV3 cells were cultivated in Dulbecco’s modified Eagle’s medium (DMEM) with 10% FBS, 1% pen/strep, 1% NEAA, and 25 mM HEPES. The PANC1 cell line was obtained from ATCC and is a human pancreatic cancer cell line established from a 56-year-old male patient, suffering from pancreatic epithelioid carcinoma. The PANC1 cells were cultivated in DMEM with 10% FBS, 1% pen/strep, and 25 mM HEPES. The NIH3T3 cell line is a mouse embryonic fibroblast. The NIH3T3 cells were cultivated in DMEM with 10% FBS, 1% pen/strep, and 25 mM HEPES.
Microtissue Production Process
After expanding the cells, they were detached and the cell suspension with the desired cell density (HEY-GFP 100 cells/drop, SKOV3 200 cells/drop, PANC1 200 cells/drop, and NIH3T3 5000 cells/drop) was prepared. To produce heterotypic microtissue models, a cell suspension containing both fibroblasts and the respective cancer cells was prepared in DMEM. The cell suspension was seeded into the GravityPLUS plate (InSphero AG, Schlieren, Switzerland) by pipetting 40 µL of suspension per well. For aggregating the cells into microtissues, the loaded plate was placed into an incubator for 72 h. For longtime cultivation and compound treatments the microtissues were transferred 3 days after seeding from the GravityPLUS into the GravityTRAP (InSphero AG) plate. A medium exchange was performed twice a week to prevent the microtumors from nutrient starvation. To observe the morphology of the microtissues over time, bright field images were taken on a regular basis (Zeiss Axiovert 25, 5×; Zeiss, Oberkochen, Germany).
Histological Analysis
Microtissues were fixated and embedded in agarose. The microtissues were collected from the GravityTRAP plate into an Eppendorf tube and washed with phosphate-buffered saline (PBS). After washing, the microtissues were fixated by adding paraformaldehyde (PFA) for at least 1 h at room temperature. The PFA was then removed and 600 µL of boiled agarose solution was added for embedding. After solidification of the agarose plug, 500 µL of PBS was added into the tube. The subsequent paraffin embedding, cutting of paraffin blocks, and the immunohistochemistry (IHC) staining itself were performed on order by an external company (Sophistolab, Muttenz, Switzerland).
Transfection of the NIH3T3 Fibroblasts
In order to discriminate stromal cells from cancer cells in heterotypic microtissue models, a reporter gene was introduced into the fibroblasts in order to secrete NanoLUC luciferase. Transfection of the NIH3T3 fibroblasts by Nucleofection in order to secrete NanoLUC luciferase (pNL1.3CMV [secNluc] luciferase reporter vector; Promega, Madison, WI) was performed according to Lonza’s manual for the Amaxa 4D-Nucleofector Protocol for NIH/3T3 (Lonza Cologne GmbH, Cologne, Germany) using a Single Nucleocuvette (100 µL). The cells were trypsinized and an aliquot of 106 cells was resuspended in 100 µL of 4D-Nucleofector Solution (Lonza Cologne). One microgram of pNL1.3CMV [secNluc] luciferase reporter vector was added, and the suspension was transferred into a Nucleocuvette. The Nucleocuvette was placed into the 4D-Nucleofector X Unit. The cells were transfected with program EN-158. After transfection, the cells were plated in cell culture medium into a T flask. For separation of the dead cells, the flask was incubated overnight, and vital cells were allowed to adhere to the bottom. The vital cells were subsequently used for the microtissue production process.
Drug Testing
Thirty-eight compounds targeting major cancer pathways were selected for testing in the different cancer spheroid models and were purchased commercially from different sources. The 38 compounds included 26 anticancer agents, 2 antibiotics, 2 cardiac glycosides, an antipsychotic and an antidepressant drug, an antiarrhythmic and an anticonvulsant agent, an epithelial sodium channel blocker, an L-DOPA inhibitor, an androgen receptor antagonist, and a drug acting on chemokine receptors. Supplemental Table S1 shows the list of the compounds and their respective primary mechanism of action. In addition, the table provides a potential categorization according to the respective effects of the compounds on one or more cancer hallmarks. All 38 compounds were tested on the ovarian HEY homotypic and HEY/NIH heterotypic microtissues. Twenty compounds were tested on the ovarian SKOV/NIH and pancreatic PANC/NIH heterotypic microtissues. The treatment was started after transferring microtissues into the assay plate; redosing of the microtissues was performed on days 3 and 5. Compounds were tested within a concentration range of 2 pM to 20 µM (11 doses, 1:5 dilution series). Each compound and dose were tested in one well with one sphere, for each assay condition. The vehicle control group consisted of microtissues treated with 1% DMSO in microtissue maintenance medium. A 1:5 dilution series of the compounds was prepared in a separate V-bottom plate with DMSO as the diluent. To reach a final concentration of 1% DMSO, a second dilution step was performed with microtissue maintenance medium as the diluent.
Measurement of Microtissue Size Over Time
To monitor microtissue size and morphology over time, the Dainippon SCREEN Cell3iMager was used. Ninety-six-well plates were scanned at treatment days 3, 5, and 7. The integrated analysis software enabled automated measuring of the microtissue size, including accurate discrimination of microtissues and cell debris that might occur after compound treatment.
Nano-Glo Luciferase Assay
To discriminate fibroblasts from cancer cells in the co-culture models, the fibroblasts were transfected with a reporter gene in order to secrete NanoLUC luciferase. Within a screening run the secreted NanoLUC luciferase was measured 3, 5, and 7 days after the treatment started. The Nano-Glo Luciferase Assay was performed according to Promega’s manual for the Nano-Glo Luciferase Assay System (Promega).
CellTiter-Glo Luminescent Cell Viability Assay
As a biochemical endpoint of a screening run at treatment day 7, the cell viability of the microtissues was detected by measuring the ATP content. The procedure for the CellTiter-Glo 3D Cell Viability Assay (Promega, Madison, WI) was done as follows: The complete culture medium was aspirated manually. CellTiter-Glo 3D Reagent was mixed 1:1 with microtissue maintenance medium and 40 µL of the diluted reagent was added to the microtissues and mixed. Microtissues and supernatant were transferred into a 96-well half-area white assay plate (cat. 07-200-326; Corning, Corning, NY). The assay plate was wrapped in aluminum foil and incubated for 20 min at room temperature while shaking horizontally. Luminescence was measured with the Tecan M200Pro (Männedorf, Switzerland). For analysis of the data, the values from treated microtissues were normalized to the vehicle control.
Data Analysis and Visualization
For the generation of dose–response curves and corresponding IC50 values, the data obtained from size measurements, NanoLUC assays, and ATP assays were normalized to the vehicle control. The normalized data were processed using GraphPad Prism 6 software (San Diego, CA). The program uses the subsequent formula for fitting a sigmoidal dose–response curve: Y = ((Y_top))/(1 + 〖10〗^((Log IC_50-X)*Hill Slope)),where Y_top is the Y value at the top plateau. The Hill Slope variable, also called the Hill Slope coefficient, describes the steepness of the curve. Visualizations were set up via TIBCO Spotfire software (TIBCO, Palo Alto, CA).
Multiparametric Compound Classification
The multiparameter classification aims to harmonize data features derived from different tumor microtissues with diverging scales and ranges. In this study, data were generated for a set of 20 drugs from the National Center for Advancing Translational Sciences (NCATS) library describing the potency, efficacy, acute toxicity, and chronic toxicity of each drug as well as the impact of a drug on tumor growth. For each tumor microtissue (HEY/NIH, SKOV3/NIH, and PANC/NIH), ranked lists of different feature combinations were generated including a three-feature combination of potency, efficacy, and tumor growth, was well as a five-feature combination of potency, efficacy, tumor growth, acute toxicity, and chronic toxicity. For both lists, the overall rank of a drug is dependent on the biological impact of each feature; that is, a small IC50 ATP value indicates a high potency of a drug and is therefore ranked lower (better). In this regard, a high efficacy, low acute and chronic toxicity, and a strong inhibition in tumor growth result in lower ranks. The final rank of a drug in each tumor tissue list (i) is determined by the equal weight rank
A comparison over all drugs between the different tumor lists is enabled with the Spearman rank correlation ranging from 0 to 1, where zero indicates no correlation and 1 indicates a perfect correlation.
To compare the efficacy of a drug throughout all different tumor microtissues, the equal weight ranks from all tumor types were reranked between 1 and the number of compounds. The average rank of all tumor tissues determines the overall rank of a drug.
Results
Assessment of the morphological and growth properties of several heterotypic tumor microtissues was performed to define assay parameters for their pharmacological profiling. Three heterotypic microtissue models were established, all including a cancer cell line and NIH3T3 fibroblasts, as stromal cells: (1) ovarian cancer co-cultures with HEY-GFP tumor cells, referred to as HEY/NIH microtissues; (2) ovarian cancer co-culture systems with SKOV3 as tumor cells, referred to as SKOV/NIH microtissues; and (3) a pancreatic cancer co-culture system with PANC1 as tumor cells, referred to as PANC1/NIH microtissues. The ratio of cancer to fibroblast cells used was 1:25, based on previous work with tumor/fibroblast heterotypic microtissues.22,23 The aggregation of the respective cells in hanging drops resulted in microtissue formation within 3 days, observed by bright field microscopy. After microtissue formation, microtissues were either harvested for histological analysis or transferred into a nonadhesive spheroid-specific 96-well plate for long-term culture. Growth profiles were obtained by measuring size over time using bright field microscope. All three models displayed fast growth characteristics, and at 10 days, HEY/NIH was six times larger and SKOV/NIH and PANC1/NIH three times larger than the size of the microtissues at 3 days (
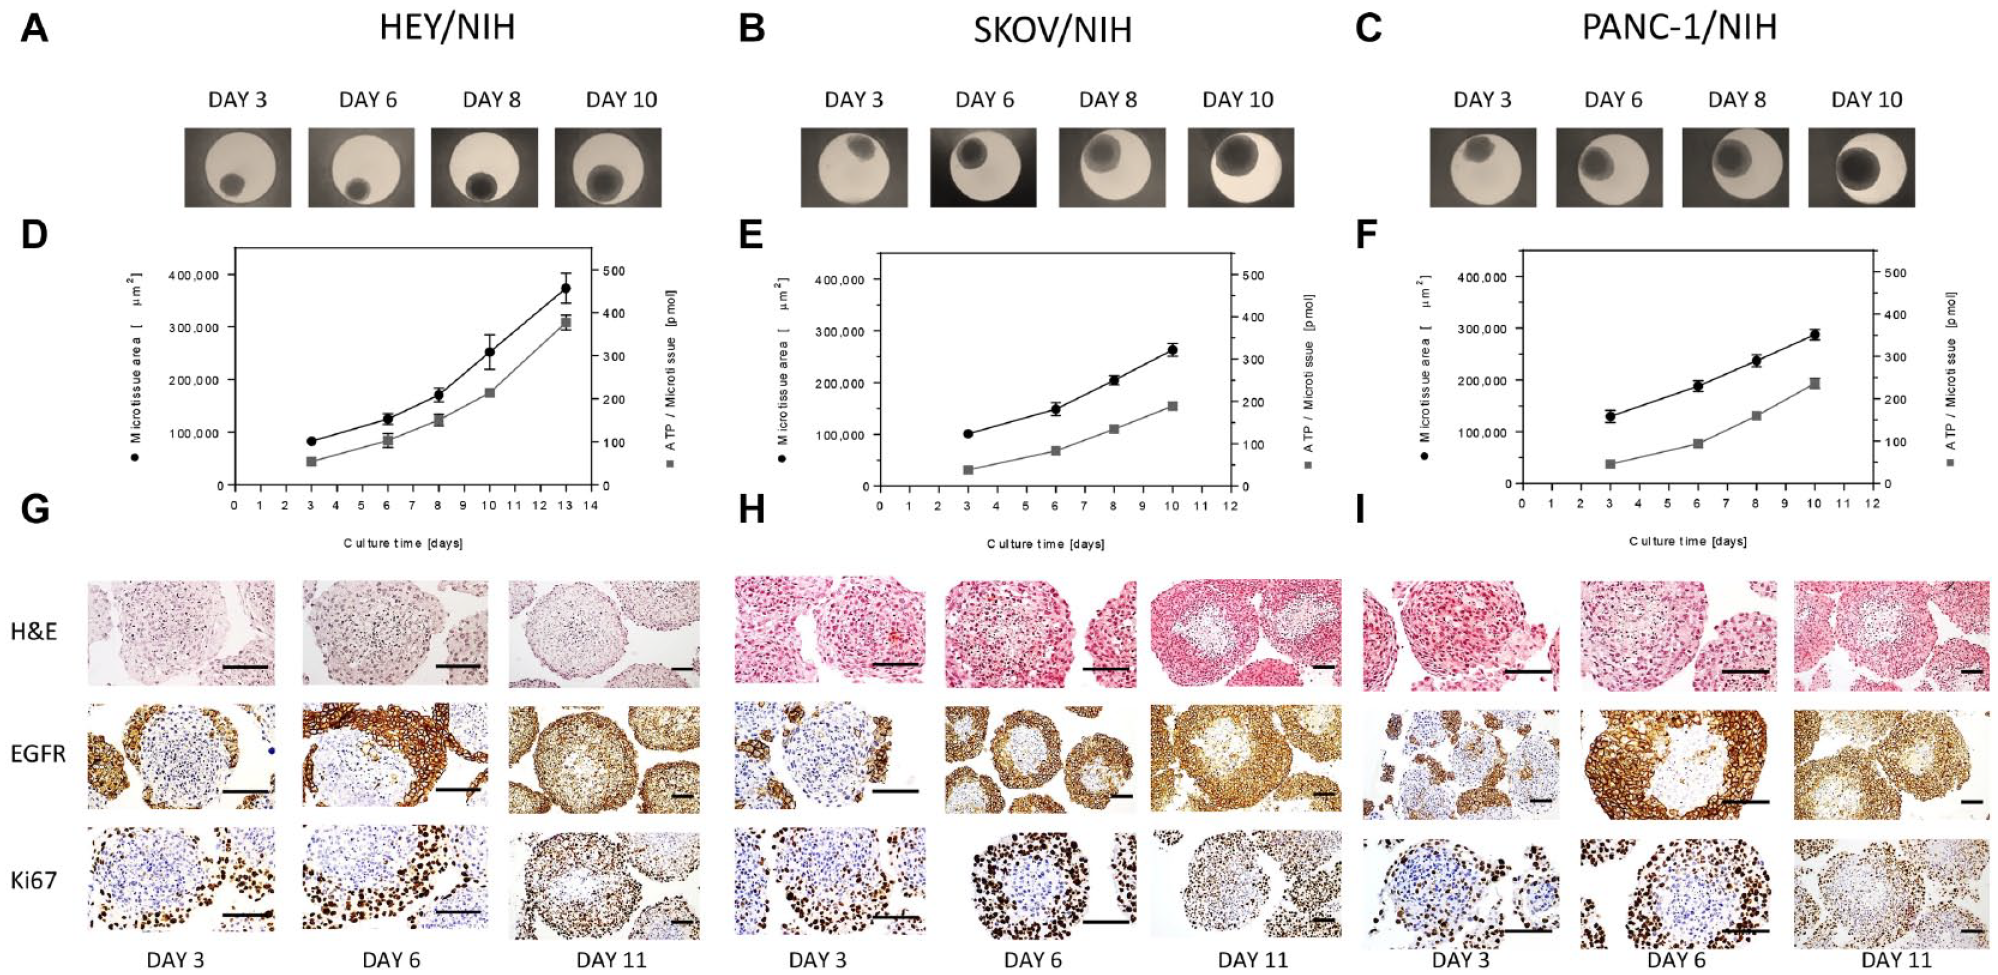
Growth profiles and morphological appearance of 3D heterotypic multicellular tumor spheroids. (
Characterization of internal architecture of the microtissues was done by histological sectioning and IHC staining. After 3, 6, and 11 days of culture, IHC analyses of the co-culture microtissues were performed (
The effects of a set of drugs with different mechanisms of action (see
Suppl. Table S1
) were first tested on the different cellular models of ovarian cancer using the HEY cells grown in a monolayer, homotypic microtissues, and heterotypic HEY/NIH microtissues. The effects of the drug on the growth of the cells in each assay system were assessed by measuring the ATP content after a 2-day treatment period for the monolayer culture model, and the microtissue size at 3, 5, and 7 days by brightfield imaging and the ATP content after a 7-day treatment for the 3D microtissue cultures.
Figure 2A
shows a heat map of the percent cell viability at the maximum dose of compound tested (percent maximal response), which is a measure of compound efficacy, for each assay condition. Most of the 20 compounds tested were highly efficacious in the ATP monolayer assay, except for PNU-74654. The measured percent maximal responses by both ATP measurement at day 7 and tissue size at day 7 revealed a similar responsiveness to the drug treatments of homo- and heterotypic microtissues, with a tendency for homotypic microtissues to be more sensitive to the compounds. However, there is also a clear tendency that the temporal effects of the drugs on the size of heterotypic microtissues are less pronounced compared with homotypic microtissues, and in general, the time that it takes to see an effect is longer than that for heterotypic microtissues. For microtissues, of the 20 compounds, at day 7, most were efficacious in both assay readouts and tissues, except for PNU-74654, VU0483488-1, and GM-6001, especially in the heterotypic tissue. Correlation plots of percent maximal responses (
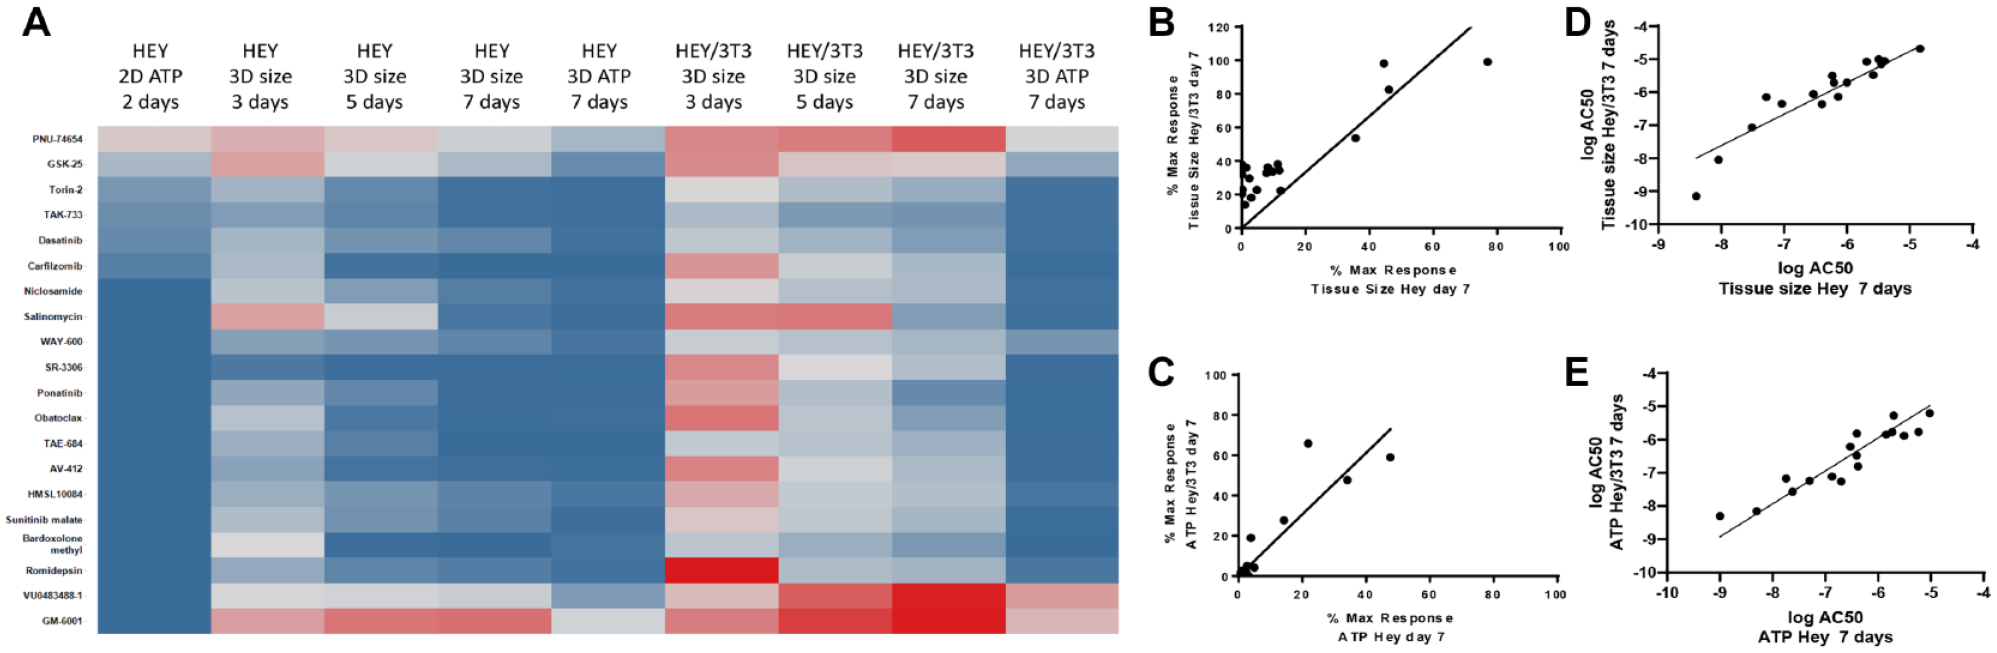
Comparison of pharmacological effects of compounds on HEY cancer growth assays of increased complexity, as measured by cell viability with CellTiter-Glo and spheroid size by bright field microscopy. (
To assess differences in the pharmacological responses of the different cancer types in the context of heterotypic microtissues, the efficacies and potencies of the 20 compounds were evaluated in the two ovarian (HEY/NIH, SKOV/NIH) and the pancreatic (PANC/NIH) heterotypic microtissue models. The percent maximal responses based on ATP measurements after 7 days revealed similar efficacies of the tested drugs in all cancer heterotypic microtissues (
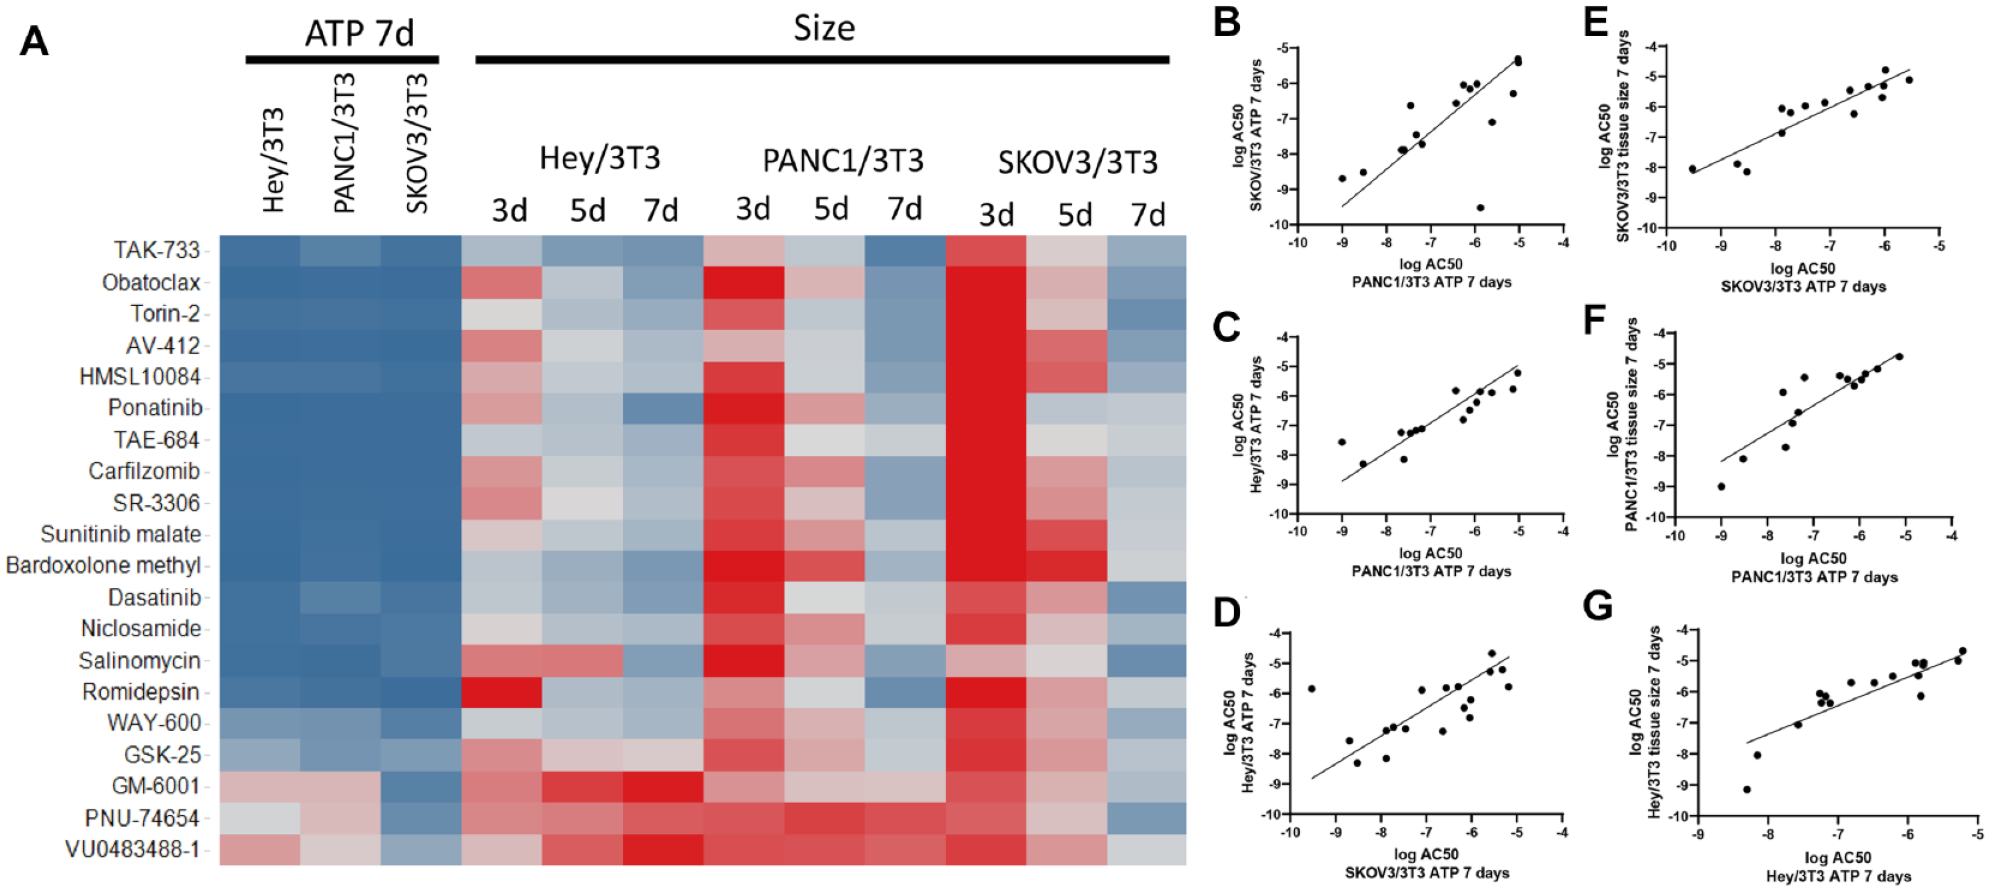
Comparison of pharmacological effects of compounds on 3D heterotypic multicellular tumor spheroids of different cancer types. (
The reduction of severe side effects that are commonly associated with traditional chemotherapeutic agents is one of the main drivers for developing cancer-specific targeted therapeutics. In order to identify cytotoxic side effects of the tested compounds on stromal cells, luminescence signal from secreted NanoLUC luciferase of the transiently transfected stromal fibroblasts was measured from the heterotypic tumor microtissues, over the treatment time. The heat map in
Figure 4A
illustrates the percent maximal responses calculated on the basis of secreted NanoLUC data over time compared with tissue size measurements at the same times. The NanoLUC activity values at the respective measurement days of the dosed conditions were normalized to the NanoLUC activity of the untreated control for each tissue type. As a result, 100% NanoLUC signal represents 100% stromal viability. As observed when measuring the size of the tissues, the efficacy of the drugs tested increases with the length of treatment, and by day 7, most of them had reduced the NanoLUC signal by >50%. Some of the compounds, like romidepsin, an histone deacetylase (HDAC) inhibitor, have a strong effect on the NanoLUC but no effect on tumor size at day 3, which suggests transcription downregulation of NanoLUC expression by epigenetic modulation, and not necessarily cytotoxic effects on the fibroblasts, thus highlighting one of the caveats of our approach. Another set of interesting compounds are those that reduce tumor size early in the treatment without affecting NanoLUC signal, including dasatinib, TAK-733, and WAY-600 for HEY/NIH3T3, although no such compounds were observed to have an effect for SKOV3/NIH3T3 and PANC1/NIH3T3 tissues at any of the time points. These data illustrate that besides the overall trend of increased efficacy with time, by both NanoLUC and tissue size, it is clear that the time-dependent increase in efficacy for each compound is cancer tissue dependent. These varying effects of the compound on the efficacy measured through NanoLUC and ATP and tissue size readouts are also observed in correlation plots (
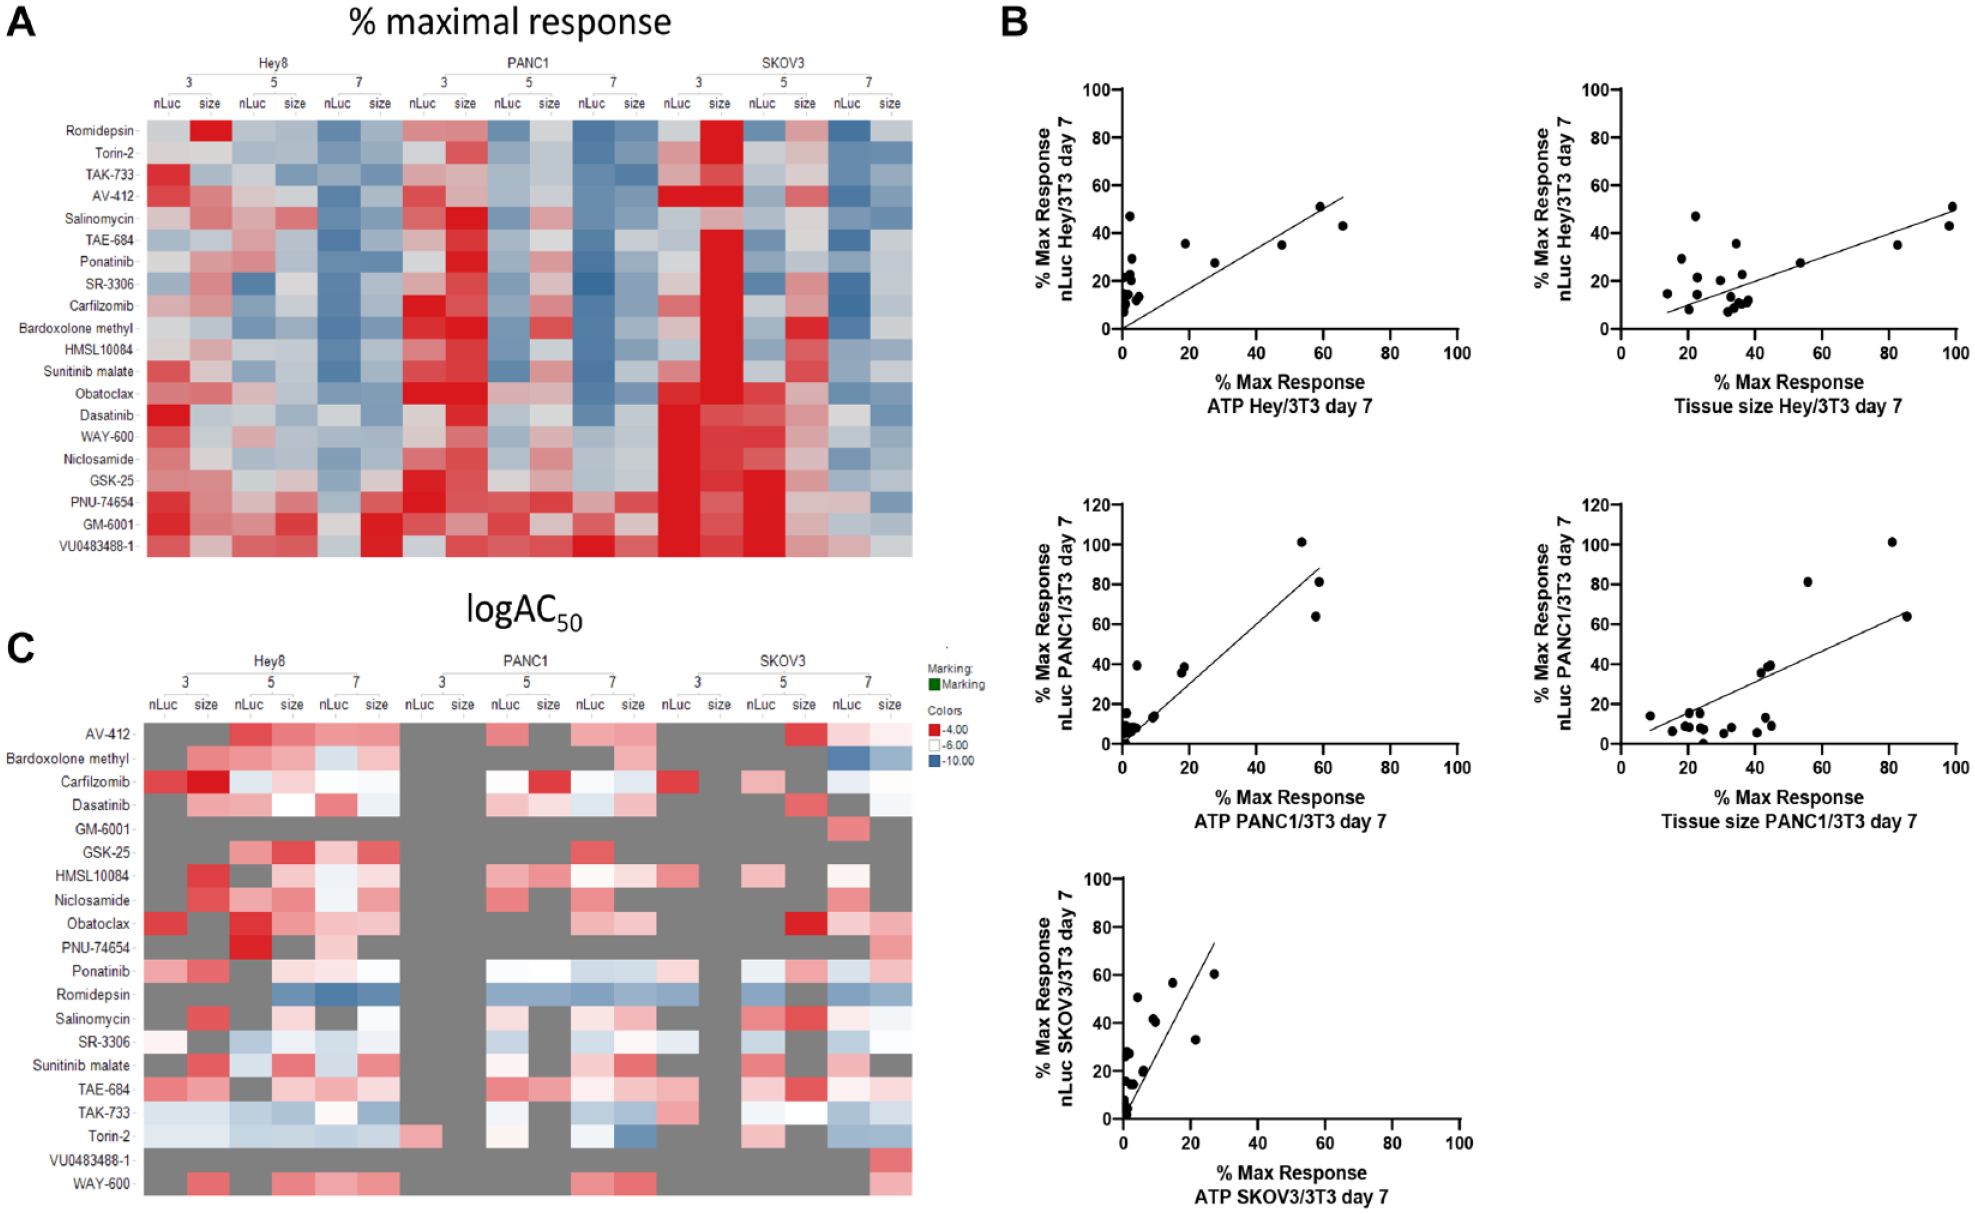
Comparison of pharmacological effects of compounds on NanoLUC reporter from fibroblast cells and spheroid size on 3D heterotypic multicellular tumor spheroids of different cancer types. (
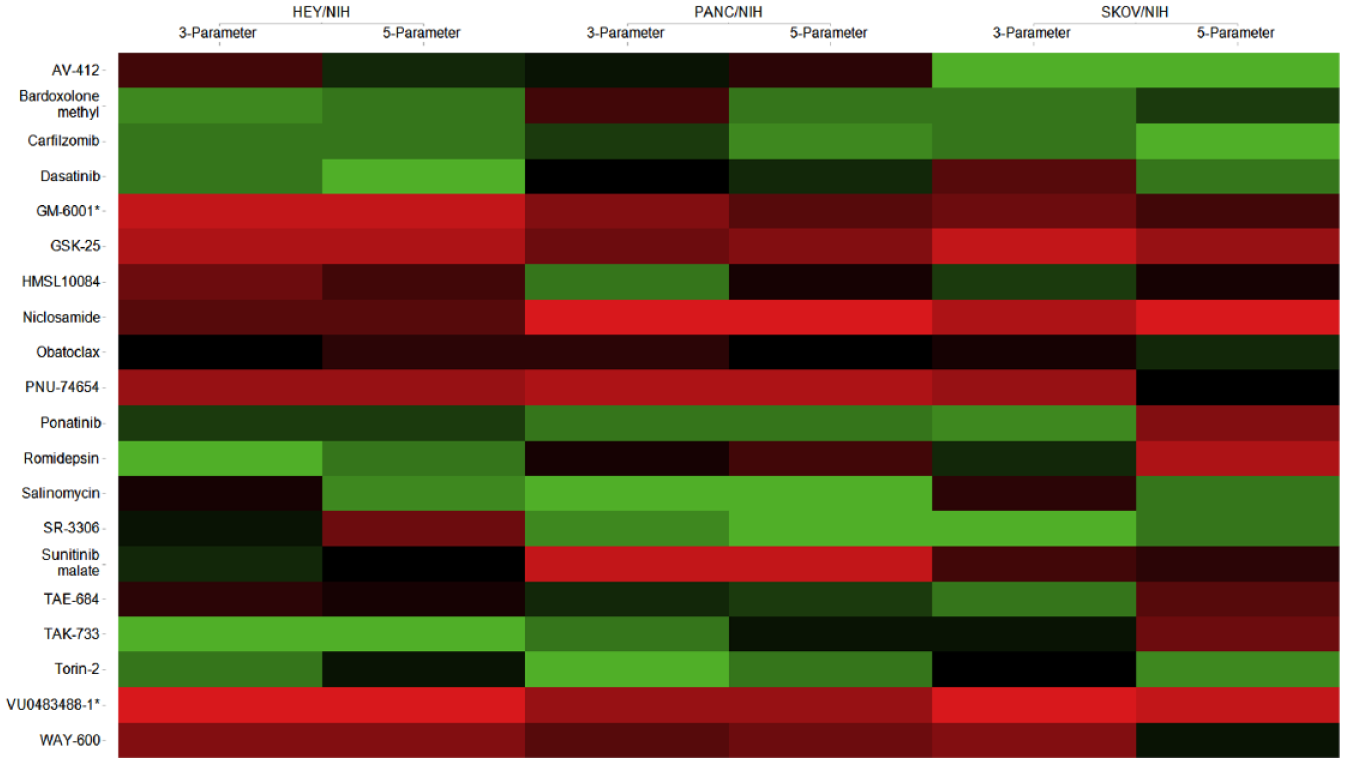
Heat map based on rank changes of the individual compounds between three- and five-parameter classifications. Colored by ranking score: 1 (green) corresponds to the best therapeutic window, and 20 (red) corresponds to the smallest therapeutic window.
To model a therapeutic window between cytotoxic effects on cancer cells over stromal cells, we calculated a ratio between AC50 values based on NanoLUC activity over AC50 values based on ATP activity at day 7 (
Therapeutic Windows, as the Ratio of Adverse Effect to Therapeutic Effect, for 3-Day and 7-Day Cytotoxicity of the Compounds in HEY/NIH, SKOV/NIH, and PANC1/NIH Spheroids.
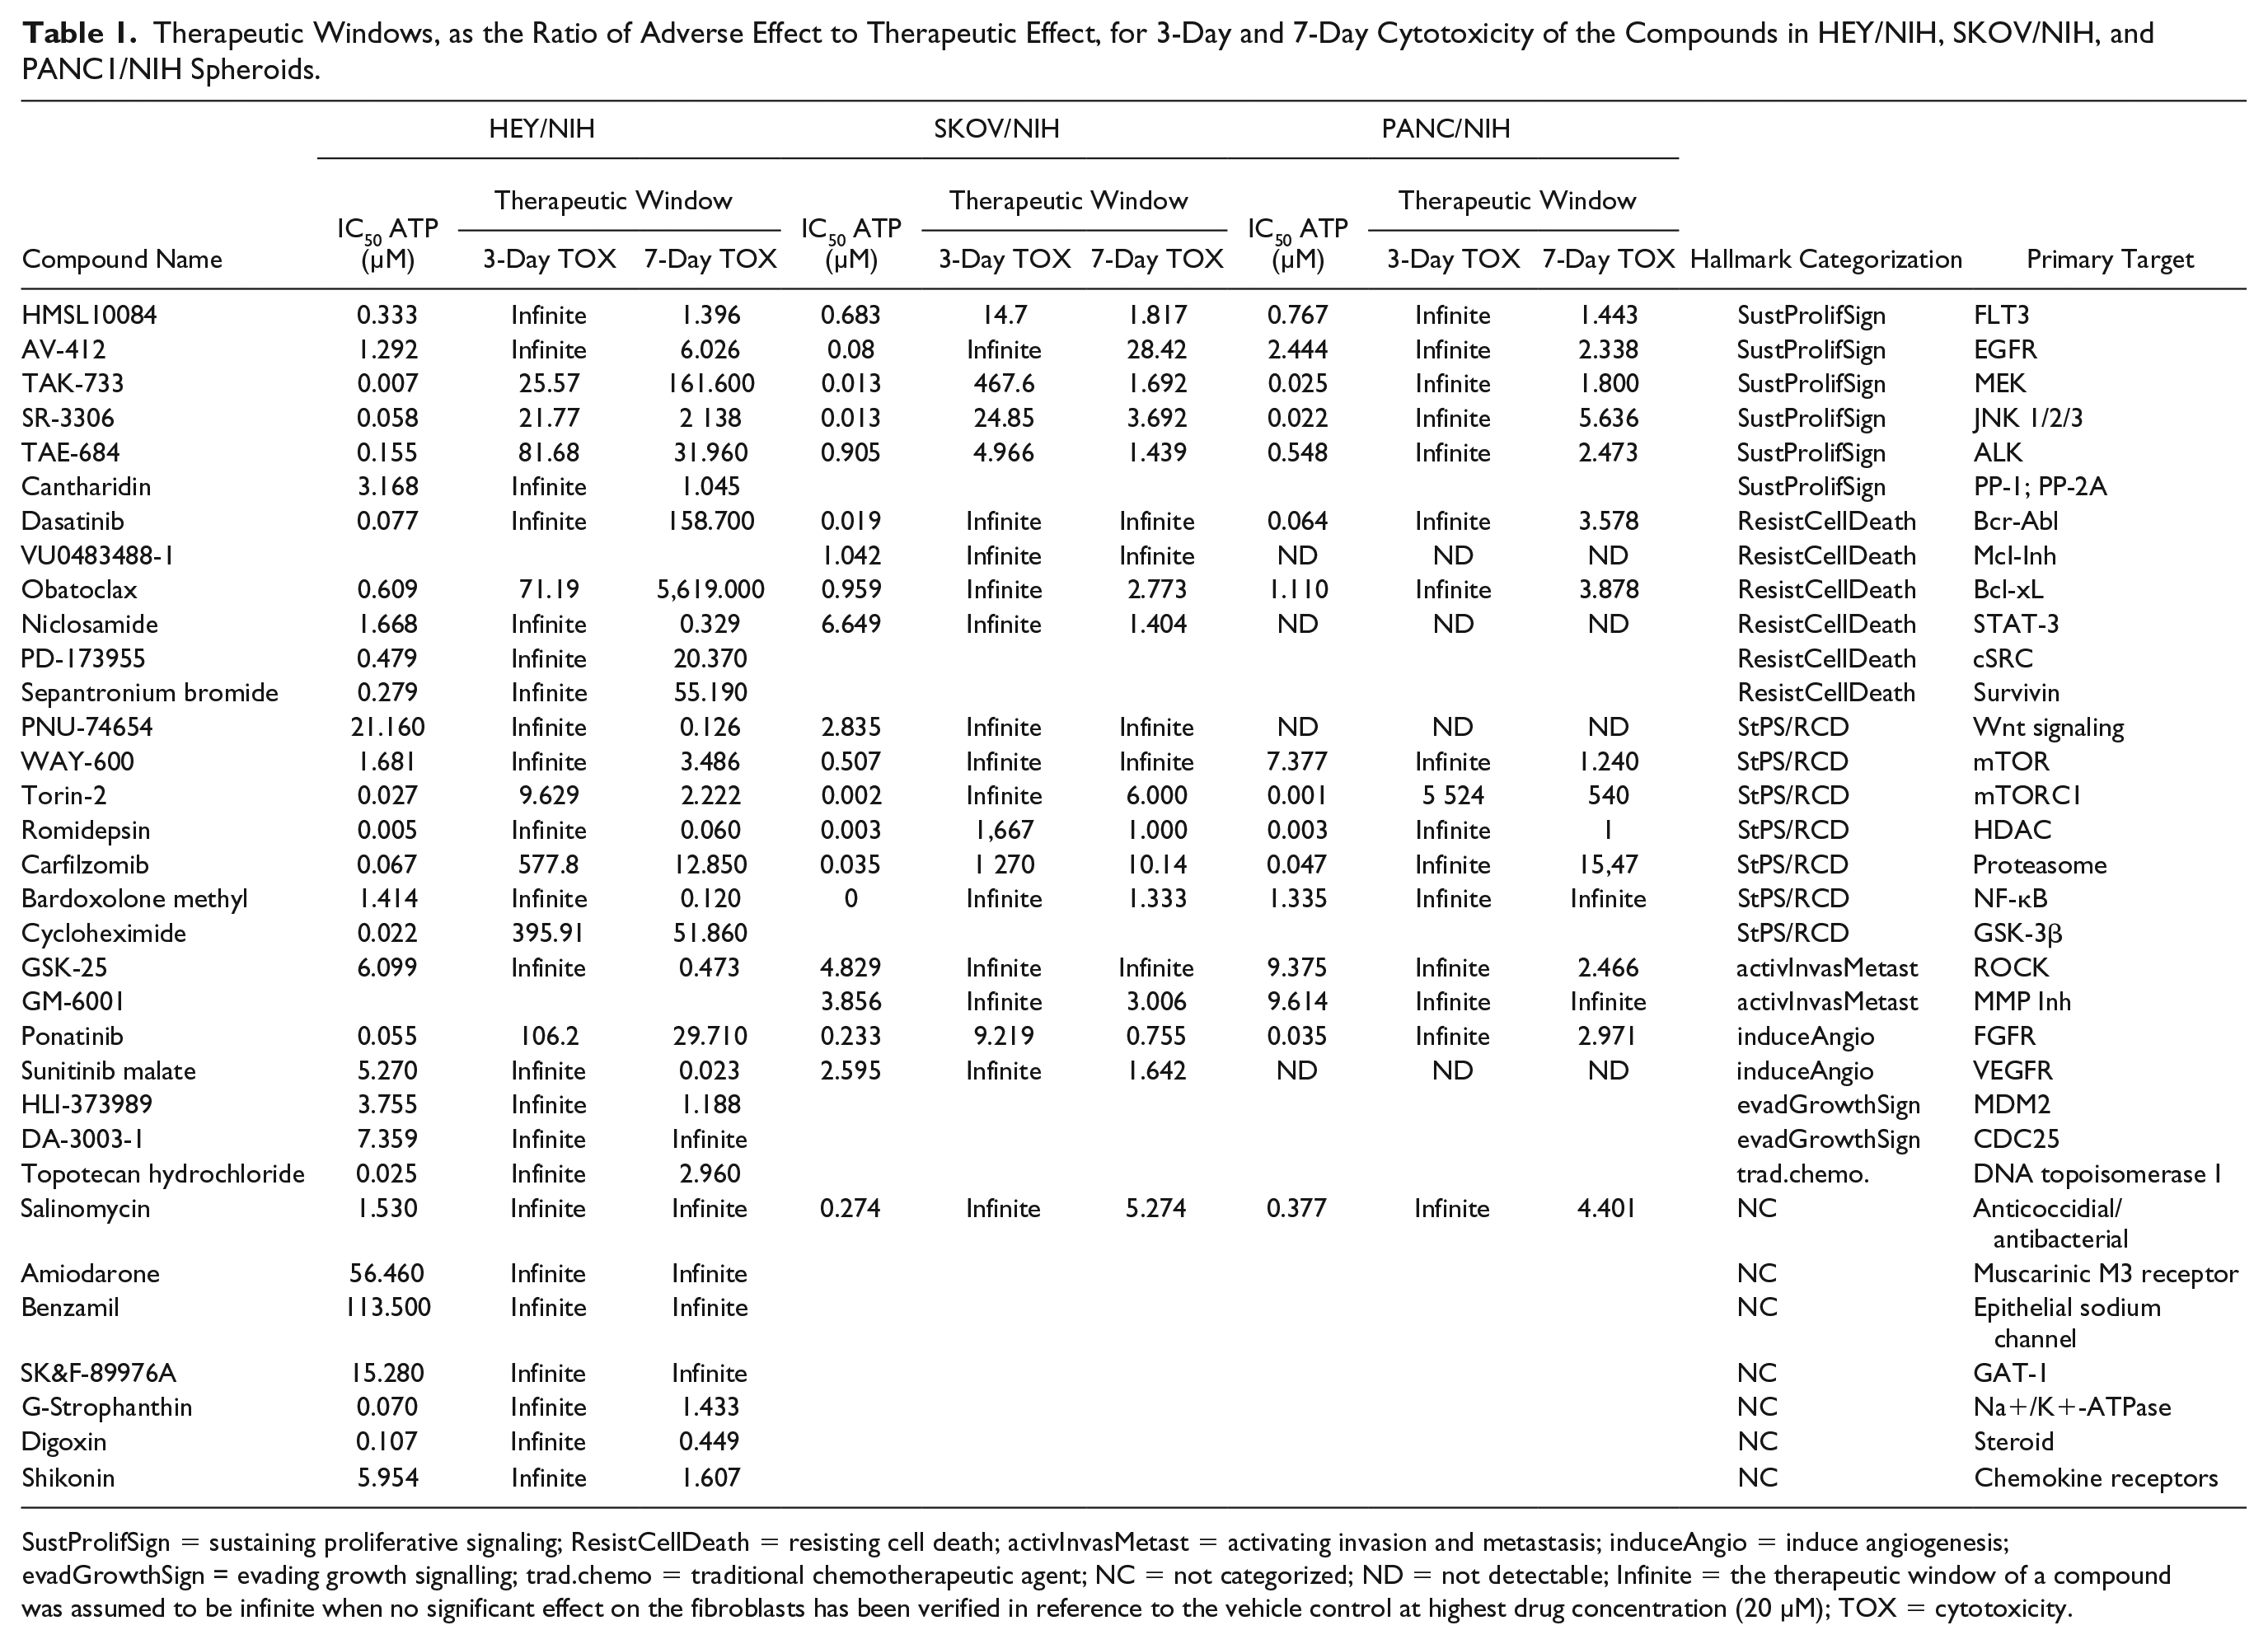
SustProlifSign = sustaining proliferative signaling; ResistCellDeath = resisting cell death; activInvasMetast = activating invasion and metastasis; induceAngio = induce angiogenesis; evadGrowthSign = evading growth signalling; trad.chemo = traditional chemotherapeutic agent; NC = not categorized; ND = not detectable; Infinite = the therapeutic window of a compound was assumed to be infinite when no significant effect on the fibroblasts has been verified in reference to the vehicle control at highest drug concentration (20 µM); TOX = cytotoxicity.
To further define compound criteria to help prioritize compounds based on both high cytotoxicity effects on cancer cells and reduced toxicity on stromal cells, the compounds were ranked with respect to their efficacy, potency, acute toxicity, chronic toxicity, and effects on tumor size over time. For each category, the 10 outstanding compounds are shown (
For HEY/NIH tumor spheroids, the three compounds dasatinib, TAK-733, sepantronium bromide, and carfilzomib can be highlighted (
Suppl. Table S5
). Dasatinib is listed in all categories, except for efficacy, where it was ranked 14th out of 38. The same applies to TAK-733, which was ranked 17th in terms of efficacy. Carfilzomib, a highly efficient and potent compound, ranked 10th in terms of chronic toxicity, and already showed a very broad therapeutic window, with the ratio of adverse to therapeutic effect being 578-fold at day 3. For SKOV3/NIH tumor spheroids, the proteasome inhibitor carfilzomib was also a prominent compound within the ranking (
Discussion
It is expected that the use of advanced in vitro cell culture models along the drug discovery value chain will significantly reduce the failure rate in preclinical and clinical validation of drug candidates. For this purpose, models must be developed according to the requirements of each discovery stage, ranging from HTS compatibility to multiorgan models. Here, we have developed a fully scalable, cost-effective, and standardized heterotypic 3D first-line screening platform consisting of a human cancer and a mouse fibroblast cell line. Although not a complete model of human origin, it reflects an ex vivo xenotransplantation model with cell types that allows robust model development for a variety of other cancer cell lines. A mouse cell line was used to ensure comparability between cancer models for first-line drug classification and also to maintain connective tissue integrity. The fibroblasts not only reflect the stroma environment but also can be used either to assess nonspecific drug toxicity (cytotoxicity) or as a target themselves, as demonstrated by Herter and coworkers. 22 Here, by integrating a cytotoxicity readout as an additional parameter in a screening setup, we can define a ranking of compounds with the highest efficacy toward cancer cells and the lowest cytotoxicity toward stromal cells representing unwanted side effects.
The 3D heterotypic multicellular tumor spheroid NanoLUC systems were developed in a 96-well format but are scalable to a 384-well high-throughput assay platform, which allows us to test compounds in dose responses to obtain both efficacy and potency measures over time using different relevant assay readouts of cell viability, size-based growth kinetics, and stromal cell viability. Comparison of percent maximal responses and AC50 values of treated ovarian homotypic microtissues with those of ovarian heterotypic microtissues did show minimal differences of drug efficacies and potencies between the two systems. The addition of stromal cells to the formation of heterotypic tumor microtissues, with the resulting heterotypic cell–cell crosstalk, is expected to increase drug resistance of the cancer cells compared with homotypic microtissues. 24 Cell-sorting events within in the heterotypic cultures led to an inside-out configuration with fibroblasts in the core and tumor cell in the periphery.22,23,25 The evaluation of the treatment data did reveal that heterotypic microtissues show a decrease in sensitivity to compounds compared with homotypic microtissues. However, the differences in sensitivity were minor, suggesting that in these particular cellular systems additional cell types have minimal influences on drug sensitivity. In addition, we observed that some of the drugs that showed high effects in potency or efficacy based on intratissue ATP contents after 7 days had moderate effects on tissue size development over time, and vice versa: some of the drugs that showed a moderate potency and/or efficacy had a very high influence on tumor growth over time. There was no obvious pattern, if any, that would have shown an unambiguous relationship between these variables.
To model a therapeutic window, which is defined as the ratio of adverse effect to therapeutic effect, AC50 values based on NanoLUC data were set in relation to AC50 values based on ATP data at the day 7 treatment. By tracking NanoLUC data over time, a time-related development of the effects on stromal cells in all microtissue models was detected for compounds that showed medium to high potencies based on ATP data. Taking into account pharmaco- and toxicokinetic aspects, two different therapeutic windows were modeled. NanoLUC data at day 3 represented acute toxicity of the compounds, whereas NanoLUC data at day 7 represented chronic toxicity. The therapeutic window classification in terms of acute toxicity revealed that all the top 10 compounds had to be considered as having an infinite therapeutic window. This means that for these compounds no significant effect on the fibroblasts has been verified in reference to the vehicle control. In general, only few compounds did have a toxic effect on the fibroblasts after 3 days of treatment. In contrast to that, the therapeutic window narrowed for most compounds due to chronic toxicity after 7 days of continuous treatment. Therefore, compounds that were listed within the top 10 compounds after 3 days of treatment did not show up anymore within the top 10 classification for chronic toxicity. Nevertheless, there are some compounds, for example, TAK-733, dasatinib, and Torin-2, which showed a broad therapeutic window even after 7 days of treatment, which indicates very specific targeting of the cancer cells. However, a high target selectivity does not necessarily imply a good clinical safety profile for a drug. 26 The question remains of which endpoint(s) or combinations thereof are more relevant to be considered for a transition into clinical testing and how to best mimic dosing schedules. It has been shown that continuous dosing over 7 days does not comply with clinical dosing regimens. Romidepsin, for example, was administered every 28 days on days 1 and 15 in a clinical phase II trial with pancreatic cancer patients. 27 The recommended dosing schedule for carfilzomib was set to intravenous infusions of 2–10 min twice a week. 28 However, determining the optimal dosing of targeted therapy is challenging. 29 It is currently being discussed whether higher drug doses with short exposure times, or lower doses with longer exposure times are beneficial. 30 The fact is that a continuous 7-day treatment does not reflect the in vivo procedure, and it is very likely that a temporal dosing in vitro would not affect the fibroblasts as severely as a continuous treatment. In addition, since cancer is a heterogeneous disease and tumor growth does not depend on one single target, future treatment strategies will be based on a combination of different therapies targeting the hallmarks of cancer.
Supplemental Material
Weydert_3D_TI_Supplementary_Figure_Legend_rev – Supplemental material for A 3D Heterotypic Multicellular Tumor Spheroid Assay Platform to Discriminate Drug Effects on Stroma versus Cancer Cells
Supplemental material, Weydert_3D_TI_Supplementary_Figure_Legend_rev for A 3D Heterotypic Multicellular Tumor Spheroid Assay Platform to Discriminate Drug Effects on Stroma versus Cancer Cells by Zoe Weydert, Madhu Lal-Nag, Lesley Mathews-Greiner, Christoph Thiel, Henrik Cordes, Lars Küpfer, Patrick Guye, Jens M. Kelm and Marc Ferrer in SLAS Discovery
Footnotes
Acknowledgements
We thank the R&D team of InSphero for supporting the work, Promega for providing the NanoLUC expression cassette, and Lonza Cologne for the 4D-Nucleofector transfection unit. The work at NCATS was funded by the NIH Intramural Research Program.
Supplemental material is available online with this article.
Declaration of Conflicting Interests
The authors disclosed the following potential conflicts of interest with respect to the research, authorship, and/or publication of this article: Zoe Weydert, Patrick Guye, and Jens M. Kelm were employed by InSphero AG, and their research and authorship of this article was completed within the scope of their employment with InSphero AG.
Funding
The authors received no financial support for the research, authorship, and/or publication of this article.
References
Supplementary Material
Please find the following supplemental material available below.
For Open Access articles published under a Creative Commons License, all supplemental material carries the same license as the article it is associated with.
For non-Open Access articles published, all supplemental material carries a non-exclusive license, and permission requests for re-use of supplemental material or any part of supplemental material shall be sent directly to the copyright owner as specified in the copyright notice associated with the article.