
Abstract
The etiological underpinnings of many CNS disorders are not well understood. This is likely due to the fact that individual diseases aggregate numerous pathological subtypes, each associated with a complex landscape of genetic risk factors. To overcome these challenges, researchers are integrating novel data types from numerous patients, including imaging studies capturing broadly applicable features from patient-derived materials. These datasets, when combined with machine learning, potentially hold the power to elucidate the subtle patterns that stratify patients by shared pathology. In this study, we interrogated whether high-content imaging of primary skin fibroblasts, using the Cell Painting method, could reveal disease-relevant information among patients. First, we showed that technical features such as batch/plate type, plate, and location within a plate lead to detectable nuisance signals, as revealed by a pre-trained deep neural network and analysis with deep image embeddings. Using a plate design and image acquisition strategy that accounts for these variables, we performed a pilot study with 12 healthy controls and 12 subjects affected by the severe genetic neurological disorder spinal muscular atrophy (SMA), and evaluated whether a convolutional neural network (CNN) generated using a subset of the cells could distinguish disease states on cells from the remaining unseen control–SMA pair. Our results indicate that these two populations could effectively be differentiated from one another and that model selectivity is insensitive to batch/plate type. One caveat is that the samples were also largely separated by source. These findings lay a foundation for how to conduct future studies exploring diseases with more complex genetic contributions and unknown subtypes.
Introduction
Disorders of the CNS are a leading cause of disability and mortality worldwide; 1 yet, despite significant research efforts, little is known about their etiology. A major impediment toward studying and developing drugs for these disorders is the fact that patients with shared end-stage clinical presentations are classified as single groups when their presentations are more likely to result from different underlying processes. The field is looking for robust and scalable methods for dividing patients into similar classes to study these processes more effectively and to match specific therapeutics to likely responders. One promising route for patient stratification related to underlying disease drivers is through identification of shared genetic traits. Large-scale genome-wide association studies (GWAS) have been performed for CNS disorders that resulted in the identification of hundreds of risk variants.2–4 Unfortunately, for the most part, this complex genetic landscape has not provided a clear picture of patient subtypes, thereby motivating groups to supplement genetic studies with additional clinical and patient-specific data sources as recently described. 5 A critical aspect of these approaches is the reliance on patient-derived material to guide patient subtyping.
Given the genetic complexity and likely nonlinear relationships among genetic risk variants in CNS disorders, studies using patient materials will require the use of samples from many patients to achieve statistical power. In support of such studies, large-scale collection of patient materials is underway.6,7 Accounting for the fact that little is known about the etiology of most CNS disorders, unbiased data such as transcriptomic or imaging studies capturing broadly applicable features, like Cell Painting, 8 are likely to be useful starting points for interrogation. These datasets, when combined with novel machine learning approaches, potentially hold the power to elucidate features that stratify patients and yield hypotheses for more precise studies of disease drivers. One technology that has enabled identification of subtle complex patterns in large datasets is deep neural networks (DNNs). 9 DNNs are one of the machine learning methods that use a set of model parameters and operations that allow input data to be transformed into useful outputs after a training (fitting) procedure. Compared with previous machine learning approaches, deep learning methods require minimal manual feature engineering and less parameter tuning, and have a remarkable ability to generalize to related data inputs. Leveraging the power of DNNs to explore data generated from numerous patients is of great interest, but it also requires adaptation of the algorithms and establishment of best practices for data collection to ensure that systemic non-disease-associated patterns, namely nuisance signals, do not drive the selectivity of any resulting models. This is particularly important because exploration of what leads to the selectivity of DNNs is still an evolving field. 10 As such, identifying features that could be providing selectivity and controlling for them in study design are critical.
The question we aimed to address in the current work is whether high-content imaging of patient-derived cells, namely primary skin fibroblasts, can reveal disease-relevant information among a large number of patients. Fibroblasts represent an accessible source of primary unmodified human cells, which retain the genetic traits of the patients from whom they were obtained, that can provide a patient-specific culture system to study disease. It is also possible that these cells will retain epigenetic features from aging and environmental exposure 11 that are also associated with disease onset. While these cells are nonneuronal and not implicated in CNS disorders, they represent an opportunity in the present to functionalize genetic variation among many patients; access to primary human neurons at scale is challenging, and current protocols for generating stem cell–derived neurons vary in consistency when applied to numerous individuals.12,13 Moreover, studies using fibroblasts from numerous patients with CNS disorders have been shown to represent some broad disease-related features.14–19
The work presented in this article is: (1) to identify variables that drive nuisance signals 20 detectable using machine learning and to develop study designs to minimize their impact, and (2) to predict disease status using high-content imaging of patient and control cell lines. To do this, we used three distinct deep learning approaches. First, we showed in a pilot experiment that image focus can be detected by a pre-trained DNN 21 and demonstrated that it can vary significantly as a function of position on a 96-well plate. These data led us to propose an acquisition strategy that accounts for focus variation, and a cell-plating approach, based on previous findings of predictable plate-based variation (Shamir 20 and others), that would enable us simultaneously to test the detectability of nuisance signals derived from assay features (including batch/plate type, plate, and location within a plate), and to perform a disease-focused study accounting for these features. To explore the resulting data, we used a second deep learning approach using image embeddings, 22 a lower dimensional semantically meaningful representation of images that could be used with conventional machine learning methods such as logistic regression or random forest. 23 The embedding method uses the Inception architecture 24 pre-trained on the ImageNet object recognition dataset 25 containing about 1.2 million images of a thousand categories of objects. The value of embeddings in general for biological studies was later demonstrated in a study that showed they outperform traditional segmented feature-based approaches, using Cell Painting, when tasked with predicting the mechanism of action of various compounds given to cells. 26 This paradigm has also been shown true for other fields comparing segmented features and continuous embeddings or raw data. 27 Finally, we performed an analysis to distinguish diseased cells, derived from patients with spinal muscular atrophy (SMA), a severe genetically driven neurological disorder, from healthy controls using conventional machine learning methods trained on the image embeddings and a third deep learning method, namely a convolutional neural network (CNN), 28 trained directly on raw cellular images. The choice of SMA was made because it is an ideal disorder for evaluating whether a technology can detect disease-relevant signals for the following reasons: The genes associated with SMA, survival of motor neuron 1 (SMN1) and SMN2, lead to a penetrant phenotype; 29 their copy number correlates with age of onset; 30 and they are transcribed in all cell types, including fibroblasts.14,31 Furthermore, while the exact function of the SMN protein is unknown, evidence exists that it is related to RNA processing in a cell-autonomous manner affecting all cell types, even though some cells (e.g., motor neurons)32,33 may be more sensitive than others.
Materials and Methods
To execute this study, we first performed a pilot experiment using six cell lines to test certain parameters in study implementation and also quality issues. Using knowledge gained from the pilot, we then performed two batches of disease-focused experiments using 27 cell lines. For all experiments, we used the same cell sources and protocols for expansion, plating, and staining.
Cell Sources
Primary fibroblasts were obtained from skin punch biopsies banked at two source labs, the Coriell Institute for Medical Research (Camden, NJ; denoted lab A; 15 healthy controls and 1 with SMA) and the Pediatric Neuromuscular Research Network’s cell repository at Columbia University Medical Center (New York, NY; denoted lab B; 11 with SMA).34,35 The latter fibroblasts were collected under institutional review board (IRB) approval at Boston Children’s Hospital, Children’s Hospital of Philadelphia, and Columbia University Medical Center. The Harvard University IRB approved the use of these lines in the described research. To avoid a potential signal from gender differences, only male lines were used in this study. Control lines were obtained from individuals without SMA and selected based on a pairwise matching, to the extent possible, to age at biopsy of the SMA lines. Details including identification (ID), source, gender, age at biopsy, SMN1/2 copy number for SMA subjects, passage number at experiment, and other features are presented in Supplementary Table 1 .
Cell Expansion Protocol
Cells were obtained at various different early passages. To avoid differences in cellular phenotype due to differences in cell line passage number, we first normalized passage number among all cell lines to passage number 5, the earliest passage at which sufficient number of cells could be banked for experimentation for all cell lines. For fibroblast expansion and culturing, we adapted a protocol used by the Coriell Institute for Medical Research. 36 In summary, on thawing, a 15 µL sample was aspirated, stained with trypan blue (cat. no. SV30084.01; GE, Boston, MA), and counted using a hemocytometer (Biorad, Hercules, CA). They were then plated at 100,000 cells per well in a six-well plate (cat. no. 3516; Corning, Corning, NY), expanded, and, on reaching 90% confluency, re-passaged using the same initial plating density. For cell expansion, we used Dulbecco’s modified Eagle medium (DMEM; cat no. 11995-065; Gibco, Carlsbad, CA), supplemented with 10% fetal bovine serum (FBS; cat. no. F2442; Sigma-Aldrich, St. Louis, MO), penicillin–streptomycin (100 U/ml; cat. no. 15140-122; Gibco), and 2 mM L-glutamine (cat. no. 25030-081; Gibco). Cells were grown in a tissue culture incubator at 5% CO2 and 37 °C. For passaging, we used phosphate-buffered saline (PBS; cat. no. 14190-136; Gibco) and TrypLE (cat. no. 12605-010; Gibco). Cells were frozen at 100,000 cells per cryovial, with growth medium supplemented with 5% DMSO (cat. no. D2650; Sigma-Aldrich).
Pilot Experiment
The aim of our first experiment was to test certain parameters in study implementation, such as the complexity of working with 27 individual lines, and also known quality issues in the screening field, including discrepant cell growth in outer versus inner wells. To accomplish this aim, we ran a mock 27-line experiment using six cell lines separately aliquoted to represent the 27 individual lines. First, each line was thawed, cultured for 10 days, and split once in advance of the experiment to achieve 90% confluency. The resulting passage number for use in the experiment was passage 7. Two wells of a six-well plate were then dissociated for each line. This was done in two rounds to minimize time out of the incubator for live cultures. Each of the rounds was treated identically but performed sequentially. Cells were trypsinized and counted using the protocol described above. Finally, 3000 cells were dispensed into each well of a 96-well plate (ViewPlate, cat. no. 6005182; PerkinElmer, Waltham, MA) using a Matrix multichannel pipette (Thermo Fisher, Waltham, MA). Following distribution of all cell lines, the plates were returned to the incubator. Our decision to use 96-well plates over 384-well plates was largely motivated by a desire to increase the number of imaged cells per well.
After 48 h incubation, we performed the Cell Painting 8 assay using six fluorescent stains: Hoechst (cat. no. H3570; Life Technologies, Carlsbad, CA), SYTO 14 (cat. no. S7576; Life Technologies), Concanavalin A 488 (cat. no. C11252; Life Technologies), Wheat Germ Agglutinin (cat. no. W32464; Life Technologies), Phalloidin 568 (cat. no. A12380; Life Technologies), and MitoTracker Deep Red FM (cat. no. M22426; Life Technologies) diluted into Hank’s balanced salt solution (HBSS, cat. no. 14065056; Life Technologies). The pilot experiment was imaged in widefield mode with 20× magnification using the PerkinElmer Opera Phenix running the Harmony software package (Logitech, Lausanne, Switzerland). Thirty-seven sites were collected for each well, which maximized coverage of the entire well.
Image Processing
Prior to cell segmentation, the 16-bit images were flat-field corrected as described in Ando et al. 26 Next, cell segmentation was conducted on the DAPI channel image by detecting nuclei centers, then cropping a 256×256 subimage region. Only regions that were completely within the original image boundaries were used for further analysis, yielding approximately 2000 cells per well. To have a balanced sampling of cells from each well, for wells with 2000 or more cells, 2000 cells were randomly sampled without replacement, and for wells with fewer than 2000 cells, additional cells were randomly sampled with replacement to get to 2000 total cells.
Focus Quality Analysis
Quantitative analysis of this experiment included evaluation of focus quality, which was assessed using segmented nuclei in the DAPI channel, using the pre-trained DNN model described in Yang et al. 21 For each 84×84 pixel region of a segmented DAPI cell image, the pre-trained DNN model predicts a probability distribution among 11 ordered classes of focus quality, corresponding to image blur ranging from 1 to 31 pixels in diameter. We then calculated the “focus score” of a cell image as the sum of the probability distribution in the three most in-focus classes among regions, yielding a continuous value between 0.0 and 1.0, with 1.0 being the best focus.
Disease-Focused Experiment
The second set of experiments used 27 total cell lines in two batches of 12 96-well plates, according to the plate maps in Figure 1 . Using a subset of three of the cell lines in these experiments (labeled C1, C2, and C3 in Fig. 1 ), we were able to test the detectability of spurious nuisance signals derived from parameters such as well location and plate identity. The intelligent plate map also enabled us to simultaneously run an experiment (minimizing the impact of these features using 12 SMA lines and 12 healthy control lines) to test whether we could effectively predict disease state. This was performed in two batches with different plate types: the first with the Greiner µClear plastic-bottom plate (cat. no. 655090; Sigma-Aldrich), and the second with a Cellvis glass-bottom plate (cat. no. P96-1.5H-N; Cellvis, Mountain View, CA). The use of the different plate types for each batch of experiments enabled us to evaluate our ability to detect signal arising from different experimental conditions and also to see whether disease prediction models for SMA would be insensitive to these different conditions. Our vision was to mimic potential future studies that would integrate data from different groups using different experimental conditions.
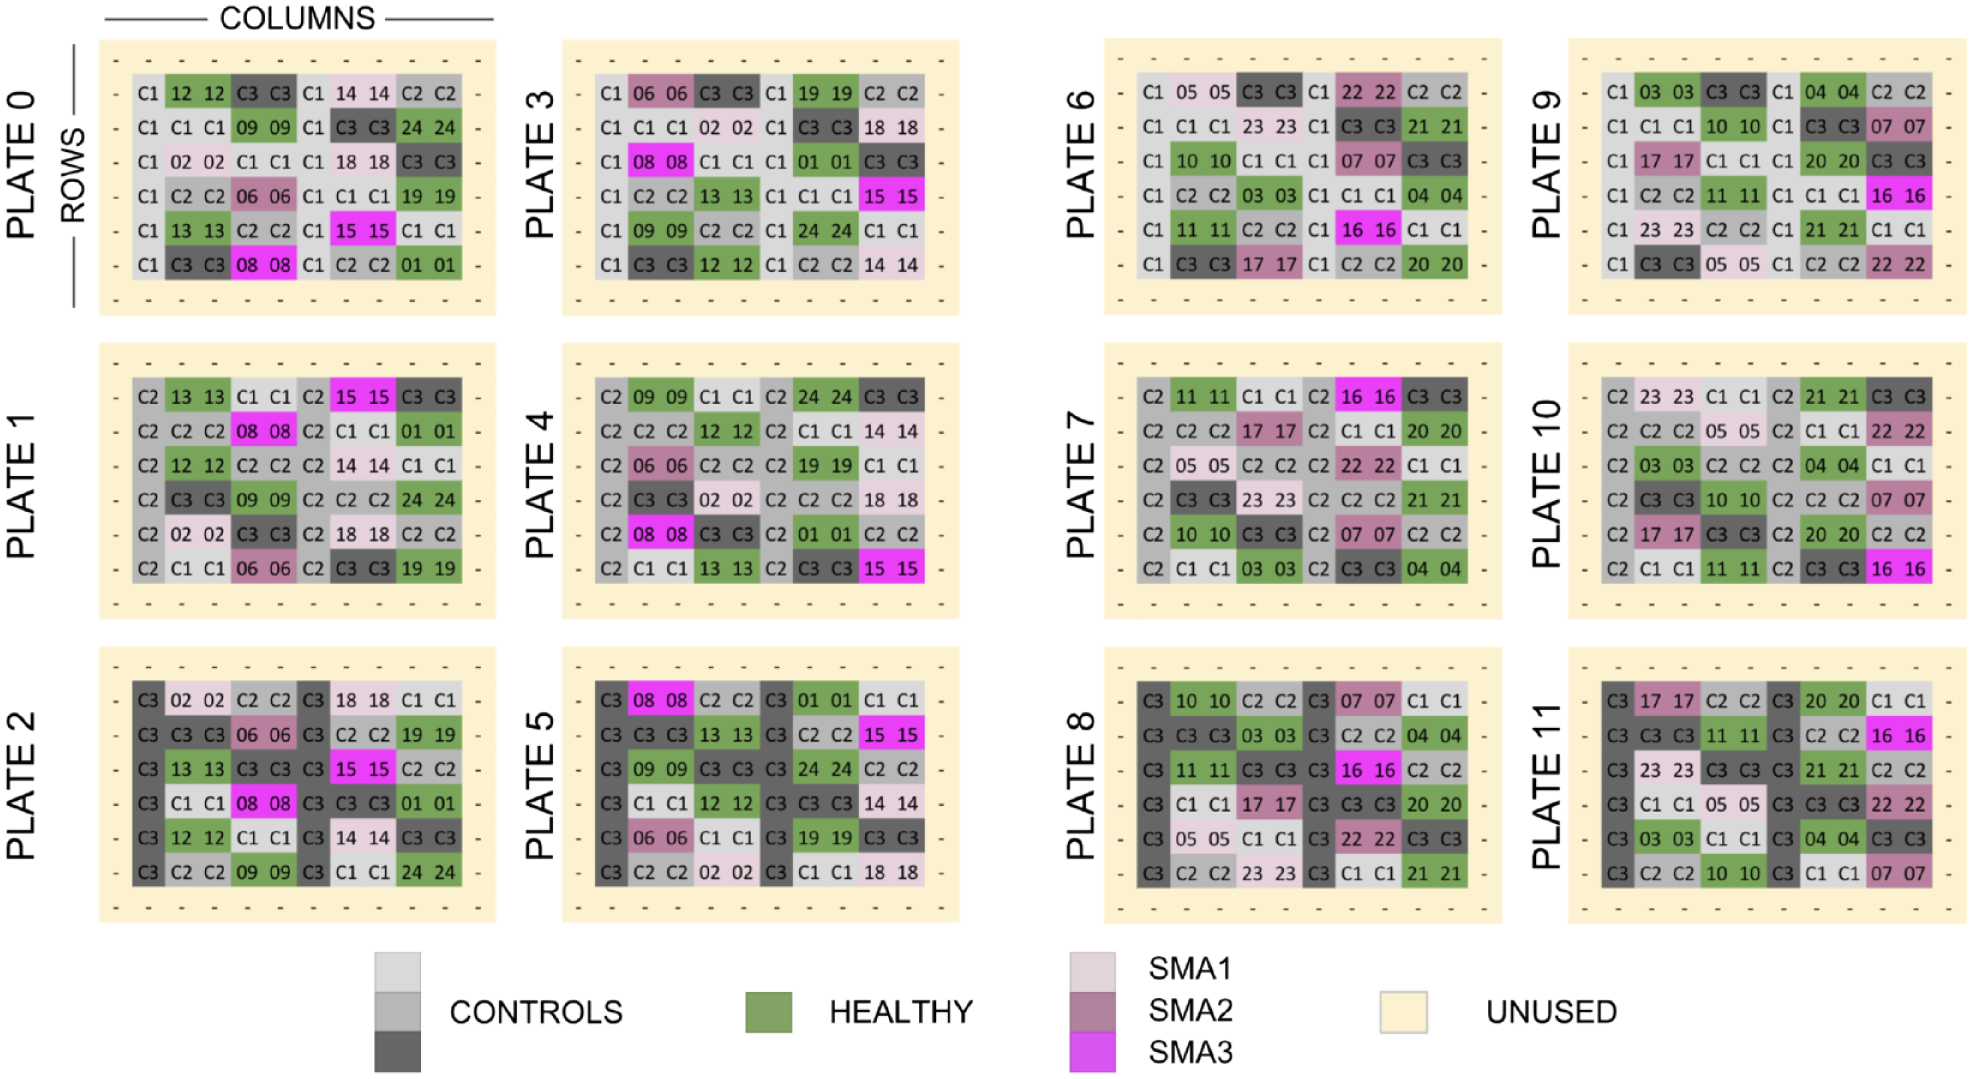
Plate layout design for a disease-focused experiment with 27 human fibroblast cell lines. Each square represents one well (on a 96-well plate) containing cells from one subject cell line (labeled with a two-digit subject ID). The images of the cells were used in two separate analyses with completely independent sets of subjects. In the first analysis, the gray wells representing three healthy control subjects (C1, C2, and C3) were used to assess the detectability of nuisance factors. The second analysis, for detecting disease state, used the green and magenta wells representing 24 experimental subjects (01, …, 24) consisting of 12 healthy subjects and 12 subjects with spinal muscular atrophy [SMA; five with the survival of motor neuron 1 (SMA1) gene, four with SMA2, and three with SMA3; SMA* refers to disease type]. Unused wells were filled with media but contained no cells.
Cell plating and staining were performed as described in the pilot experiment. One difference in experimental design was a shift to confocal imaging with multiple z-stacks, which was deemed necessary due to focus issues detected in the pilot that are described in the Results section. Since the Phenix uses four excitation lasers in confocal mode and the Cell Painting assay requires five channels, we shifted to the Yokogawa CV7000 operating with the CellVoyager Measurement System (version R1.17.06; Yokogawa, Tokyo, Japan) software and a robotic arm (BiNEDx; PAA Automation, Farnborough, UK) for handling multiple plates, controlled by the Wako Automation Software Suite (FUJIFILM Wako, Mountain View, CA). Image acquisition was performed with a 0.75 NA 20× objective, producing 2560×2160 resolution images. For Hoechst, laser excitation at 405 nm with the emission filter at 445/45 nm was used; for SYTO 14, 488 nm and 600/37 nm; for A 488, 488 nm and 525/20 nm; for Phalloidin 568, 561 nm and 600/37 nm; and for MitoTracker, 640 nm and 676/29 nm; Hoechst and MitoTracker were acquired simultaneously. Thirty-five nonoverlapping confocal images with five planes at 2 µm steps were acquired from each well for maximal coverage. For each site and channel, these z-stacked images were converted into a maximum-intensity projection image for analysis. Image processing and cell segmentation were performed as described above. To support exploration of various signals using traditional machine learning approaches, we either converted segmented cells into one-dimensional embeddings or used raw images for exploration of disease signals, as represented in the schema in Figure 2 .
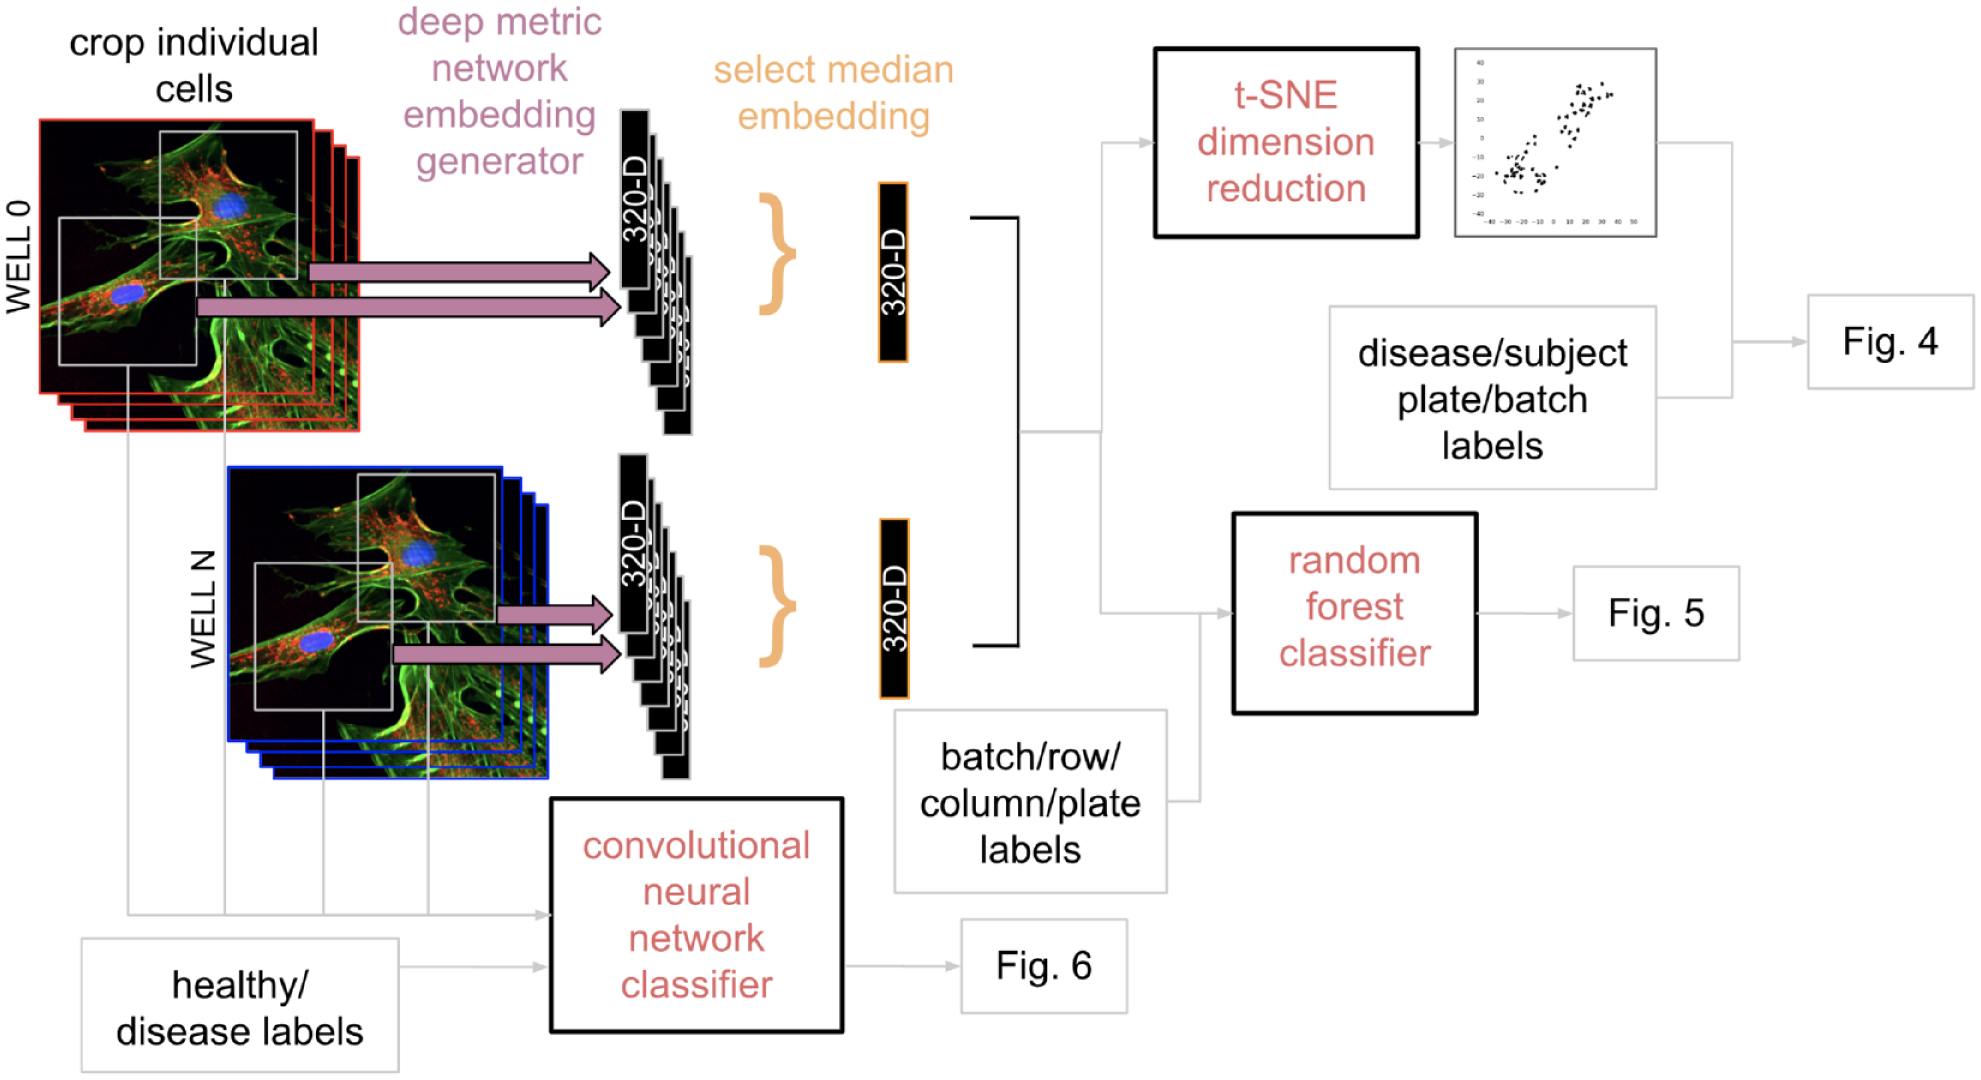
Flow chart of three primary data analysis methods used. (Upper left) For the first two approaches, a pre-trained convolutional neural network (CNN) is used for dimensionality reduction to produce 320-dimensional (320D) cell embeddings (i.e., a numeric vector with length 320) for each segmented five-channel image of a cell. A vector with the median value throughout each dimension is used to produce one embedding (e.g., 320D point) per well, after which either T-distributed stochastic neighbor embedding (t-SNE) is used to further reduce the dimensionality such that each well is represented as a two-dimensional (2D) point for visualization, or a random forest classifier is trained to identify nuisance factors. (Bottom left) The final approach utilized the original cellular images labeled with healthy or disease status from which we trained a CNN to predict disease state.
Image-Embedding Generation
Compared to engineered image feature approaches, image embeddings require less manual parameter tuning, especially if a pretrained model is used, and they have outperformed engineered features in their predictive power. 26 To obtain image embeddings, each individual 256×256 channel image of a cell was first converted into an 8-bit RGB (red-green-blue) image. Next, we extracted features and activations from the penultimate, fully connected layer of a CNN. 28 In this work, we used Inception architecture 24 pre-trained on the ImageNet object recognition dataset 25 containing about 1.2 million images of a thousand categories of objects. Each 256×256×3 single-channel RGB image is propagated through the Inception network, and the embeddings from the penultimate layer of the network are projected to a 64-dimensional vector (i.e., 64×1×1). 26 Concatenating the five vectors from the five individual fluorescence channels for a particular 256×256 crop yielded a 320-dimensional (320D) vector (i.e., 320×1×1), also known as an embedding. 26
Modeling and Data Analysis
We conducted three types of analyses on the data from the disease-focused set of experiments. For the T-distributed stochastic neighbor embedding (t-SNE) dimension reduction 37 analysis, an exploratory unsupervised learning approach, the median 320D embedding vector among all cells in each well was taken to represent that particular well (i.e., for each dimension, the median among all cells was computed), and the t-SNE algorithm was run on the collection of well-median embeddings from all 24 experimental subjects using default settings (perplexity = 30.0, early exaggeration = 12.0, learning rate 200, 1000 iterations), to produce a transformation into a two-dimensional space. To unveil dominant variations other than the batch/plate type effect, we also applied the t-SNE algorithm to embeddings in each batch separately.
In the next analysis with the random forest classifier, we sought to quantify the ability to predict certain nuisance signals using a supervised learning analysis. We similarly started with a collection of well-median embeddings, but focused on a subset of wells corresponding to three control subjects. We then selected a subset of well embeddings that enabled us to balance the number of samples representing each nuisance strata. For each nuisance factor (plate, column, or row), the embeddings were randomly divided into three sets (folds), and a random forest estimator (with 100 base estimators) was fit and evaluated using threefold cross-validation, yielding an average prediction accuracy. To estimate a baseline accuracy, we randomly permuted labels 38 of each nuisance factor before fitting a random forest estimator. The random permutation is supposed to destroy the dependency between embeddings and the nuisance factor, so that the prediction accuracy can be used as a baseline as if there were no nuisance factor at all. Because we sought to only reveal the existence of nuisance signals rather than maximize prediction accuracy, we used this random forest model rather than a DNN.
Finally, to assess predictions of SMA, we used three types of models. The first two methods, random forest (with 100 base estimators) and logistic regression, were trained using the image embeddings, similarly to the approach used to explore nuisance signals. The third, a CNN, was trained directly on the 256×256 cell images. We decided to test CNNs as an additional method because they have achieved expert-level performance in identifying many disease types, including diabetic retinopathy, 39 skin cancer, 40 and breast cancer. 41 CNNs 42 operate directly on raw images and implicitly learn features necessary for the final classification task. In this study, we used a seven-layer CNN architecture with a two-class prediction head containing softmax scores. The model was trained for about 100 epochs, or 900,000 steps, using a batch size of 32. Given that the embeddings were generated using the model pre-trained on consumer data, it is likely that they may capture the information contained in the images differently from the CNN model that was trained on the images directly. For all the models, we conducted 12-fold cross-validation on the 12 age-matched pairs of experimental subjects, with one healthy subject and one with SMA in each pair. The prediction for each well is taken to be the mean of the predicted probabilities among all cell images in that well, and the area under the receiver operating characteristic (ROC) curve (or AUC) was evaluated on well-level predictions for the pair of subjects.
Results
Focus Quality Analysis
In our pilot experiment, we acquired single z-plane widefield fluorescence images from all wells of the 96-well plates. Thirty-seven nonoverlapping single z-plane widefield sites were imaged in each well. Example images of each channel are presented in
Figure 3a
. Using the pre-trained DNN model described in Yang et al.,
21
we objectively and comprehensively assessed focus quality for every cell in the DAPI channel. The results are presented in
Figure 3b
. The average focus score throughout all cells in a site image is represented as a colored pixel, with the values for sites within a well displayed row by row, starting at the upper left. The arrangement of the sites within each well, as presented in
Figure 3b
, is not the same as the physical layout of the sites. We observed degraded focus quality toward the edges of the plates, as can be confirmed with visual inspection of images in
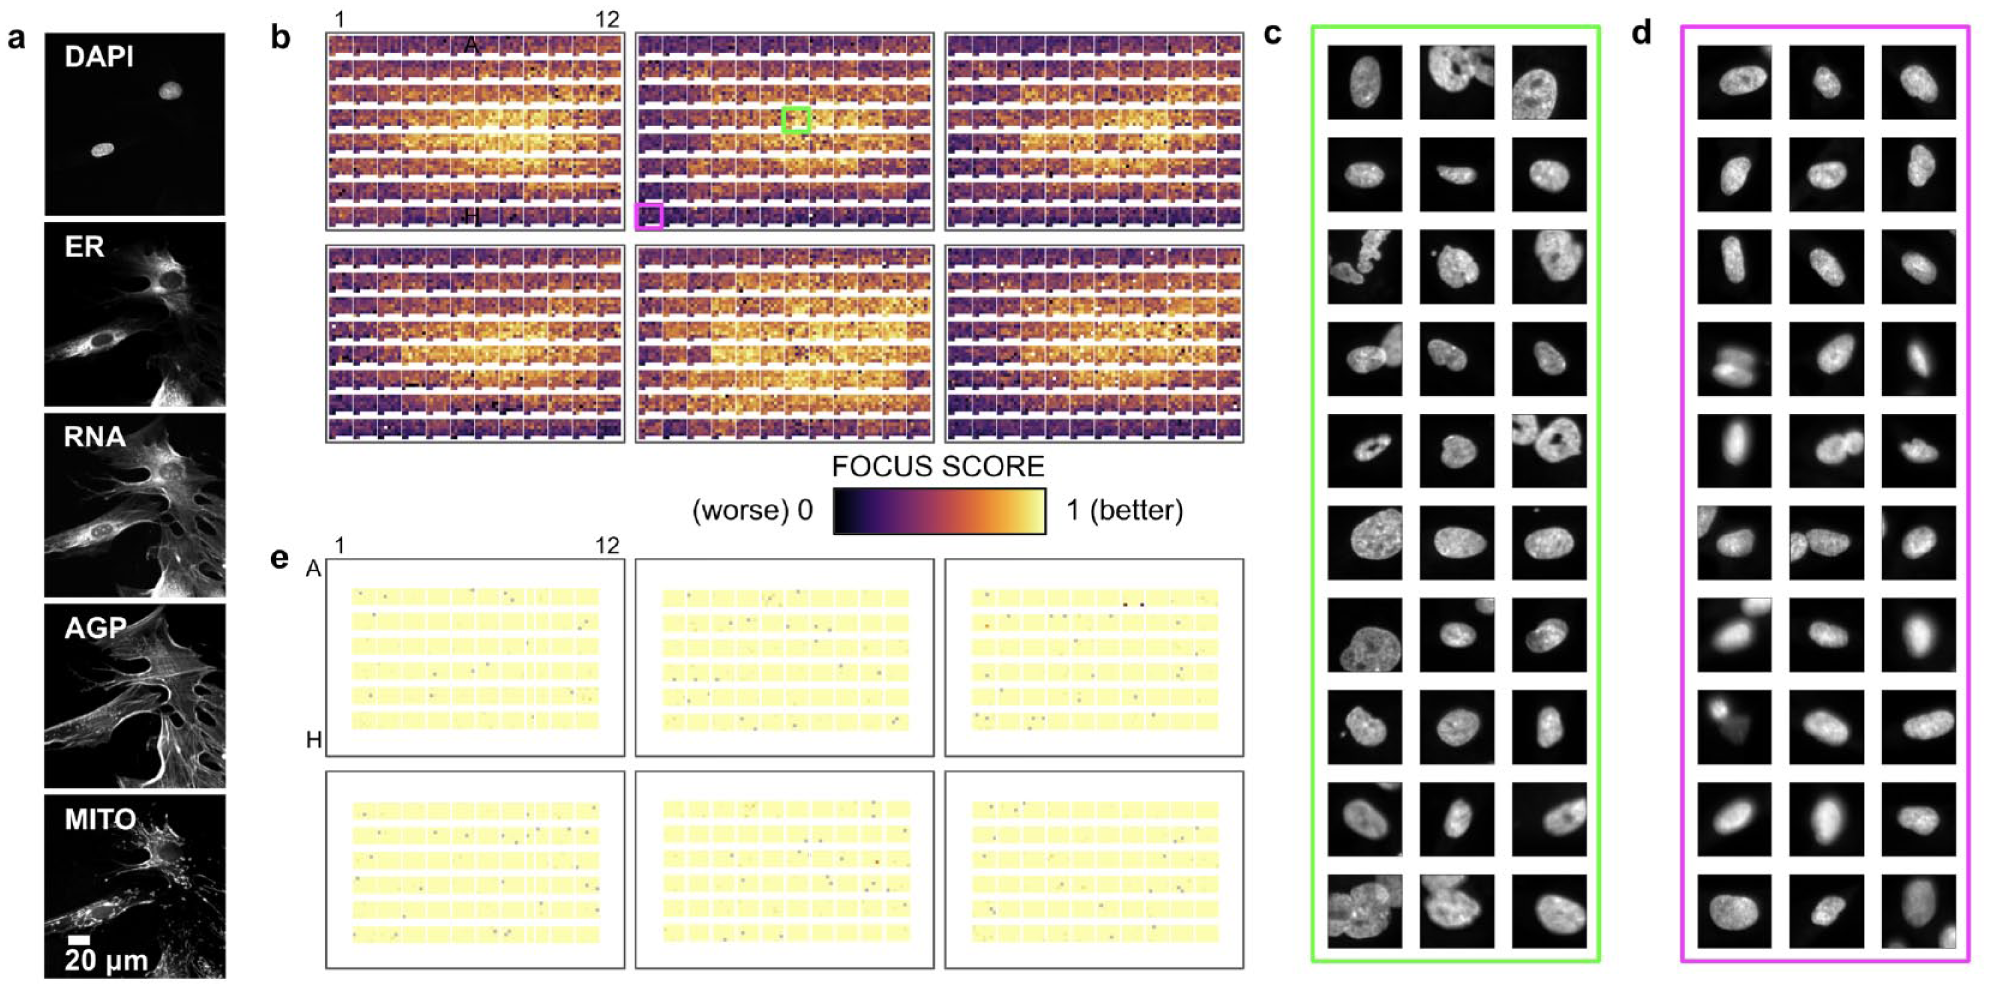
Cell Painting example and image focus analyses: (a) images of each stain acquired using Cell Painting; (b) image focus quality analysis as a function of position on six 96-well plates (PerkinElmer ViewPlate) for DAPI stain widefield images; (c) 128×128 crops around randomly sampled cells from well B07; (d) cropped cells from well H01; and (e) image focus quality analysis, similar to (b), but with a different plate type (Cellvis glass) and image acquisition scheme (maximum projections of a confocal z-stack).
Detection of Nuisance Signals
We first took an unsupervised learning approach to see if nuisance signals could be detected. Because it would be computationally difficult to run dimensionality reduction methods on raw image pixels, we used image embeddings from the cell images. Figure 4 displays the results of the unsupervised dimensionality reduction conducted using t-SNE. The plots reveal little discernible separation or clustering by subject disease state or by plate number, but significant separation by experimental batch/plate type. These plots suggest that it is important to balance experimental conditions (e.g., subject cell lines) among experimental batches/plate types, and in the extreme case, as in ours, include all experimental conditions on every experimental batch/plate type because any biased distribution may cause partial selectivity due to batch/plate type signal. Supplementary Figures 1 and 2 display the results of the unsupervised dimensionality reduction conducted using t-SNE for batches/plate types 0 and 1, respectively. The same phenomena were observed as when t-SNE was applied to both batches/plate types.
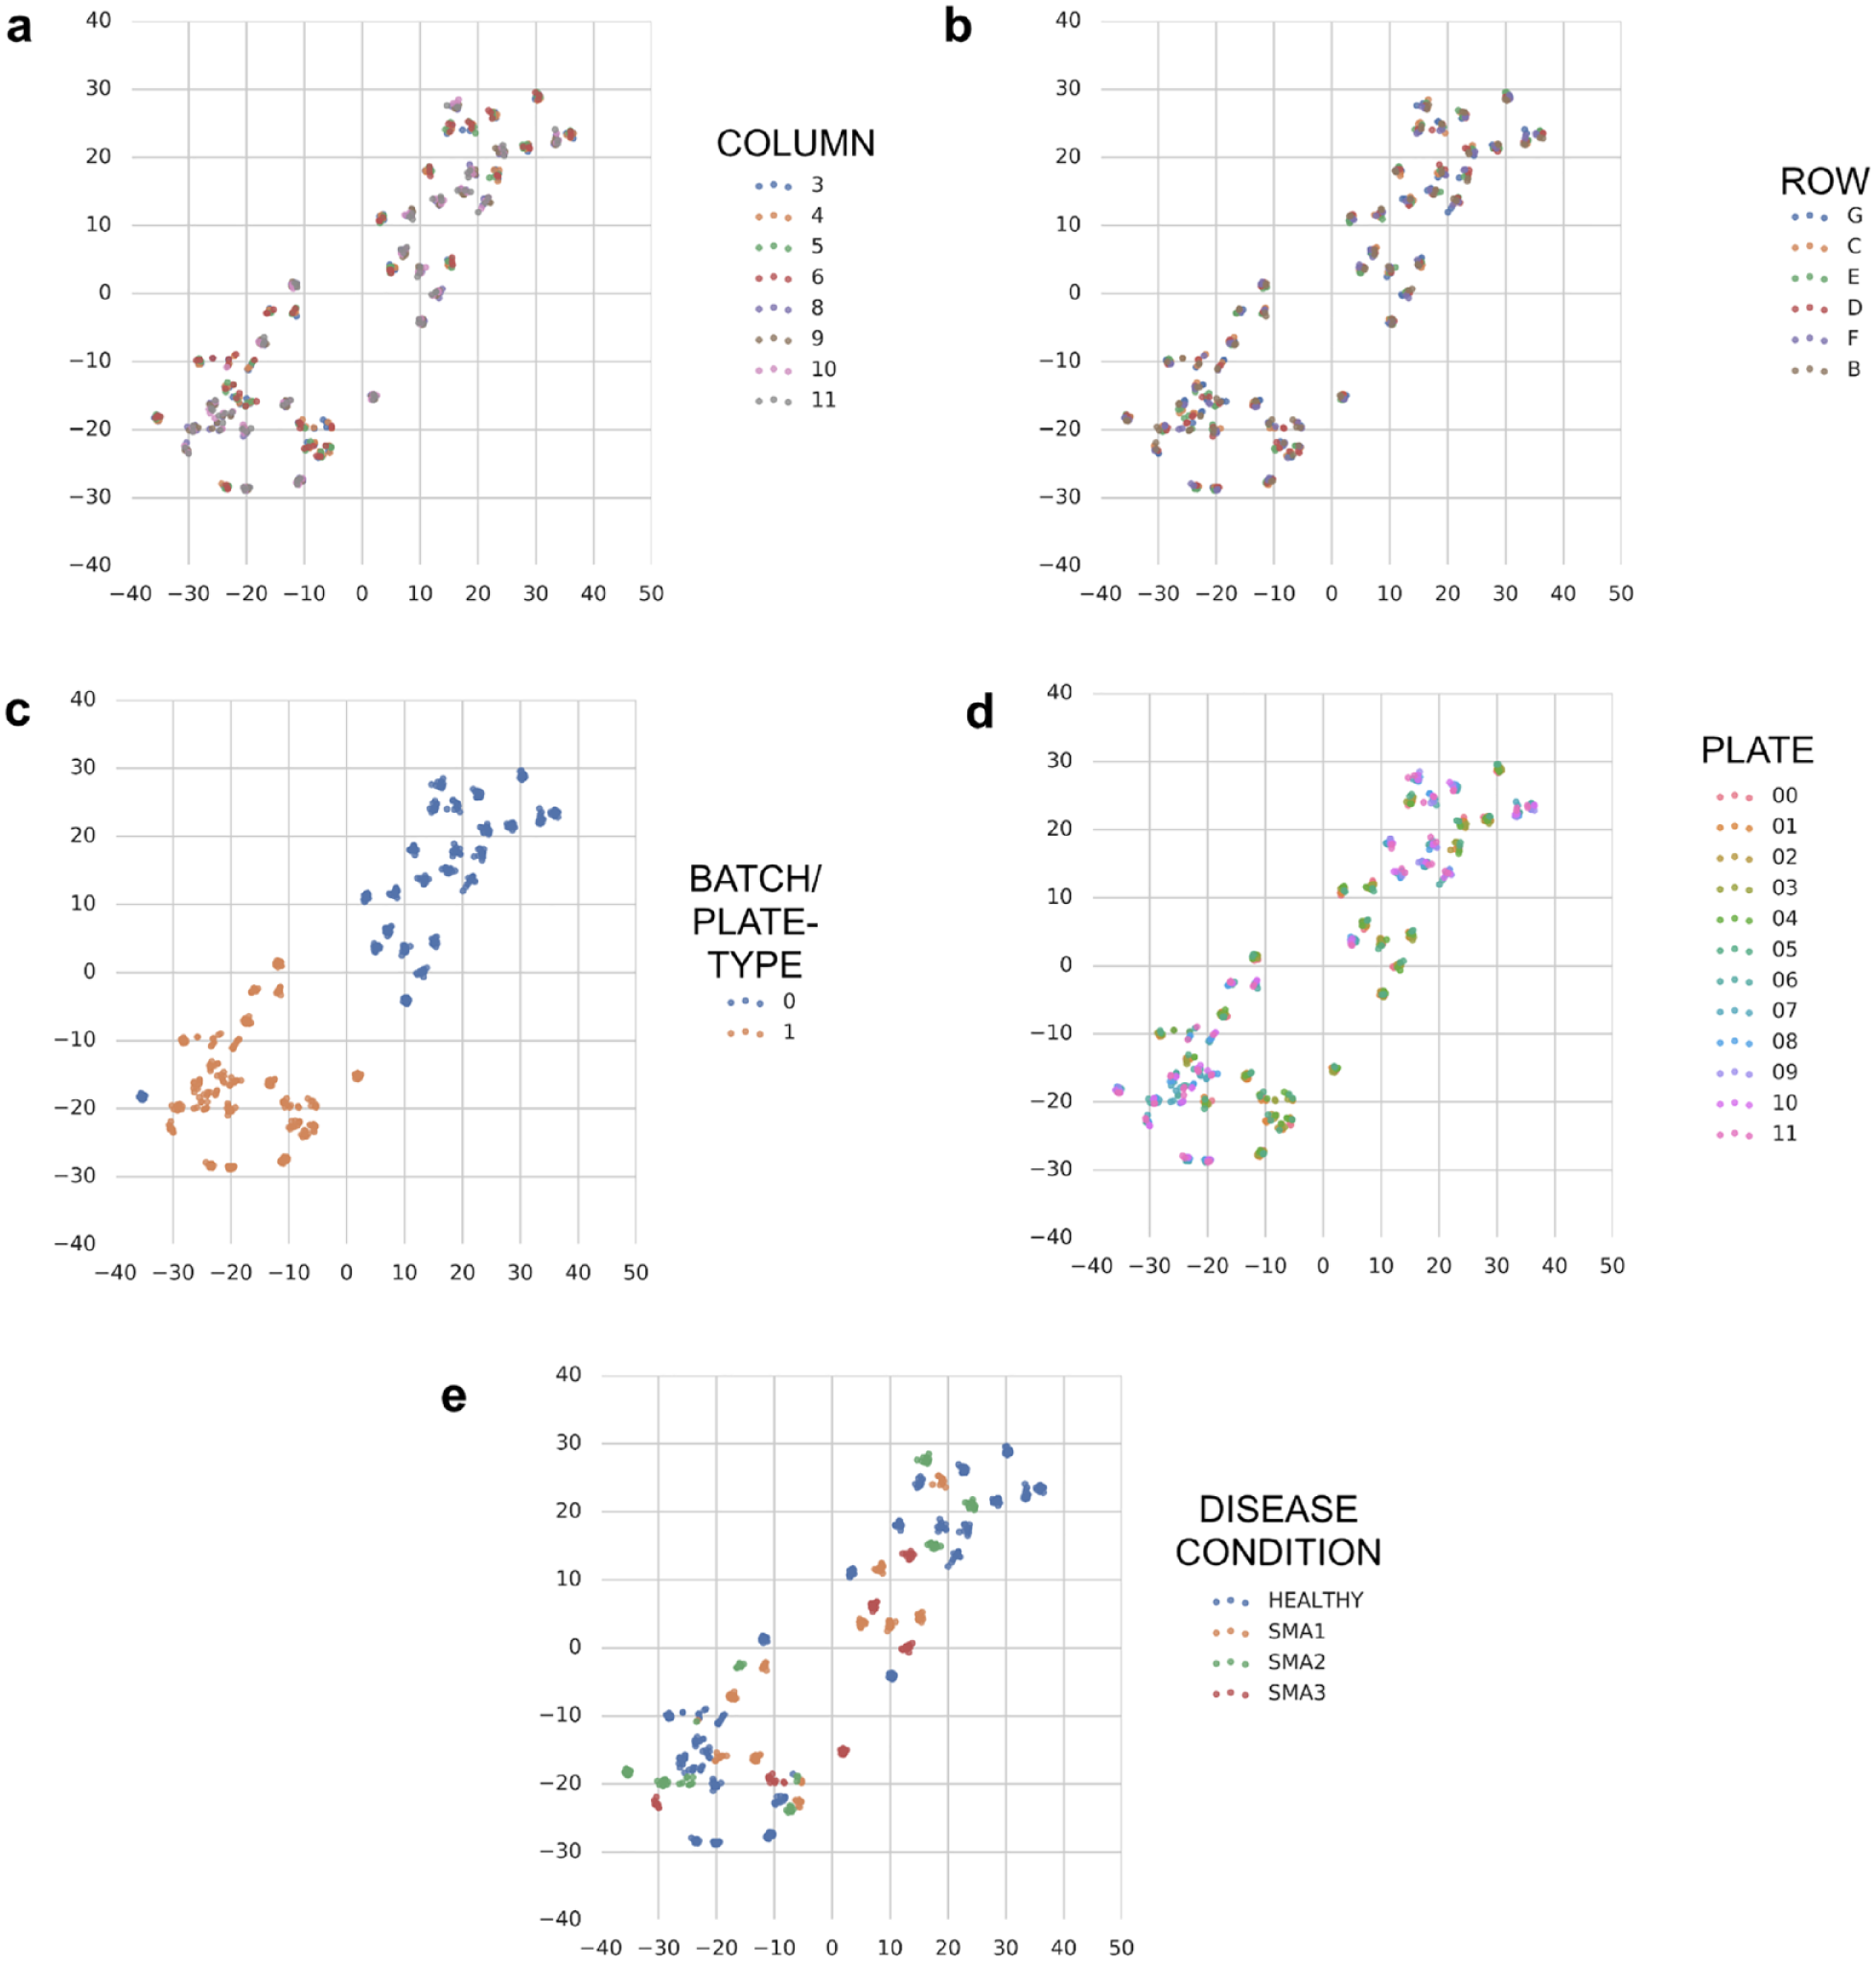
Dimensionality reduction visualization with T-distributed stochastic neighbor embedding (t-SNE) of image embeddings from 24 experimental subjects. Each point represents the median cell image embedding from ~2000 cells in a single well, and the points are colored based on the following: (
We next sought to quantify the extent of the nuisance signals present in the data via a supervised learning assessment, as shown in
Figure 5
. Again, for ease of use, we started with the image embeddings of the cells rather than the raw images, and we used a random forest classifier as a simple baseline test. When using a subset of wells (highlighted in
Figure 5a
) that have representation balanced among batch/plate type, column, and row, a model can predict (from the image embeddings) columns with 61.9% accuracy compared with 50.1% baseline, and rows with 26.5% accuracy compared with 17.6% baseline, as shown in
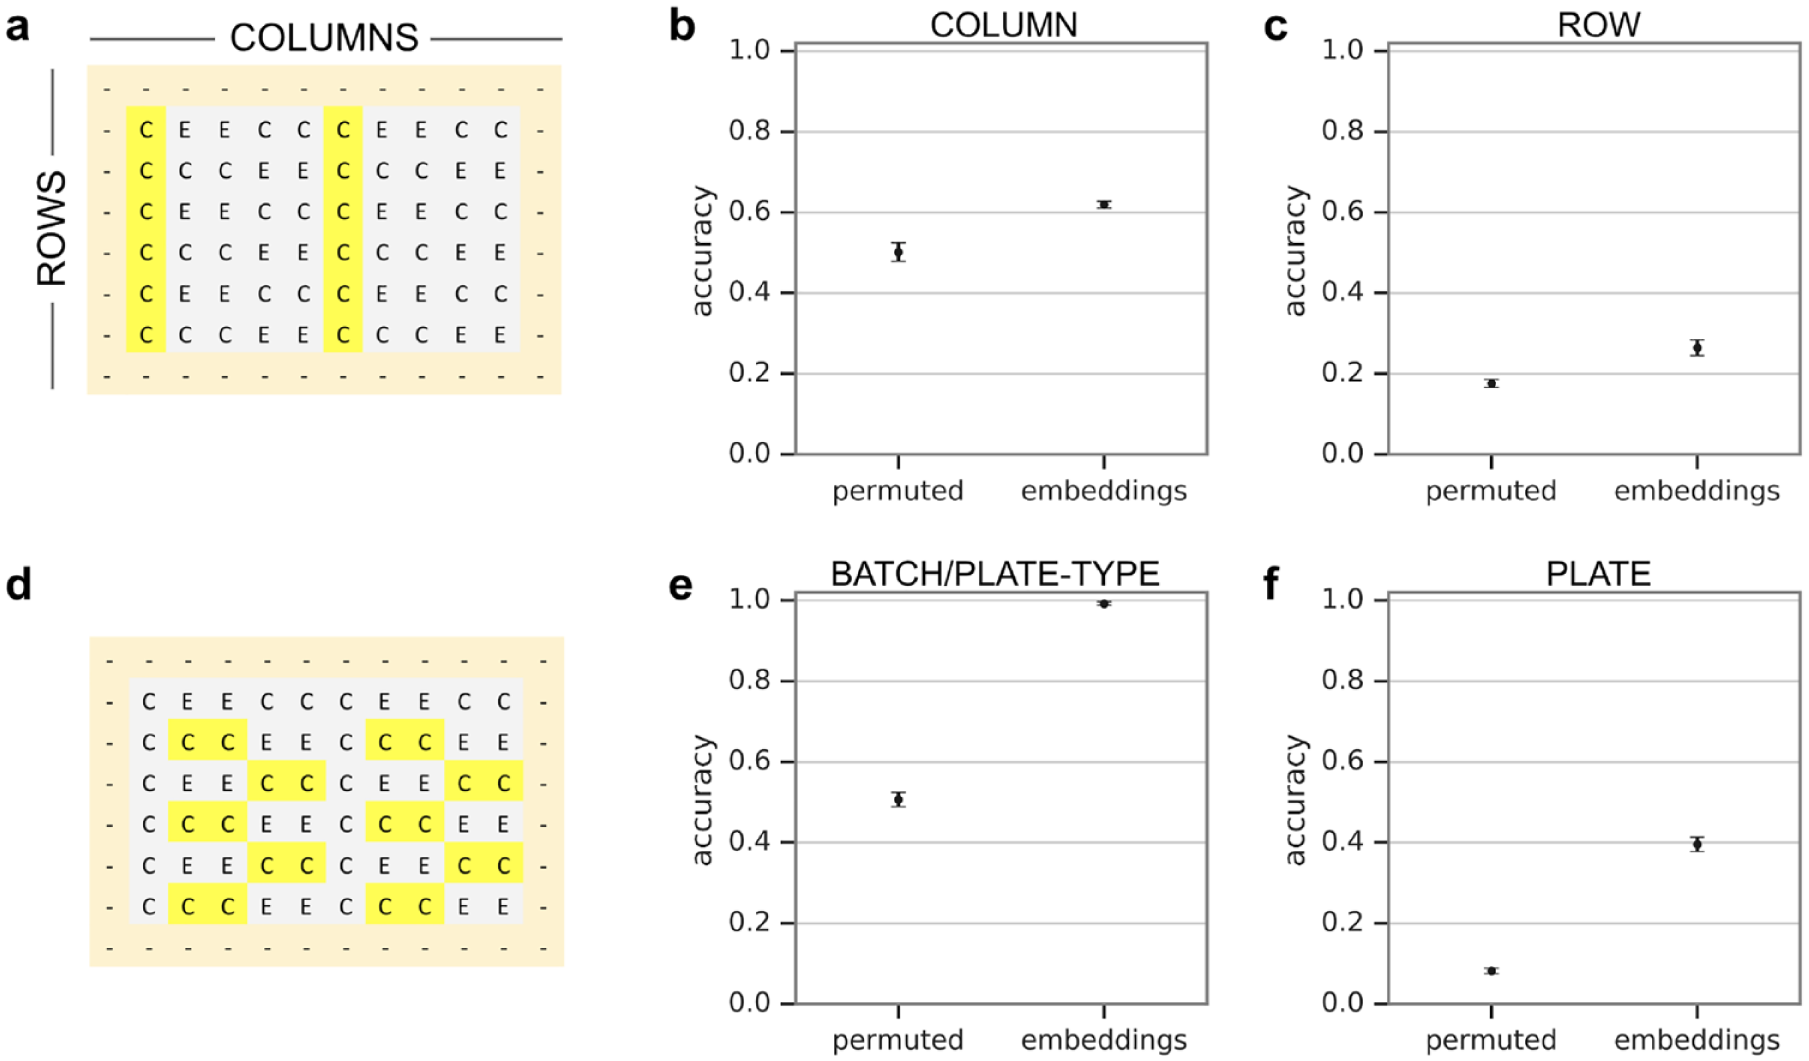
Supervised learning assessment of nuisance signals. (
Predicting Healthy Subjects versus Subjects with SMA
Finally, we sought to answer the question of whether a model could be trained to identify whether cells from an unseen or unknown subject (e.g., not used to generate the model) were from a healthy or SMA subject. For each instance of each model we evaluated, we trained it on data from 11 pairs of subjects matched by age at biopsy, using the remaining, held-out, 12th pair of subjects to evaluate the prediction accuracy of the model. As before, we started using embeddings with logistic regression and random forest within each batch/plate type, among the batches/plate types, and finally with the combined dataset. The results for logistic regression and random forest are presented in Supplementary Figures 3 and 4 . Another approach that we took, instead of extracting features and applying a machine learning model to the features, was to evaluate how CNNs, which have become the de facto standard for any image-based classification, would compare. In this work, we evaluate their performance in distinguishing healthy and disease lines. These CNN prediction results are presented in Figure 6 . Qualitatively, all attempts at modeling show that disease-relevant features are detectable and yield AUCs generally better than random (0.5 AUC). These results are complicated when compared by formal statistical hypothesis testing, because the reuse of pairs among training datasets makes AUCs as estimators of the model performance correlated to each other. With that caveat in mind, we did attempt to compare among the modeling approaches with summarized boxplots presented in Supplementary Figure 5 . The mean AUC for the broadest task, in which we trained and tested with batches/plate types 0 and 1, was the highest using the CNN (0.83), followed by random forest (0.77) and logistic regression (0.74). A pattern emerged in the CNN result that was not present in the other methods. In all subject pairs but one, the AUCs are generally significantly better than chance (0.5 AUC); in one subject pair, however, the AUC was generally significantly worse than chance. A closer inspection reveals that this is the only subject pair for which both the healthy and disease cell lines were obtained from the same laboratory source; for all other pairs of subjects, all of the healthy subject cell lines came from one source, and the disease cell lines from the other. As a result, it is possible that the use of raw images combined with the CNN approach revealed that additional information may be detectable from the cell source that is either partially masked by the embeddings or less detectable using the logistic regression or random forest models. For the CNN, it is inconclusive whether our prediction ability in this task is due to true SMA disease signals, because it could be any combination of true SMA disease signals or laboratory source for a particular cell line. A follow-up analysis, shown in Supplementary Figure 6 , was conducted using the SMA subject line that did not produce positive predictions (subject 14), in which this subject was held out as the test pair with each other healthy individual, totaling an additional 12 trained models. The results show that this subject does not consistently get predicted as either an SMA subject or a healthy control.
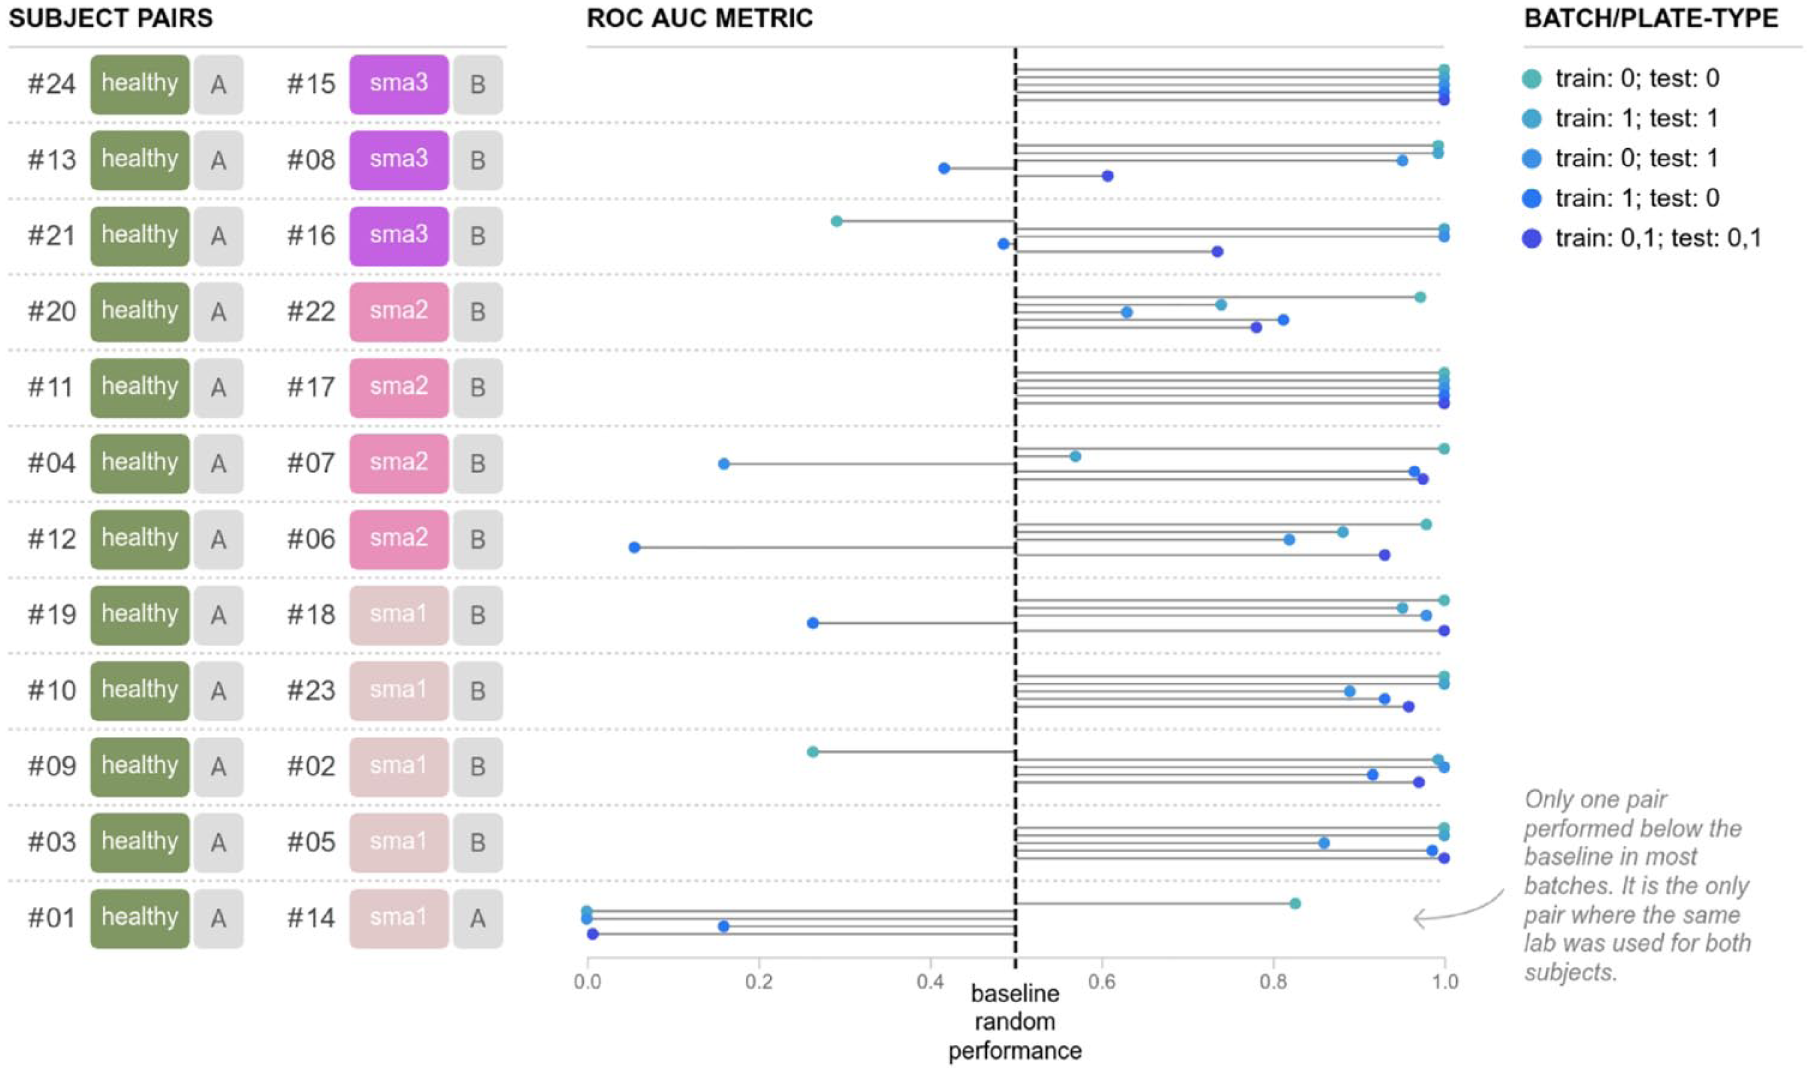
Convolutional neural network (CNN) performance in predicting disease state
Discussion
The research described in this article represents a critical step toward the use of machine learning for identification of subtle patterns in data derived from cells from numerous patients. Evidence is provided that inherent properties of cells representing dozens of subjects affected by SMA and matched controls could be identified using solely images of their primary fibroblasts stained to highlight universal cellular features. 8 These findings, derived from genetically defined and distinct cohorts, lay a foundation for future studies exploring diseases in which more complex genetic contributions may lead to common cellular phenotypes suggesting similar disease trajectories. It is our hope that our work regarding the establishment of methods and guidelines that minimize the effects of avoidable technical issues associated with these large-scale cell-based assays will empower future studies of other CNS disorders.
In this study, we acquired images from fibroblasts of 27 unique subjects, 12 of which had a genetically confirmed diagnosis of SMA. Their cells were distributed throughout 12 96-well plates in such a way as to permit evaluation of whether subtle signals derived from various sources of study design could be detected by machine learning technologies, while also supporting a study accounting for these features to determine whether prediction of SMA disease state was possible using a trained DNN. Our experiment used the tSNE technique to generate unsupervised clustering of site- (or well-) level aggregated data. The resulting plots clearly showed two clusters. There is a clear separation between batches/plate types, highlighting the necessity for any predictions generated to be insensitive to batch/plate type effects. We note that our median aggregation inevitably may mask valuable information about subpopulations of cells that may exist in each well.
Secondary data analysis leveraged supervised learning techniques to validate the positive prediction of batch/plate type effects and to test whether models could be generated to predict signal derived from plate, row, and column. Our results indicate that it is possible to predict each of these nuisance factors. These findings demonstrate the critical need to distribute cells from each experimental condition (e.g., disease state or subject cell line) uniformly among nuisance factors so that changes in cell appearance associated with said factors do not contribute to the model selectivity for detection of the target (e.g., disease). Based on our findings, we provide a template for distribution of cells lines that we intend to serve as a guide for future studies. Specifically, we suggest the following: even representation of cell lines (or suspected classes) among batch/plate type, plate, location within a plate, cell line source, passage, and subject demographics at sample collection. As the number of subjects increases, transition to higher-number well plate formats will be necessary. That will require additional assay development. Furthermore, we expect that larger studies will require a form of randomization to distribute subject lines among plates. These studies may need a larger number of replicates to ensure that prediction models are not affected by the distribution of subject samples.
Finally, we used our proposed plate design to determine the accuracy of prediction models at predicting disease state when applied to cells from an unseen subject not used to train the model. This was done using 12 pairs of matched SMA subjects and controls. Independent prediction models were generated from data using 11 of those pairs and applied to the remaining. This was done using data within each batch/plate type, from one batch/plate type applied to the other, and with the combined batches/plate types. All three machine learning approaches performed better than random. During visual comparison of the results, a unique pattern emerged with the CNN results. Except for one SMA–control pairing, our prediction models performed well above chance and for many pairings perfectly predicted disease state. An important feature of the pairing that regularly did worse than random in the CNN model is that the SMA line was acquired from the same source as all of the control samples. All other SMA lines were collected as a part of a single study and expanded at the same repository.34,35 This indicated to us that this cell line either had outlier properties as it related to its SMA status or that selectivity of our CNN model was not solely based on SMA but based on integrated properties of cell source. The logistic regression and random forest models did not show any evidence of cell source having an impact on selectivity. Given the fact that the CNN-based modeling task was the only one to use raw data, it was unsurprising that its selectivity may be derived from different features. The fact that cell source could potentially drive selectivity highlights the need for future studies to ensure sufficient representation from all sources of cells or to use a single source.
In summary, we demonstrated that cell line–specific features could be predicted using images of fibroblasts collected with our study design. That the model was applicable among batches/plate types demonstrated that the detectable differences in batches/plate types driving separation in the unsupervised analyses were independent of what is being selected as SMA, and indicates that this model may be applied with differing resources such as plate or other experimental parameters. This is critical because widespread deployment of a diagnostic prediction model likely will need to accommodate differing resources and expertise at study sites. Future steps will be to explore biologically relevant features that can be studied to reveal the underlying drivers of disease, which could ultimately be targeted with interventions.
We recognize that there are limitations to our study, the most prominent being the lack of uniform distribution of controls and SMA cells from the two different sources. This is something we intend to address in the near future. Even so, we remain confident that while a signal attributable to cell source signal may have affected the SMA selectivity of our model, it reinforces the model’s capability of selecting inherent features of the cells and suggests that the model will be applicable to other comparisons between disease and healthy cells, especially taking into account potential problems we have already highlighted.
In conclusion, our work demonstrates the promise for elucidating subtle patterns representing biologically important cellular features among numerous patient samples. Our findings highlight the importance of designing experiments in such a way so that readily present nuisance signals are not mistaken for real signals. Collectively, because of the exquisite sensitivity of the model to exogenous factors of study design and potentially cell source, we hope to motivate more controlled studies that will demonstrate the ability for machine learning to identify subtle disease-relevant signals in images generated from patient-derived cells. These findings were generated on primary fibroblasts, but we expect the results to apply to more disease-specific cells, such as neurons generated from patient induced pluripotent stem cells (iPSCs).
Supplemental Material
Google_Harvard_Fibroblast_SMA_supplementary_6-20-2019 – Supplemental material for Applying Deep Neural Network Analysis to High-Content Image-Based Assays
Supplemental material, Google_Harvard_Fibroblast_SMA_supplementary_6-20-2019 for Applying Deep Neural Network Analysis to High-Content Image-Based Assays by Samuel J. Yang, Scott L. Lipnick, Nina R. Makhortova, Subhashini Venugopalan, Minjie Fan, Zan Armstrong, Thorsten M. Schlaeger, Liyong Deng, Wendy K. Chung, Liadan O’Callaghan, Anton Geraschenko, Dosh Whye, Marc Berndl, Jon Hazard, Brian Williams, Arunachalam Narayanaswamy, D. Michael Ando, Philip Nelson and Lee L. Rubin in SLAS Discovery
Footnotes
Acknowledgements
We would like to acknowledge Silvia Piccinotti for her help expanding cells and assistance editing this article. We acknowledge Steve Finkbeiner and Steve Perrin for helpful discussions, and Shan Carter for help with visualization.
Supplemental material is available online with this article.
Data Availability
The image datasets generated and analyzed in this study are not publicly available due to subject privacy.
Author Contributions
Conceptualization: S.J.Y., M.B., D.M.A., P.N., S.L.L., L.L.R. Data curation: S.J.Y., Z.A., S.L.L. Formal analysis: S.J.Y., S.V., M.F., A.N., S.L.L. Funding acquisition: J.H., P.N., S.L.L., L.L.R., W.K.C. Investigation: S.L.L., N.R.M., D.W., T.M.S., L.D. Methodology: S.J.Y., S.V., M.F., A.N., M.B., D.M.A., S.L.L., N.R.M., L.L.R. Project administration: S.J.Y., J.H., S.L.L. Resources: P.N., N.R.M., D.W., T.M.S., L.D. Software: S.J.Y., S.V., M.F., A.N., Z.A., B.W., A.G., L.O. Supervision: L.O., D.M.A., P.N., L.L.R., W.K.C. Validation: S.J.Y., S.V., S.L.L. Visualization: S.J.Y., Z.A., S.L.L. Writing—original draft preparation: S.J.Y., S.L.L. Writing—review and editing: S.J.Y., M.F., S.L.L.
Declaration of Conflicting Interests
The authors declared the following potential conflicts of interest with respect to the research, authorship, and/or publication of this article: S.J.Y., S.V., M.F., Z.A., L.O., A.G., M.B., J.H., B.W., A.N., D.A.M., and P.N. are employees of Google and own Alphabet stock.
Funding
The authors disclosed receipt of the following financial support for the research, authorship, and/or publication of this article: Financial support for this work came from Google and by the SMA Foundation (L.L.R.), National Institute of Neurological Disorders and Stroke grant P01 NS066888 (L.L.R.), the Harvard Stem Cell Institute (L.L.R.), and the MGH Center for Assessment Technology and Continuous Health (S.L.L.).
References
Supplementary Material
Please find the following supplemental material available below.
For Open Access articles published under a Creative Commons License, all supplemental material carries the same license as the article it is associated with.
For non-Open Access articles published, all supplemental material carries a non-exclusive license, and permission requests for re-use of supplemental material or any part of supplemental material shall be sent directly to the copyright owner as specified in the copyright notice associated with the article.