
Abstract
Biomarkers that indicate the presence or severity of organ damage caused by diseases and toxicities are useful diagnostic tools. Metabolomics platforms using chromatography coupled with mass spectrometry (MS) have been widely used for biomarker screening. In this study, we aimed to establish a novel metabolomics platform using ion chromatography coupled with MS (IC-MS) for human biofluids. We found that ethylenediaminetetraacetic acid (EDTA) plasma is not suitable for IC-MS metabolomics platforms because of the desensitization of MS. IC-MS enabled detection of 131 polar metabolites in human serum and urine from healthy volunteers. Pathway analysis demonstrated that the metabolites detectable using our platform were composed of a broad spectrum of organic acids with carboxylic moieties. These metabolites were significantly associated with pathways such as the tricarboxylic acid (TCA) cycle; glyoxylate and dicarboxylate metabolism; alanine, aspartate, and glutamate metabolism; butanoate metabolism; and the pentose phosphate pathway. Moreover, comparison of serum and urine samples showed that four metabolites (4-hydroxybutyric acid, aspartic acid, lactic acid, and γ-glutamyl glutamine) were abundant in serum, whereas 62 metabolites, including phosphoric acid, vanillylmandelic acid, and N-tiglylglycine, were abundant in urine. In addition, allantoin and uric acid were abundant in male serum, whereas no gender-associated differences were found for polar metabolites in urine. Our results demonstrate that the present established IC-MS metabolomics platform can be applied for analysis of human serum and urine as well as detection of a broad spectrum of polar metabolites in human biofluids.
Keywords
Introduction
Biomarkers that reflect the severity or presence of organ damage, including that caused by diseases and toxicities, are useful tools for disease diagnosis.1–4 The discovery of biomarkers in human biofluids that enable prediction of the therapeutic efficacy and toxicity of drugs is clinically important for new drug development as well as for the appropriate use of approved drugs. Endogenous metabolites reflect both genetic and environmental factors and represent the biological processes in the metabolic systems of cells, organs, and the entire organ system.5,6 Therefore, metabolites are expected to represent suitable biomarker candidates. Metabolomics is a useful tool for obtaining an overview of a wide range of metabolites simultaneously and is suitable for high-throughput biomarker identification.7,8 For metabolomics platforms, chromatography coupled with mass spectrometry (MS), such as gas chromatography–MS (GC-MS) and liquid chromatography–MS (LC-MS), have been widely used.9–11 Metabolomics platforms have more recently switched to high-resolution MS, such as time-of-flight MS and Orbitrap MS, which can distinguish ions of different metabolites with the same nominal mass and provide an overview of all ions in a nontargeted manner.
Ion chromatography (IC), by which analytes are separated based on ionic exchange, is a well-established method for analyzing anions and cations. For example, IC has been used for the detection of small inorganic ions such as phosphate, nitrate, and sulfate ions. 12 IC has also been applied for the analysis of polar metabolites, such as uric acid and amino acids,13,14 suggesting that IC coupled with MS (IC-MS) represents a suitable new approach for metabolomics analysis. IC-MS was first applied by Bruggink et al. for the detection of carbohydrates. 15 Subsequently, IC-MS has been used to obtain an overview of polar metabolites, although most analyses have been targeted to limited pathways such as glycolysis, the tricarboxylic acid (TCA) cycle, and the pentose phosphate pathway.16–18 To date, only one study has reported the application of IC-MS to nontargeted metabolomics: The authors characterized metabolic alterations in mouse tissues (colon, liver, small intestine, and lymph nodes). 19 To our knowledge, however, no reports have addressed the application of IC-MS to nontargeted metabolomics in human specimens, and its clinical applicability remains unclear.
Here, we aimed to establish an IC-MS metabolomics platform for human biofluids. We analyzed plasma, serum, and urine, which are human biofluids frequently used in other metabolomics platforms. Gender-associated differences in metabolite profiles have been well characterized using other metabolomics platforms;20–23 hence, we compared metabolite profiles in male and female subjects. Throughout the process of establishment of our IC-MS metabolomics platform, we observed gradual decreases in MS sensitivity; therefore, we excluded ethylenediaminetetraacetic acid (EDTA) plasma from further analysis. In total, 131 polar metabolites were identified, including nucleic acid, amino acid, and sugar derivatives, from serum and urine. Comparisons of serum and urine showed that 4 metabolites were abundant in serum and that 62 metabolites were abundant in urine. In addition, allantoin and uric acid were abundant in male serum, while none of the polar metabolites showed gender-associated differences in urine. Our results demonstrate that the IC-MS metabolomics platform established in the present work can be used for the analysis of human serum and urine, and that this platform enables detection of a broad spectrum of polar metabolites in human biofluids.
Materials and Methods
Human Biofluids
After written informed consent was appropriately obtained from all participants, blood and urine samples were collected at the Yaesu Sakura-dori Clinic (Tokyo, Japan) with the aid of NEUES Inc. (Tokyo, Japan). All participants were self-reported healthy volunteers who had not taken any medications for at least one week. Venous blood was collected from 30 healthy Japanese volunteers in the morning after fasting for 14 h. Participants were age-matched 25–35-year-old men and women. Subject information is displayed in Supplemental Table S1 . For plasma preparation, fresh blood from each individual was collected and simultaneously drawn into 10 ml Vacutainer Plasma Separator Tubes containing EDTA (Becton Dickinson, Franklin Lakes, NJ). For serum preparation, fresh blood from each individual was drawn into 4 ml Vacutainer Serum Separator Tubes with clot activators (Becton Dickinson). Blood samples for plasma and serum were centrifuged and separated within 2 h of blood collection, and immediately frozen. On their receipt at the National Institute of Health Sciences (NIHS), samples were thawed on ice, divided into aliquots, and refrozen at −80 °C until sample extraction. This study was approved by the Ethics Committees of the Yaesu Sakura-dori Clinic and the NIHS, and was performed in accordance with the Declaration of Helsinki.
Standards
All standards used in the present study and their detection limits are summarized in Supplemental Table S2 . The standards were purchased from Sigma-Aldrich (St. Louis, MO), Thermo Fisher Scientific (Waltham, MA), Kanto Chemical (Tokyo, Japan), Cosmo Bio (Tokyo, Japan), Tokyo Chemical Industry (Tokyo, Japan), Funakoshi (Tokyo, Japan), Wako (Osaka, Japan), Abcam (Cambridge, UK), Santa Cruz Biotechnology (Dallas, TX), Peptide Institute (Osaka, Japan), Cayman Chemical (Ann Arbor, MI), Toronto Research Chemicals (Ontario, Canada), Nacalai Tesque (Kyoto, Japan), and SynQuest Laboratories (Alachua, FL).
Extraction of Polar Metabolites
Extraction was performed using an automated system (Microlab NIMBUS, Hamilton Robotics, Reno, NV). The sample (20 µl) was mixed with 80 µl water and 400 µl methanol containing internal standard (2 µM hippuric acid-d5, Toronto Research Chemicals). Subsequently, 300 µl of the mixture was loaded onto the FastRemover for Protein (GL Sciences, Tokyo, Japan) to filter out protein coagulants. The flow-through solution (200 μl) was subsequently loaded onto the FastRemover C18 (GL Sciences) to remove lipids. Finally, 100 µl of flow-through solution was completely evaporated and stored at −80 °C until required for IC-MS analysis.
Ion Chromatography–Mass Spectrometry
The IC-MS metabolomics platform was established using high-resolution Orbitrap MS (Q-Exactive, Thermo Fisher Scientific) coupled with a high-performance IC system (Dionex ICS-5000+, Thermo Fisher Scientific). A Dionex IonPac AS11-HC-4 µm IC column (2 × 250 mm, Thermo Fisher Scientific) was used in this study. The temperature of the column oven was set to 30 °C. The temperature of the sample tray was set to 5 °C. Prior to sample injection, plasma and serum samples were dissolved in 200 µl water, and urine samples were dissolved in 2 ml water. Extracts were filtered, and 5 µl was injected in each run. The potassium hydroxide gradient for sample separation was as follows: 10 mM to 100 mM, 0–24 min; 100 mM, 24–27 min; and 10 mM, 27–30 min. The mobile phase was pumped through at a flow rate of 0.3 ml/min. The IC system contains a post-column electrolytic suppressor to exchange potassium ions with hydrogen ions to prevent loading of excess potassium ions into the MS. To enhance ionization, the methanol line (flow rate: 0.1 ml/min) was merged with a transfer line from IC to MS.
After IC separation, polar metabolites were subjected to MS, operating in heated electrospray ionization (ESI) negative-ion mode. ESI source parameters were as follow: sheath gas, 40; auxiliary gas, 10; sweep gas, 0; spray voltage, −2 kV; capillary temperature, 350 °C; auxiliary gas heater temperature, 300 °C; and S-lens radiofrequency (RF) level, 35. MS data were acquired using a combination of full mass scan (mass-to-charge ratio [m/z] range: 70–1050 at a resolution of 70,000) and top-10 data-dependent tandem mass spectrometry (MS/MS) scans (m/z range: 200–2000 at a resolution of 17,500). The full mass parameters of automatic gain control target and maximum injection time were 3 × 10⁶ and 200 ms, respectively. The MS/MS parameters were as follows: collision energy, 30 (normalized); automatic gain control target, 1 × 10⁵; maximum injection time, 80 ms; and isolation window, 1.5 m/z.
Data Processing and Normalization
Raw IC-MS data were processed using Compound Discoverer 2.1 (Thermo Fisher Scientific). All features at a specific m/z and retention time (RT) were detected and aligned using the default parameters for metabolomics in the software. In the peak detection processes, the full scan data [M-H]− ion peaks were selected as precursor ions, and the features were aligned within a 1 min peak shift at maximum. Subsequently, [M-H]− or [M-2H]2− ions within the same 5 parts per million (ppm) mass tolerance and 0.1 min shift were grouped as a specific unknown feature. All features whose peak areas were fourfold higher than those of blank samples were subjected to annotation by comparing the obtained m/z and RT information of precursor ions to our in-house standard mass list ( Suppl. Table S2 ), as well as the online databases mzCloud (https://www.mzcloud.org) and ChemSpider (http://www.chemspider.com). MS/MS information from mzCloud and the FISH scoring algorithm in Compound Discoverer 2.1, which calculate fragments based on the chemical structure of precursor ions, were used to predict unknown features. Among candidate metabolites predicted using mzCloud, ChemSpider with FISH, and/or ChemSpider only, compounds with the highest MS/MS coverage scores were selected for annotation. Preprocessing of extracted ion peaks yielded 131 metabolites, which are summarized in Supplemental Table S3 .
The peak area of each detected metabolite was normalized to that of an internal standard with the ion peak area of the internal standard adjusted to 1. After normalization, to minimize variations among biofluids, probabilistic quotient normalization was separately performed for serum or urine samples, as previously reported.24–26 In brief, we first calculated the dilution factor as follows: The normalized peak area (calculated using the internal standard) of each metabolite in a sample was divided by the sum of the normalized peak area of the metabolite in all samples. These values were used to calculate the ratio against a reference peak (the median value of the divided values of all metabolites in all samples). The median value of the ratios in each sample was determined as the dilution factor for each sample. Then, all metabolite peak areas normalized to those of the internal standard were further normalized using the corresponding dilution factor for each sample. The normalized peak area with probabilistic quotient normalization was used for statistical analyses ( Suppl. Table S4 ).
Statistical Analysis
For overall comparison of polar metabolites detected in human serum and urine, data were Pareto scaled and analyzed using principal component analysis (PCA) and orthogonal projections to latent structures discriminant analysis (OPLS-DA). OPLS-DA was also performed to compare metabolite profiles between samples from female and male subjects. p(corr) values greater than 0.8 or less than −0.8 were considered significant in S-plots of OPLS-DA. These statistical-modeling analyses were performed using SIMCA+P14 (Umetrics, Umea, Sweden). Pathway analysis was performed to correlate the detected polar metabolites with biological pathways in the Kyoto Encyclopedia of Genes and Genomes (KEGG) database. This analysis was performed using the in silico analytical tool MetaboAnalyst (http://www.metaboanalyst.ca) using all metabolites listed in Supplemental Table S3 . The statistical difference between the two groups was examined by the Mann–Whitney U-test using GraphPad Prism 5 (GraphPad Software, San Diego, CA).
Results
Establishment of an IC-MS Metabolomics Platform for Human Biofluids
Prior to the analysis of human biofluids, we first examined the detection limit of our in-house polar metabolite standards listed in Supplemental Table S2 using IC-MS. Among 190 metabolite standards, we successfully detected 185 polar metabolites, of which the detection limits (relative peak area against blank samples >4) were 2.5 fmol to 25 nmol on the column ( Suppl. Table S2 ).
Next, we used three major human biofluids (plasma, serum, and urine) and optimized the sample preparation to examine whether IC-MS metabolomics is applicable for human biofluids. During the continuous measurement of samples using our IC-MS metabolomics platform, a gradual decrease in ion intensity for quality control of MS sensitivity was observed ( Suppl. Fig. S1 ). By selectively excluding each human biofluid, we determined that the plasma samples caused this gradual decrease. Plasma was prepared using EDTA as an anticoagulant, and an EDTA peak was strongly detected in plasma only ( Suppl. Fig. S2 ). High concentrations of EDTA may lead to desensitization of MS. Therefore, we excluded plasma from further analysis. In addition, we found severe carryover by urine when prepared for IC-MS in the same manner as serum; therefore, we diluted urine samples 10 times before sample injection.
After optimization of sample preparation, we conducted nontargeted metabolomics analysis of human serum and urine samples using IC-MS ( Fig. 1 ). The results showed that the values of relative standard deviation (%) of the internal standard peak area in serum and urine samples were 5.97 and 6.47, respectively, which are acceptable and reliable for metabolomics studies. Via metabolomics analysis, we characterized a total of 131 polar metabolites, including amino acids, in human serum and urine. Among them, 91 metabolites were validated using our 190 in-house standards (Suppl. Table S2 and Table S3). Of the remaining 40 metabolites, 15, 23, and 2 were predicted by mzCloud, ChemSpider with FISH, and ChemSpider only, respectively.
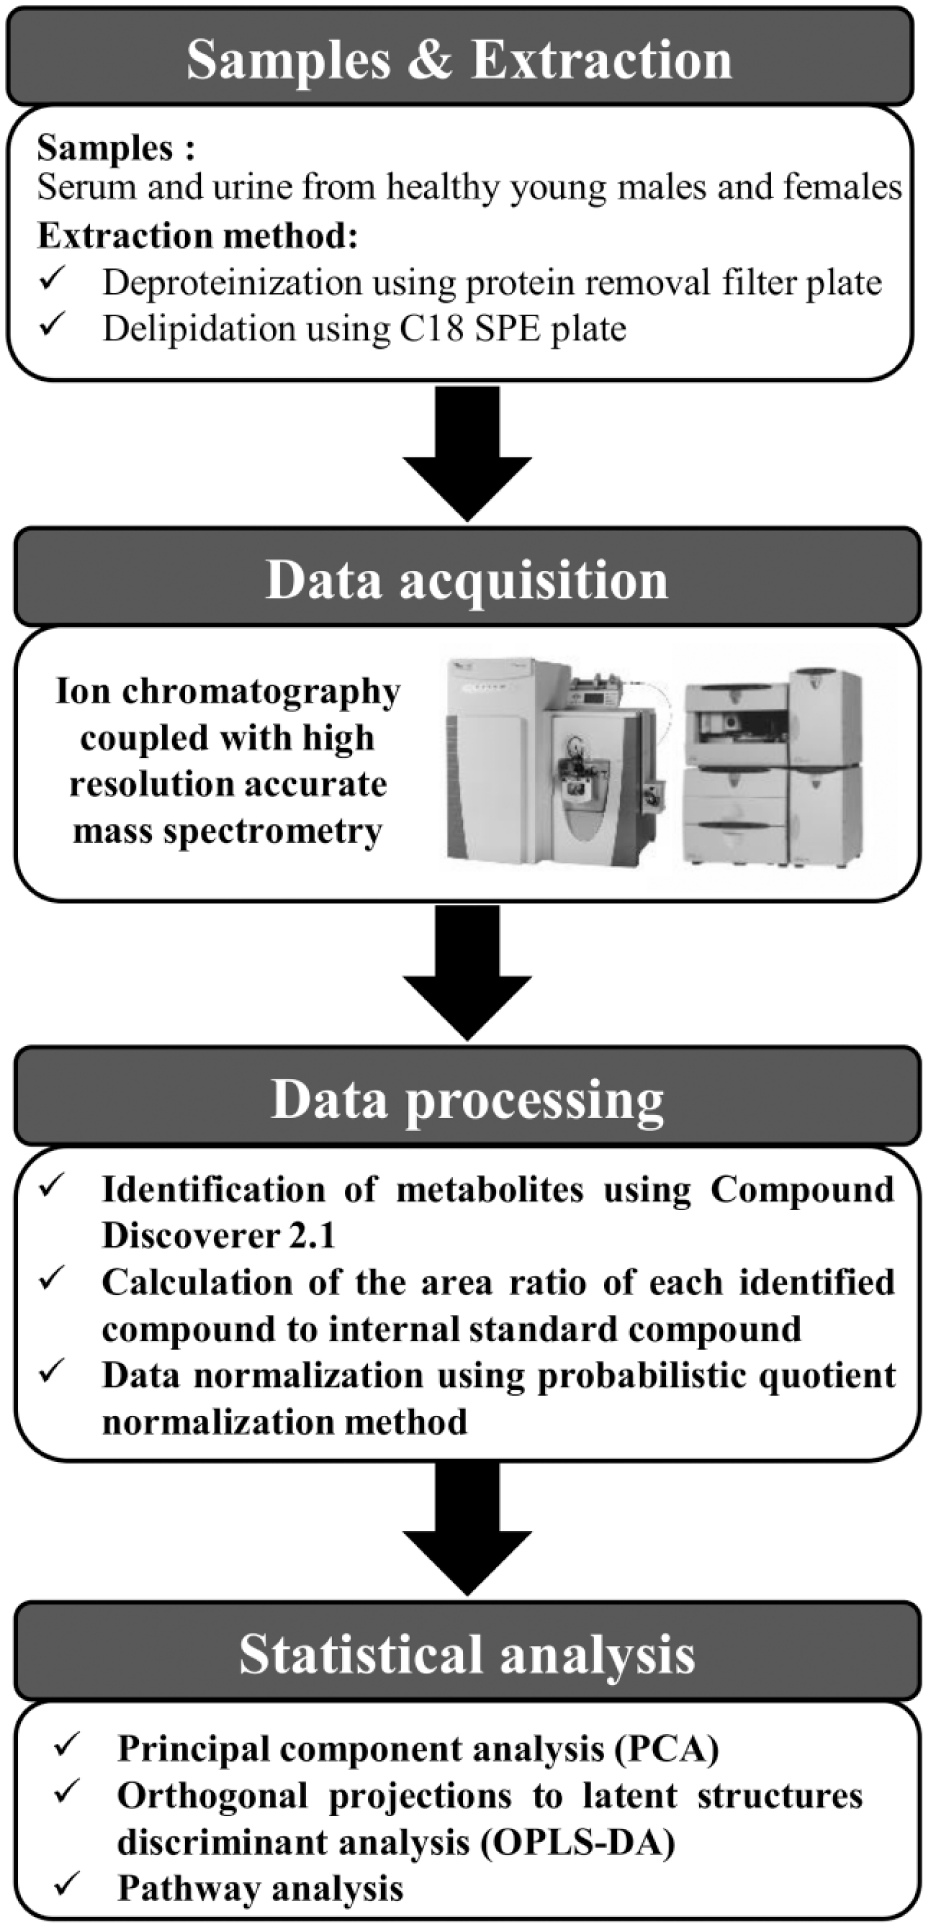
Metabolomics platform for human biofluids using ion chromatography–mass spectrometry (IC-MS): a schematic workflow.
To identify the coverage of IC-MS for specific biological pathways, we performed pathway analysis using characterized metabolites with available KEGG identifications in our IC-MS metabolomics platform. The most highly affected pathway was the TCA cycle, and 8 metabolites (succinic acid, oxoglutaric acid, isocitric acid, malic acid, cis-aconitic acid, citric acid, pyruvic acid, and fumaric acid) out of 20 were characterized (false discovery rate [FDR] = 2.53 × 10⁻⁵) ( Fig. 2 ). Although several metabolites overlapped, glyoxylate and dicarboxylate metabolism (11 out of 50 metabolites, FDR = 6.81 × 10⁻⁵); alanine, aspartate, and glutamate metabolism (7 out of 24 metabolites, FDR = 5.53 × 10⁻⁴); butanoate metabolism (8 out of 40 metabolites, FDR = 2.03 × 10⁻³); and the pentose phosphate pathway (6 out of 32 metabolites, FDR = 0.02) were also characterized as significantly covered.
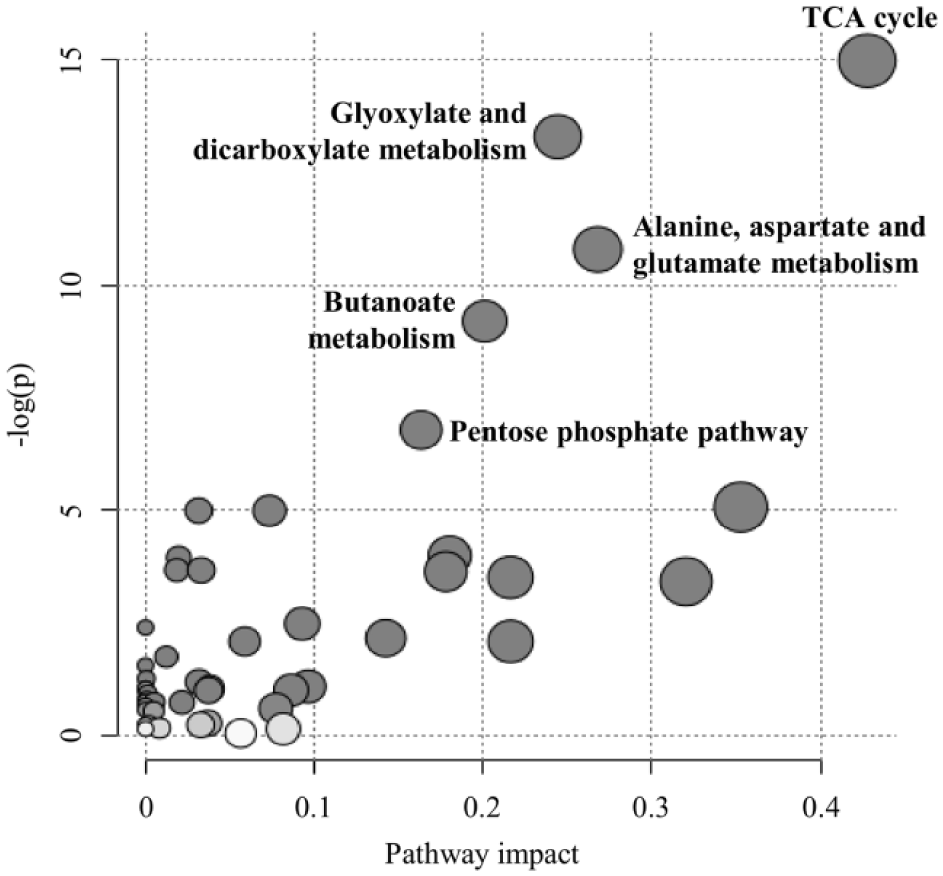
Pathway analysis of polar metabolites detected by ion chromatography–mass spectrometry (IC-MS).
Comparison of Polar Metabolite Profiles in Serum and Urine
Once the IC-MS metabolomics platform was characterized, we compared the metabolite profiles among grouping variables (type of biofluids and gender) using principal component analysis (PCA). The dots corresponding to urine samples demonstrated a wide distribution in component 2 ( Fig. 3 ), indicating that the profiles of polar metabolites in urine vary among individuals. Importantly, the serum and urine samples clearly separated into two distinct groups by component 1 ( Fig. 3 ), suggesting that there were obvious differences in the profiles of the polar metabolites in serum and urine. Hence, we further analyzed the specific metabolites contributing to this difference, using OPLS-DA ( Fig. 4A ). Using stringent criteria, we defined metabolites with a |p(corr)| > 0.8 in the loading S-plot as abundant metabolites for each type of biofluid. Only 4 metabolites [4-hydroxybutyric acid (GHB), aspartic acid, lactic acid, and γ-glutamyl glutamine] out of 131 were abundant in serum ( Fig. 4B and Suppl. Table S5 ). The median-fold differences of these metabolites in urine compared to serum were as follows: GHB, 0.09; aspartic acid, 0.16; lactic acid, 0.04; and γ-glutamyl glutamine, 0.08. Conversely, 62 metabolites out of 131 were abundant in urine. The top three metabolites with median-fold differences in urine compared to serum were phosphoric acid (3778.95), vanillylmandelic acid (2005.70), and N-tiglylglycine (982.17).
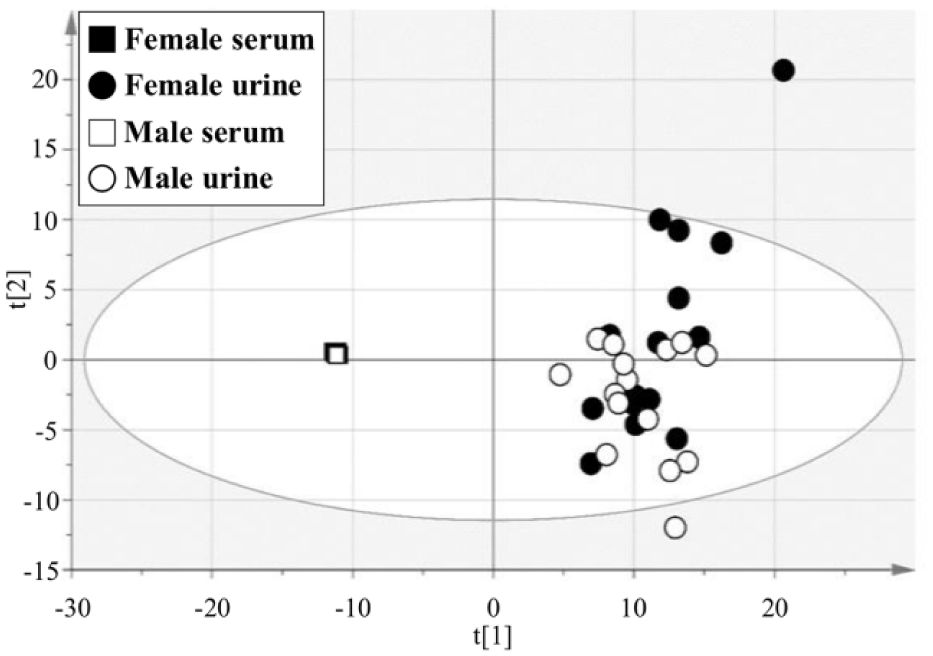
Principal component analysis (PCA) of polar metabolites in human serum and urine.
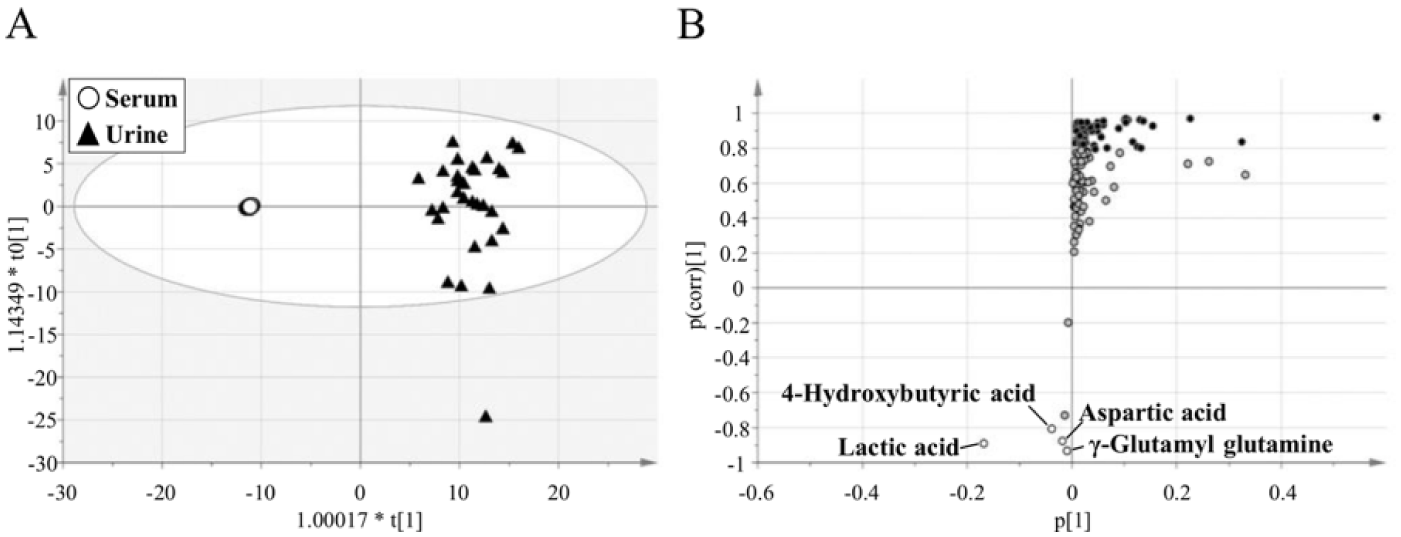
Comparison of serum and urine polar metabolite profiles.
Comparison of Polar Metabolite Profiles in Samples from Male and Female Subjects
To examine gender-associated differences, we used OPLS-DA analysis and defined metabolites abundant in samples from each gender as those that scored |p(corr)| > 0.8 in loading S-plots. Trends of metabolite clustering were observed via OPLS-DA analysis of serum, and two metabolites, allantoin and uric acid, met the stringent criteria for significance ( Fig. 5A and 5B ). Both allantoin and uric acid levels were significantly higher in male serum than in female serum ( Fig. 5C ). In the OPLS-DA analysis of urine, however, no metabolite met the stringent criteria for significance ( Fig. 5D and 5E ), although trends of metabolite clustering were observed in samples from each gender.
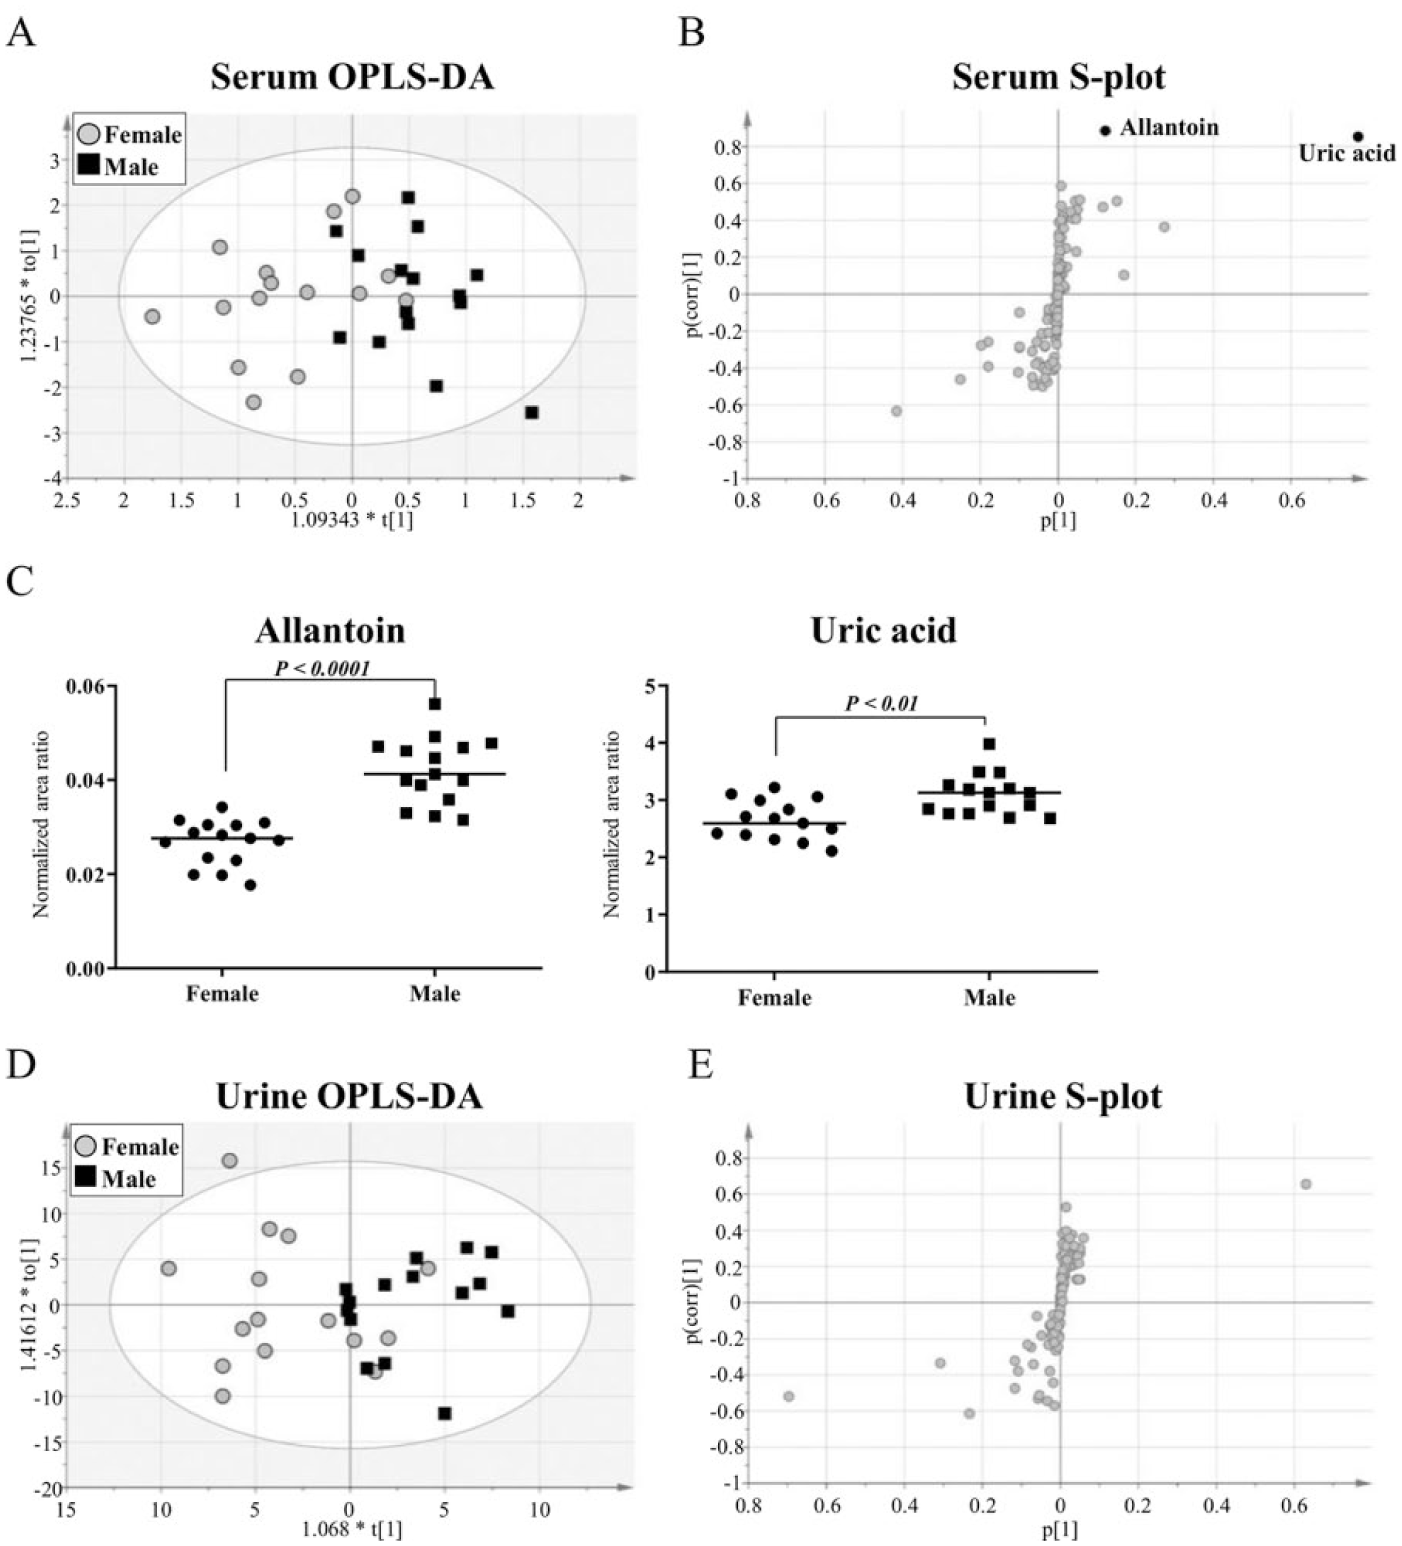
Comparison of polar metabolite profiles in male and female subjects.
Discussion
In the current study, we established a novel IC-MS-based metabolomics method for human serum and urine. Using this method, we characterized the differences in profiles of polar metabolites between serum and urine. Moreover, we identified gender-associated metabolites in serum samples. Although several reports have described metabolomics analysis methods using IC-MS for mouse-derived tissue samples,17–19 the analysis of polar metabolites in human liquid biopsy samples using these methods has not been reported to date. Therefore, to our knowledge, this is the first report to provide the results and detailed analytical methodology for IC-MS in a metabolomics study using human biofluids.
To date, GC-MS and hydrophilic interaction chromatography coupled with MS (HILIC-MS) have been frequently used for chromatography-MS-based metabolomics analysis of polar compounds. We found that the simple number of identified metabolites in this study was comparable to that of those identified via GC-MS-based metabolomics27,28 and HILIC-MS-based metabolomics.29,30 Of note, it was found that the current IC-MS method provides good separation and peak shape of sugar monophosphates, nucleotides, and nucleoside diphosphate and triphosphate; the detection of these molecules is known to be difficult with HILIC-MS. This finding is in good accordance with the results of a previous report. 31 In addition, the current method enabled the detection of various conjugated metabolites (i.e., acetylation, sulfate conjugation, and glucuronidation) that is rarely reported in other chromatography-MS-based metabolomics analyses. Together, our data, along with the above-mentioned evidence, suggest that IC-MS is a promising tool for the analysis of polar metabolites using metabolomics platforms. Thus, IC-MS may represent a complementary technique to conventional GC-MS and HILIC-MS for increased polar metabolite coverage.
In addition, it should be noted that the current IC-MS metabolomics platform has the ability to measure organic acids with carboxylic moieties and to provide an overview of alterations in energy and amino acid metabolism. Given the advantages of IC-MS for measuring organic acids, the application of the IC-MS metabolomics platform is considered to be of great use to the study of organic acidemias caused by inherited metabolic disorders.32–34 In support of this notion, several biomarkers for acidemias, such as glutaric acid, 2-ketoglutaric acid, lactic acid, 3-hydroxy butyric acid, and N-tiglylglycine, were detectable using our platform. In addition, another detectable organic acid, 3-carboxy-4-methyl-5-propyl-2-furanpropionic acid, was also reported to be correlated with diabetes. 35 Taken together, the findings show that our IC-MS metabolomics platform can be applied for screening of biomarkers for acidemias and other metabolic diseases.
In the kidney, reabsorption is the process by which the nephron removes water and useful solutes, such as glucose and amino acids, from the pre-urine and returns them to the circulating blood to maintain somatic homeostasis. The differences in the profiles of polar metabolites between serum and urine are theoretically governed by this mechanism, and water reabsorption results in the concentration of numerous polar metabolites into urine. In agreement with this theory, most polar metabolites measured by our IC-MS platform were more abundant in urine than in serum. Polar metabolites abundant in serum, however, are subjected to renal reabsorption, which is regulated by specific mechanisms such as glucose reabsorption. Our platform demonstrated that four polar metabolites were abundant in serum. Two of these metabolites, aspartic acid and lactate, are well known as polar metabolites that are returned into the circulating blood by renal reabsorption. In addition, it has been reported that pH- and sodium-dependent monocarboxylate transporters are responsible for the transport of not only lactic acid but also GHB in renal tubular cells,36–38 suggesting that GHB returns to the circulating blood in the same manner as lactate. Taken together, it may be concluded that the differences in the profiles of polar metabolites between serum and urine are governed by renal reabsorption.
In addition, we compared polar metabolite profiles between male and female subjects. The enriched levels of uric acid and its derivative allantoin in serum from male subjects were consistent with those described in previous works using different metabolomics platforms,23,39,40 verifying the analytical reliability of our IC-MS metabolomics platform. To date, the mechanisms responsible for the gender-associated differences in uric acid and its derivative remain unclear. Previous reports have, however, demonstrated gender-associated differences in expression levels of renal reuptake transporters of uric acid.41–43 Thus, the extent of renal reuptake of uric acid and its derivative allantoin by uric acid transporters may differ by gender, thus likely explaining the enriched levels of uric acid and its derivative allantoin in serum from male subjects.
In summary, our IC-MS metabolomics platform was shown to be capable of detecting and characterizing more than 100 polar metabolites in human serum and urine samples. Here, we demonstrate that IC-MS offers advantages over other metabolomics profiling platforms with regard to organic acid measurement, thereby providing increased coverage of metabolites from human biofluids. Therefore, we conclude that the IC-MS metabolomics platform may be useful for biomarker screening in humans.
Supplemental Material
DISC850082_SupplementalFigs – Supplemental material for Application of Ion Chromatography Coupled with Mass Spectrometry for Human Serum and Urine Metabolomics
Supplemental material, DISC850082_SupplementalFigs for Application of Ion Chromatography Coupled with Mass Spectrometry for Human Serum and Urine Metabolomics by Yuchen Sun, Kosuke Saito, Ryota Iiji and Yoshiro Saito in SLAS Discovery
Supplemental Material
DISC850082_SupplementalTables – Supplemental material for Application of Ion Chromatography Coupled with Mass Spectrometry for Human Serum and Urine Metabolomics
Supplemental material, DISC850082_SupplementalTables for Application of Ion Chromatography Coupled with Mass Spectrometry for Human Serum and Urine Metabolomics by Yuchen Sun, Kosuke Saito, Ryota Iiji and Yoshiro Saito in SLAS Discovery
Footnotes
Acknowledgements
The authors would like to thank Dr. Kentaro Takahara (Thermo Fisher Scientific) for technical assistance, and Ms. Chie Sudo (National Institute of Health Sciences) for secretarial assistance.
Supplemental material is available online with this article.
Declaration of Conflicting Interests
The authors declared no potential conflicts of interest with respect to the research, authorship, and/or publication of this article.
Funding
The authors disclosed receipt of the following financial support for the research, authorship, and/or publication of this article: This work was financially supported in part by the Japan Agency for Medical Research and Development (AMED; grant numbers 18ak0101043j0604, 18mk0101045j0304, and 18km0405201j0503).
References
Supplementary Material
Please find the following supplemental material available below.
For Open Access articles published under a Creative Commons License, all supplemental material carries the same license as the article it is associated with.
For non-Open Access articles published, all supplemental material carries a non-exclusive license, and permission requests for re-use of supplemental material or any part of supplemental material shall be sent directly to the copyright owner as specified in the copyright notice associated with the article.