
Abstract
Cell-based high-throughput drug screening (HTS) is a common starting point for the drug discovery and development process. Currently, there is a push to combine complex cell culture systems with HTS to provide more clinically applicable results. However, there are mechanistic requirements inherent to HTS as well as material limitations that make this integration challenging. Here, we used the peptide-based shear-thinning hydrogel MAX8 tagged with the RGDS sequence to create a synthetic extracellular scaffold to culture cells in three dimensions and showed a preliminary implementation of the scaffold within an automated HTS setup using a pilot drug screen targeting medulloblastoma, a pediatric brain cancer. A total of 2202 compounds were screened in the 384-well format against cells encapsulated in the hydrogel as well as cells growing on traditional two-dimensional (2D) plastic. Eighty-two compounds passed the first round of screening at a single point of concentration. Sixteen-point dose–response was done on those 82 compounds, of which 17 compounds were validated. Three-dimensional (3D) cell-based HTS could be a powerful screening tool that allows researchers to finely tune the cell microenvironment, getting more clinically applicable data as a result. Here, we have shown the successful integration of a peptide-based hydrogel into the high-throughput format.
Keywords
Introduction
Cell culture is a simple, fast, cost-effective, versatile, and easily reproducible method to understand important fundamental mechanisms in development, for in vitro modeling of diseases, and to provide assay platforms for drug discovery. With increasing knowledge that two-dimensional (2D) cultures of monolayers of cells grown on rigid plastic surfaces optimized for cell attachment and growth do not necessarily reflect the complex microenvironment that a cell encounters in a tissue, there has in recent years been a surge in three-dimensional (3D) cell-culture technologies that more closely resemble in vivo cell environments.1–10 Nevertheless, despite this discrepancy thought to be a significant contributor to the high failure rate in drug discovery, the majority of cell-based high-throughput screening (HTS) of small compound libraries is still being performed using 2D cultures. Application of 3D-cell culture to HTS remains a challenge as many of the current scaffold-based 3D cell-culture technologies have high material cost, are labor-intensive, have limited scalability to 384- and 1536-well plates, lack reproducibility, are difficult to be incorporated into an automated screening setup, and may not be compatible with currently available assays and detection methods. Despite these challenges, HTS-compatible screening platforms are emerging to accommodate better precision in drug development, including spheroids in hanging drop cultures and scaffold-based 3D cell-culture technologies.1,3,5,6,8,11–14
Hydrogels, which are hydrated supramolecular or covalent networks formed from dilute polymer chains, have high similarity with extracellular matrix (ECM) and are therefore well suited as 3D cell-culture scaffolds.15–17 Common examples for natural hydrogels used for 3D culture are collagen and Matrigel, and cells of a variety of tissue origins and grown in 3D cultures in these matrices have been well characterized. However, material properties, including batch-to-batch variability, limited capabilities for modifying their chemical properties, and inadequate physical characteristics such as gelation properties, make these scaffolds poorly suitable for high-throughput drug discovery. Synthetic hydrogels can overcome these limitations, as they are matrices with defined properties, while at the same time providing an optimized reproducible and bioactive cell matrix that can be functionalized to the needs of cells of a specific tissue origin. Moreover, as we have shown previously for MAX8, synthetic hydrogels can be designed with material features such as ambient gelation temperature and shear-thinning properties that make them well suitable for automated liquid handling using standard equipment. 18
MAX8 ( Fig. 1 ) is a 20-amino acid beta-hairpin peptide (VKVKVKVK-(VDPPT)-KVEVKVKV-NH2) that upon intramolecular folding and physical intermolecular self-assembly at physiological conditions and at room temperature forms a hydrogel network. At neutral pH and low ionic strength, the charged lysine side chains electrostatically repel one another and keep the molecule unfolded and freely soluble in solution. Folded hairpin pairs will collapse together to bury the hydrophobic valine-rich faces of the folded molecules, while additional hairpins assemble together in an h-bonded linear fashion, thus extending the fibrillar growth. 19 The network forms as the fibrils extend and begin to interact with each other, forming physical crosslinks as well as branched junctions created from imperfections in the self-assembly process. The hydrogel design allows for easy modification of its material properties through peptide alteration. Additionally, MAX8 allows for macromolecular diffusion of a wide variety of compounds,20–23 and the peptide foundation of the hydrogel provides material cytocompatibility.18,24 The two most relevant properties for performance as a cell scaffold are the tunability of network stiffness and the ease with which the amino acid sequence can be modified. 25 This allows for the inclusion of cell-binding sequences that mimic scaffold proteins without affecting the robust self-assembly and hydrogelation mechanism. The hydrogel is also considered a shear-thinning solid, a stiff solid that can flow like a liquid with application of shear forces.24,26 Importantly, the material immediately reforms into a solid hydrogel on cessation of the shear. Together, these properties allow for integration into the standard setup for automated liquid handling commonly found in an HTS laboratory. 18
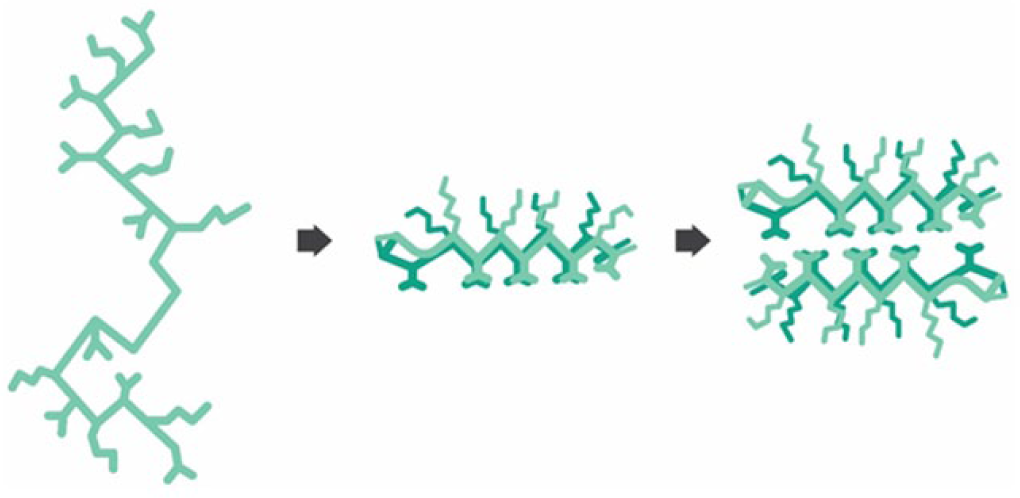
A cartoon representation of the self-assembly pathway of the MAX8 beta-hairpin hydrogel. Under physiological conditions, the MAX8 peptide folds into beta-hairpin conformation. Then the hairpins undergo hydrophobic collapse and form nanofibrils by hydrogen bonding. The fibrils then branch and entangle to form the hydrogel network.
Using cell lines originating from the most common malignant pediatric brain cancer, medulloblastoma, we have previously shown that dispensing a MAX8–cell mixture into 384-well plates using a liquid handling workstation resulted in reproducible hydrogel cell constructs, and demonstrated the compatibility with the RealTime-Glo MT cell viability assay within this setup. 18 By comparing this 3D cell-culture system with a traditional 2D culture setup, we have now used the system in a phenotypic high-throughput pilot screen in medulloblastoma cells and demonstrated the technological feasibility of MAX8-based scaffolds for automated drug screening.
Materials and Methods
MAX8 Beta-Hairpin Peptide Synthesis
The synthesis and purification of MAX8 beta-hairpin peptide has been described in detail previously.24,27 The synthesis of MAX8 used in the current study was performed with an automated Liberty Blue (CEM) peptide synthesizer, using standard Fmoc-based solid-phase peptide synthesis. Hydrogel functionalization was achieved by adding the RGDS sequence, a peptide sequence found in the ECM protein fibronectin that interacts with integrins on the cell surface. 28 The RGDS sequence was added on the N-terminus to the native MAX8 peptide VKVKVKVK-(VDPPT)-KVEVKVKV-NH2 by including the RGDS ligand in the original peptide synthesis, resulting in the peptide RGDS-VKVKVKVK-(VDPPT)-KVEVKVKV-NH2 (MAX8-RGDS).
Preparation of 384-Well Assay Plates
ONS-76 cells, a cell line derived from the pediatric brain cancer medulloblastoma, were kindly provided by Dr. Michael Taylor. The cells were propagated in Dulbecco’s Minimum Essential Media (DMEM) supplemented with 10% fetal bovine serum and penicillin-streptomycin-glutamine (culture medium) at 37 °C and 5% CO2 using standard 2D cell-culture protocols and tissue culture-treated plastic dishes. In general, hydrogel–cell constructs were prepared as 0.25 wt% MAX8-RGDS hydrogels. The peptide was first dissolved in 50 mM HEPES buffer (pH 7.4) (0.5 mg MAX8-RGDS per 100 µL of buffer). Then, an equal volume of ONS-76 cell suspension in serum-free DMEM was added and the 1:1 gel–cell mixture was gently mixed, triggering the intramolecular folding of the peptide resulting in self-assembly into a hydrogel. Using a JANUS Automated Workstation (PerkinElmer, Waltham, MA) and taking advantage of the shear-thinning properties of the hydrogel, MAX8-RGDS/ONS-76 cell constructs (2000 cells encapsulated in 4 µL of gel per well) were dispensed at room temperature into untreated white 384-well plates (BrandTech Scientific, Essex, CT) containing 36 µL of culture medium for a total volume of 40 µL per well. For 2D HTS, ONS-76 cells suspended in culture medium were added to tissue culture-treated white 384-well plates (BrandTech) using a BioTek MultiFlo Select dispenser (BioTek, Winooski, VT) for a total of 400 cells per well and a final volume of 40 µL per well. The chosen cell numbers of both 3D and 2D cultures allowed for logarithmic growth over the entire duration of the experiments. The 2D cultures required lower cell numbers than the 3D cultures due to a higher proliferation rate. 18
Cell Viability Assays in MAX8-Cell Constructs
We previously showed that the RealTime-Glo MT cell viability assay (Promega, Madison, WI) provides a reliable and reproducible assay to determine cell viability in 3D cultures of cells encapsulated in MAX8-RGDS hydrogel. 18 The RealTime-Glo MT cell viability assay is a nonlytic bioluminescent method to measure cell viability in real time and determines the number of viable cells by measuring the reduction potential and thus metabolism of cells. As we have shown previously, this assay shows a strong correlation between signal and number of viable cells encapsulated in MAX8, 18 making it well suited for viability studies in 3D cultures of ONS-76 cells.
After seeding, the cells in both 2D and 3D cultures were allowed to equilibrate for 24 h at 37 °C and 5% CO2 prior to addition of 10 µL of RealTime-Glo reagent. The reagent was added as a 5× solution diluted in cell-culture medium for a final volume of 50 µL per well. Plates were incubated for 120 min at 37 °C and then allowed briefly to equilibrate to room temperature before the cell luminescence was measured with a temperature-controlled Envision multimode plate reader (PerkinElmer).
Quality Control Plates
For 3D cultures, ONS-76 cells were plated in 384-well plates as described above with 2000 cells encapsulated in 4 µL of MAX8-RGDS hydrogel (0.25 wt%) plus 36 µL of culture medium for a total volume of 40 µL. 2D cultures in 384-well plates were prepared in parallel with 400 cells per well in a total volume of 40 µL. The cells were allowed to equilibrate for 24 h at 37 °C in the presence of 5% CO2 before the addition of SAHA (suberanilohydroxamic acid, vorinostat). 18 Using a stock solution of 0.6 mM SAHA in DMSO, 50 nL of the stock solution was added by pintool into 20 µL of culture medium using the JANUS Automated Workstation fitted with a hydrophobic pintool (V&P Scientific, San Diego, CA) to generate an intermediate solution. This first step was followed by transfer of 10 µL of the intermediate SAHA dilution into the 320 test wells of columns 3–22 of each 384-well quality control (QC) plate, corresponding to a final concentration of 0.3 µM SAHA and equaling its LD50 in ONS-76 cells. Using the same two-step dilutions, a corresponding volume of DMSO was added to the control wells in columns 1 and 23 of each 384-well plate containing either 2D or 3D cultures of ONS-76 cells (maximum signal) and to wells containing no cells or hydrogel alone, respectively, in columns 2 and 24 (background signal). The serial dilution of the stock solutions resulted in a final concentration of 0.05% DMSO in each well, as we have previously shown that 0.05% DMSO does not affect the viability of ONS-76 cells in 2D or 3D cultures. 18 The cells were incubated for 48 h at 37 °C and 5% CO2, and cell viability was determined using the RealTime-Glo MT cell viability assay as described above.
Compound Library and Pilot Screen
The pilot screen library consisted of the Spectrum Collection compound library that contains 2000 U.S. Food and Drug Administration (FDA)-approved drugs and bioactive natural products in DMSO (MicroSource, Inc., Gaylordsville, CT) and was reformatted into a 384-well format as described previously, 29 plus additional investigational compounds available in our compound collections.
ONS-76 cells were seeded to generate 3D and 2D cultures as described above, using 2000 cells in 4 µL of 0.25 wt% MAX8-RGDS hydrogel and 36 µL of culture medium and 400 cells in 40 µL of culture medium, respectively, resulting in all wells having a final volume of 40 µL. After 24 h of equilibration at 37 °C and 5% CO2, test compounds were added at a final concentration of 2 µM using a similar two-step dilution as described for the QC plates. Briefly, intermediate compound plates were created by pintooling 50 nL of compound in DMSO into 20 µL of media containing 5× RealTime-Glo MT assay reagent. Ten microliters of this intermediate dilution was added to each well for a final volume of 50 µL, final DMSO concentration of 0.05%, final RealTime-Glo concentration of 1×, and 2 µM test compound. After 48 h of treatment, the cell viability was determined using the RealTime-Glo MT cell viability assay as described above.
Compounds selected as actives in the initial screen at 2 µM were reevaluated in 16-fold dose–response in duplicate. Compounds that were confirmed were retested by a 16-fold dose–response in triplicate using follow-up compounds purchased in powdered form from Microsource. Stock solutions were prepared in DMSO on the day of dose–response testing. A range of treatment concentrations, typically starting at 100 µM depending on compound solubility, for each compound of interest was prepared by a 16-point twofold serial dilution. Cell plates were prepared as described previously, 2000 cells in 4 µL of 0.25 wt% MAX8-RGDS hydrogel and 36 µL of culture medium for 3D cultures and 400 cells in 40 µL of culture medium for 2D cultures. Compound intermediate plates were prepared using the JANUS Automated Workstation by diluting compound concentration by half 16× with DMSO and adding 50 nL of the serially diluted compounds into 20 µL of media containing 5× RealTime-Glo. After a 24 h equilibration for the cell plates, 10 µL of this intermediate plate was added to the cell plate for a total volume of 50 µL, final DMSO concentration of 0.05%, final RealTime-Glo concentration of 1×, and the indicated test compound concentration. After 48 h of treatment the cell viability was determined using the RealTime-Glo MT cell viability assay.
Statistical Analysis
Data are presented as mean ± SD unless otherwise indicated. Sigmoidal dose–response curve fitting and calculation of LD50 in 2D and 3D cultures was done by nonlinear regression using GraphPad Prism software (GraphPad Software, Inc., La Jolla, CA). The F test was used to compare dose–response curves from the 2D and 3D cell response, and p values were determined with p < 0.05 denoting a significant difference between the curve fit parameters.

The Z′ factor 30 was calculated using the following equation, with µ representing the mean and σ the standard deviation.

The minimum significant ratio (MSR) 31 was calculated for repeat runs, where x represents repeat LD50 values and n is the number of runs.

Results and Discussion
Validation of the 2D and 3D Cell Viability Assay in a 384-Well Format
The fast gelation kinetics at room temperature and under physiological conditions, along with its shear-thinning properties, make MAX8 compatible with automated liquid handling by standard HTS equipment. As we have shown previously using the RealTime-Glo MT cell viability assay, the dispensation of MAX8-RGDS/ONS-76 hydrogel–cell mixtures into 384-well plates using a JANUS Automated Workstation was reliable and reproducible. 18 In preparation for the pilot screen, we evaluated the reproducibility of the assay between plates in the same run and from one screening run to the next with QC plates of 2D cultures of ONS-76 cells and MAX8-RGDS/ONS-76 3D cultures in 384-well plates. Based on cell growth titration curves for 3D hydrogel–cell constructs 18 and 2D cultures ( Suppl. Fig. S1 ), we chose 2000 cells per well for 3D and 400 cells per well for 2D cultures to maintain log growth and get a robust signal allowing for statistical separation between live and dead cell populations. We recognize the difference in cell numbers used for the 2D and 3D screens. Due to the difference in growth rates between 2D and 3D cultures, a possible quenching of some of the bioluminescence signal by the hydrogel in 3D cultures, and the overall assay performance, a further assimilation of the cell numbers was not feasible. For 2D plates, we obtained a Z′ factor of 0.70 with a coefficient of variance (CoV) of 9% ( Fig. 2A ), and for 3D plates, the Z′ factor was 0.56 with a high CoV of 14% ( Fig. 2B ). In both cases, the control values were within acceptable range, but we consistently observed statistically more robust results in 2D plates compared with 3D plates. Thus, while the QC values for 3D cultures are strong, there is still some room for improvement. Our current work focuses on refining sources of variability such as cell and media volume, cell mixing, and cell dispensing. With 2000 cells in 4 µL of MAX8-RGDS per well, we have chosen a low volume of hydrogel–cell construct that still provides a robust signal. While it would be reasonable to increase the hydrogel volume for a pilot screen as described here, for a full-size 3D screening, balancing the material cost for the scaffold and the level of precision will need to be taken into consideration.
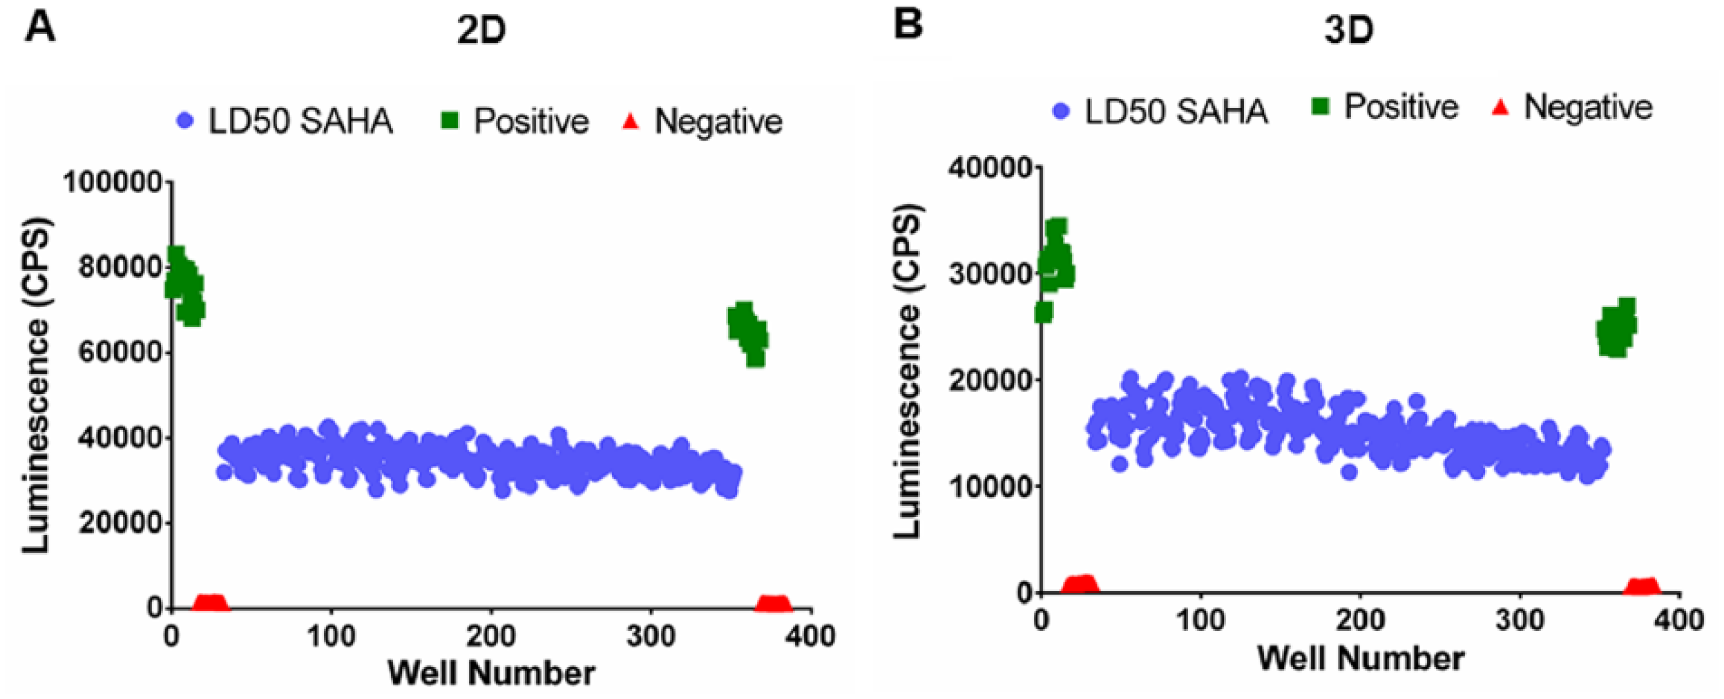
QC plates for 2D and 3D cultures. ONS-76 medulloblastoma cells were encapsulated in 0.25 wt% MAX8-RGDS in 384-well plates with 2000 cells per well for 3D setups, and 400 cells per well were plated for 2D setups. After 24 h of equilibration, the cells were treated with the test compound SAHA for 48 h (blue circles). DMSO was added to the control wells in columns 1 and 23 (positive control, green squares) and to wells containing hydrogel alone or no cells, respectively, in columns 2 and 24 (negative control, red triangles). The cell viability was determined using the RealTime-Glo MT assay. CPS = counts per second.
Summary of the Pilot Screen
We screened 2202 compounds at a concentration of 2 µM in single wells. The screening library consisted of 2000 compounds from the Spectrum Collection and a small selection from our internal collection of new, investigational compounds. Three-hundred-eighty-four-well plates of ONS-76 cells in 3D hydrogels or in 2D cultures were plated in parallel, and, after 24 h, the plates were treated with compounds simultaneously. Cell viability was determined by the RealTime-Glo MT assay after 48 h of treatment. Potential hit compounds were identified based on a chosen threshold of three times the standard deviation of the tested compounds’ inhibitory effect, which was obtained from the individual screening statistics of the 3D and 2D plate sets ( Fig. 3 ). The 2D screen had a Z′ factor of 0.78 and a CoV of 6.7%, and the 3D screen’s Z′ factor was 0.58 and the CoV was 18.8%, similar to those of the QC plates ( Fig. 2 ). Sixty-five compounds inhibited cell viability beyond the threshold of 30% in 2D cultures ( Fig. 3 , quadrants C and D), and 50 compounds were found to inhibit cell viability in excess of 57%, the threshold for 3D cultures ( Fig. 3 , quadrants A and C). The differences in threshold between 2D and 3D cultures are indicative of the varying screening statistics between the two culture methods. Of these potential hits, 33 overlapped and inhibited cell viability in both 2D and 3D cultures ( Fig. 3 , quadrant C), leaving 32 compounds that were active only in 2D cultures ( Fig. 3 , quadrant D) and 17 that reduced cell viability only in 3D cultures ( Fig. 3 , quadrant A). With this, our initial screening results had similar hit rates in 2D and 3D cultures of about 3.0% and 2.3%, respectively, suggesting that culturing ONS-76 cells encapsulated in MAX8-RGDS did not induce a systemic shift in sensitivity to compounds that can induce cell death.
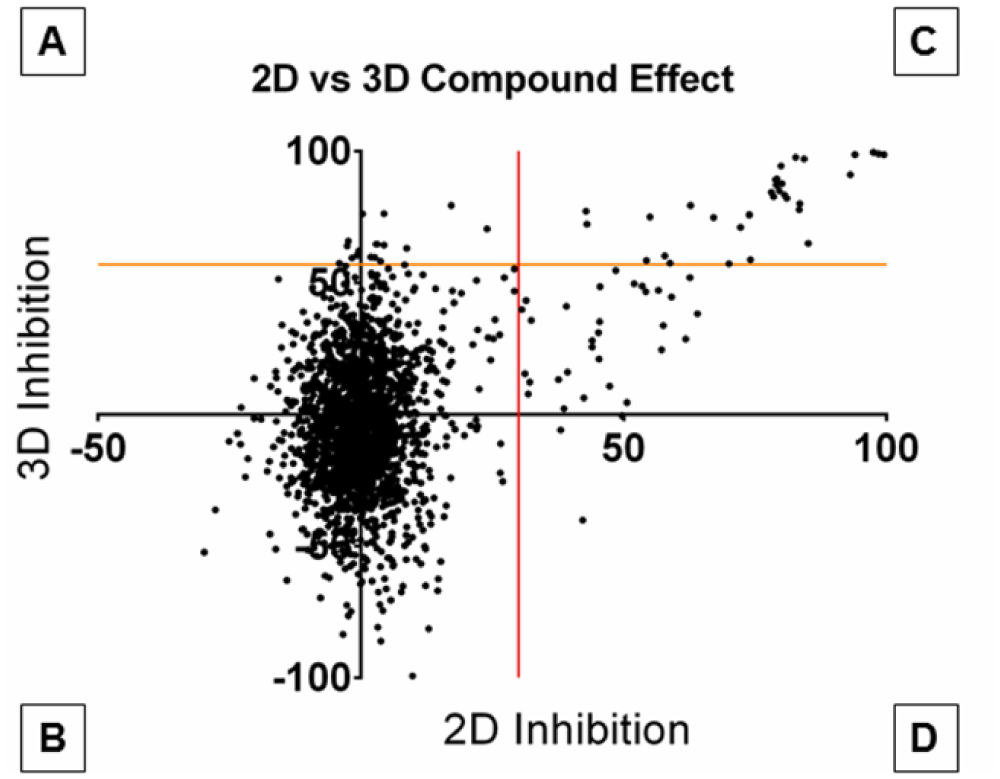
Graphical summary of the 2D versus 3D pilot screen. The percent inhibition of cells grown in 2D versus the percent inhibition of cells grown in 3D, with their respective thresholds (30% in 2D, red vertical line, and 57% in 3D, orange horizontal line), is shown. Compounds in quadrants A and C inhibited cell viability in 3D cultures, and compounds in quadrants C and D inhibited cell viability in 2D cultures. Quadrant C contains compounds that inhibited cell viability in both 2D and 3D cultures.
Hit Validation by Dose–Response Testing
All 82 potential hits (65 compounds from the 2D screen and 50 compounds from the 3D screen with an overlap of 33 compounds that were active in both 2D and 3D) moved on to dose–response testing in 16-point dose curves, done in duplicate in both 2D and 3D cultures. On each plate designated for dose–response testing, we included one column (16 wells) treated with a serial dilution of SAHA as a reference control and to determine plate-to-plate variability by comparing the LD50 concentration and by calculating the MSR. 31 The MSR is a test of reproducibility that measures the difference between the calculated LD50 and the floating mean of the previously calculated LD50 values ( Fig. 4 ). With an MSR of 1.8 for 2D plates and an MSR of 2.9 for the 3D plates, the 2D assay proved to be strongly reproducible while the 3D assay was somewhat weaker. While still under the accepted threshold of 3, an MSR of 2.9 in the 3D cultures would indicate that differences between LD50 values of less than 2.9-fold should be considered noise rather than being a real difference. The variance between the 2D and 3D culture setups is in line with our previously observed Z′ factor and CoV from both QC plates and the pilot screen.
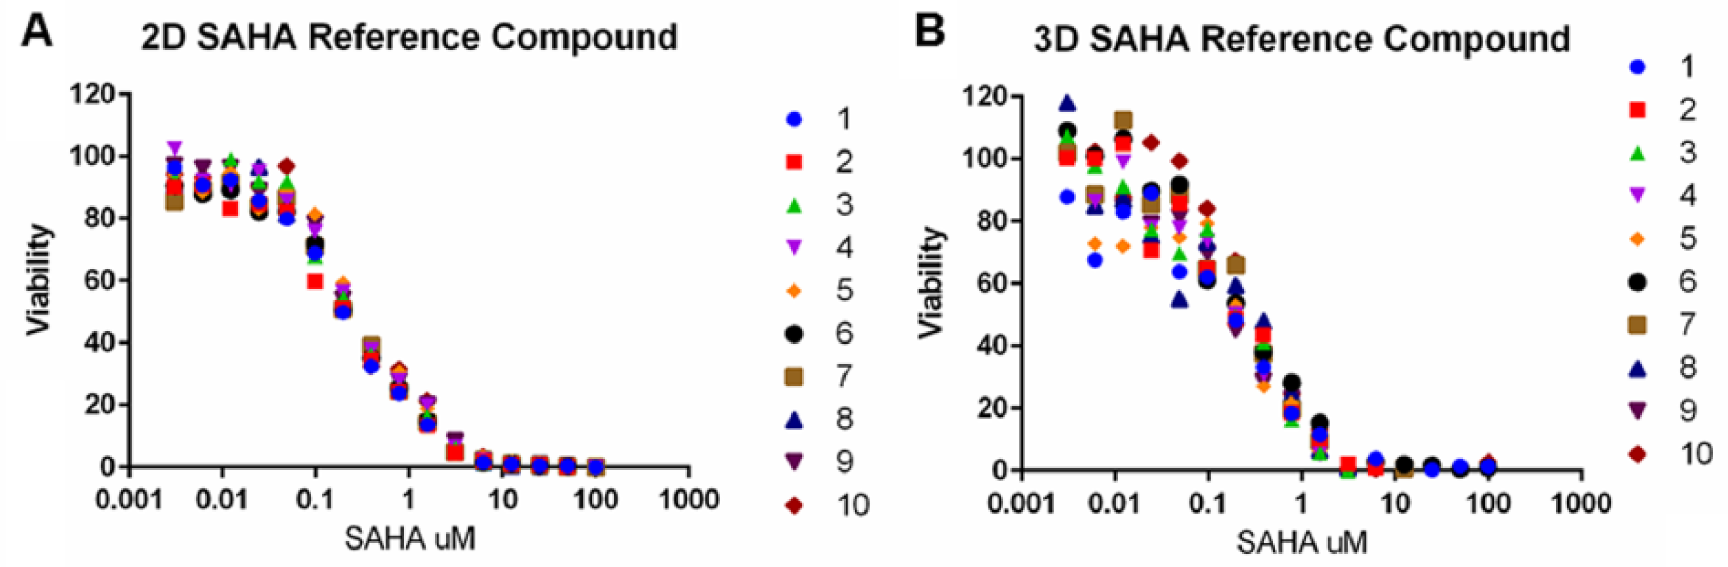
Plate-to-plate variability in 16-point dose–response experiments. 2D and 3D cultures of ONS-76 cells were prepared as described for the pilot screen. Each 384-well plate used in dose–response testing included one column (16 wells) treated with a 16-point twofold serial dilution of 100 µM SAHA as a reference control. Numbers 1–10 represent the SAHA dose–response curves of the 10 individual plates used in dose–response experiments. The calculated 2D LD50 for SAHA is 0.28 ± 0.0097 µM, and the calculated 3D LD50 for SAHA is 0.23 ± 0.0127 µM.
Out of the 50 screening hits in 3D cultures, 11 compounds were confirmed by dose–response testing, and of these, 10 compounds were further validated by dose–response testing with resynthesized compounds. Thus, with an initial hit rate of 2.3%, the 3D screen had a confirmation rate of 22% and a confirmed hit rate of 0.4%. Out of the 65 hits in the 2D screen, 16 compounds were confirmed in the initial round of dose–response testing and 14 were validated with resynthesized compounds, resulting in an initial hit rate of 3.0%, a confirmation rate of 24%, and a confirmed hit rate of 0.6%. Taking into account compounds that overlapped in the 2D and 3D screens, 3 out of 17 (18%) of the potential hits active only in 3D cultures, 8 out of 32 (25%) of the potential hits active only in 2D, and 8 out of 33 (24%) of the potential hits identified to be active in 2D and 3D were validated. Thus, while there were some minor differences in the validation rates between screening setups, possibly a result of differences in assay reproducibility, the validation rates of initial hits identified in the 2D and 3D screens were comparable overall. Using the F test to compare best fit curves, the 2D and 3D dose–response curves of almost all compounds were significantly different. However, since the F test has a high likelihood of finding significant differences between curve fit parameters, we further calculated the LD50 values. Table 1 summarizes the LD50 values of the 17 compounds that were overall validated in dose–response testing. Individual dose–response curves of the two compounds with the greatest differences in LD50 values between 2D and 3D screens, deoxysappanone B 7,4′-dimethyl ether (DSB) and vincristine sulfate, are shown in Figure 5 . DSB ( Fig. 5A ) is a homoisoflavone from the Chinese medicinal plant Caesalpinia sappan L. Currently, molecular targets of DSB are poorly described, but in acute myeloid leukemia cells, DAB had nanomolar antileukemic activity inhibiting microtubules and increasing lysosomal activity. 32 Vincristine sulfate ( Fig. 5B ) is a chemotherapeutic that is part of the standard treatment regimen for medulloblastoma and targets dividing cells through inhibition of microtubules, as does paclitaxel ( Fig. 5C ), a compound that was identified to be active in both 2D and 3D screens but with a similar LD50.
Calculated LD50 Values of Confirmed Hits.
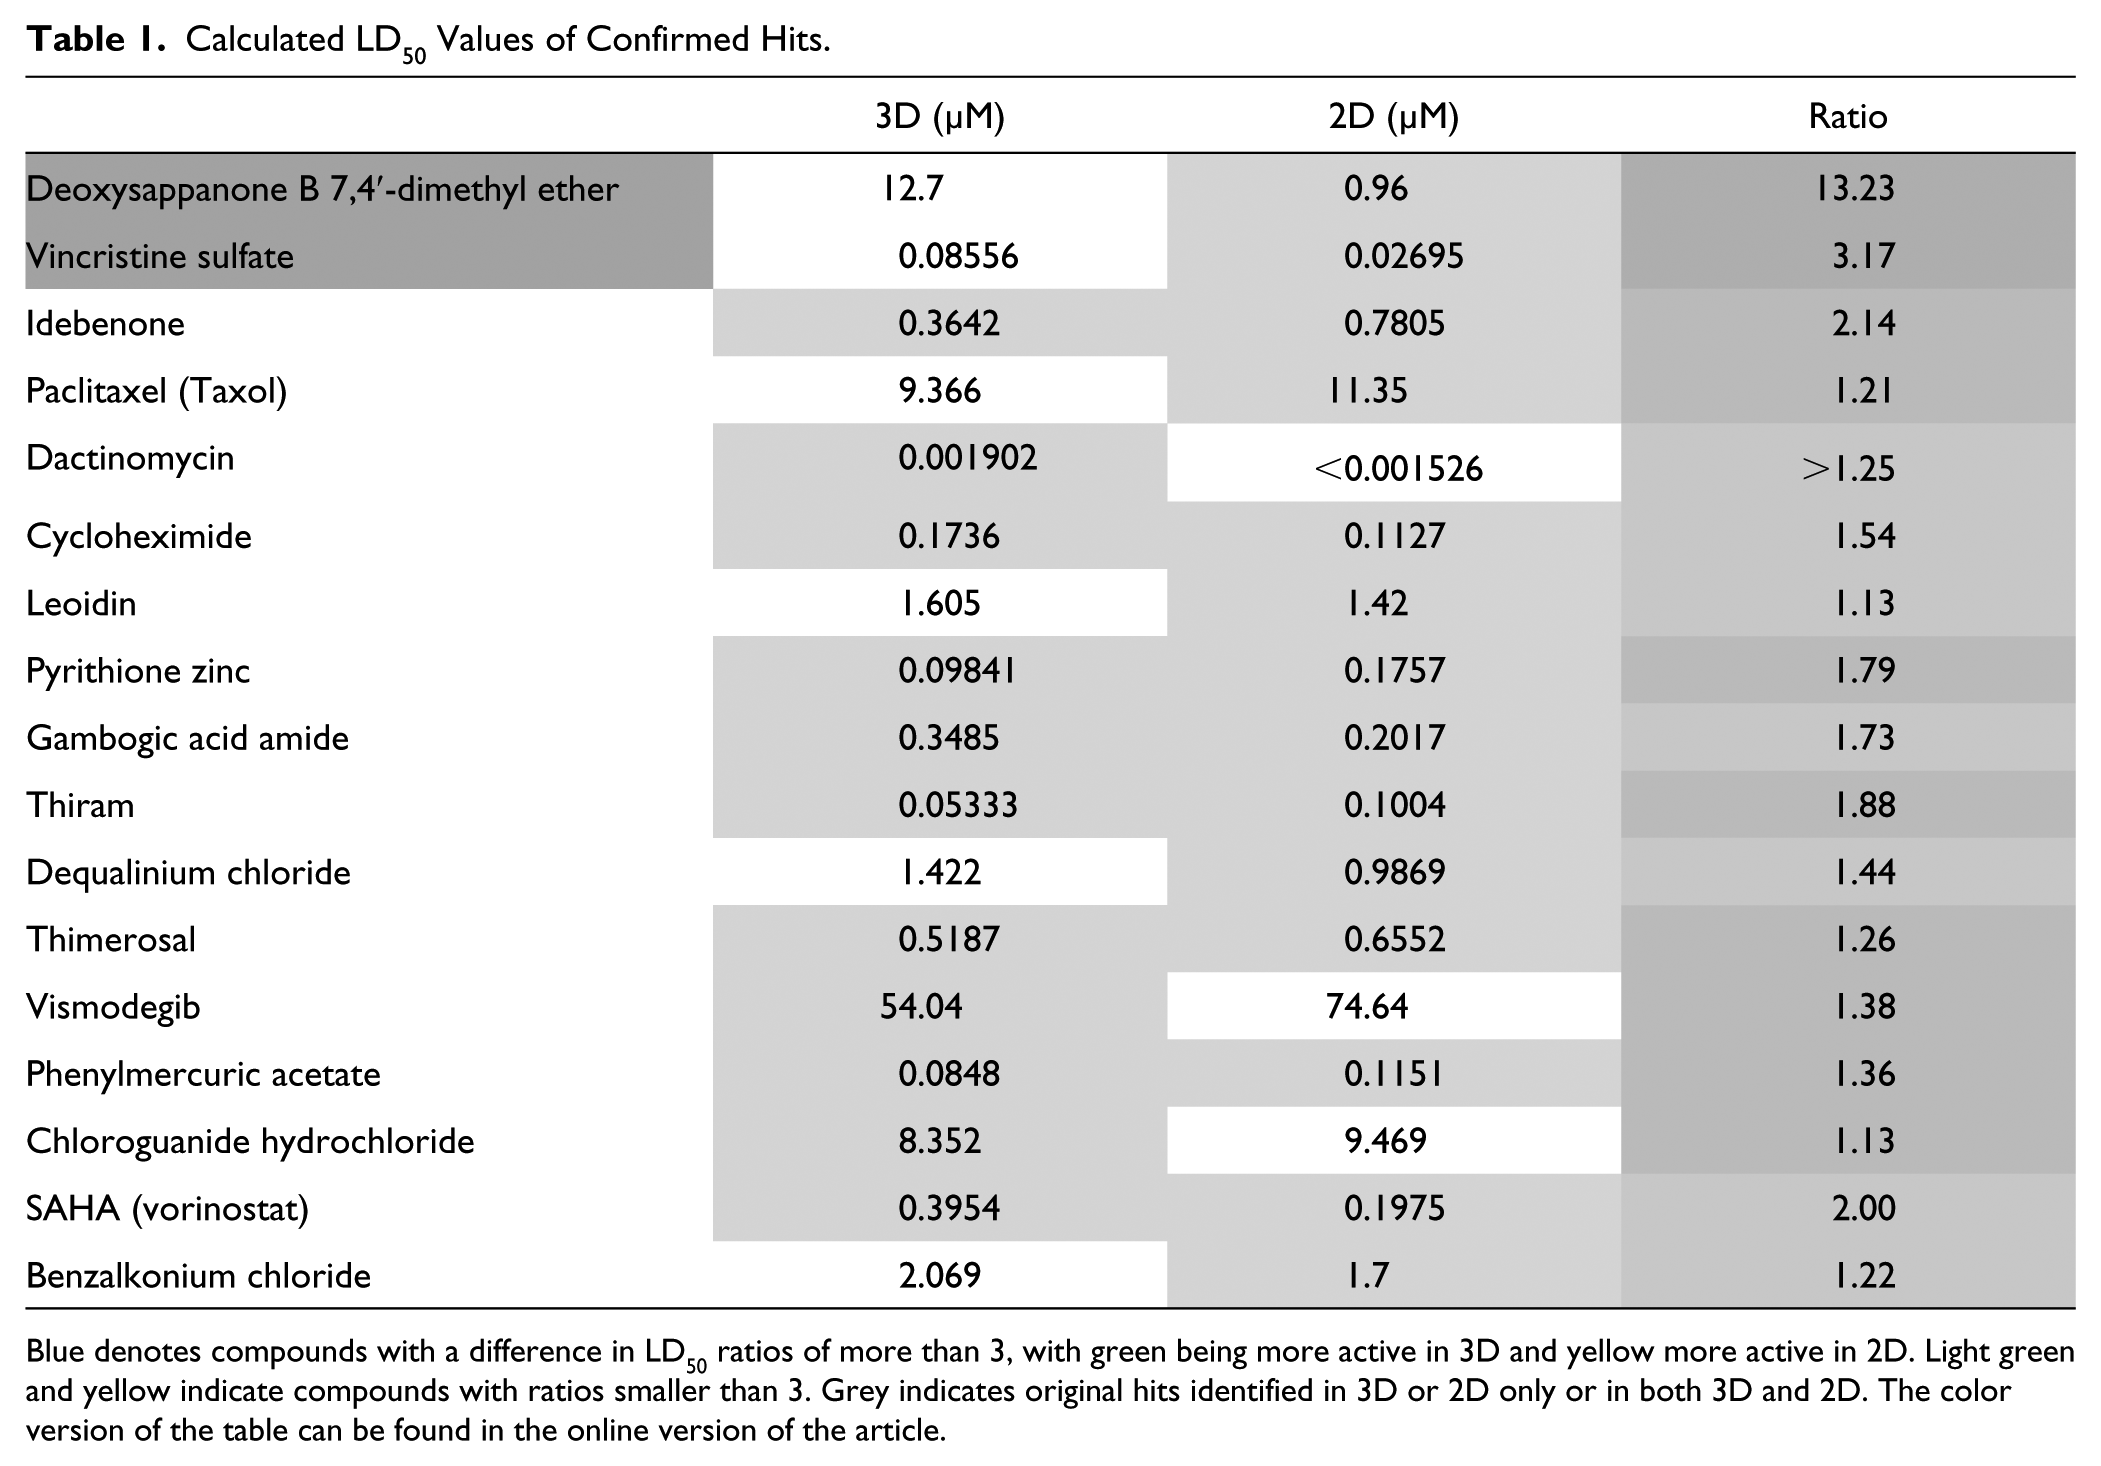
Blue denotes compounds with a difference in LD50 ratios of more than 3, with green being more active in 3D and yellow more active in 2D. Light green and yellow indicate compounds with ratios smaller than 3. Grey indicates original hits identified in 3D or 2D only or in both 3D and 2D. The color version of the table can be found in the online version of the article.
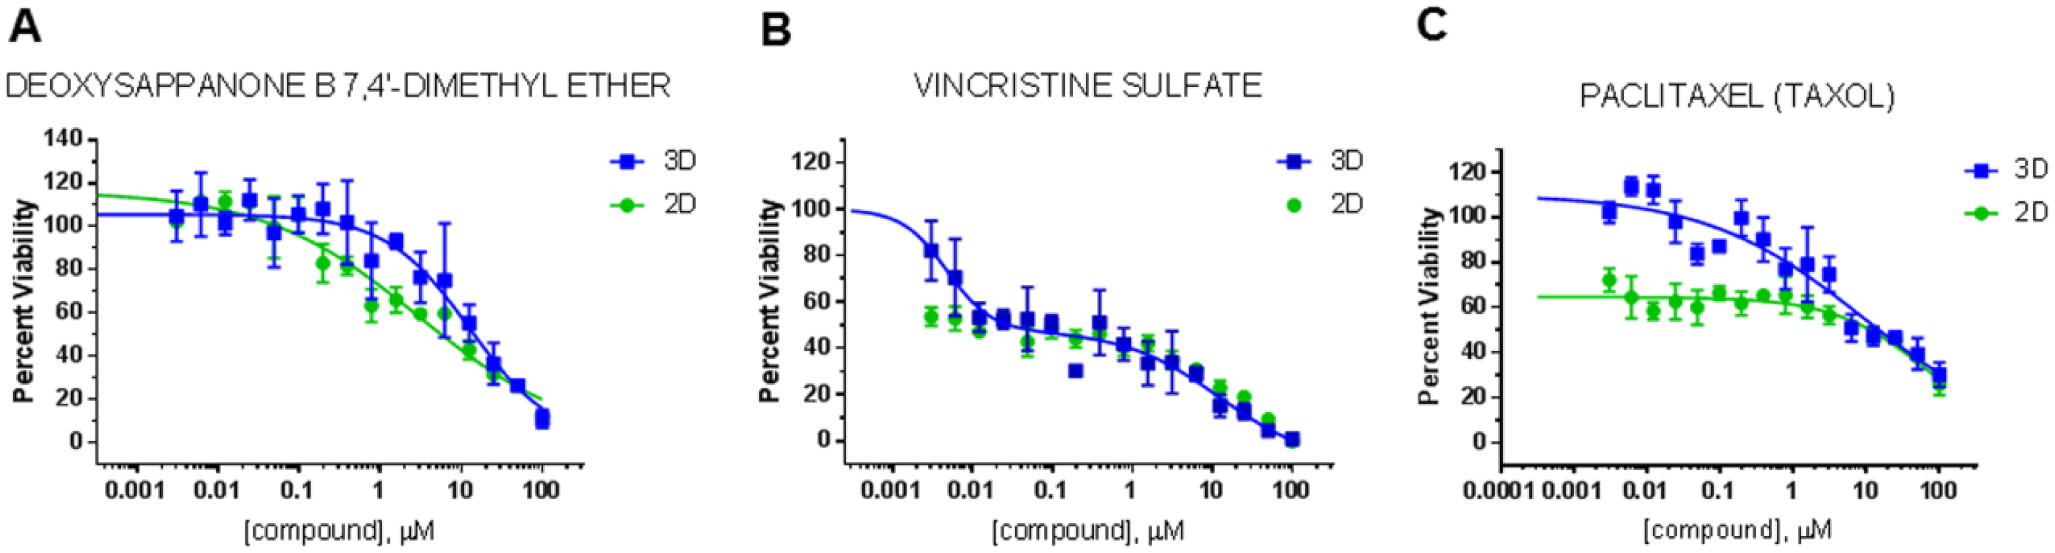
Dose–response curves of selected compounds. Sixteen-fold dose–response curves in 2D and 3D cultures in 384-well setups were done in triplicate as described in Materials and Methods. Twenty-four hours after plating, the cells were treated with individual compounds for 48 h and the cell viability was determined by the RealTime-Glo MT cell viability assay.
It is interesting to note that for vincristine sulfate and paclitaxel, the dose–response curves between 2D and 3D showed remarkable differences and did not fit IC50 curves. Our previous macromolecular diffusion and drug-release studies showed a uniform distribution of the molecules throughout the MAX8 hydrogel network, a fast recovery of probes after photobleaching, and compatibility with a wide array of compounds with varied chemical structure.20–23 Thus, it is unlikely that under the culture conditions used an uneven penetration of the drugs throughout the hydrogel would cause these nonfitting dose–response curves. Furthermore, while the white 384-well plates used in our assays are not conducive to direct microscopic analysis, it is highly unlikely that two different cell populations were present within a well. The 3D culture assays were performed in untreated plates that do not support cell adhesion to the plastic and thus do not promote the growth of ONS-76 cells as monolayers. In addition, we first homogenously encapsulated the cells in the hydrogel18,24 and then distributed the fully polymerized hydrogel–cell constructs into the individual wells. This is possible due to the unique shear-thinning properties of the MAX8 peptide hydrogel. In addition, the hydrogel–cell construct was transferred directly into tissue culture medium rather than onto the bottom of the well, and a preformed drop of hydrogel–cell construct settled with gravity over time. Together with our previously reported growth curves of ONS-76 cells in MAX8-RGDS hydrogel 18 and the fact that most compounds validated by dose–response did not show significant changes in the shape of their curves, it is unlikely that the nonconforming vincristine and paclitaxel 3D dose–response curves were due to the presence of two distinct cell populations. Rather, they may be attributable to either differences in cell phenotype, differences in the proliferation rates of cells grown in 3D and 2D, or interactions of the compounds with the hydrogel network. We previously investigated the drug release profiles of vincristine encapsulated in native MAX8 hydrogel and its effects on hydrogel properties. 23 In those studies, we found that encapsulation of vincristine even at high concentrations of up to 500 µM did not affect the rheological properties or change the hydrogel network of MAX8. However, vincristine encapsulated in MAX8 remained active well beyond its half-life in bulk aqueous solution, an effect we had previously also observed for curcumin. 20 The effect on vincristine was likely due to shielding by the lysine side chains of the MAX8 peptide, thereby providing long-term drug stability. Whether the changes in drug stability are associated with a more biphasic dose–response curve in 3D cultures remains to be determined. With this, it is conceivable that if 3D cultures can be designed to closely mimic the in vivo microenvironment of a tumor cell, they likely will be more accurate in modeling drug behavior in a tumor tissue. On the other hand, poorly designed 3D culture systems in which drugs interact with the scaffold in a nonphysiological manner or alter scaffold properties may introduce system errors and thus not improve the drug discovery process.
In choosing a simple cell viability assay in combination with the Spectrum Collection compound library and a single-dose screen to prove the feasibility of automated HTS in a 3D setup, our pilot screen did not identify a potential hit that was validated to be active only in 3D and not in 2D or vice versa. This was despite our previous studies showing distinct differences in mRNA levels of differentiation and stem cell markers in ONS-76 cells grown in 2D monolayers and in 3D hydrogels with RGDS-tagged MAX8. In these studies, nestin, snail, and Gli3 levels were higher in 3D cultures than in 2D cultures. Further, the differences observed between the 2D and 3D cultures also reflected differences between normal cerebellum and cerebellar tumors of the transgenic Smo/Smo medulloblastoma mouse model. 18 ONS-76 cells have been assigned to the Shh subgroup of medulloblastoma, 33 and Smo/Smo mice are genetically engineered mice with constitutive activation of the Smoothened (Smo) receptor, and thus activation of the Shh pathway. 34 Therefore, the lack of significant differences in drug response profiles may be in part due to the use of a library that contains FDA-approved drugs and bioactive natural products, that to a large extent have previously demonstrated efficacy in a 2D cell-culture setup and at the same time are effective in an in vivo environment. Nevertheless, while we cannot exclude an effect of the RGDS peptide in 3D cultures itself, the distinct dose–response profiles observed of some compounds but not others indicate that it is unlikely that culturing cells within the MAX8-RGDS scaffold would introduce a systemic error, making all cells either more or less vulnerable to cytotoxic compounds. In addition, both screens identified vismodegib as a potential hit inducing cell death in ONS-76 cells. ONS-76 cells are human medulloblastoma cells assigned to the Shh-driven subgroup of medulloblastoma, and vismodegib inhibits hedgehog signaling. At this point, we recognize that the MAX8 scaffold used is still a simple mimic of a complex tissue microenvironment and therefore feel that drawing more in-depth conclusions regarding individual compounds would be premature.
Diverse 3D cell-culture technologies are rapidly moving toward integration into an HTS environment, and different 3D cell-culture approaches, including spheroids, scaffold-based 3D cultures, tumoroid systems, and combinations thereof, each have their advantages and disadvantages.1–14,35,36 Ultimately, the strength of a 3D cell-culture technology for drug discovery will lie in choosing the right culture method for a particular application. For example, a drug discovery approach aimed at the cell-to-cell adhesion machinery may benefit from spheroid-based cultures, whereas drug discovery approaches targeting the cell-to-substratum attachment or signaling pathways modulated by tissue stiffness will likely be better suited to scaffold-based 3D cultures. Multicellular tumor spheroids may be particularly well suited for drug discovery in the context of immunotherapy. In addition, cell lines themselves and primary cultures used for cell-based assays as well as detection methods may limit the 3D cell-culture approach taken. Some cells do not grow as spheres and require cell-to-substratum attachment to proliferate, whereas detection assays, such as bead-based assays and high-content screening, may find limitations in scaffold-based technologies. We are currently exploring a new generation of MAX8 derivatives that are expected to provide a more refined in vivo-like microenvironment for 3D cell-culture and are developing new assays for drug targets known to respond to a 3D environment. While our own focus is on developing a more brain-like ECM for drug discovery in brain tumors, it is conceivable that in the future MAX8 will provide a valuable tool for 3D drug discovery within a fully automated setup for other disease models. We have previously shown that MAX8 is biocompatible with cells of diverse origin and expect that the application of MAX8 as a 3D cell-culture scaffold for automated HTS can expand to other diseases, particularly where the microenvironment has been demonstrated to be a significant contributor to pathogenic mechanisms.
Supplemental Material
DS_DISC844570 – Supplemental material for Implementation of a High-Throughput Pilot Screen in Peptide Hydrogel-Based Three-Dimensional Cell Cultures
Supplemental material, DS_DISC844570 for Implementation of a High-Throughput Pilot Screen in Peptide Hydrogel-Based Three-Dimensional Cell Cultures by Peter Worthington, Katherine M. Drake, Zhiqin Li, Andrew D. Napper, Darrin J. Pochan and Sigrid A. Langhans in SLAS Discovery
Footnotes
Acknowledgements
We acknowledge the support of the National Institute of Standards and Technology (NIST), U.S. Department of Commerce, in providing the neutron research facilities used in this work. This work utilized facilities supported in part by the National Science Foundation under agreement no. DMR-0944772. This paper was prepared under cooperative agreement 70NANB12H239 from NIST, U.S. Department of Commerce. The statements, findings, conclusions, and recommendations are those of the authors and do not necessarily reflect the view of NIST or the U.S. Department of Commerce.
Supplemental material is available online with this article.
Authors’ Note
Katherine M. Drake is currently affiliated with Incyte, Wilmington, DE 19803, USA. Andrew D. Napper is currently affiliated with Evotec, Princeton, NJ 08540, USA.
Declaration of Conflicting Interests
The authors declared no potential conflicts of interest with respect to the research, authorship, and/or publication of this article.
Funding
The authors disclosed receipt of the following financial support for the research, authorship, and/or publication of this article: This work was supported by funds from the NIH IDeA program, with grants from the National Institute of General Medical Sciences (NIGMS) (P20-GM103464, P30-GM114736, and U54-GM104941), the DO Believe Foundation, and the Nemours Foundation.
References
Supplementary Material
Please find the following supplemental material available below.
For Open Access articles published under a Creative Commons License, all supplemental material carries the same license as the article it is associated with.
For non-Open Access articles published, all supplemental material carries a non-exclusive license, and permission requests for re-use of supplemental material or any part of supplemental material shall be sent directly to the copyright owner as specified in the copyright notice associated with the article.