
Abstract
Many factors must be considered during the optimization of an enzyme assay. These include the choice of buffer and its composition, the type of enzyme and its concentration, as well as the type of substrate and concentrations, the reaction conditions, and the appropriate assay technology. The process of an enzyme assay optimization, in our experience, can take more than 12 weeks using the traditional one-factor-at-a-time approach. In contrast, the design of experiments (DoE) approaches have the potential to speed up the assay optimization process and provide a more detailed evaluation of tested variables. However, not all researchers are aware of DoE approaches or believe that it is easy to employ a DoE approach for the optimization of an assay. In order to facilitate enzyme assay developers to use DoE methodologies, we present in detail the steps required to identify in less than 3 days (1) the factors that significantly affect the activity of an enzyme and (2) the optimal assay conditions using a fractional factorial approach and response surface methodology. This is exemplified with the optimization of assay conditions for the human rhinovirus-3C protease, and the methodology used could be employed as a basic guide for the speedy identification of the optimum assay conditions for any enzyme.
Keywords
Introduction
Enzymes that are involved in the pathogenesis and development of disease are important targets for many marketed drugs, which are designed mainly to inhibit such enzymes. 1 During the initial stages of any drug design project, large chemical libraries composed of a variety of molecules that differ in size and structure have to be screened in order to identify new leads and hits (i.e., inhibitors, bioactive compounds, and ligands).2,3 Pharmaceutical companies perform more than 50 million biological assays (including enzyme assays) annually, despite the improvements in assay technology. 4 Thus, the development of reliable enzyme assays for the identification of lead compounds is a major challenge in the initial stages of any drug development project.2,3
The development of an in vitro enzyme assay requires consideration of several factors, including the purity of the enzyme, pH, viscosity and ionic strength of the reaction mixture, and the addition of co-factors or other buffer additives. 5 Although methodologies for enzyme assays have been extensively reviewed (see Bisswanger 6 and references cited therein), a further modification of procedure is most likely required in all cases, in order to adjust the assay to the special features of the target enzyme or in order to develop an assay for a newly discovered enzyme. 6 During the optimization of an enzyme assay, the effects of the following factors are normally examined: (1) buffer composition, (2) pH, (3) temperature, (4) the concentration of divalent ions (e.g., Mg2+, Ca2+), (5) the concentration of ion salts (e.g., NaCl, KCl), (6) the type and concentration of reducing agents (e.g., DTT, β-mercaptoethanol), and (7) solvent concentration (e.g., DMSO, polyethylene glycol [PEG]). 7 In addition to these, the choice of detection method for following an enzymatic reaction and the size of the reaction volume are also critical,6,8 especially if there are budget and material limitations. Assays are miniaturized in order to reduce the consumption of reagents (and therefore the cost), and the effect of miniaturization on both the signal window and assay performance should be examined in each case, 9 while the general guidelines for enzymatic assays for high-throughput screening (HTS) must be employed. 7 Moreover, the suitability of HTS assays should be evaluated for biological and pharmacological relevance as well as for robustness of assay performance by quantitative methods. 10 More information and guidelines for assay validation methods, analyses, and acceptance criteria are available at https://www.ncbi.nlm.nih.gov/books/NBK83783/.
Using the traditional one-factor-at-a-time (OFAT) approach can take 4 or more months to develop an assay, and assay development can become a bottleneck in drug discovery projects. 11 Using the OFAT approach, one gains information about a particular factor during the experiment without taking into account the interactions among the various factors that may affect enzyme activity. Statistical design of experiments (DoE) is a statistical tool that is used to evaluate much faster both the effect and the significance of experimental variables (independent variables) on a response (dependent variable). 12 The most critical step in all DoE approaches is the selection of variables (and their levels), which need to be examined since each design is a fit-for-purpose DoE. 13 Among the various DoE designs, response surface methodology (RSM) is the most widely used, and it has been successfully employed for the design, development, improvement, and optimization of various processes and for the formulation of new products and upgrading of existing ones. 14 Even though the automated liquid handling systems (robotics) are not designed for setting up DoE assays, and the pipetting required to set up a DoE assay manually is too complicated, DoE designs have several advantages over the traditional OFAT approach. DoE designs produce data that can be analyzed to draw more accurate conclusions regarding the assay, while at the same time they improve the quality of the assay and shorten the time of assay development/validation.7,8 Most importantly, in assay development, DoE designs can be used for screening, characterization, optimization, and evaluation of assay robustness, whereas in assay validation, DoE can be used for confirmation studies and for assessing assay robustness. 11 It is worthwhile to mention that recent advances in automation could facilitate the development of DoE assays using automated liquid handling systems. Modern systems such as TTP Labtech’s (Melbourn, UK) dragonfly system, Labcyte’s (San Jose, CA) Echo Acoustic Liquid Handling Technology, and Tecan’s (Männedorf, Switzerland) liquid handling/automation systems (e.g., the Freedom EVO systems) are equipped with low-volume dispensers and acoustic liquid handling systems and have the potential to be used for DoE assay development and optimization. Thus, the software to design experiments on automaton is now more of a limitation than automation itself.
For the DoE approaches as well as for the analysis/evaluation of the results, several software packages (e.g., Design-Expert, Minitab, JMP) are available. However, in spite of their availability, the use of DoE approaches has been limited to chromatographic and electrochemical techniques, and there are only a few publications using DoE in enzyme assays. Interestingly, a survey carried out by HTStec in 2009 15 revealed that researchers do not use DoE approaches to optimize a biological process because the majority of them believe that this kind of design is very difficult to employ. In addition, many researchers stated that they were not aware of DoE, while others did not fully understand the benefits of these approaches in assay development. On the other hand, others have suggested the use of DoE in the industry and that it should be taught in academia. 16
The aim of this work is to demonstrate the benefits of the applications of DoE to enzymologists and, at the same time, provide a step-by-step guide that will encourage them to use DoE approaches. To this end, we have used the optimization of assay conditions for the human rhinovirus (HRV)-3C protease as a case study. HRV-3C protease, which plays an important role in viral infection (i.e., it catalyzes the generation of functional viral proteins and enzymes 17 ), is a potential target for antiviral drug development. To identify novel inhibitors that bind selectively at the catalytic site of HRV-3C protease, it is necessary to have an assay suitable for the HTS of large libraries. Herein, we describe the layout of the statistical approaches used for (1) the identification of variables that significantly affect HRV-3C protease activity and (2) the further optimization of enzyme assay conditions. To this end, the colorimetric assay developed by Wang et al. 17 was optimized using the DoE approach. The optimization of reaction conditions resulted in a 1.5-fold increase in the HRV-3C protease activity in a 96-well plate format that makes the assay suitable for HTS of enzyme inhibitors.
Materials and Methods
Materials
All chemicals were obtained from Sigma-Aldrich (St. Louis, MO), Thermo Fisher Scientific (Waltham, MA), or Macherey-Nagel (Düren, Germany). Recombinant HRV-3C protease was expressed in Escherichia coli (as a GST-tagged protein) and purified as previously described. 18 Separation of HRV-3C protease from the GST tag was carried out using the Thrombin Clean Cleave Kit (Sigma) according to manufacturer’s instructions.
HRV-3C Protease Activity Assay
The activity of HRV-3C protease was assessed using the synthetic p-nitroanilide (pNA) peptide, EALFQ-pNA (Peptides International, Louisville, KY), which mimics the cleavage site of HRV-3C protease as previously described, 17 with minor modifications. Briefly, 0.5 μΜ of the purified HRV-3C protease was incubated with 250 μΜ pNA peptide substrate in a final reaction volume of 100 μL. For the identification of factors that significantly affect the activity of HRV-3C protease, a fractional factorial approach was employed that included experiments under various reaction conditions using 50 mM of either Tris-HCl or HEPES buffer at different pH values and a range of concentrations of various additives as described in Results and Discussion. For the optimization of HRV-3C protease assay conditions using RSM, experiments were carried out at 30 °C in 50 mM HEPES buffer at different pH values and concentrations of DTT and glycerol as described in Results and Discussion. All buffers were supplemented with 150 mM NaCl and 0.5 mM EDTA. Peptide cleavage activity was assayed by optical density (OD) measurements at 405 nm, against a control sample that did not contain any enzyme. 17 A different pNA standard curve (0–250 μΜ) was prepared for each reaction buffer ( Suppl. Fig. S1 ). All reactions were directly prepared in 96-microtiter plate wells and the OD measurements were monitored using a temperature-control microplate reader (PerkinElmer, Waltham, MA). One unit of protease activity was defined as the cleavage of 1 μmol/min of pNA peptide at 30 °C (or at the designated temperature as described in Results and Discussion).
Determination of the Michaelis–Menten constant (KM) and maximum velocity (Vmax) before and after optimization of reaction conditions, as described in Results and Discussion, was carried out using 0.5 μΜ HRV-3C protease with incresing concentrations of pNA peptide (0–600 μΜ). All assays were performed in triplicate. The kinetic parameters KM and Vmax were calucated by fitting the data by nonlinear regression to the classic Michaelis–Menten steady-state model (eq 1) using Prism v7.0 (GraphPad, La Jolla, CA):

where vo is the initial velocity (μmol/mL/min), Vmax is the maximum reaction velocity (μmol/mL/min), and S is the substrate concentration (μΜ). The turnover number (kcat) was caculated assuing a molecular mass of 20.5 kDa.
Determination of Z′ Factor
The Z′ factor is a statistical parameter that is employed to assess the quality of an HTS assay.10,19 The Z′ factor was calculated based on the following equation:

where σp and σc are the standard deviations of the positive and negative controls, respectively, and μp and μn are their respective means.
The assay was carried out with a final concentration of 0.5 μΜ HRV-3C protease and 250 μΜ pNA substrate in a final volume of 100 μL either in the previously described assays conditions (25 mM HEPES, pH 7.5, 150 mM NaCl, 1 mM EDTA, 6 mM DTT at 30 °C for 30 min) 17 or in the optimized reaction conditions as described in Results and Discussion. Negative controls contained assay buffer in place of HRV-3C protease.
Statistical Design of Experiments
The software package Design-Expert v7 (Stat-Ease Inc., Minneapolis, MN) was used to design the DoE approaches, statistically analyze the results, and plot the three-dimensional (3-D) response surface graphs as described in Results and Discussion.
Results and Discussion
Strategy to Optimize the Reaction Conditions for HRV-3C Protease
The colorimetric assay for the determination of enzymatic activity of HRV-3C protease using a pNA synthetic peptide mimicking its native cleavage site has been previously described. 17 Cleavage of pNA peptide between glutamine and pNA by the protease releases a yellow-colored pNA product (λmax = 405 nm). It should be noted that to avoid false-positive or false-negative results due to buffer additive or traces of additives (i.e., DTT, EDTA, glycerol), we first evaluated any color interference by these compounds. None of these agents at the concentrations used affected the amount of yellow color produced (data not shown). Other key additives that may interfere, like detergents (to avoid protein aggregation), DMSO (used for the storage of compounds), and reducing agents (used to prevent oxidation of cysteine residues), are currently under investigation in our laboratory.
When we performed the assay under the previously described reactions conditions 17 (25 mM HEPES, pH 7.5, 150 mM NaCl, 1 mM EDTA, 6 mM DTT at 30 °C for 30 min), the activity of HRV-3C protease was found to be equal to 487 ± 5.2 U/mL. Under these assay conditions, the kinetic parameters KM, Vmax, and Kcat were determined to be 244.6 ± 18 μΜ, 908 ± 31 μmol/mL/min, and 30 × 10−3 s−1, respectively, while a Z′ value of 0.78 was obtained. We subsequently performed a screening-and-optimization DoE investigation to determine which reaction conditions could increase the activity of the protease. At first, we employed a fractional factorial design to identify factors that significantly affected enzyme activity. This was followed by the identification of optimal assay conditions using RSM. The specific steps taken for these approaches are described below.
Part 1: Screening Experiments to Identify Statistically Significant Factors
When optimizing assay reactions, the first question to ask is, “What variables should we examine?” A screening test is needed, therefore, to identify the factors (variables) that significantly affect the reaction (response) and thus reduce the long list of potential factors to a manageable few. It should be noted that the meaning of the terms of the DoE approaches that are used here are summarized in Supplemental Table S1 .
A two-level design is usually employed in order to identify the most important factors. Two-level designs are those in which all factors have only two values, while the effects of both categorical and continuous factors on the response can be examined simultaneously. Thus, to examine k factors at two levels, 2k combinations (experiments) are required. The 2k full (or complete) factorial design uses all 2k combinations. When there are many factors to be examined as to whether they are important for the reaction, the number of experiments to perform using a 2k full factorial approach becomes very large and too expensive to implement. In this case, it is recommended to examine only a fraction (e.g., one-half or one-quarter) of the full factorial approach. Thus, the
In the case of the HRV-3C protease used in this study, one categorical factor, that is, buffer composition (Tris-HCl and HEPES), and seven continuous factors—reaction pH, temperature, and time, as well as the concentrations of NaCl, DTT, EDTA, and glycerol—were selected for an initial screening. The low (–) and high (+) values of these factors to be tested were as follows: pH 7 and 8; temperature, 25 and 30 °C; time, 20 and 40 min; NaCl concentration, 150 and 500 mM; DTT concentration, 1 and 10 mM; EDTA concentration, 0.5 and 5 mM; and glycerol concentration, 2% and 10% v/v. The high and low levels of variables were selected as follows: for pH, DTT, EDTA, and incubation time, we used the standard conditions (7.5, 6 mM, 0.5 mM, and 30 min, respectively) as a starting point and we increased and decreased their values. However, for the activity of HRV-3C protease at least 150 mM NaCl is required;17,18 thus, we used this salt concentration as the low level. In addition, we selected 30 °C as the high level of reaction temperature because at this temperature denaturation is not an issue and effective thermosetting is not required, while the assay is carried out at a temperature closer to the in vivo temperature of 37 °C. It should be noted that glycerol is not included in the standard assay condition, but we wanted to examine whether its presence affects the HRV-3C protease activity because glycerol is widely used to enhance the stability of many proteins. 18 Based on preliminary experiments, the presence of 0.5 μΜ purified protease was sufficient to determine its activity under these conditions (data not shown).
Fractional Factorial Experimental Design for the Identification of Factors That Significantly Affect the Activity of HRV-3C Protease.
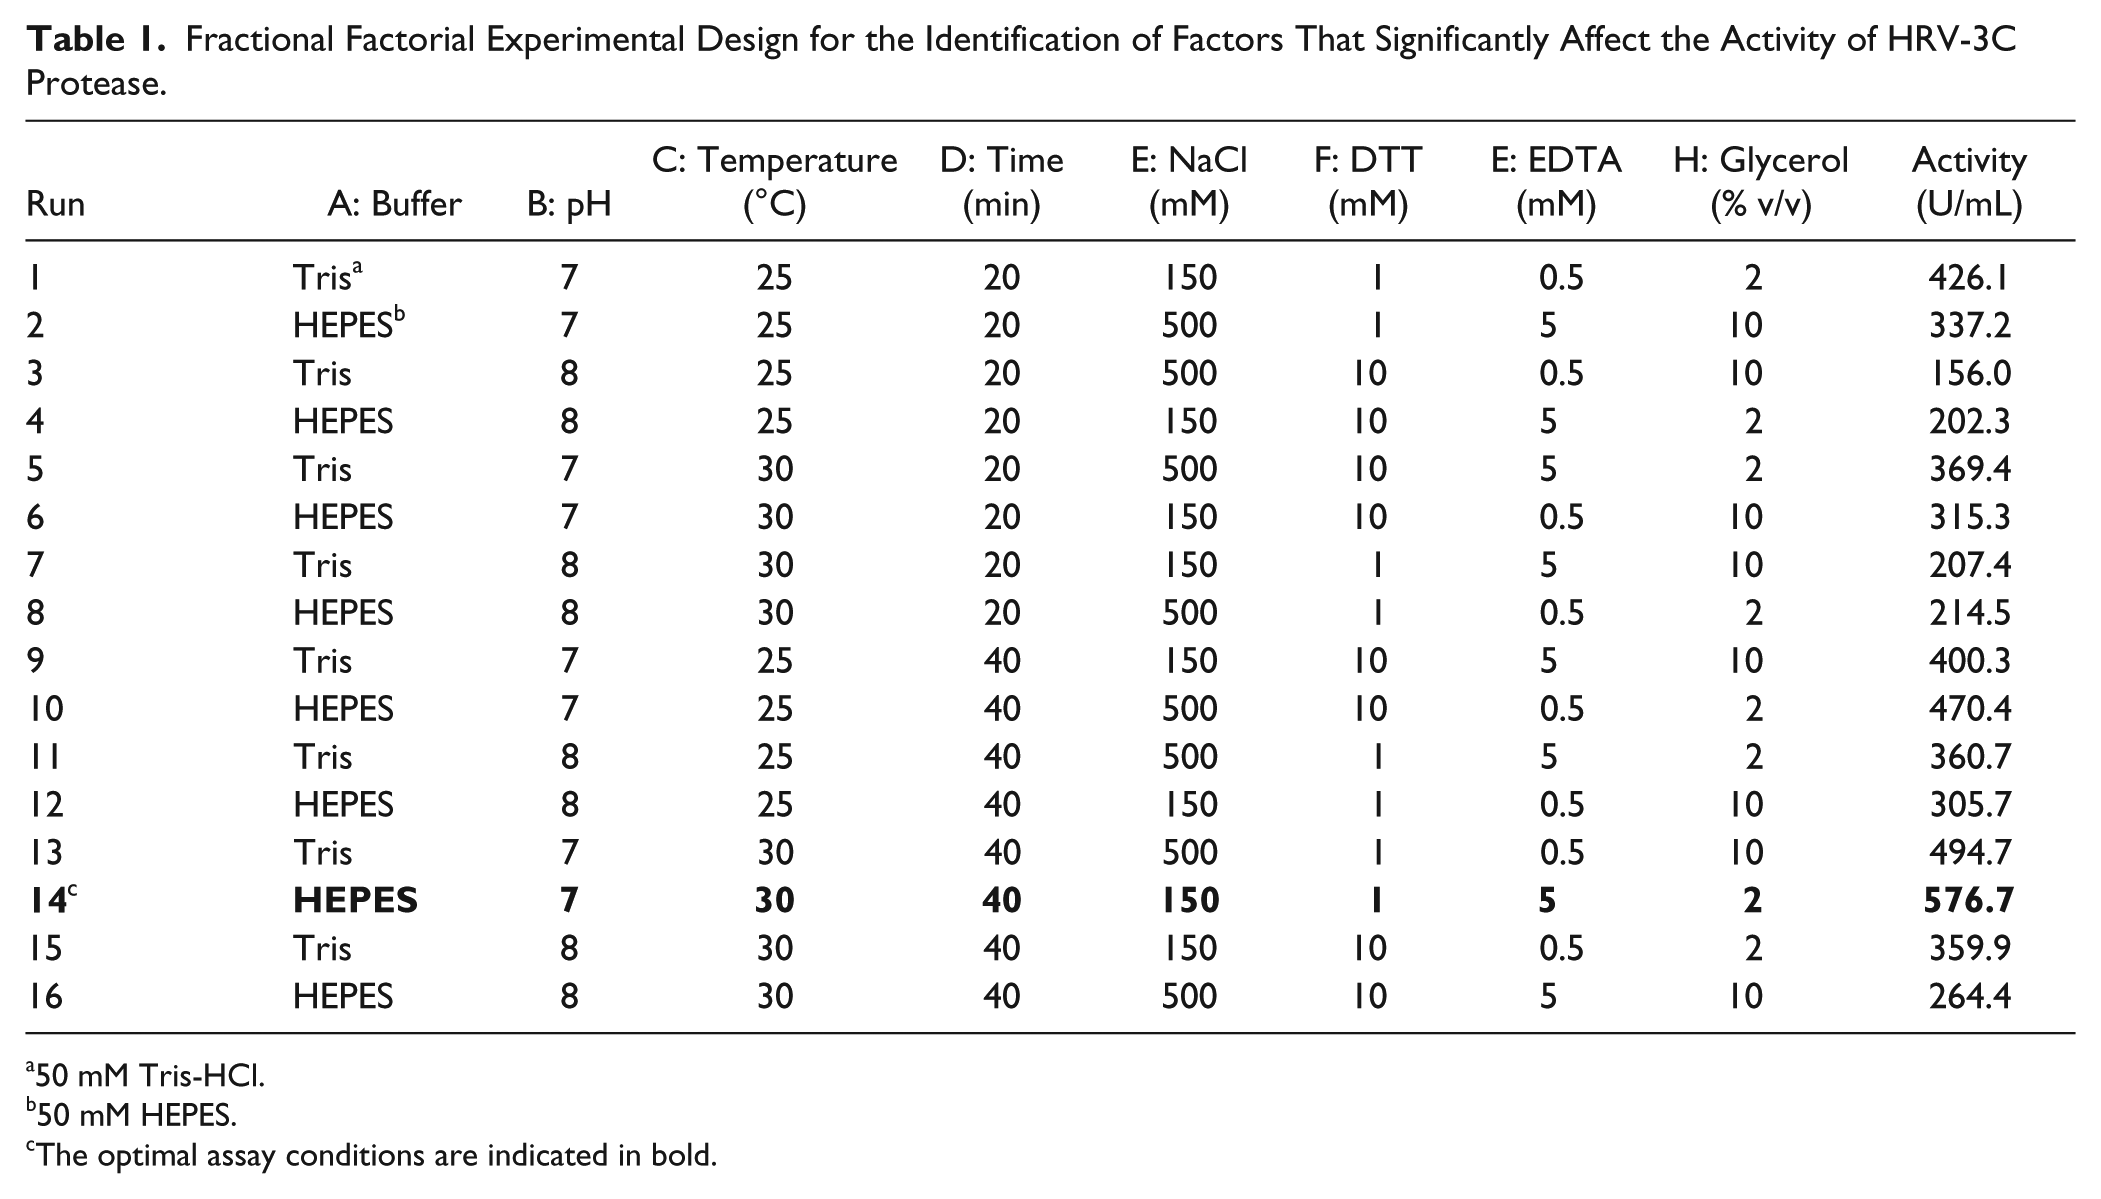
50 mM Tris-HCl.
50 mM HEPES.
The optimal assay conditions are indicated in bold.
(
Part 2: Optimization of HRV-3C Protease Activity Using Response Surface Methodology
Once the key factors affecting a process are identified, an RSM design can then be employed to further optimize the process. RSM designs fit the experimental data with a second-order equation for the response, and if a maximum or minimum exists within the region of the key factors, RSM will find it. 14 The main steps followed to identify the optimal assay conditions for HRV-3C protease using RSM are described below.
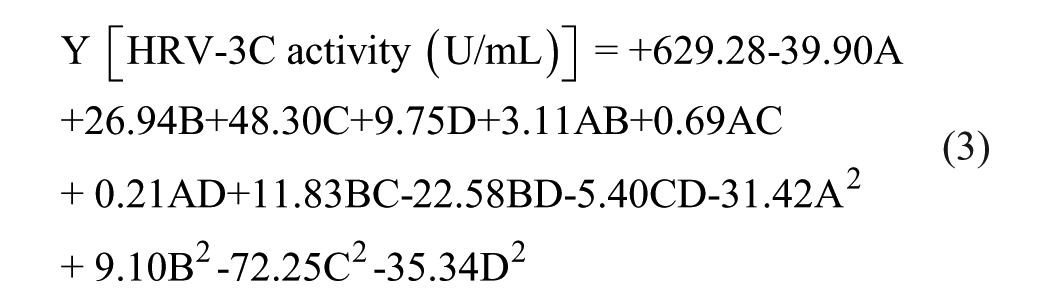
where Y represents the response, that is, the activity in U/mL of the HRV-3C protease enzyme, and A, B, C, and D are the mathematical model terms for the four factors, that is, pH, time, DTT concentration, and glycerol concentration, respectively.
The quality of the fitted mathematical model (eq 3) was evaluated by using “Lack of Fit test” and “Adj R-Squared.” The “Lack of Fit F-value” of 2.46 indicates that the lack of fit is not significant relative to the pure error, while the “Lack of Fit p-value” of 0.1666 indicates that all data are fitted well to the model. Moreover, the “Pred R-Squared” of 0.6871 was in good agreement with the “Adj R-Squared” of 0.8797. The “Adeq Precision” of 18.111 indicates an acceptable signal-to-noise ratio.
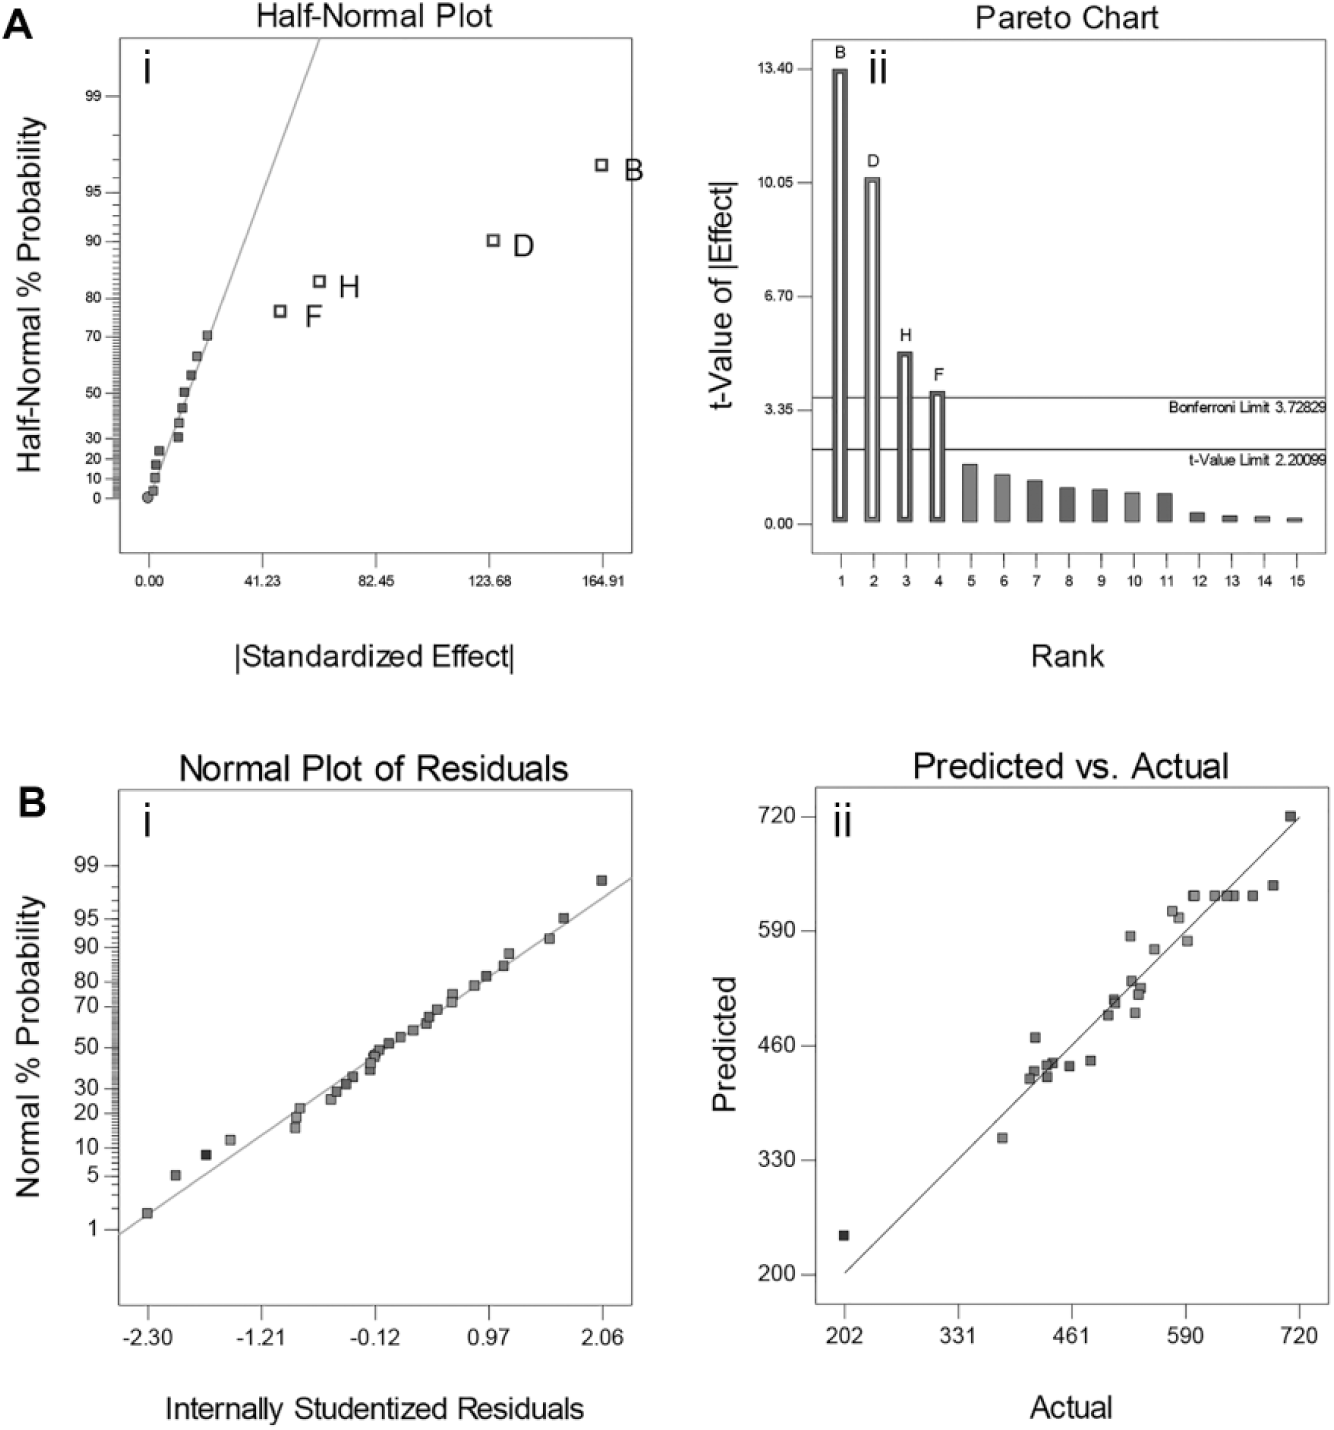
The adequacy of the fitted model (eq 3) was also verified by the normal (%) probability plot of the “Studentized” residual, as illustrated in Figure 1B (i); as shown, the errors of the model were normally distributed and insignificant. Moreover, as illustrated in Figure 1B(ii) the experimental and predicted values for the activity of HRV-3C protease are close. The predicted and actual values for the activity of HRV-3C protease are also illustrated in Table 2 .
The impact of variables on HRV-3C protease activity was evaluated by using the F tests following ANOVA and a p value of <0.05 for determining whether differences are statistically significant ( Suppl. Tables S3 ). The analysis revealed that the activity of the tested protease was significantly (p < 0.05) affected by the linear coefficients A, B, and C; by the quadratic factors A2, C2, and D2; and by the interaction of factor B with D.
Central Composite Matrix with Actual and Predicted Responses of HRV-3C Protease Activity.
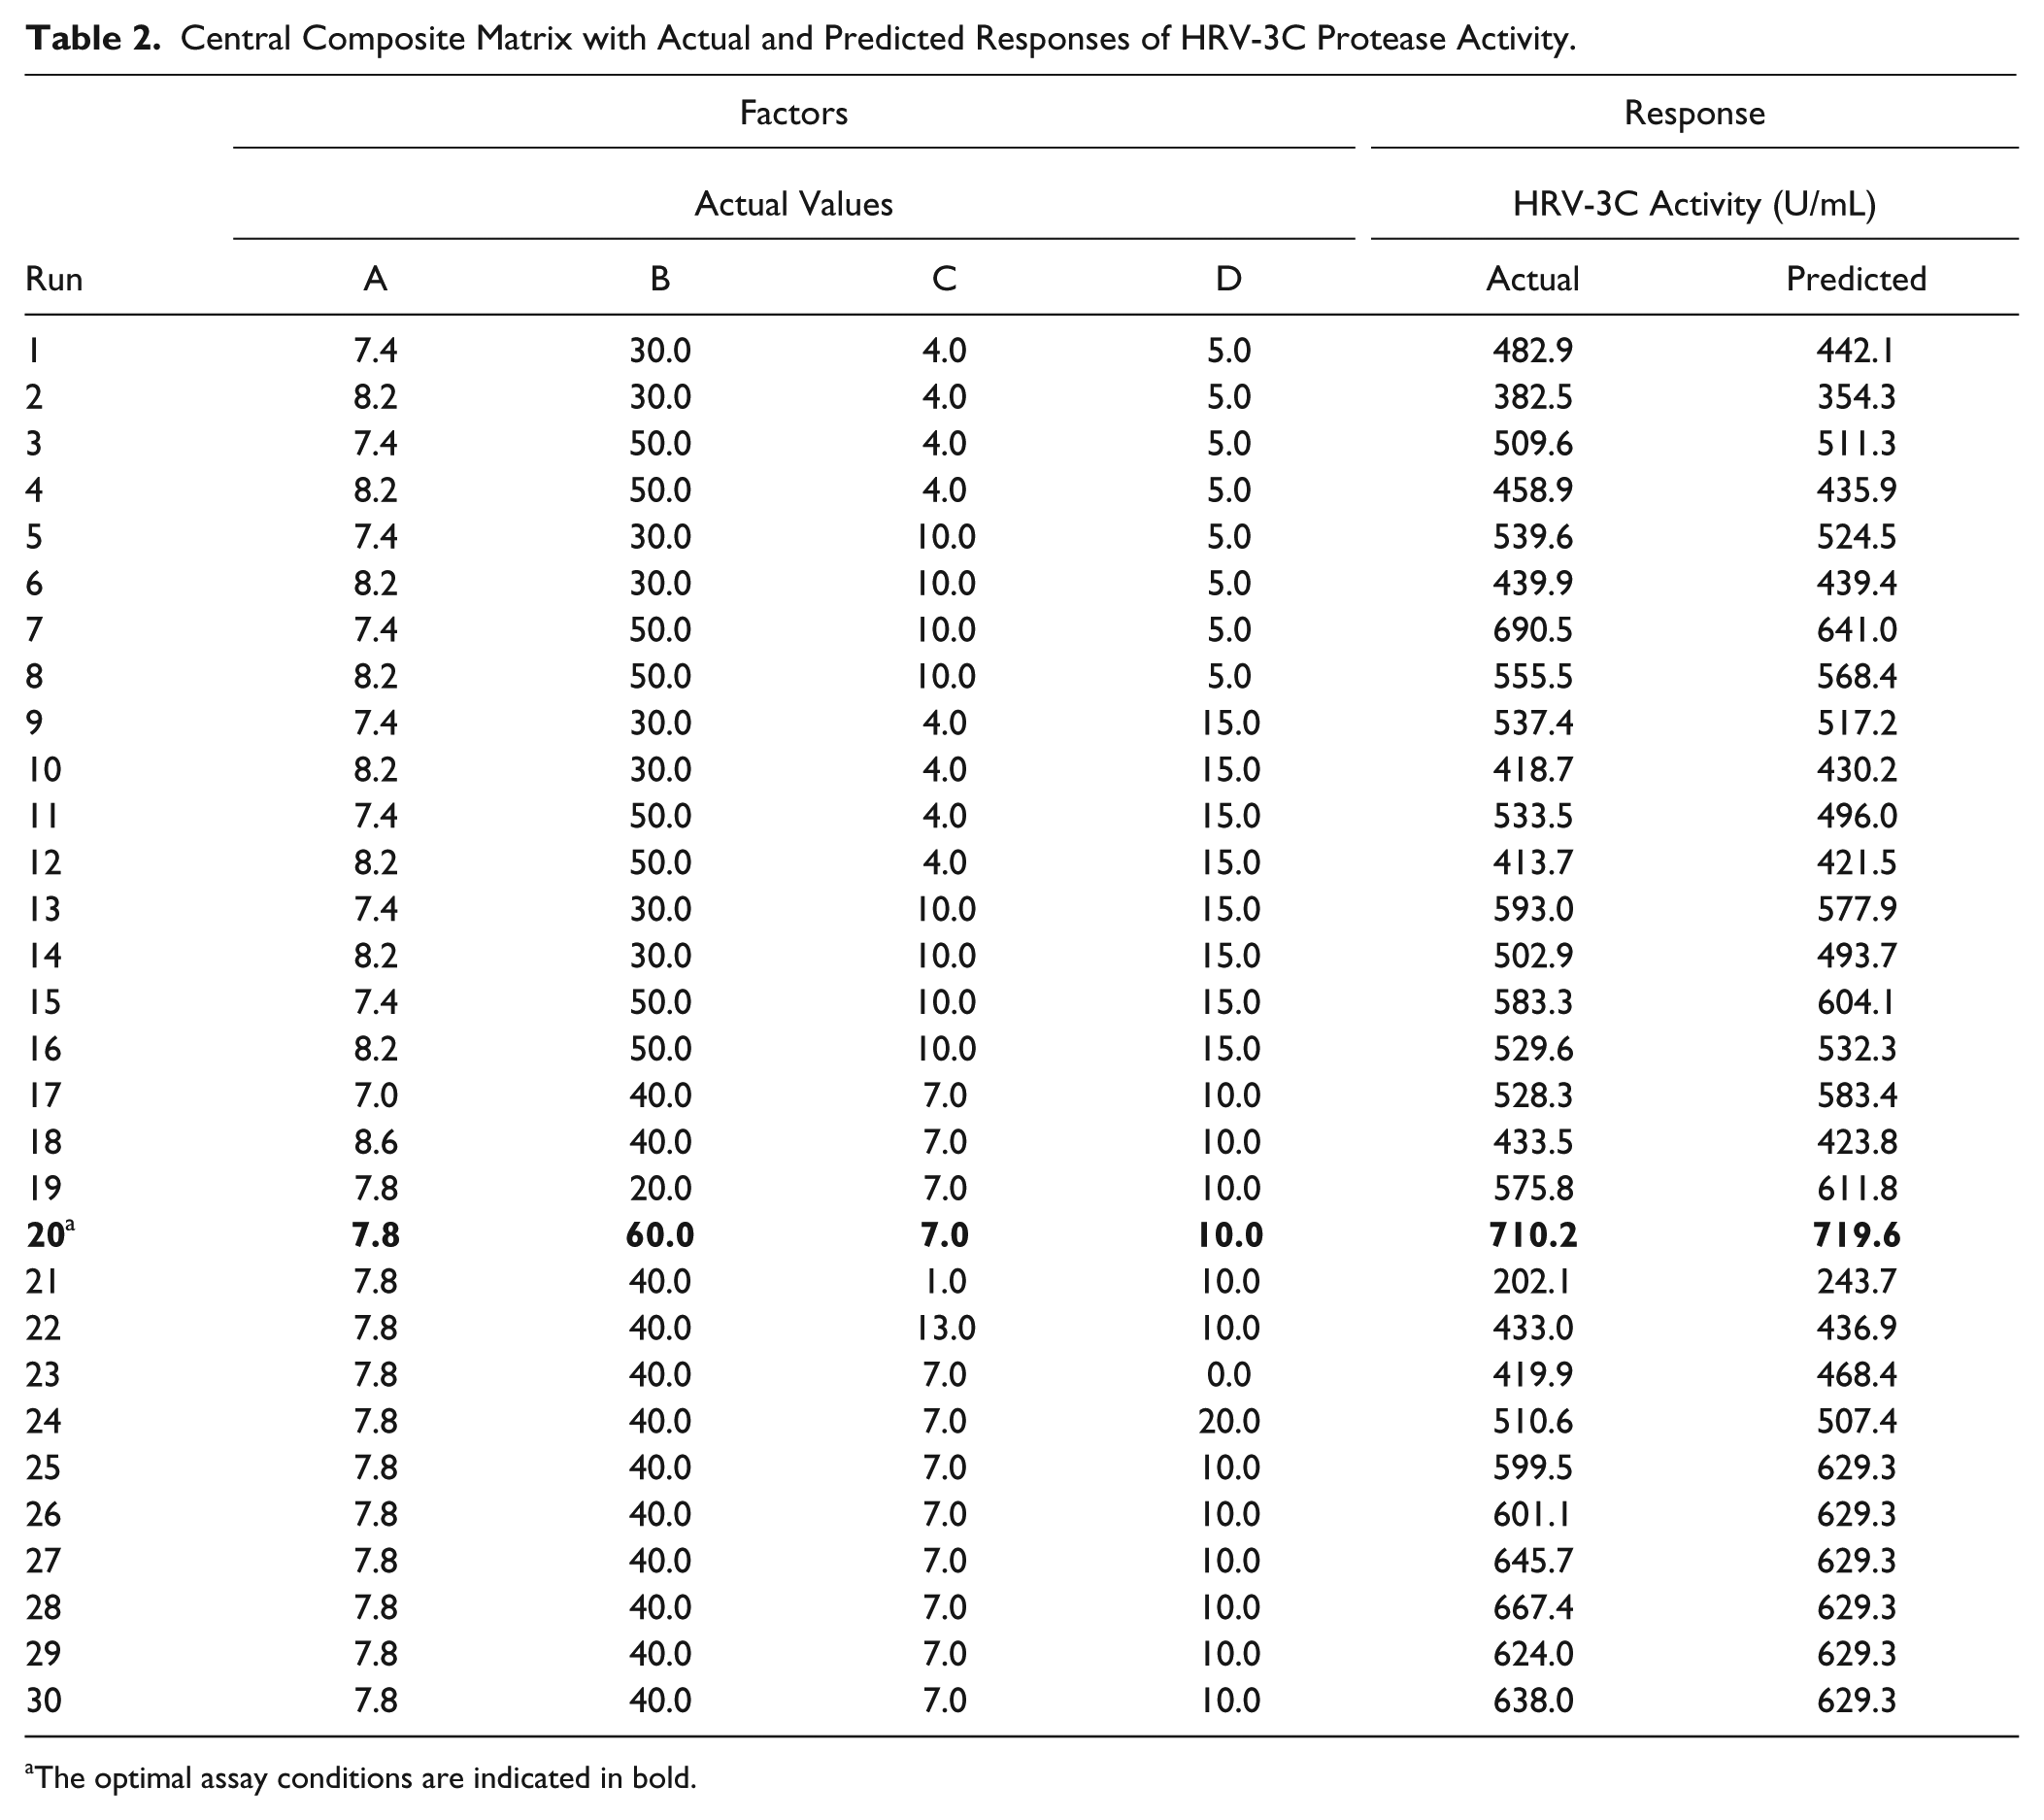
The optimal assay conditions are indicated in bold.
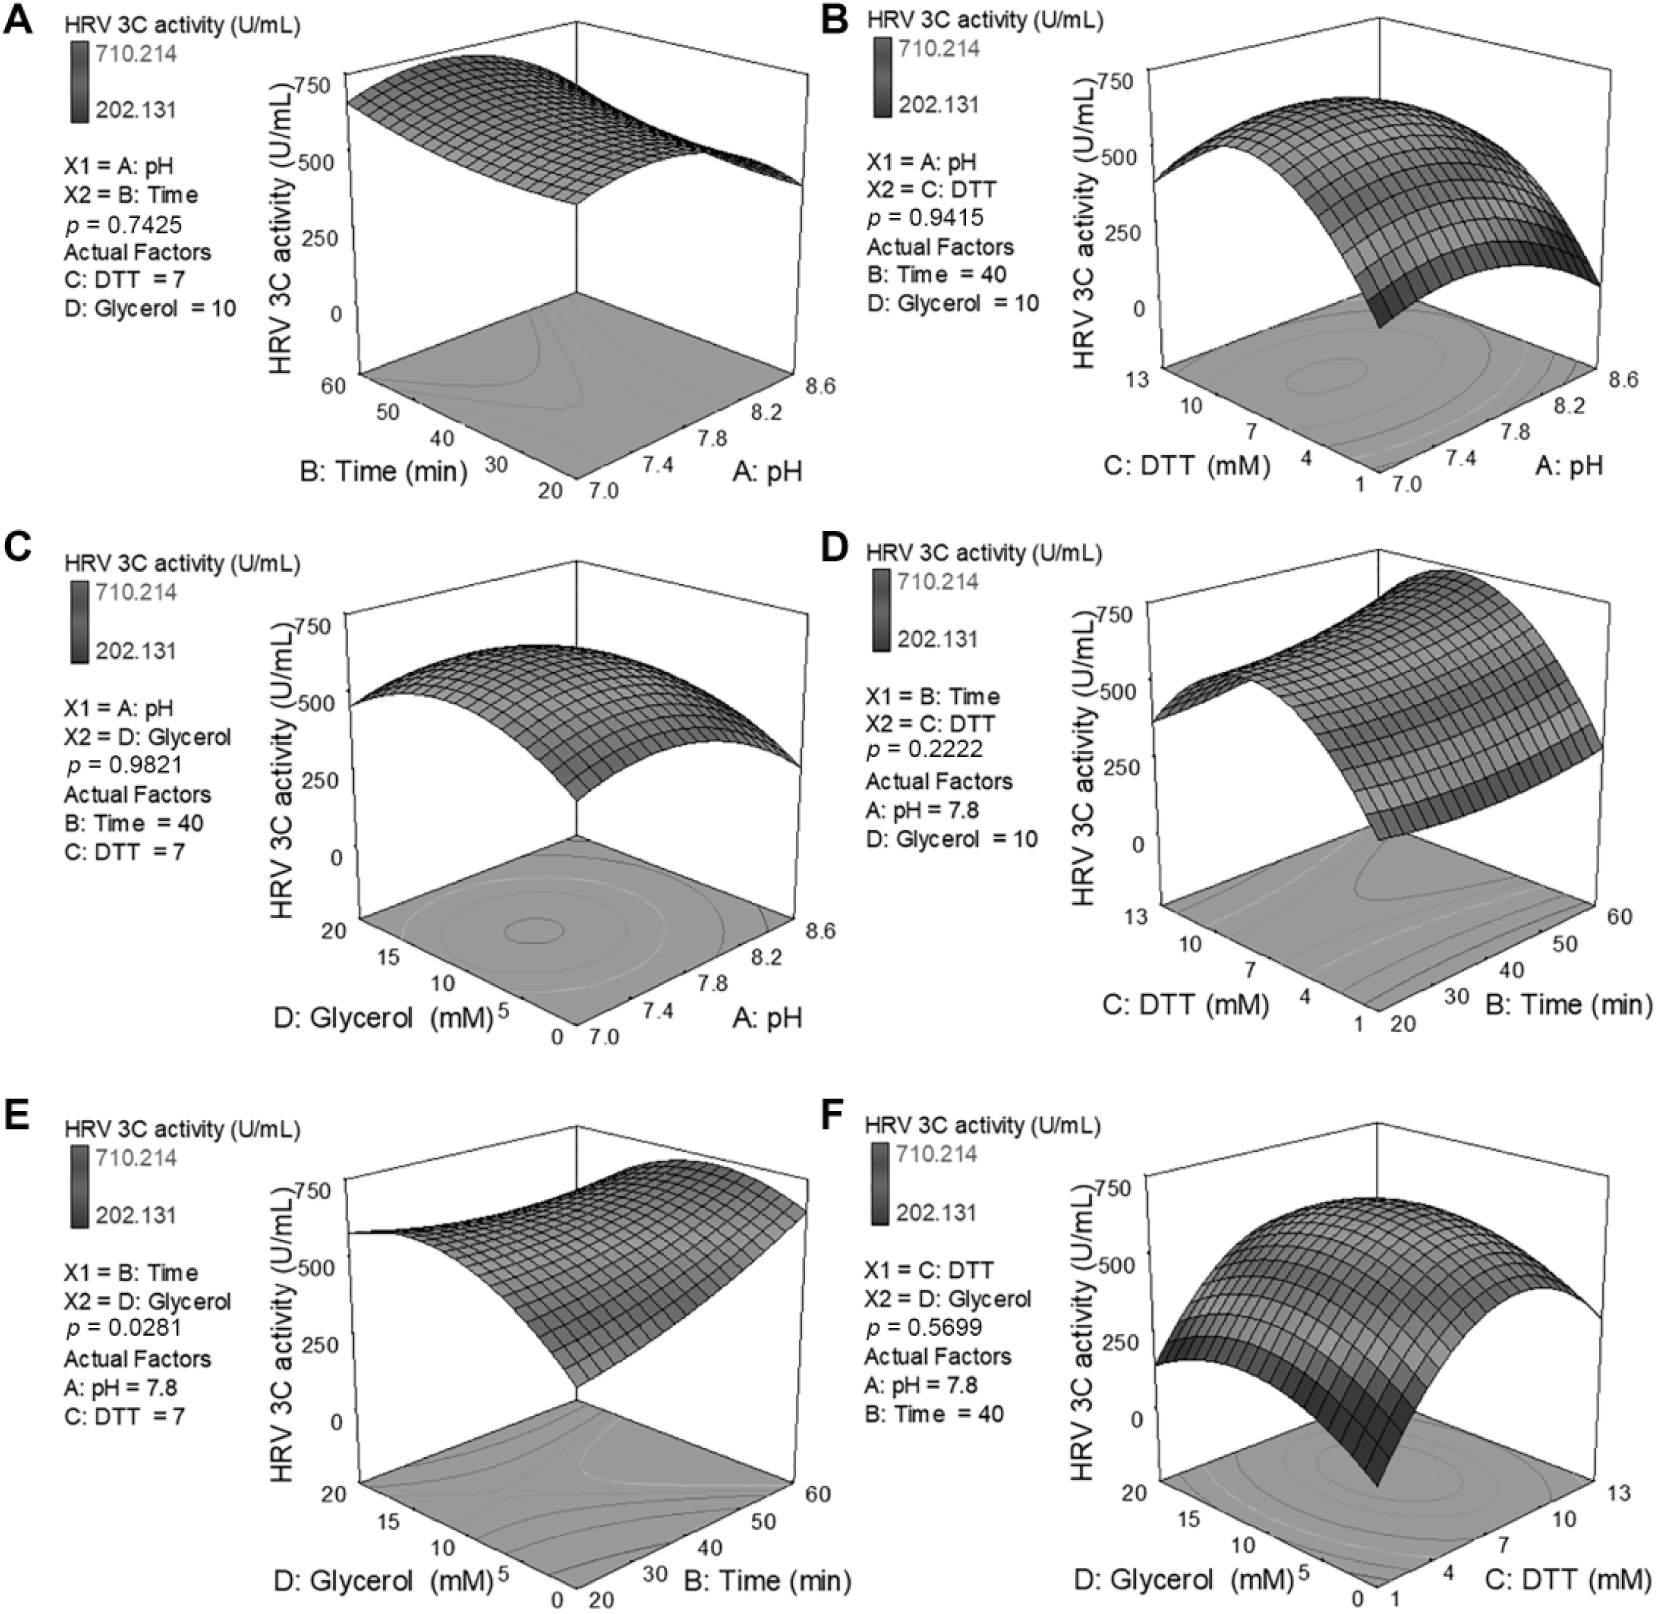
Response surface plots generated from the quadratic model of eq 3, showing the effect on HRV-3C protease activity of changing two factors at a time while the rest are fixed at their central points. The effect of interactions between factors was considered significant if the p value obtained from ANOVA was <0.05 (
Suppl. Table S3
). (
In conclusion, DoE is a powerful tool that is gaining success in the optimization of any process that is affected by multiple factors. In this study, we ran the optimization of assay conditions of the HRV-3C protease in only 2 days, with one only scientist, and an approximately 50% increase of activity was achieved after identification of the optimal reaction conditions (the enzyme activity before and after optimization was 487 and 732 U/mL, respectively). Kinetic studies revealed that under optimal conditions, the affinity (reciprocal of KM) of HRV-3C protease against pNA peptide substrate, Vmax, and kcat increase by 25.8%, 33.8%, and 36.7%, respectively, (p < 0.001). Most importantly, our modified assay demonstrated a significantly higher Z′ factor (0.92) compared with assay under the standard reaction conditions (Z′ factor 0.78), indicating that the former is probably more suitable for identifying HRV-3C protease inhibitors. The Z′ test is the most important statistical test to assess the assay quality as it takes into account both the signal window and assay viability. 10 This final assessment of assay performance confirmed the efficiency of the developed assay for screening potential inhibitors of HRV-3C protease. It should be noted that the kinetic parameters should be balanced with the assay window when DoE is employed for the optimization of assay conditions.
Supplemental Material
DS_DISC830084 – Supplemental material for A General Guide for the Optimization of Enzyme Assay Conditions Using the Design of Experiments Approach
Supplemental material, DS_DISC830084 for A General Guide for the Optimization of Enzyme Assay Conditions Using the Design of Experiments Approach by Favour Chinyere Onyeogaziri and Christos Papaneophytou in SLAS Discovery
Footnotes
Acknowledgements
We thank Professor Catherine Demoliou for her support and critical review of the manuscript.
Supplemental material is available online with this article.
Declaration of Conflicting Interests
The authors declared no potential conflicts of interest with respect to the research, authorship, and/or publication of this article.
Funding
The authors received no financial support for the research, authorship, and/or publication of this article.
References
Supplementary Material
Please find the following supplemental material available below.
For Open Access articles published under a Creative Commons License, all supplemental material carries the same license as the article it is associated with.
For non-Open Access articles published, all supplemental material carries a non-exclusive license, and permission requests for re-use of supplemental material or any part of supplemental material shall be sent directly to the copyright owner as specified in the copyright notice associated with the article.