
Abstract
Mcm2–7 is the molecular motor of eukaryotic replicative helicase, and the regulation of this complex is a major focus of cellular S-phase regulation. Despite its cellular importance, few small-molecule inhibitors of this complex are known. Based upon our genetic analysis of synthetic growth defects between mcm alleles and a range of other alleles, we have developed a high-throughput screening (HTS) assay using a well-characterized mcm mutant (containing the mcm2DENQ allele) to identify small molecules that replicate such synthetic growth defects. During assay development, we found that aphidicolin (inhibitor of DNA polymerase alpha) and XL413 (inhibitor of the DNA replication-dependent kinase CDC7) preferentially inhibited growth of the mcm2DENQ strain relative to the wild-type parental strain. However, as both strains demonstrated some degree of growth inhibition with these compounds, small and variable assay windows can result. To increase assay sensitivity and reproducibility, we developed a strategy combining the analysis of cell growth kinetics with linear discriminant analysis (LDA). We found that LDA greatly improved assay performance and captured a greater range of synthetic growth inhibition phenotypes, yielding a versatile analysis platform conforming to HTS requirements.
Introduction
Automated high-throughput screening (HTS) has revolutionized the discovery of both chemotherapeutics and molecular probes. 1 Early screening efforts often utilized purified systems combined with biochemical assays to identify enzymatic inhibitors. For example, this approach identified agents that block ongoing DNA replication by specifically targeting DNA polymerase (e.g., aphidicolin 2 ), topoisomerase, 3 DNA ligase, 4 and the DDK kinase CDC7/DBF4. 5 Such DNA replication inhibitors have broad applicability in antiviral and antitumoral chemotherapy. 6
As many potential drug targets lack robust and easily assayable enzymatic activities, biochemical approaches have limitations in HTS. For example, few identified inhibitors block the early stages of DNA replication, as many such initiation factors function as multi-subunit complexes that are difficult to purify in sufficient quantity (e.g., ORC and MCM2–7) or lack enzymatic activity in isolation (CDC45 and the GINS complex). 7 Such factors are potentially very important drug targets, as their inhibition would be expected to block unwanted DNA replication before it starts, providing an alternative and perhaps less deleterious therapeutic avenue compared with current inhibitors that target ongoing DNA replication. In particular, the replicative helicase Mcm2–7 is an unusually promising chemotherapeutic target that is involved in key aspects of both initiation and elongation.8,9
The discovery of selective Mcm2–7 inhibitors has been challenging. One initial attempt utilized a low-throughput candidate approach combined with an in vitro biochemical assay to measure DNA unwinding. 10 Several of the inhibitors identified by this assay, including the fluoroquinolone ciprofloxacin, demonstrated low to moderate specificity. However, the assay lacked scalability, as the Mcm2–7 complex is difficult and expensive to purify in sufficient quantities for HTS.
In principle, such limitations can be addressed using a cell-based HTS approach. 11 One particularly fruitful method is based upon synthetic growth inhibition. 12 As defined genetically in yeast and bacteria, synthetic growth inhibition occurs when two nonallelic mutations, which individually cause little or no growth defect relative to the corresponding wild-type alleles, synergistically cause lethality or sickness when combined in a double mutant strain. 13 As such genetic interactions in lower eukaryotes are often evolutionarily conserved in human cells, 14 synthetic growth inhibition has been adapted to human cell HTS to identify small molecules that preferentially inhibit a particular cancer cell line but not the corresponding “wild-type” cell line. 15 Such “hits” likely recapitulate a synthetic growth defect between the target mutation and the gene product being inhibited by the small molecule.12,15
Although synthetic growth inhibition was originally studied using null alleles in nonessential genes, similar synergistic growth defects can be observed with certain combinations of non-null mutations in essential genes. 16 Some such non-null alleles that either reduce gene dosage or generate dominant negative alleles likely contribute to human disease. For example, human tumors commonly contain mutations in the genes that encode the Mcm2–7 replicative helicase; some such mutations encode altered gene products, while others alter Mcm2–7 dosage. 8 Although the contribution that such mcm alleles may make to human disease is poorly understood in most cases, a dominant negative mcm allele has been identified that causes cancer in mice (mcm4chaos3 17 ), while experimentally altering Mcm dosage in human tissue culture cells causes genome instability. 18
To both aid mechanistic studies and facilitate potential chemotherapy, novel inhibitors that target the initiation stage of DNA replication are needed. To overcome the biochemical challenges stated above, inhibitors could be identified using a cell-based HTS that utilizes a synthetic growth inhibition assay measuring differential sensitivity of mutant versus wild-type strains to small molecules. However, a general problem of synthetic growth inhibition screening is that putative hits will likely also cause detectable growth inhibition of the wild-type cell line, thus increasing the difficulty of identifying inhibitors by reducing the statistical growth difference observed between test and control strains.
Developing a better analysis pipeline for synthetic growth inhibition screening would save considerable time and money. Toward this end, we have developed a direct, nonbiased differential growth assay based upon optical density changes to identify inhibitors that target a well-characterized Mcm2 mutant (mcm2DENQ). Unlike most other mcm alleles, the mcm2DENQ allele has been extensively characterized both biochemically 19 and genetically, 20 and generates the types of genome instability that are commonly observed in human cancers. 21 To simplify development, this assay utilizes the budding yeast Saccharomyces cerevisiae, which is both the premier system for studying eukaryotic DNA replication 22 and an organism with proven tractability for use in chemogenomic screens (e.g., Lee et al. 23 ). Side-by-side comparison of an mcm2DENQ mutant to its wild-type isogenic parent is used as the criterion to identify hits during primary screening. While conducting a limited candidate screen, we identified two proof-of-concept compounds (aphidicolin and XL413) that meet our criterion and validate our screening premise. Using these candidate compounds, we compared various approaches to analyze and score differential growth of mutant and wild-type strains, and developed a sensitive multiparametric screening algorithm based on linear discriminant analysis (LDA) 24 that utilizes the entire growth kinetics of both strains. Using the LDA approach, we find that our assay meets HTS performance criteria and provides a viable analysis pipeline for the quantification of synthetic growth inhibition screening data.
Materials and Methods
Yeast Strains and Growth Conditions
Strains and plasmids used in this study are described in detail in Supplemental Materials. For assay development, we used a yeast strain in the SEY6210 background (MRY548) that contains deletions of three key multidrug transporters (MDT) genes (hereafter referred to as UPY1325 or Δ3xMDT WT; kindly provided by Scott Moye-Rowley 25 ); all other strains used were in the W303 background. 26 Strain and plasmid manipulations utilized standard methods. 27 Strains were grown in YPD (yeast peptone dextrose media) at 30 °C with agitation unless otherwise noted. To maintain the viability of strains containing deletions of the essential genes MEC1 or RAD53, a mutation of SML1, a known suppressor of this lethality, was added as indicated. 28 The sml1 mutation increases cellular deoxynucleotide triphosphate levels, and by itself lacks a noticeable growth phenotype. 28 Addition of the mcm2DENQ mutation to strain MRY548 (resulting strain UPY1355 or Δ3xMDT 2DENQ) utilized a standard two-step gene replacement approach, 27 and the presence of the mcm2DENQ mutation was confirmed by Sanger sequencing (Genewiz) following colony PCR.
Standard Microtiter Assay
Wild-type and mcm2DENQ test strains were grown as 5 mL overnight cultures in YPD. The next morning, cultures were diluted 1:25 in prewarmed YPD and growth monitored by spectrophotometric turbidity measurements at 600 nm (Abs600). Diluted cultures were regrown with shaking to log phase (Abs600 0.5–0.7) and diluted in YPD to an Abs600 of 0.1–0.15. Forty microliters of these cultures was used to seed the wells of a 384-well clear-bottom microtiter plate (Greiner 781091) using an eight-channel multipipette. To enable direct comparisons, both strains were plated on the same 384-well plate. Microtiter plates were sealed with transparent film (PerkinElmer [Waltham, MA] TopSeal-A, cat. no. 6005185), incubated at 30 °C or room temperature in an Envision plate reader (PerkinElmer) without shaking, and Abs600 read every hour for 24 h, with a 10 s shake cycle before each read.
For drug treatments, a 96-well plate with serial dilutions of test compounds in YPD containing 1.9% DMSO was prepared, and 15 µL of the resulting solution transferred in duplicate to cells using a Biomek 2000 liquid handler (Beckman Coulter, Indianapolis, IN) to yield 10-point, twofold gradients of test agents in quadruplicate and 32 wells of vehicle controls (final [DMSO] = 0.5%). Unless otherwise noted, the Abs600 at the time of plating (t = 0) was subtracted from each well read, and background corrected values were divided by the Abs600 of the respective strain grown in YPD with vehicle only to calculate percent of control = (Abs600(well) – Abs600(well at t=0))/mean(Abs600(vehicle controls) – Abs600(vehicle controls at t=0))*100. In some cases, data were plotted as percent growth inhibition = 100 – (percent of control). Quadruplicate wells of each time point and treatment concentration were averaged, and the results were plotted (mean ± SD unless otherwise noted) as a function of incubation time or drug concentration, as appropriate.
Analysis of Yeast Growth Curves by Fitting to a Modified Gompertz Equation
Growth kinetics were analyzed by a modified Gompertz equation 29 to calculate maximum cell expansion (A), slope (µ), and lag time (λ). Because the Gompertz equation uses a logarithmic scale for cell expansion, well normalization was performed as ln(Abs600(well)/Abs600(well at t=0)).
Multivariate Analysis
Performance of HTS assays is typically judged by Z′ factors 30 calculated on a single assay parameter. For multiparametric assays much of the information contained in the dataset is unutilized, and single parameters, especially from inherently variable assays or assays with small assay windows, often fail to reach HTS performance (i.e., Z′ factors >0.5). We therefore adapted a statistical method (LDA) that seeks to maximize the discriminant of two classes by projecting multiple parameters to low dimensional parameters, 24 to integrate multiple readouts into the Z′ factor as previously described.31–34 We first calculated LDA values by combining the three Gompertz parameters (A, µ, and λ) from yeast growth curves, using the LDA function included in the MASS package of the R statistical software program (https://cran.r-project.org). Details of the method, together with a sample R script, are provided in Supplemental Material. Z′ factors were then calculated as described 30 using LDA values from wild-type and 2DENQ strains treated with equal concentrations of test agents (aphidicolin or XL413) as minimum (MIN) and maximum (MAX) controls, respectively. To avoid confusion in the interpretation of figures, it is important to note that (1) LDA reverses the MAX and MIN values (i.e., 2DENQ became positive and the wild type became negative), and (2) LDA values for the two classes by definition have the same values but with different signs, resulting in a (meaningless) signal-to-background (S/B) ratio of −1, which we therefore did not report.
Results
Identification of Synthetic Lethal Interactions Involving the mcm2DENQ Allele
The Mcm2–7 replicative helicase is an ATPase formed from six different and essential subunits historically numbered Mcm2 through 7. The mcm2DENQ mutation is a substitution of two acidic amino acids in the universally conserved Walker B ATPase motif of Mcm2 with their amide counterparts (DE → NQ 19 ). The corresponding yeast mutant retains good cell growth and viability, but substantially blocks activation of the S-phase replication checkpoint cascade immediately upstream of the effector kinase (Rad53 in yeast), underscoring the functional role of Mcm2–7 in this quality control cascade. 20
During our studies, we noticed that the mcm2DENQ allele causes a synthetic growth defect when combined with viable alleles of various checkpoint genes. As Mcm2 is an essential gene, our analysis used a conditional system so that the test strains can be propagated under permissive conditions, while synthetic lethal phenotypes can be scored under restrictive conditions. Toward this end, we used a plasmid-swap system (Supplemental Material). In short, the haploid test strain contains a wild-type copy of the target Mcm gene expressed from an unstable plasmid additionally containing the selectable marker URA3; this plasmid complements a recessive mutant mcm test allele (usually mcm2DENQ) that is also present in the cell. The conditional nature of the system depends upon the growth media: growth on nonselective media provides permissive conditions by supporting the presence of the wild-type Mcm plasmid, while growth on media containing 5-fluoro-orotic acid (5-FOA) provides restrictive conditions by selecting for cells that have lost the wild-type Mcm plasmid, and thus uncover the mutant mcm phenotype. Additional strains that substitute either a wild-type Mcm gene or an empty vector for the mutant test allele serve as positive or negative controls. To test synthetic lethality with the mcm2DENQ allele, additional test mutations are incorporated into the strain as indicated.
Using this system, we found that the mcm2DENQ allele demonstrates synthetic genetic interactions when combined with deletion alleles of the S-phase checkpoint genes MRC1 (= human Claspin), TOF1 (= human Timeless), CSM3 (= human Tipin), or RAD9 (human orthologs include BRCA1 and 53BP1), as well as the checkpoint kinases MEC1 (= human ATR) and RAD53 (=human CHK2) (
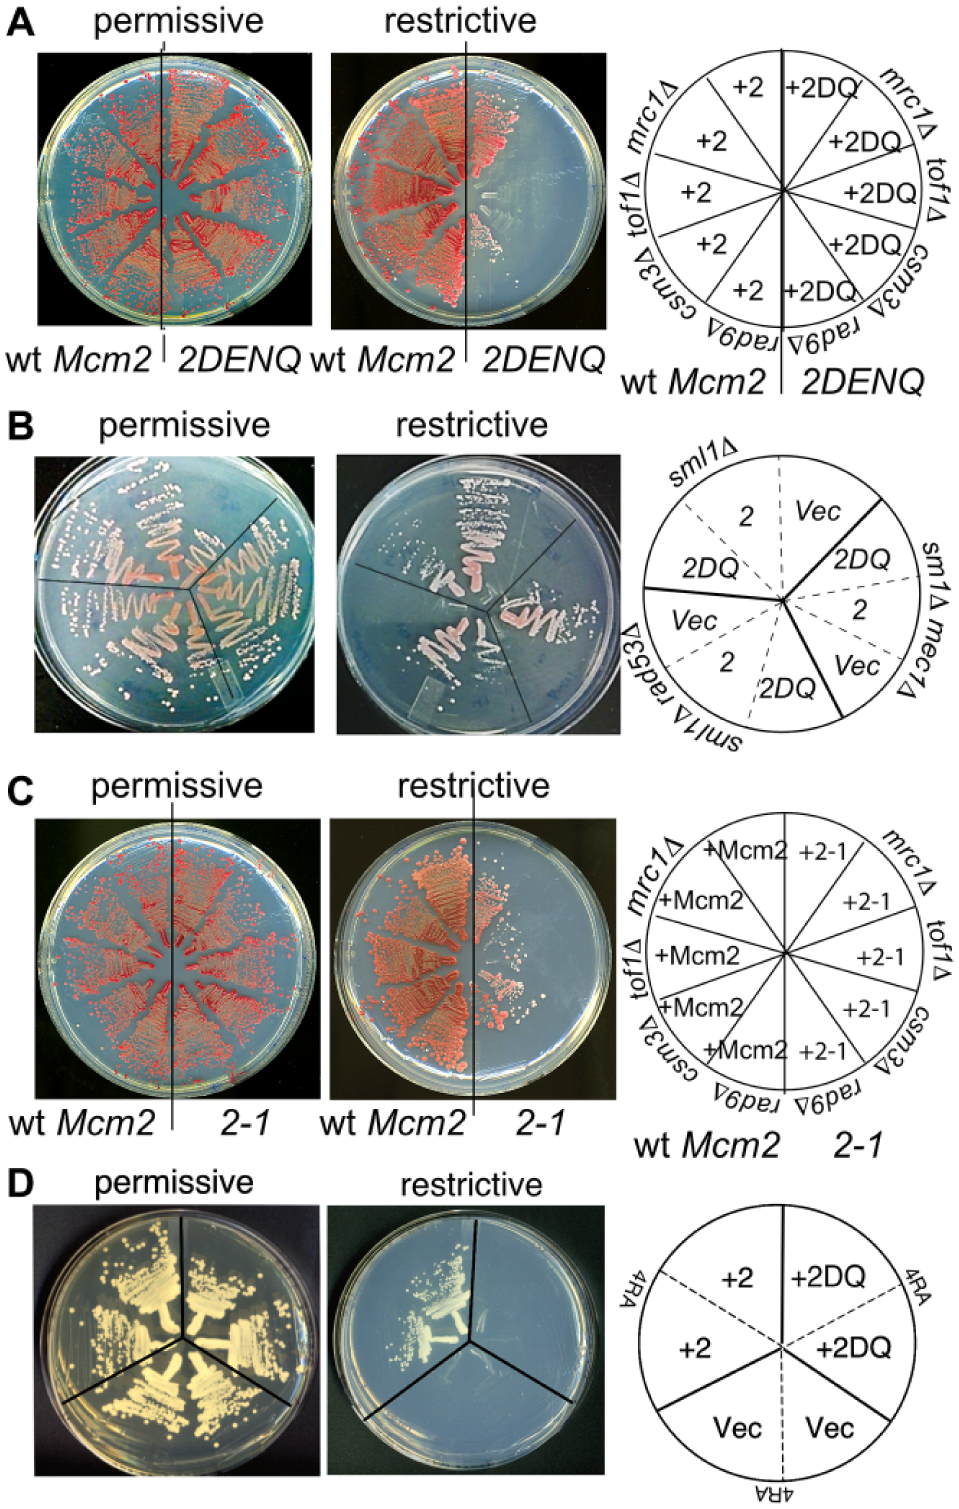
Synthetic growth defects involving mcm alleles. Permissive conditions correspond to growth on YPD, while restrictive conditions that test for synthetic growth defects correspond to growth on 5-FOA media (Supplemental Material). In the diagram that accompanies each panel, genes written on the circumference of the plate correspond to chromosomal test alleles, while the mcm alleles listed within specific plate sectors correspond to those present on the indicated TRP+ test plasmid. (
We next tested the generality of these observations by examining an additional mcm allele, mcm2-1. 36 Similar to the mcm2DENQ allele, the hypomorphic mcm2-1 allele causes synthetic sickness when combined with the previous checkpoint alleles under the restrictive condition ( Fig. 1C ).
Finally, we examined if mcm alleles in different Mcm genes can cause synthetic lethality. Using our plasmid swap system, we examined genetic interactions between the mcm2DENQ allele and the mcm4RA allele (
In summary, synthetic lethal interactions appear to be a common and general property of Mcm mutants. Below, we leverage the mcm2DENQ mutant to develop a cell-based HTS to identify small-molecule inhibitors that mimic these synthetic growth interactions, potentially providing an avenue to identify novel replication checkpoint inhibitors or inhibitors of the Mcm complex.
Assay Design and Validation
First, we built appropriate test strains. In addition to their cell wall, yeast contain an unusually large number of MDTs, making them naturally resistant to many small molecules. 38 We found that a strain deleted for three specific MDT genes (PDR5, YOR1, SNQ2) is sensitive to an inhibitor identified in our prior low-throughput screen (ciprofloxacin), as well as a large variety of other small molecules. 25 The mcm2DENQ mutation was added to this triple transporter-defective strain. These two strains differ only in the absence (Δ3xMDT WT, UPY1325) or presence of the mcm2DENQ allele (Δ3xMDT 2DENQ, UPY1355) and, unless explicitly stated, served as our test strains for the following experiments.
Next, we used Abs600 as a measure of cell growth to adapt our genetic synthetic growth inhibition assay into a 384-well format suitable for HTS. To determine the relationship between culture density and optical absorbance, liquid cultures were diluted to the desired density, and parallel Abs600 readings from a spectrophotometer and a plate reader were compared. Absorbance measurements performed in cuvettes were linear up to Abs600 = 0.5 (corrected for media background) and correlated with absorbance measurements in 384-well plates (
Because yeast growth and survival in liquid culture are sensitive to changes in environmental conditions,
39
we next established the growth characteristics of these strains. Strains were seeded at different starting densities (10 wells per condition) and incubated at 30 °C. Abs600 was recorded at the start of the experiment (t = 0) and at every hour for 24 h (t = 24). As expected, lag time varied with seeding density. When plated at higher starting densities, the mcm2DENQ strain showed a slightly longer lag phase than the wild-type strain; however, at low seeding densities (Abs600 0.1), both strains demonstrated nearly identical growth kinetics and reached identical densities at stationary phase (
We next ascertained uniform cell expansion by comparing Abs600 changes of two full 384-well microplates containing the wild-type and mcm2DENQ strains in alternating rows. These plates were kept at 30 °C in the PerkinElmer Envision multilabel reader, or alternatively in a cell culture incubator and read manually at multiple time points over 24 h. In both cases, cell expansion was uniform across the plate (
Identifying Model Compounds
To both validate our screening approach and develop an appropriate analysis platform, we required a positive control compound that specifically inhibits the mcm2DENQ strain relative to the wild-type strain. Previous results indicated that the mcm2DENQ strain is hypersensitive to the ribonucleotide reductase inhibitor hydroxyurea (HU). 20 Surprisingly, although we found that HU on agar plates caused demonstrable growth defects in the mcm2DENQ strain relative to the corresponding wild-type strain, in liquid culture we were unable to statistically recapitulate this defect ( Fig. 2 ).
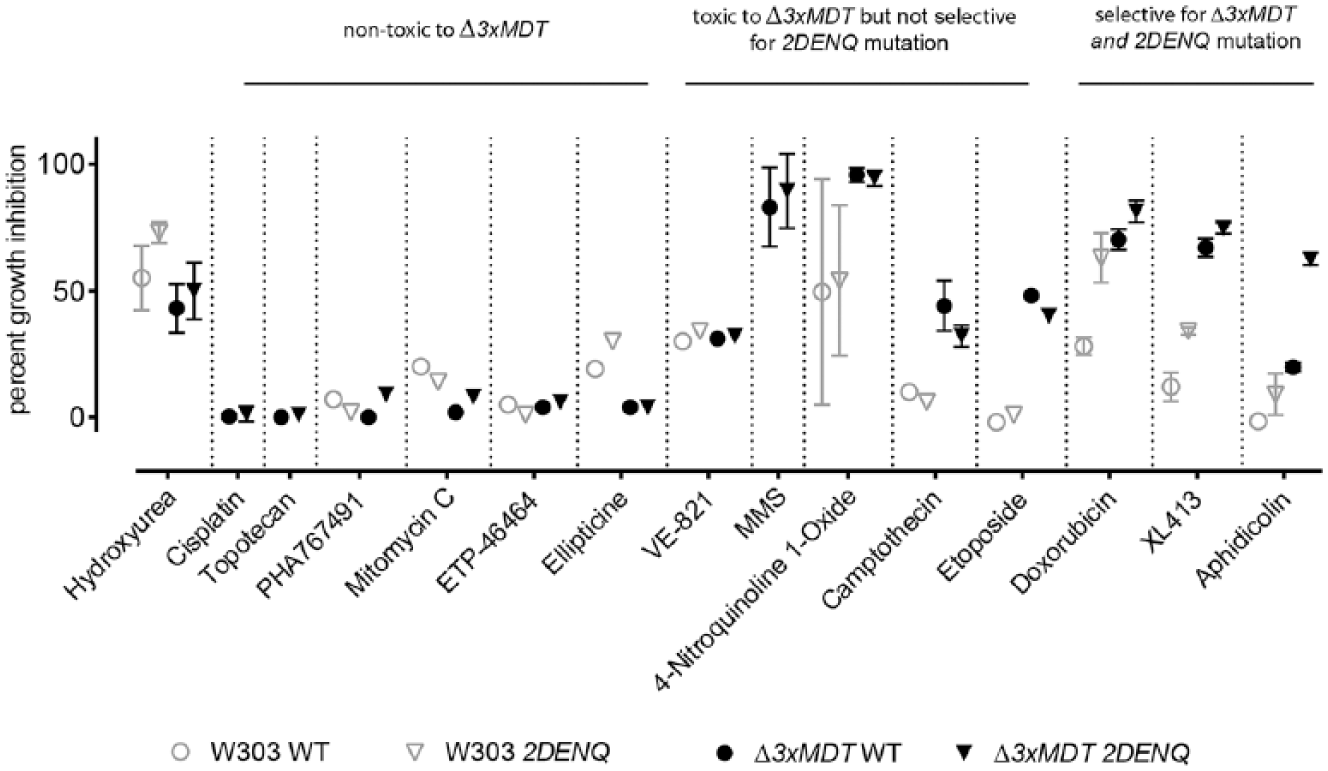
Growth inhibition of selected agents against wild-type and mcm2DENQ strains in MDT-replete (W303) and MDT-deleted (Δ3xMDT) strain backgrounds. For assay trials, compounds were dissolved in DMSO (with the exception of HU and XL413, which were dissolved directly in YPD, and cisplatin, which was dissolved in 0.9% saline) and diluted into YPD to their maximal solubility. Ten-point, twofold concentration gradients were generated by serial dilution into YPD containing 1.9% DMSO, and transferred with a Biomek 2000 liquid handler to assay plates containing an optimized starting density of cells (inhibitor assay concentrations are shown in Suppl. Table S1). The Y axis shows percent growth inhibition as defined in Materials and Methods using background subtracted Abs600 values relative to cells that received vehicle only. All data points were at the highest concentration of compound tested (with the exception of 4-nitroquinoline 1-oxide, which is shown at its IC90 [5 µM], and doxorubicin, which interfered with Abs600 readings and was tested at the highest concentration that did not cause assay interference [150 µM]). Each data point is the average ± SD of one to seven independent experiments, performed in quadruplicate.
We therefore acquired and tested a panel of small molecules that either cause specific types of DNA damage or inhibit known replication or checkpoint proteins (
This prescreen yielded some important insights into the susceptibility of MDT-deleted yeast to small molecules and their ability to selectively inhibit growth of mcm2DENQ strains. Many compounds lacked apparent toxicity in either strain background, consistent with the known resistance of yeast to small molecules ( Fig. 2 ). For compounds that did show activity, there appeared to be a trend to higher potency in the Δ3xMDT background ( Fig. 2 ; compare open gray symbols with closed black symbols), supporting our rationale to use MDT deletions to increase hit rates during HTS. 25 Two agents were toxic but neither selective for the Δ3xMDT background nor the mcm2DENQ mutation (methyl methane sulfonate [MMS] and 4-nitroquinoline 1-oxide), and another two compounds (camptothecin and etoposide) showed selectivity for the Δ3xMDT background but not the mcm2DENQ mutation.
However, three agents (doxorubicin, aphidicolin, and XL413) satisfied our criterion for a synthetic growth defect hit; they selectively inhibited the Δ3xMDT 2DENQ strain relative to the wild-type control ( Fig. 2 ). Each of these compounds targets specific replication factors that either are needed for Mcm2–7 activation (XL413 targets the DNA-dependent kinase Cdc75,7), physically interact with Mcm2–7 (aphidicolin inhibits DNA polymerase alpha2,40), or are specifically needed for replication fork progression (doxorubicin inhibits DNA topoisomerase II probably through DNA intercalation 22 ), suggesting that these inhibitors uncovered additional, previously unknown, synthetic growth defects involving the mcm2DENQ allele. In addition, the observed differential growth inhibition was not unique to the particular lot of chemicals, as identical results were obtained using doxorubicin, aphidicolin, and XL413 from alternate sources.
Optimizing Assay Conditions by Using the Kinetics of Aphidicolin and XL413 Growth Inhibition
Because at the two highest concentrations doxorubicin’s red color interfered with turbidity measurements at Abs600 (making the compound appear less potent; data not shown), we used aphidicolin and XL413 to establish conditions that maximize the difference between the MDT-deficient wild-type and mcm2DENQ strains.
To optimize assay windows, we first examined the kinetics of cell growth inhibition ( Fig. 3A ). Qualitatively, cell growth differences between the two drugs were readily apparent. Aphidicolin appeared to elicit a more sustained growth-inhibitory effect, whereas XL413 was more transient. Furthermore, the synthetic growth defects by XL413 occurred over a narrower time window compared with aphidicolin ( Fig. 3B ). Dose–response determinations indicated that drug effects were most pronounced during active growth ( Fig. 3B ); at both early (6 h, early logarithmic growth) and late (24 h, stationary phase) time points, overall toxicity as well as differences between the two strains were low. For these compounds, we found an apparent optimum assay window around 14 h after the start of the experiment, with an experimentally usable window extending from 12 to 18 h.
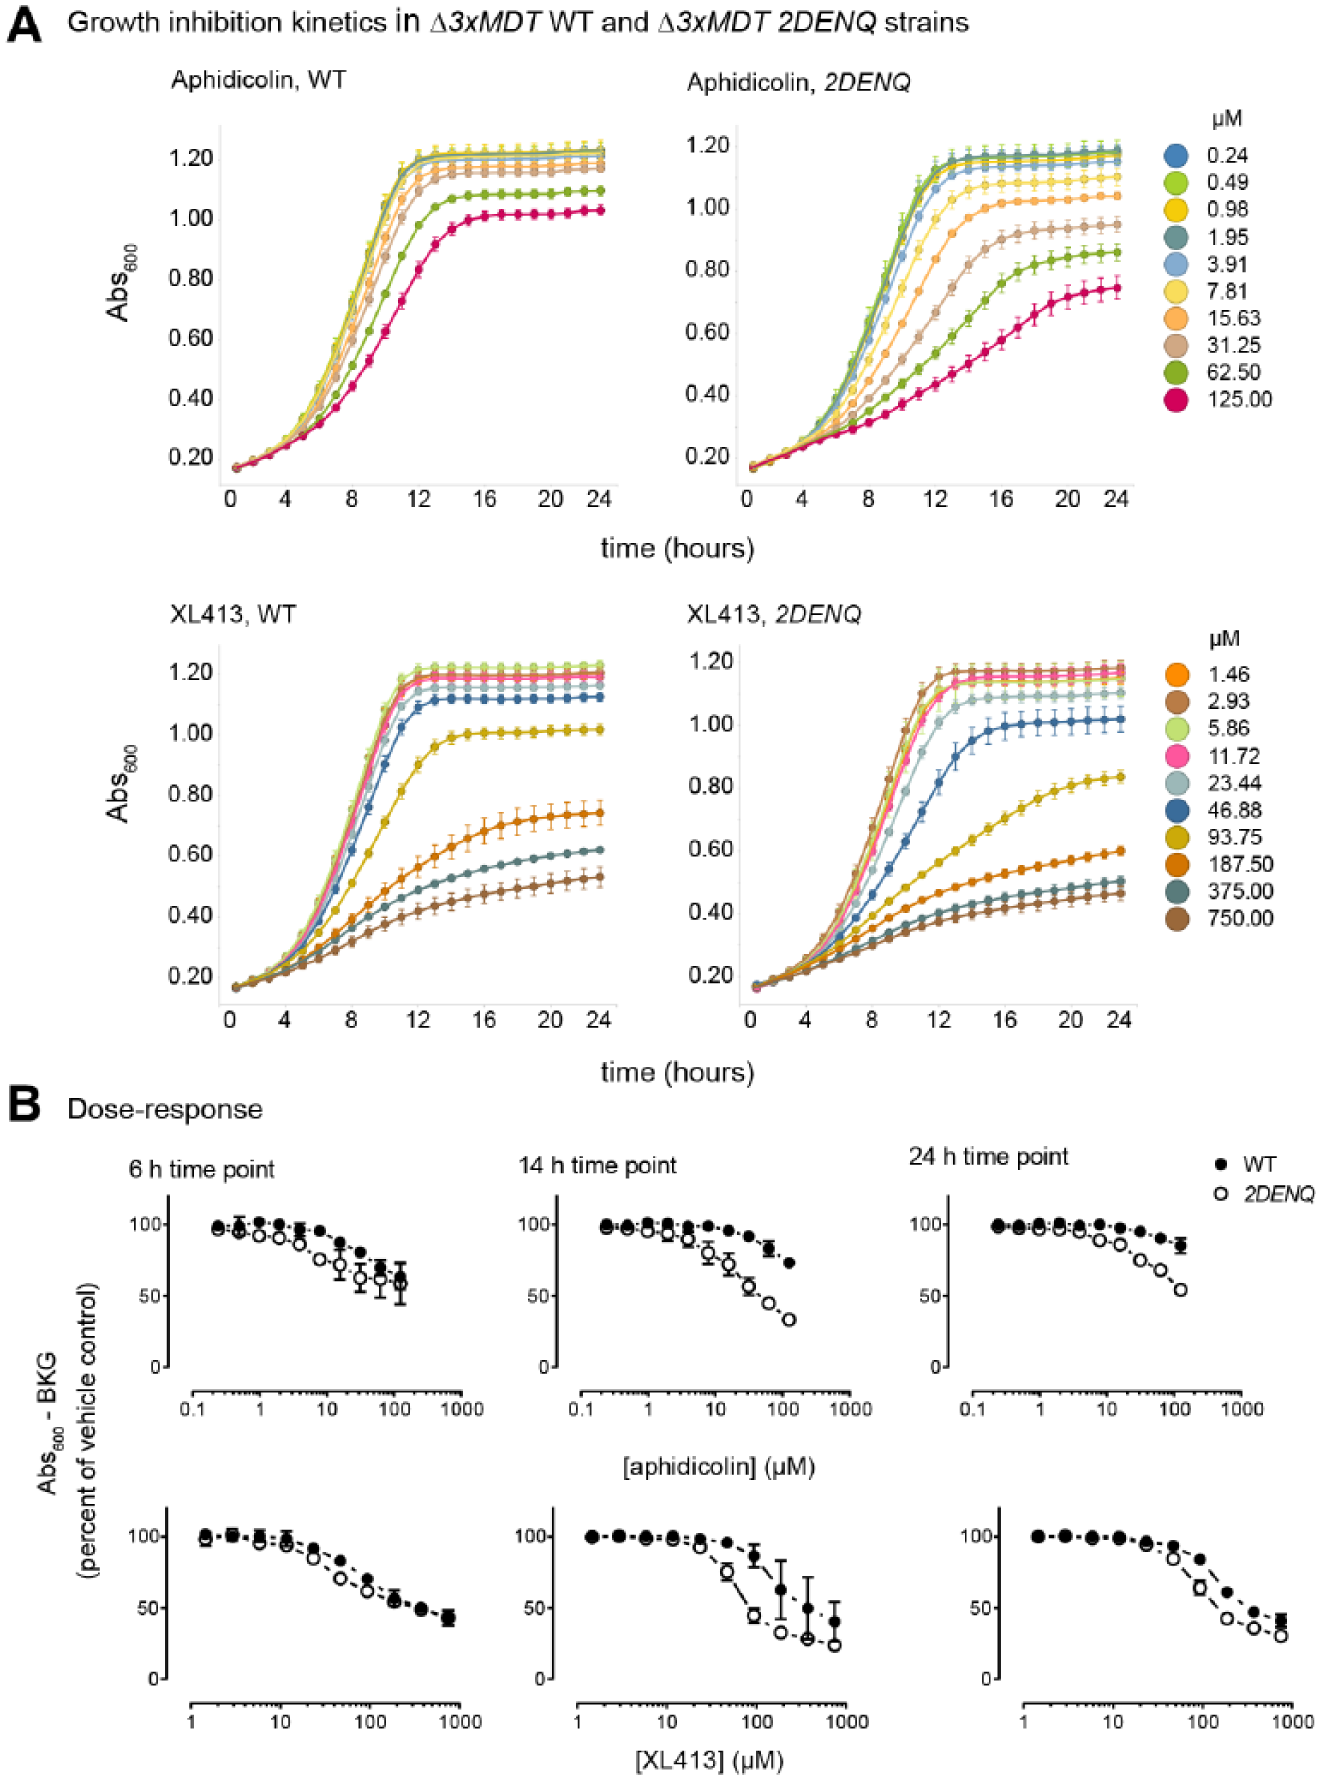
Synthetic growth inhibition by small molecules is concentration and time dependent. UPY1325 (∆3xMDT WT) and UPY1355 (∆3xMDT 2DENQ) cells were treated in 384-well plates with 10-point, twofold concentration gradients of aphidicolin or XL413, and absorbance was measured every hour for 24 h. (
We next examined the effect of incubation temperature on growth inhibition. Although it was convenient to incubate single plates in the plate reader during assay development, this strategy poorly accommodates the handling of multiple plates needed during actual library screening. Thus, we repeated our assay in the presence of various concentrations of aphidicolin and incubated the plate at room temperature (i.e., ~24 °C). Although room temperature incubation slightly retarded the rate of strain growth, comparison of these results to those collected at 30 °C revealed little or no difference on either final cell densities or compound potency at the 14 h time point (
Developing a Robust Analysis Platform to Achieve HTS Assay Performance
As our results indicate, growth inhibition with aphidicolin and XL413 is not an “all-or-nothing” situation that occurs at a specific time point, but rather is best observed when the entire growth kinetics of the assay is considered. Thus, although the 14 h time point reproducibly demonstrated the maximal growth difference between the wild-type and mcm2DENQ strains under our test conditions, it is unclear if other hits observed during actual screening will demonstrate either identical kinetics or comparable levels of growth inhibition. To increase assay sensitivity, reproducibility, and ability to accommodate phenotypic variation among different potential inhibitors, we developed an analysis platform that would capture the complete growth kinetics of the experiment.
To develop this multiparametric approach, we note that the growth kinetics of single-celled organisms can be described by three parameters (illustrated in Fig. 4A ): maximal cell expansion (A; defined as the asymptote to the maximal Abs600 reached at stationary phase), maximum rate of expansion (µ; defined as the tangent to the inflection point of the growth curve), and lag time (λ; the time it takes for the culture to enter logarithmic growth, defined by the X axis intersect of the tangent to the inflection point). To calculate these three parameters, we fitted our growth data to a modified Gompertz equation 29 ( Fig. 4A ). To acquire enough data points to derive meaningful performance statistics (i.e., Z′ factors 30 ), we seeded half of the wells on a 384-well plate with 3× Δ3xMDT WT and the other half with Δ3xMDT 2DENQ. All wells were treated with aphidicolin (125 µM), grown at room temperature, and Abs600 changes were recorded over time.
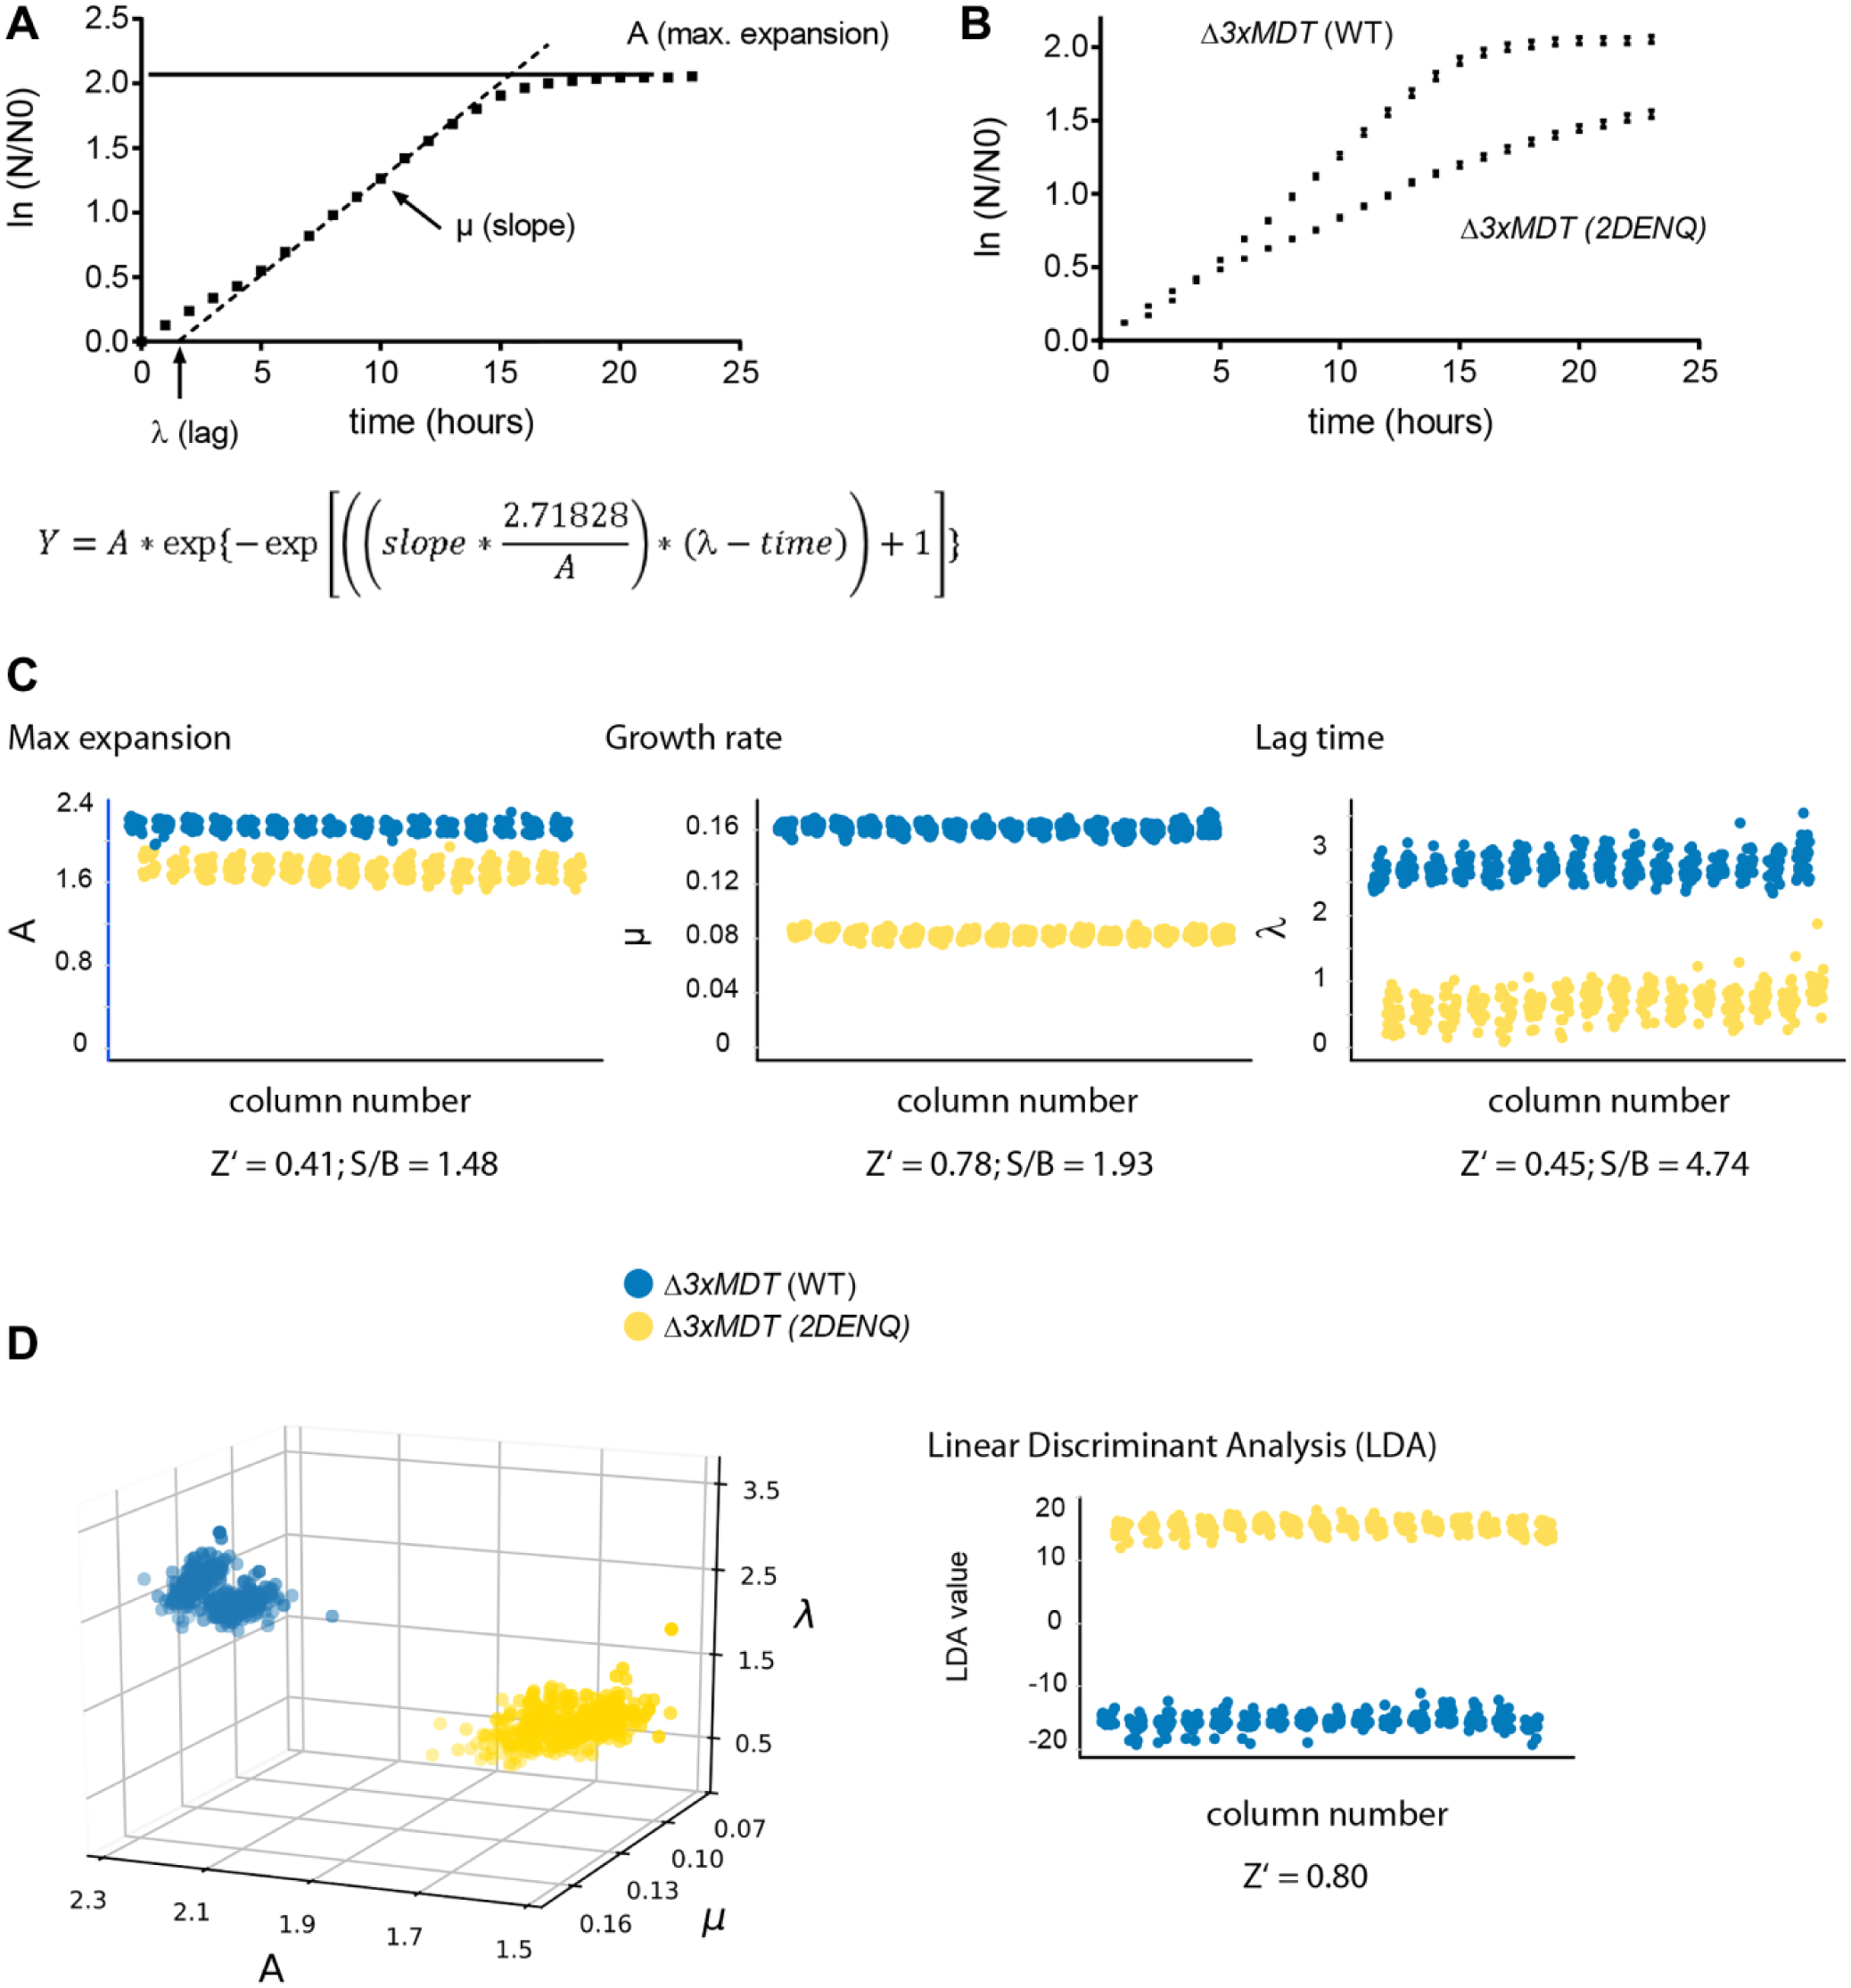
Quantitatively capturing growth kinetics of compound-treated wild-type and mcm2DENQ mutant strains. (
We used the resulting growth curves to derive λ, µ, and A. Visually, the data showed that aphidicolin both slowed the expansion rate of the 3xMDT 2DENQ strain relative to the wild-type strain and prevented cultures from reaching maximum density ( Fig. 4B ). Surprisingly, using the Z′ criterion, 30 all three calculated parameters approached an acceptable screening threshold ( Fig. 4C ). The best separation between the wild-type and mcm2DENQ strains was obtained with the slope parameter µ (Z′ = 0.78). However, the S/B ratio was small (<2-fold), indicating that basing our analysis completely upon µ would make the assay susceptible to changes in well-to-well variability. 30 Similarly, both λ and A had shortcomings: Z′ factors were below 0.5, and the S/B ratio for A was very small ( Fig. 4C ).
While each single parameter provided some degree of separation between wild-type and 2DENQ strains, separation was visually improved when plotting data in three dimensions ( Fig. 4D ). We thus reasoned that combining the three Gompertz parameters into a single criterion would improve both the screening statistics and our ability to discriminate phenotypically diverse hits. Previous attempts to improve assay performance in systems with high inherent variability (i.e., transgenic zebrafish 33 or cell-based high-content analysis31,32,34) used LDA, 24 a multivariate method that maximizes the separation of data populations into two predefined classes 24 (e.g., wild-type vs mcm2DENQ cells). We therefore applied LDA to the three parameters from the Gompertz equation and found that LDA considerably improved the statistical sensitivity of our analysis as judged by an improved Z′ over the most robust single parameter (µ) and a visually increased separation between the means of wild-type and 2DENQ growth compared with any single parameter ( Fig. 4D ).
Extending the Range of Detectable Growth Inhibition with LDA
To examine how well our LDA analysis platform works with less robust inhibition, we extended our analysis using three different concentrations of XL413. At low concentrations (30 µM), the rate of expansion provided the most informative difference between the two test strains; however, both strains recovered to a nearly similar final density ( Fig. 5A ). Consequently, the slope parameter with this drug concentration robustly distinguished wild-type from mcm2DENQ (Z′ = 0.72), whereas lag time and final density did not (Z′ < 0) ( Fig. 5B ). However, at an XL413 concentration of 100 µM, both rate of expansion and final density were significantly different, and each single parameter approached or surpassed HTS criteria. Finally, at the highest concentration of XL413 tested (300 µM) assay performance declined because of increased toxicity to the wild-type strain; as a result, no single parameter achieved HTS performance ( Fig. 5B ).
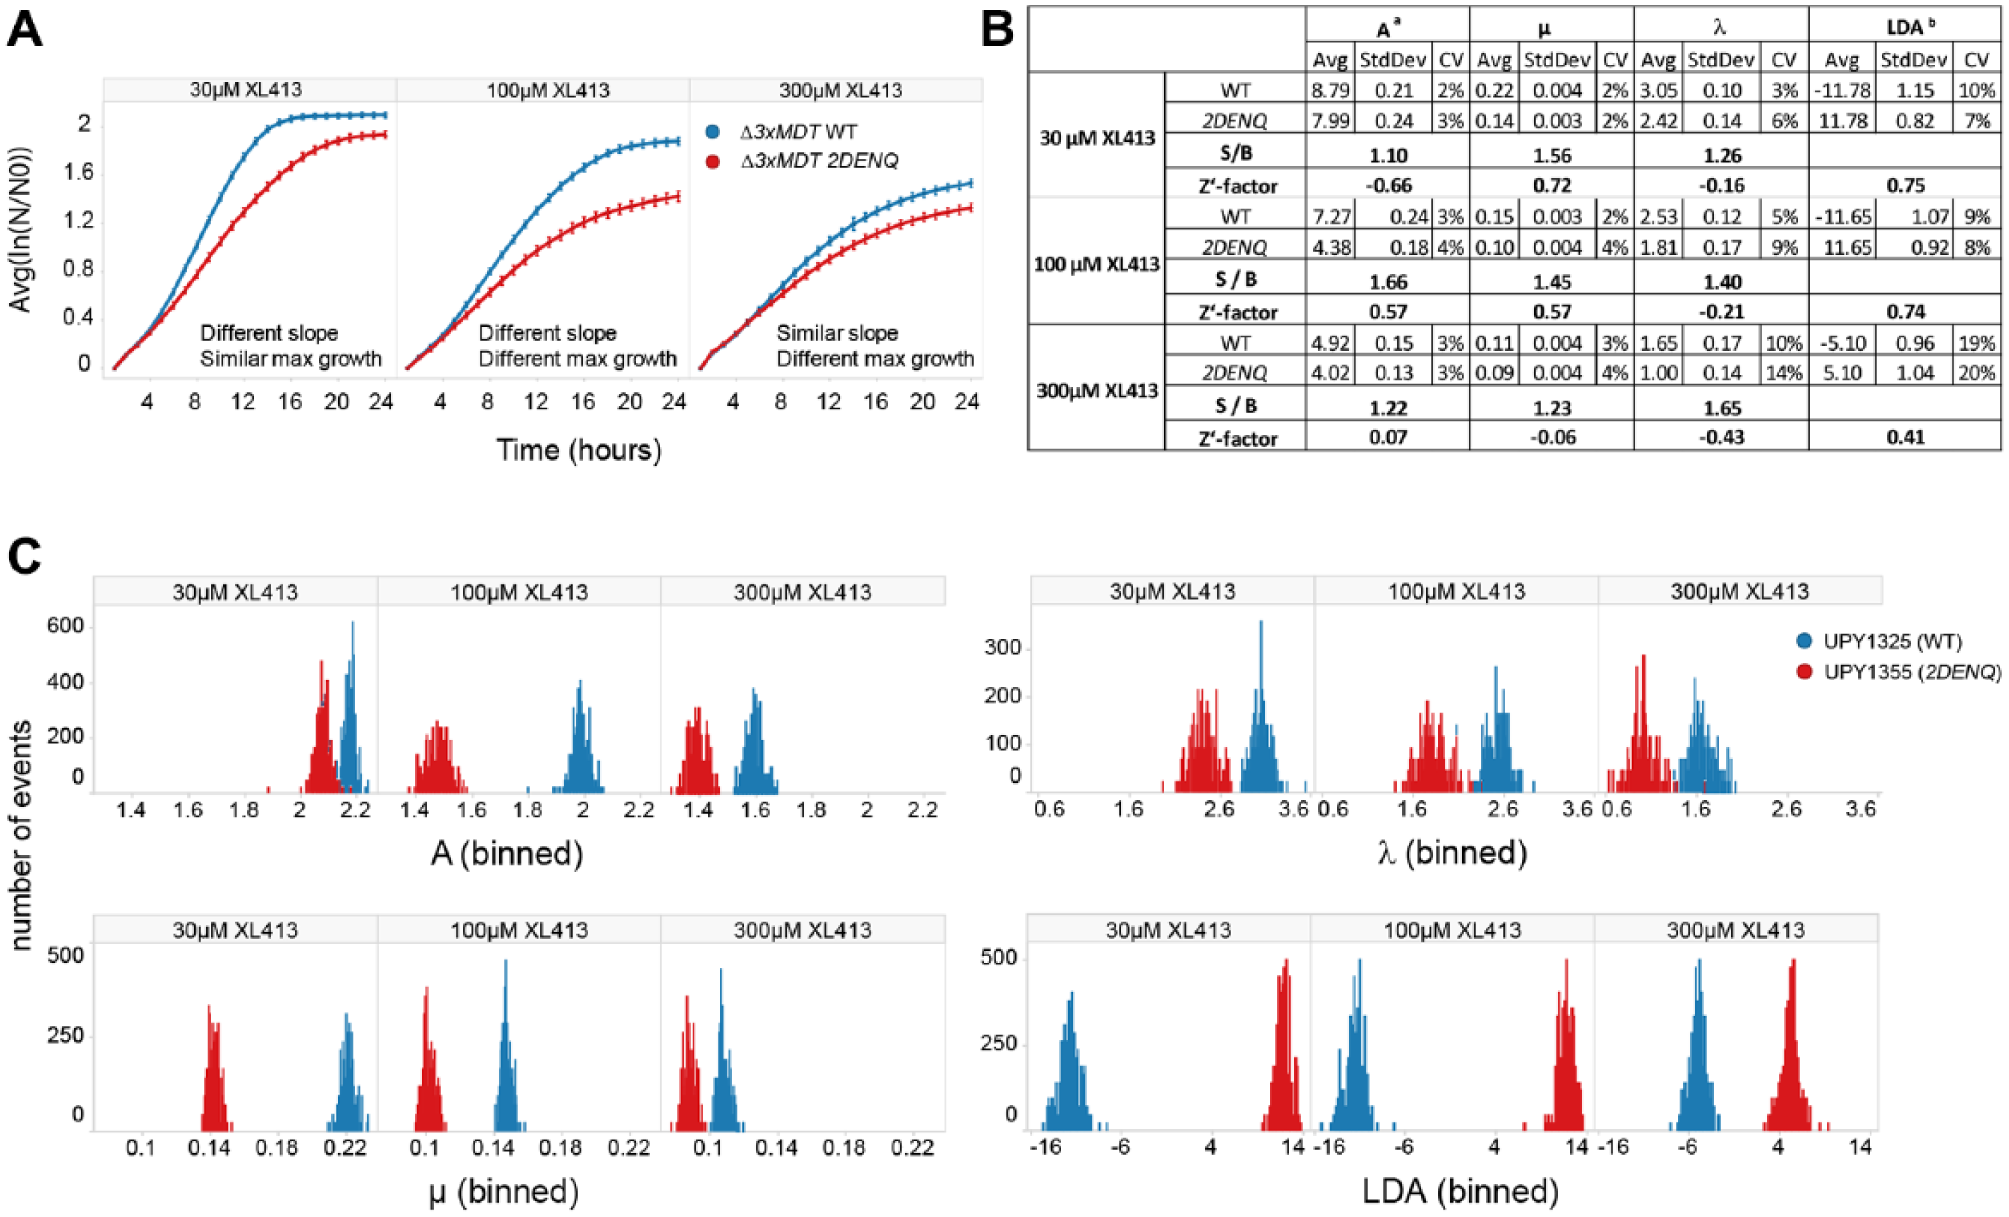
LDA extends the range of detectable growth-inhibitory phenotypes. (
We next applied LDA to these results and found that it substantially improved the ability to quantify XL413 growth inhibition. At the highest XL413 concentration (300 µM), where no single growth parameter was useful for screening purposes (Z′ ranging from –0.3 to 0.07), LDA elevated the assay into screenable range (Z′ = 0.41). 30 At the intermediate XL413 concentration (100 µM), LDA considerably improved Z′ (0.57–0.72). At the lowest concentration, where one single parameter (µ) already provided robust separation of wild-type versus 2DENQ growth, LDA led to a minor improvement in Z′ (0.80 compared with 0.78 using µ alone). These results can be readily visualized using histograms of well populations, which illustrate the magnitude of separation between the two strains for the four parameters at the various concentrations of XL413, with LDA being superior to even the best single parameter ( Fig. 5C ).
Discussion
Our results support the feasibility of using a cell-based approach and an informative mcm allele to identify novel DNA replication inhibitors; our pilot screen has identified previously unknown inhibitors of the mcm2DENQ mutant, and these inhibitors have led to the development and statistical validation of a novel HTS. As discussed further below, these results support our premise that such screens will lead to the identification of inhibitors that specifically target cells engaged in pathological forms of DNA replication. Such inhibitors would be expected to be especially useful in the treatment of various proliferative diseases such as cancer.
Using Synthetic Growth Defects to Isolate DNA Replication Inhibitors
We found that cells carrying the mcm2DENQ allele were differentially sensitive to an inhibitor of DNA polymerase alpha (aphidicolin 41 ) and the DNA-dependent replication kinase CDC7/DBF4 5 ( Fig. 3 ). Recently, a synthetic growth defect was observed between the mcm2-1 and cdc7-1 alleles, 16 an observation that independently supports and validates our observations with XL413 (an inhibitor of CDC7). In contrast, our observation of aphidicolin sensitivity has potentially identified a new synthetic interaction between DNA polymerase alpha and the mcm2DENQ allele. Both compounds primarily inhibit the enzymatic activities of these replication factors rather than functioning as DNA damage agents. The results suggest that our screen can identify enzymatic inhibitors rather than compounds that cause apparent synthetic growth defects by generating DNA damage.
The targets identified in our pilot screen (CDC7 and DNA polymerase alpha) may represent the proverbial tip of the iceberg. A recent high-throughput genetic interaction study utilizing the mcm2-1 allele broadly confirms our observed mcm2DENQ synthetic growth defects ( Fig. 1 ), but additionally demonstrates that the mcm2-1 mutant has synthetic growth interactions with several hundred additional genes 16 (http://thecellmap.org/tabular/?n=876). The strongest among these interactions include conditional or hypomorphic alleles of a large number of replication initiation factors that are known to physically interact (e.g., alleles of ORC, CDC45, Mcm2–7, CDC7/DBF4, GINS complex, CDC6, and CDT1). Thus, future inhibitors identified using our mcm2DENQ HTS might be expected to specifically target a broad range of replication initiation factors.
Overcoming Challenges in Synthetic Growth Inhibition HTSs
Phenotypic HTS for compounds that cause synthetic growth defects requires measuring differential growth inhibition in two matched cell lines. This differential can vary substantially depending on the biological system under investigation, leading to small and variable assay windows, which are undesirable for large-scale HTS. 30 Therefore, a screening paradigm is often chosen that measures growth inhibition of the more sensitive cell line in the presence and absence of a putative inhibitor. Hits that emerge from such a screen are then rescreened in both the wild-type and test strains at a variety of concentrations to obtain IC50 values; these values are subsequently used to eliminate compounds that cause nonspecific growth inhibition from those that are truly specific for the initial screening goal. This strategy maximizes Z′ factors because it is easy to distinguish the growth of treated and untreated cells, but has scientific and logistic shortcomings. First, inhibition of growth of a single cell line is not a relevant positive control as it is the differential between wild-type and mutant cells that defines synthetic lethality. Second, this paradigm results in a large number of false positives as not all compounds that inhibit the mutant strain will also show differential growth inhibition, and these will only be detected in secondary assays. These secondary screens are costly, in terms of both time and the expense of purchasing fresh samples of a large number of nonselective inhibitors. The data from our small prescreen with DNA-damaging agents show that of the 15 agents assayed, 8 inhibited the growth to the 2DENQ mutant, but only 3 showed differential inhibition of the wild type versus mutant, a false-positive rate of 63% ( Fig. 2 ).
Toward reducing the burden of extensive secondary screens to eliminate large numbers of uninformative compounds, we designed our assay to directly compare growth inhibition of the test strain (e.g., containing the mcm2DENQ mutation) with the control parental strain (e.g., wild type). However, although this criterion reduces the number of false positives, it also narrows the usable screening window of the assay, as the growth of both strains will likely be inhibited to at least some extent. False negatives could also be a problem because HTS is usually limited to a single concentration of compounds and growth inhibition is measured at a fixed endpoint, potentially missing agents with desirable characteristics that may not show optimal differential activity at the concentrations and times chosen for the screen.
To overcome both of these obstacles, we acquired full growth curves and performed LDA
24
to combine the three kinetic parameters A, µ, and λ, which collectively describe the growth kinetics of single-celled organisms (
Fig. 4A
), into a single parameter, the LDA value. As expected from prior work by others31,32,34 and our recent zebrafish HTS,
33
using LDA values to calculate Z′ factors substantially improved assay performance compared with each single parameter (
Much more important than an increase of HTS assay robustness, however, is the fact that LDA does not just increase Z′ factors, which are an accepted measure of assay robustness, but are based on positive controls that may or may not reflect the range of compound behaviors in a screening library. The biggest advantage of LDA is its ability to capture growth-inhibitory phenotypes not detected by any single parameter alone ( Table 1 ). For example, the maximum expansion parameter might detect conditions where growth inhibition is sustained and results in lower cell densities at the end of the experiment. The slope parameter might detect sustained growth inhibition, but not necessarily delayed growth if the culture fully recovers over time. Measurements of lag time are based on the linear portion of the growth curve during the log phase. They are therefore sensitive to changes in slope, and might even be falsely detected as smaller than control if the slope is shallow; in fact, the dependence of lag time measurements on the shape of the growth curve is probably the reason why in our experiments λ was consistently the lowest-performing parameter. Of the four parameters, only LDA can capture all growth-inhibitory phenotypes regardless of growth kinetics. From a screening perspective, this feature of LDA is especially important as in HTS there is no a priori knowledge of a compound’s potency and temporal characteristics, and compounds that do not show optimal synthetic growth inhibition at the single concentration or time point typically used in HTS would be missed. Thus, LDA is expected to extend the detectable range of synthetic growth-inhibitory phenotypes, leading to a more efficient exploration of chemical space compared with single parameters. Whether LDA will prove to be the best analysis tool to detect positives in compound screens remains to be seen; to the best of our knowledge, the method has been applied only to assay development because it maximizes the difference between known classes (MIN and MAX), but it is not clear how well diverse compounds will conform to the criteria set by the positive and negative controls. In this regard, principal component analysis (PCA) might be a viable alternative as it does not include the group information. Once compound screening data are available, it will be interesting to compare alternative multivariate methods such as PCA or the kernel-based discriminant analysis for datasets with nonlinear structure. 34
Possible Growth Inhibition Phenotypes and Ability to Detect Them during HTS.
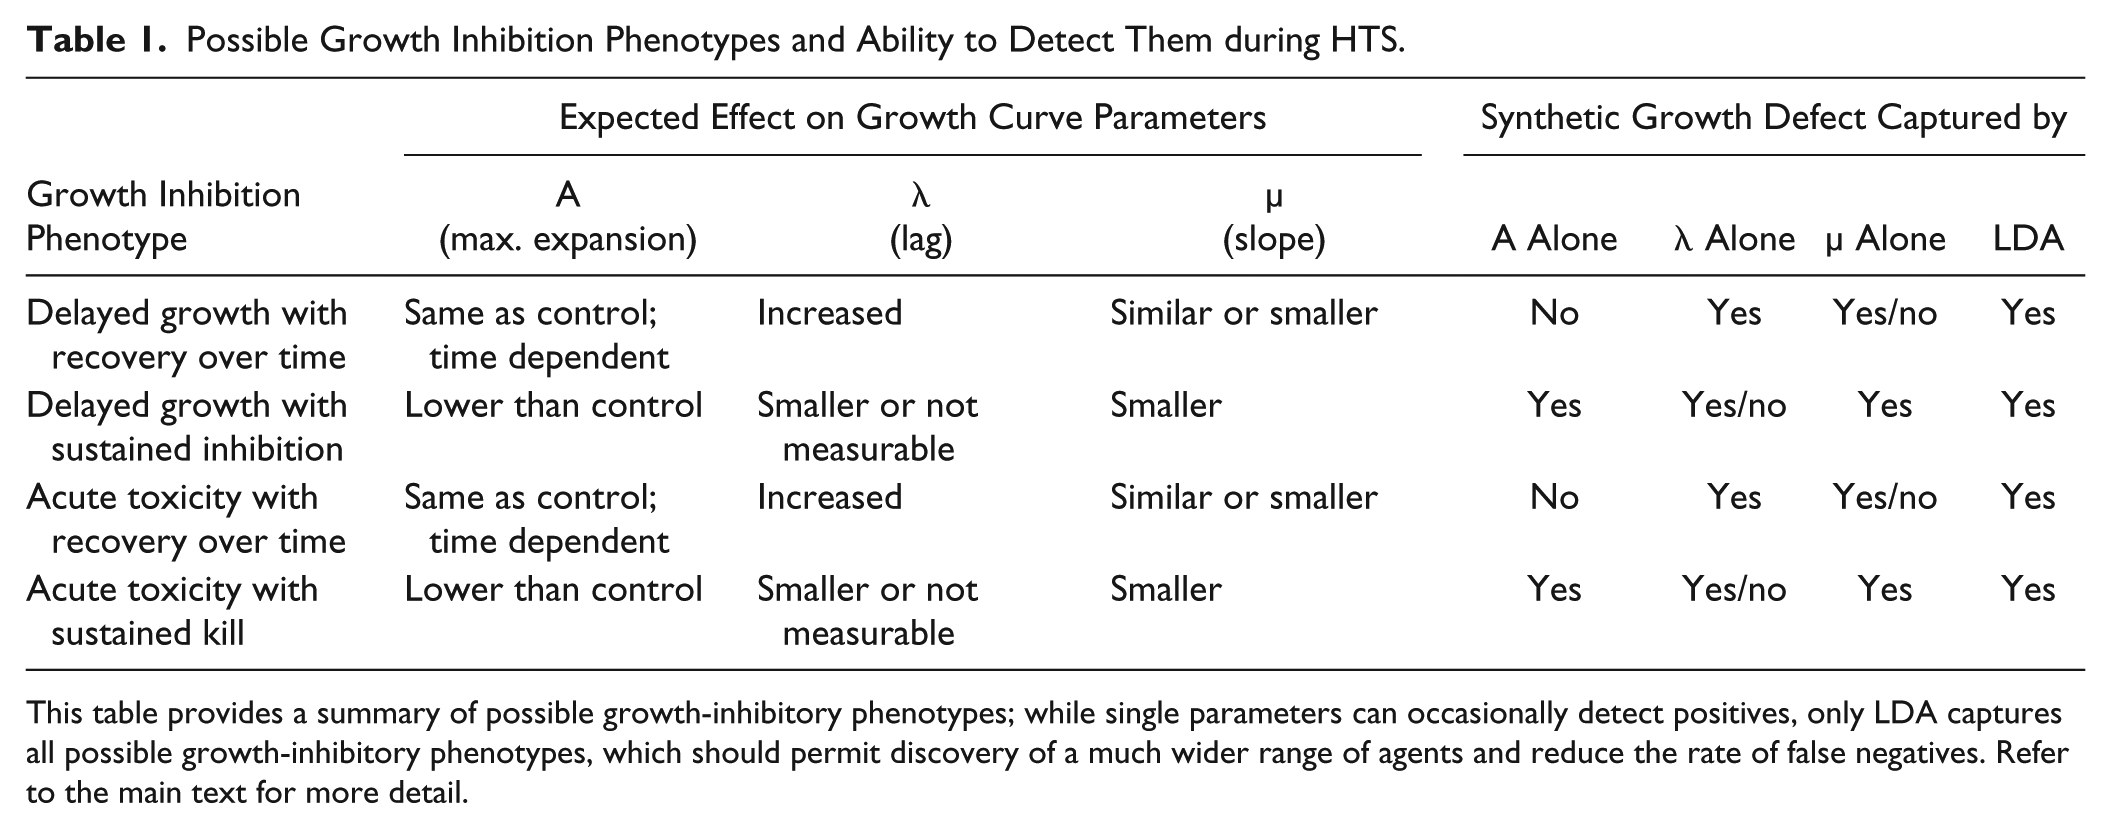
This table provides a summary of possible growth-inhibitory phenotypes; while single parameters can occasionally detect positives, only LDA captures all possible growth-inhibitory phenotypes, which should permit discovery of a much wider range of agents and reduce the rate of false negatives. Refer to the main text for more detail.
In summary, we have developed a robust, HTS-compatible assay and analysis platform to identify compounds that cause synthetic growth defects in yeast. Because the analysis is applicable to any assay measuring cell growth, it has the potential to significantly impact not only the field of DNA replication, but also the discovery of antibacterials, antifungals, and novel targets in various biologies through chemical probe development. The two agents that emerged from our limited prescreen already suggest two novel, previously unappreciated modulators of Mcm2–7 activity, and we posit that HTS is bound to uncover many more.
Supplemental Material
SUPPLEMENTAL_MATERIAL_final_R1 – Supplemental material for A High-Throughput Assay for DNA Replication Inhibitors Based upon Multivariate Analysis of Yeast Growth Kinetics
Supplemental material, SUPPLEMENTAL_MATERIAL_final_R1 for A High-Throughput Assay for DNA Replication Inhibitors Based upon Multivariate Analysis of Yeast Growth Kinetics by Marilyn Ngo, Nick Wechter, Emily Tsai, Tong Ying Shun, Albert Gough, Mark E. Schurdak, Anthony Schwacha and Andreas Vogt in SLAS Discovery
Footnotes
Acknowledgements
We thank Tamara Williams and Harold Takyi for technical assistance, Dr. David Koes for creating the three-dimensional plot and helpful discussions, and the Developmental Therapeutics Program at the National Cancer Institute for samples of DNA-damaging agents.
Supplemental material is available online with this article.
Declaration of Conflicting Interests
The authors declared no potential conflicts of interest with respect to the research, authorship, and/or publication of this article.
Funding
The authors disclosed receipt of the following financial support for the research, authorship, and/or publication of this article: This work was supported by NIH grants 1RO1GM114336-01A1 and 1RO1GM83985-01A1 to A.S. and used the Hillman Cancer Center Chemical Biology Facility, which is supported in part by award P30CA047904.
References
Supplementary Material
Please find the following supplemental material available below.
For Open Access articles published under a Creative Commons License, all supplemental material carries the same license as the article it is associated with.
For non-Open Access articles published, all supplemental material carries a non-exclusive license, and permission requests for re-use of supplemental material or any part of supplemental material shall be sent directly to the copyright owner as specified in the copyright notice associated with the article.