
Abstract
Mode of action (MoA) identification of bioactive compounds is very often a challenging and time-consuming task. We used a label-free kinetic profiling method based on an impedance readout to monitor the time-dependent cellular response profiles for the interaction of bioactive natural products and other small molecules with mammalian cells. Such approaches have been rarely used so far due to the lack of data mining tools to properly capture the characteristics of the impedance curves. We developed a data analysis pipeline for the xCELLigence Real-Time Cell Analysis detection platform to process the data, assess and score their reproducibility, and provide rank-based MoA predictions for a reference set of 60 bioactive compounds. The method can reveal additional, previously unknown targets, as exemplified by the identification of tubulin-destabilizing activities of the RNA synthesis inhibitor actinomycin D and the effects on DNA replication of vioprolide A. The data analysis pipeline is based on the statistical programming language R and is available to the scientific community through a GitHub repository.
Introduction
Cell-based phenotypic assays constitute a highly relevant approach for discovering novel bioactive small molecules and for the consecutive development of novel therapeutic modalities.1,2 However, the optimization of phenotypically active compounds is hampered by the fact that the identification of their molecular target(s) and of the associated downstream pathways is tedious, as a generally applicable strategy does not exist. 1 In addition, it has become clear that many known drugs exert their effects via modulation of more than one target, 3 a phenomenon coined “polypharmacology.” 4 An important question for quantitative biology is to determine whether such an imperfect selectivity is a desirable, enhanced overall effect, or whether unwanted, detrimental off-target effects prevail.
In consequence, there is a strong demand for analytical methods that (1) capture the overall cellular response to small molecules and (2) give hints to their molecular mode of action (MoA) by comparing the induced cellular responses with those of known drugs.
A large variety of such compound profiling methods based on molecular signatures derived from transcriptomes,5,6 proteomes,5,7 and metabolomes, 8 based on high-content cellular imaging,9,10 or on bioactivity profiles 11 have been developed and successfully applied. 12 However, a drawback shared by most of them is their destructive nature; that is, the cellular integrity needs to be disrupted prior to sample analysis. Therefore, usually single-time-point measurements are carried out that provide only a snapshot of the cellular state, with the risk that a crucial period of response is missed. One exception is the IncuCyte system developed by Sartorius that offers real-time, automated live-cell imaging even over longer time periods, but still demands the use of labeling reagents. 13
A label-free method that offers continuous, nondestructive monitoring of the cellular state over days is realized by electrochemical impedance spectroscopy (EIS), an application pioneered by Giaever and Keese. 14 EIS measures the resistance that an electrochemical system exhibits upon application of an alternating voltage. In systems that contain living cells, this parameter is influenced by cellular alterations, such as proliferation, morphology, adhesion, migration, volume, and apoptosis. As these alterations are in turn modulated by small bioactive molecules, impedance measurements lend themselves to bioactivity profiling applications. Abassi et al. were the first to demonstrate that impedance measurements of growing cells over time in the presence of bioactive compounds could be used to infer their MoA, as compounds with the same MoA produced similar impedance curves. 15
Further advantages of EIS are that the method is label-free, thereby avoiding artifacts from the introduction of reporters or fluorophores, and that it captures an overall cellular response induced by primary and secondary targets at different time points.
Nevertheless, the method has not often been used in the context of compound bioactivity profiling due to limited tools to analyze the time-dependent cellular response profiles (TCRPs) for this particular application. 16 The published studies that demonstrate the usefulness of impedance measurement for compound MoA prediction were carried out in cooperation with the company ACEA Biosciences (San Diego, CA) and used proprietory methods without giving access to raw data and analysis scripts.15,17,18
For example, Atienzar et al. assessed the impedance curves by visual inspection due to the lack of an interpretation/classification algorithm. 16 Consequently, they emphasize the necessity of the “development of a reliable analysis tool … to standardize the interpretation of RTCA patterns.”
With the present contribution, we want to address this need by a publicly available pipeline for the analysis and interpretation of impedance curves for the MoA analysis of small molecules. Elements of the pipeline have been successfully applied by us in the past to provide valuable hints for the elucidation of the MoA of several natural products.19,20
All experiments were performed on a commercial instrument, the xCELLigence Real Time Cell Analyzer (RTCA; ACEA Biosciences), which measures impedance at a single frequency in 96-well plates equipped with gold microelectrodes. The plot of the normalized impedance, called cell index, over time is termed the “time-dependent cellular response profile.”
It is the primary objective of this contribution to address the need for a freely available data analysis pipeline that can be used to analyze TCRP data for MoA prediction of bioactive compounds. We implemented methods in the data analysis workflow to enhance and evaluate interassay reproducibility, to identify outliers, and to analyze TCRPs using cubic smoothing splines. The data analysis pipeline was implemented in the statistical programming language R and can be freely accessed via a GitHub repository (https://github.com/raimofranke/xCELLAnalyzer).
A reference set consisting of 59 compounds that cover a wide range of biological activities and the natural product vioprolide A with previously unknown MoA were analyzed in 16 independent experiments on two xCELLigence machines. The utility of the pipeline to provide insights into the MoA of bioactive compounds is demonstrated by two case studies on the natural products actinomycin D and vioprolide A.
Materials and Methods
Cultivation Conditions, Cell Lines, and Compounds
L929 mouse fibroblasts (DSMZ No. ACC-2) and HeLa cells (DSMZ No. ACC-57) were obtained from the DSMZ (German Collection of Microorganisms and Cell Cultures). Dulbecco’s modified Eagle’s medium (DMEM), fetal bovine serum (FBS), phosphate-buffered saline (PBS), trypsin-EDTA (0.25%), and phenol red were purchased from Gibco/Life Technologies (now Thermo Fisher Scientific, Waltham, MA). Compounds either were purchased from Sigma-Aldrich (St. Louis, MO) or were obtained from the HZI in-house natural product collection. Stock solutions were prepared using DMSO. L929 cells were grown in DMEM with 10% FBS for 3 days at 37 °C until confluency (inoculated 1:1 from preculture that was grown for 3 weeks [1:100 inoculation]). Cells were washed with PBS and trypsinated at 37 °C.
Single-Frequency Impedance Measurement
Sixty microliters of medium was added to each well of the E-plate 96 (ACEA Biosciences, San Diego, CA). After waiting for 30 min, the background impedance of the cell culture medium was measured with the xCELLigence RTCA SP (single-plate) instrument (ACEA Biosciences, San Diego, CA). The analyzer with the E-plate was placed in an incubator at 37 °C with 10% CO2 for impedance measurements. To calculate the cell index, the background was substracted from the measurements that followed by setting the cell index to zero at t = 0.
After pausing the system, the E-plate was removed from the incubator, and 120 µL of L929 cell culture (with 100,000 cells/mL, prepared from the 3-day preculture) were added to each well of the E-plate. After waiting for 30 min, the E-plate was placed in the incubator again, and cells were grown for 24 h. The measurement was halted again to take out the E-plate and add 1.8 µL of compound solution (prepared from a 1000-fold concentrated stock solution in DMSO, diluted 1:10 with medium) to each well, resulting in a 1:1000 total diluation of the compound in the well. To observe the maximal effect of the compound on the cellular phenotype, we used end concentrations in the wells corresponding to the IC90 determined in an MTT proliferation assay. In cases where the concentration was too high, resulting in issues with dissolving the compound or too high toxicity in the assay, a concentration between IC50 and IC90 was used (see
Outer wells of the E-plates were not used for measurements to avoid any edge effect and compound replicates were randomly distributed to avoid batch effects (see supplemental material, experimental design considerations, and
After compound addition, the impedance signal was recorded every 5 min for ~66.5 h, corresponding to 800 data points. For the recording of the TCRP, the proprietary software RTCA (version 1.2, ACEA Biosciences, San Diego, CA) was used. The system supplies the cultered cells with an alternating voltage at low frequency and measures the current in real time.
The RTCA software records the impedance as a dimensionless parameter called cell index (CI). The cell index is calculated by dividing the change in the electrical impedance R at a certain frequency by the nominal impedance value and thereby represents a relative value. Equation 1 shows how the cell index at a given time point t (CI(t)) is calculated.
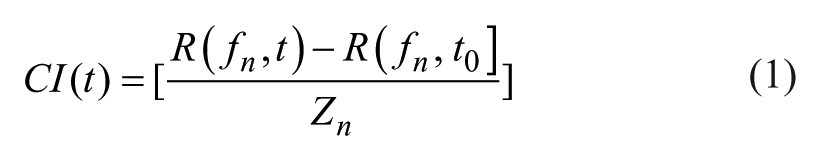
fn is the frequency at which the impedance measurement is carried out,
Calculation of the Normalized Cell Index
Calculation of the normalized cell index (NCI) was carried out by dividing the cell indices at each time point after compound addition by the cell index at a reference time point (eq 2).
For the reference time point, the last measurement before compound addition was taken.
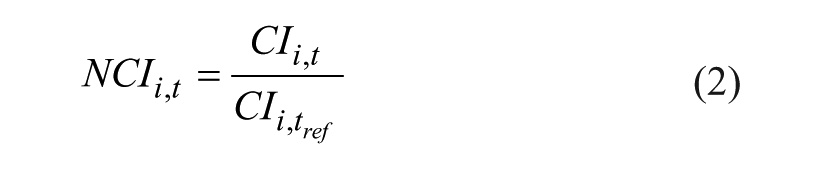
NCIi, t is the NCI compound i at timepoint t, CIi, t is the cell index of compound i at time point t, and CIi, tref is the cell index of compound i at the reference time point tref (last measurement before compound addition).
Vioprolide Treatment of Cells, Cell Lysates, and Western Blotting
L929 and HeLa cells were cultivated in DMEM with 10% FBS at 37 °C. For subcultivation, cells were washed with PBS and detached by trypsin. Cells were then seeded subconfluently into six-well plates and the following day treated with the compounds for 16 h. Cells were detached by scratching on ice and washed once with PBS before lysis with low-salt lysis buffer (50 mM Tris [pH 8.0], 150 mM NaCl, 5 mM EDTA, 0.5% NP-40, 1 mM DTT, 1 mM PMSF, and complete EDTA-free from Roche Diagnostics, Mannheim, Germany) for 20 min on ice. Total protein (25 µg) per lane was mixed with ¼ Roti-Load 1 (Carl Roth GmbH, Karlsruhe, Germany), boiled for 10 min, and loaded onto precast sodium dodecyl sulfate (SDS) protein gels (4%–20% Mini-PROTEAN TGX Precast Protein Gels, 10 well, 50 µL, Bio-Rad Laboratories Inc., Hercules, CA). Proteins were transferred by semidry blotting (45 min, 15 V) onto polyvinylidene fluoride (PVDF) membranes (Merck Millipore, Burlington, MA) and detected with antibodies specific to γH2AX (A300-81A, Bethyl Laboratories Inc., Montgomery, TX); GAPDH (sc-25778, Santa Cruz Biotechnology, Dallas, TX); p-mTOR (Ser2448, 2971, Cell Signaling Technology, Danvers, MA); mouse IgG, horseradish peroxidase (HRP)-linked antibody (7076, Cell Signaling Technology); and rabbit IgG, HRP-linked antibody (7074, Cell Signaling Technology). HRP signals were detected using Clarity Western ECL Substrate in a ChemiDoc Imaging System (both Bio-Rad Laboratories). Signal intensities were quantified using Image Lab software (Bio-Rad Laboratories).
Data Mining Pipeline
The whole data processing and mining workflow was implemented in the statistical programming language R, version 3.4.3. 21 The implemented functions and details of the data analysis are explained in the supplemental information and in the R markdown document “xCELLanalyzer.Rmd,” which can be accessed via the GitHub repository (https://github.com/raimofranke/xCELLanalyzer).
Results
The premise of the methodology for compound MoA prediction, first introduced by Abassi et al., 15 is that compounds with the same MoA produce similar impedance curves (TCRPs). And the prerequisite for MoA prediction would be that the similarity between TCRPs of compounds that have the same MoA is higher than the similarity between TCRPs of compounds with different MoAs. This was indeed found to be the case, as illustrated by cell index curves for the two actin binders cytochalasin D and chondramide C and the two proteasome inhibitors MG132 and bortezomib ( Fig. 1 ). In the following, the workflow from impedance curve to MoA prediction is discussed in detail.
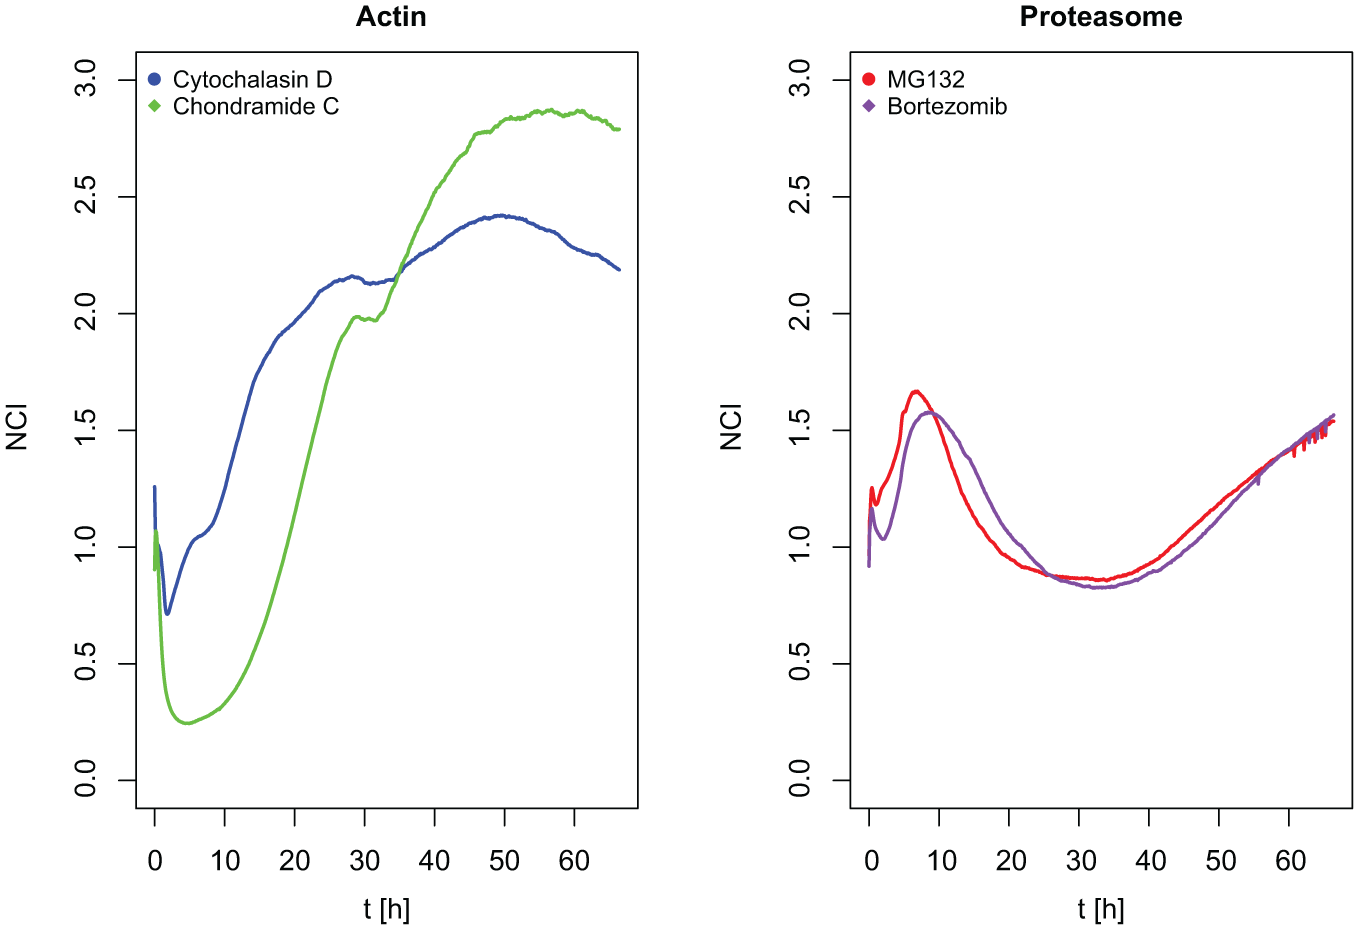
TCRPs of two compounds acting on the actin cytoskeleton (left) and two proteasome inhibitors (right).
Workflow of the Data Processing Pipeline
Figure 2 shows an overview of the data processing pipeline that was implemented in the programming language R. 21 It consists of the following steps: the raw cellular impedance data recorded with the ACEA Biosciences RTCA software (version 1.2) are imported into R (version 3.4.3). Quality control and outlier detection is done by the median polish algorithm and plotting of the normalized TCRPs. Then, median TCRPs are calculated from multiple NCIs that correspond to technical replicates in the same plate. To combine biological replicates from multiple independent measurements, a local normalization is carried out followed by outlier detection and a calculation of median cell indices (“medians of medians”). Each of these cell indices represents a descriptor that can be used for subsequent data mining approaches. To achieve a dimension reduction of the high-dimensional dataset, cubic smoothing splines were applied for TCRP approximation. The basis spline coefficients spanned a distance matrix that was subsequently used for unsupervised data mining approaches. In this study, hierarchical clustering and a rank-based MoA prediction were conducted. In the following, the steps are described individually.
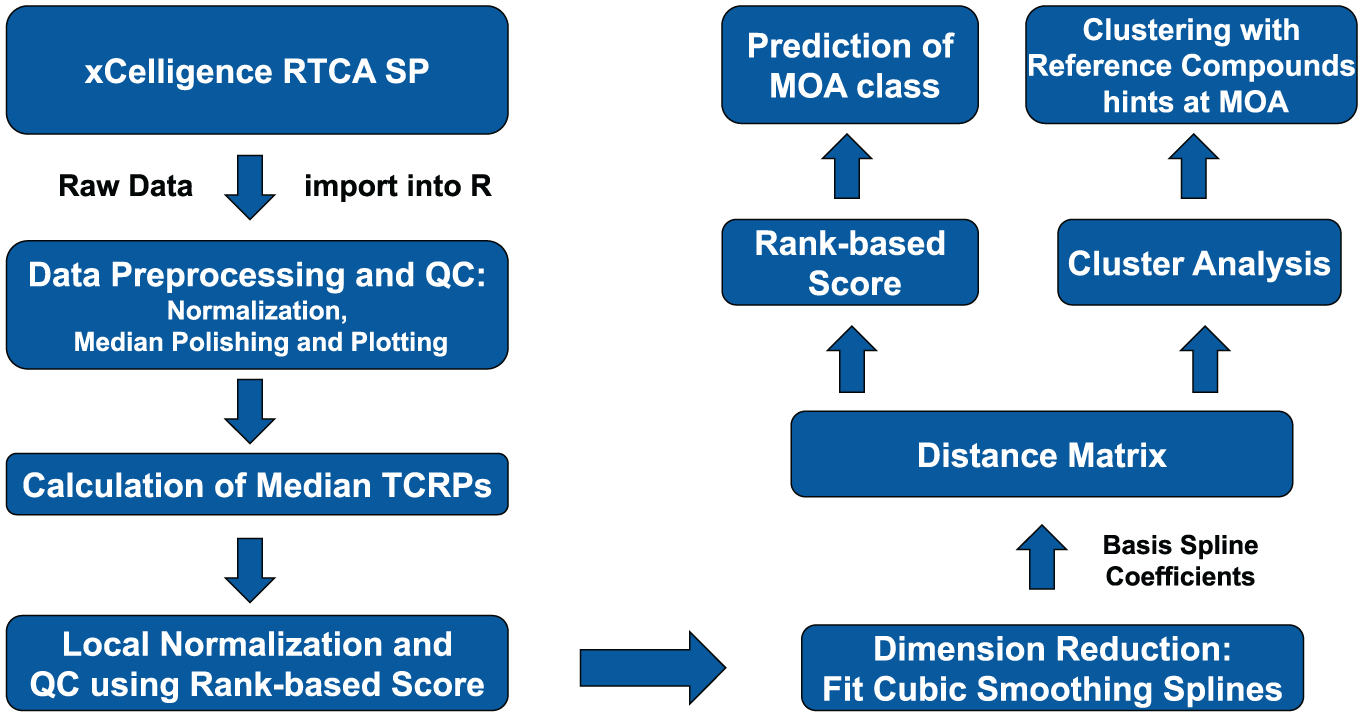
Flowchart summarizing the data mining workflow of the TCRP data analysis.
Preprocessing of the Imported Data
Data from the vendor software could be imported without manual formatting, because all parsing and reformatting steps were implemented in the read_xcell-function of our R script.
A global normalization of the raw cell index data was carried out by dividing the cell indices for each time point after compound addition by the cell index that was last measured before compound addition to calculate the NCI (see eq 2). The impedance curves were recorded in two to four technical replicates. To detect and remove outliers, which could be caused by defective electrodes, a median polish procedure was applied. The sum of the absolute residuals of the median polish fit was used to judge if a technical replicate was an outlier. Replicates, for which the sum of the residuals was above a threshold of 90, were removed from the dataset. If only technical duplicate measurements of a compound existed, both replicates were removed if one of the two impedance curves came above the 90 threshold.
Median TCRPs and Local Normalization
For each compound, the median cell index was calculated at each time point to produce median TCRPs. The median was favored over the mean because of its robustness against outliers.
As a 96-well plate does not contain enough wells to accomodate all reference and test compounds in multiple replicates, datasets from independent experiments have to be fused. To make biological replicates comparable, a local normalization was established that takes into account differences in cell growth behavior between plates. We used the growth curve of the DMSO solvent blank as a reference, and normalized by subtracting the median NCI of the solvent-treated cells from the median NCI of the compound-treated cells for each time point.
The beneficial effect induced by local normalization of TCRPs is exemplified for wortmannin in
We also observed that the replicates generated on different xCELLigence machines have the highest deviations, despite using the exact same experimental protocol for both machines (datasets 1 to 10 were generated on machine A and 11 to 16 were generated on machine B; see
Dimension Reduction Using Cubic Smoothing Splines
A central challenge for the automated analysis of impedance data is to provide a mathematical description of the highly complex curve shapes of TRCPs. If a high-dimensional space is constructed by considering more and more curve attributes, a distance function for subsequent data mining approaches loses its ability to separate points well into this high-dimensional space, and thereby suffers from a so-called “curse of dimensionality.” In order to reduce the number of attributes for each curve, we searched for an appropriate curve approximation model. Due to the complex nature of the TCRPs, normal fitting with polynomials is only satisfactory using high-degree polynomials, with the danger of overfitting and oscillation at the edges of the interval (Runge phenomenon). We thus decided to use cubic smoothing splines for a piecewise polynomial approximation, which achieved a good fit of the TCRPs while avoiding approximation to noise. The basis spline coefficients were then used as attributes in the subsequent data mining approaches.
To the best of our knowledge, we were the first to apply cubic smoothing splines for dimension reduction of the high-dimensional datasets from impedance measurements.20,22 Xi et al. also reported the use of smoothing splines for functional data analysis of TCRPs, but their approach differs considerably from the one presented here, since they performed a principal component analysis first and applied the B spline basis functions to the principal component scores. 23 In a more recent publication, Zhang et al. applied wavelet transforms to TCRP curves at multiple concentrations to infer compound MoA via supervised methods, such as neural networks and support vector machine algorithms. 24 For both publications, the source code is not available.
A Rank-Based Score to Evaluate Reproducibility
To evaluate the interassay reproducibility between biological replicates and also the responsiveness of the assay, we established a score based on rank position. Using the basis spline coefficients as an input, a distance function was applied to generate a matrix that contained all pairwise distances between the biological replicates from all compounds. The columns of the matrix were then sorted by increasing the distance for each compound replicate individually. The premise is that the distances within the group of biological replicates for a given compound of interest should be smaller than the distances between replicates from different compounds. The biological replicates from the same compound should therefore be found on the first ranks of the sorted distance matrix. As a score for reproducibility, the rank sum is calculated column-wise, for each compound replicate individually. A normalized score that is independent of the number of replicates is obtained by division of the best possible rank sum by the obtained rank sum. For instance, if the three biological replicates of a given compound are on ranks 1, 2, and 4, a score of 7 would result. To calculate the normalized score, the ideal score of 6 (ranks 1, 2, and 3) is divided by the actual score of 7, resulting in a normalized score of 0.86. The closer the normalized score to 1, the better the reproducibility. In contrast to measures such as the coefficient of variation, the rank-based score gives a measure of not only how reproducible the TCRPs are from experiment to experiment, but also how well they are separated from the curves that other compounds yield. The uniqueness of the TCRP pattern and responsiveness of the assay influence the rank-based score. A good score means that the biological replicates of a compound are reliably more similar to each other than to those of other compounds. A compound that induces a strong impedance phenotype (e.g., actin modulators; see below) can have more deviation from replicate to replicate, but is still grouped correctly, because the profile is distinct from others. In contrast, a compound inducing only a weak impedance phenotype can have less deviation between the replicates, but is more likely to be grouped with other less responsive compounds. The score was used not only to assess the interassay reproducibility and responsiveness for a given compound, but also as a measure of the overall performance of the data processing approach. The latter was obtained by dividing the sum of the normalized scores by the number of profiles. For example, a comparison of different distance functions and data pretreatment methods showed that Euclidean distance and maximum distance performed better than the Manhattan distance ( Table 1 ).
Average Normalized Rank Scores for Different Distance Measures and Data Preprocessing Methods.

To assess the effect of the local normalization (see above), the total score was calculated for the same dataset with and without local normalization, resulting in average normalized rank scores of 0.479 and 0.274, respectively, using Euclidean distances and scaled data. This clearly demonstrates the improvement in reproducibility when local normalization is used.
For this first part, a score for each biological replicate was calculated. To judge how a group of biological replicates performed overall, a compound group score was calculated by dividing the sum of all replicate scores of all compounds belonging to one group by the number of replicates (
The group score can be used to judge the reproducibility for a certain compound. Chelerythrine, H89, saframycin Mx1, staurosprine, and wortmannin have a perfect score of 1, and thus are highly reproducible, whereas neopeltolide
25
and archazolid B have a very low score. TCRPs can fluctuate more from experiment to experiment for certain compounds, and to account for TCRPs that deviate strongly from the other biological replicates, the normalized rank score for each individual replicate can be used to identify and filter outliers. Comparison of the results of the score-based approach with the plotted median TCRPs of the biological replicates shows that the smaller the normalized rank score, the stronger the deviation of the TCRP of this particular replicate from the other ones. We used the normalized rank score to identify and remove outliers using a defined threshold of 0.1. Outliers below this threshold were removed. Following the removal of outlier replicates, recalculation of the average normalized rank score showed a considerable improvement from 0.479 to 0.647. Correspondingly, the group scores also improved (see
Hierarchical Clustering of the Reference Dataset and MoA Prediction
We next wanted to assess whether the optimized processing protocol for TCRPs enabled a correct classification of the reference compounds according to their MoA. The data mining workflow described above was followed by applying cubic smoothing spline approximation of the filtered median TCRPs of the 59 reference compounds and 1 compound with unknown MoA (vioprolide A) with local normalization. The basis spline coefficients were scaled by dividing them by their root mean square and then used as attributes to span a distance matrix. Both the compounds and the attributes were subjected to hierarchical cluster analysis. For the clustering of the compounds, the dendsort function of the dendsort package was also applied. It optimizes ordering of nodes in a dendrogram, without affecting the meaning of the dendrogram. 26 Clustering of the attributes, denoted as c1 to c22, reveals that the first two coefficients are in separate clusters and show unique patterns, whereas coefficients 10–22 show less variability ( Fig. 3 ). Most information is therefore captured in the first nine basis spline coefficients, corresponding to the early events after compound addition.

Hierarchical clustering and heatmap representation resulting from processing of the TCRPs of 59 reference compounds and 1 compound with unknown MoA (vioprolide A). The color scale represents the values of the scaled basis spline coefficients derived from the cubic smoothing spline fitting. They can be viewed as descriptors representing the phenotype induced by the compound treatment.
Most compounds cluster according to their MoA, but there are also some exceptions and unintuitive results: starting from the top, a cluster of five compounds can be identified, including four compounds that have an effect on the respiratory chain (cruentaren A, oligomycin, myxothiazol A, and CCCP). For the anticancer drug doxorubicin, inhibition of cellular respiration has also been described. 27
Oxamflatin and scriptaid, both HDAC inhibitors, can be found in one cluster, and a third HDAC inhibitor, trichostatin, is in close proximity, although in another cluster.
A23187 (calcium ionophore) and indirubin-3-monoxime (CDK inhibitor) are found within one cluster, which could be explained by the fact that cell cycle progression is regulated by calcium-dependent pathways. 28 The compounds in the next cluster point in the same direction: cyclosporine A modulates calcium-dependent pathways, purvalanol A is a CDK inhibitor, and for puromycin, a translation inhibitor, an effect on cell cycle progression was described. 29
The next cluster contains simvastatin and mevastatin, both HMG-CoA inhibitors. The two p38-kinase inhibitors SB202190 and SB203580 are found in one cluster. Also, compounds acting on tubulin are found within one cluster, namely, griseofluvin, taxol, vinblastine and nocodazol; epothilone B is also found in close proximity. Colchicine and podophyllotoxin, both also acting on tubulin, are found in a cluster a bit farther away.
The proteasome inhibitors bortezomib (velcade) and MG132 are found in one cluster, as well as the protein synthesis inhibitors cycloheximide, myriaporone, and anisomycine. One cluster that is clearly separated contains chondramide C, cytochalasin D, and rhizopodin A. These three compounds act on actin, either as a depolymerizer (rhizopodin and cytochalasin D) or as an actin stabilizer (chondramide C). While the clusters described above can be interpreted with ease, there are also false-positive and false-negative groupings. For instance, a separated cluster consists of apicularen, cerulenin and chelerythrine. Apicularen is a V-ATPase inhibitor, but does not cluster with the other V-ATPase inhibitor archazolid B, although their profiles are similar according to a visual inspection. As the effect of apicularen on the TCRP is more pronounced, this difference could be concentration dependent. Chelerythrine is a PKC inhibitor, but it has not been grouped with the other (unselective) PKC inhibitor staurosporine. Also, the profiles have a similar shape, but for chelerythrine the effect is more pronounced. On the other hand, some compounds cluster closely together although they do not share mechanistic similarities (as far as known today). This concerns, for example, the CRM1 inhibitor ratjadon C and the ACC inhibitor soraphen A, or the topoisomerase inhibitor doxorubicin is placed closely to the ATP synthase inhibitor oligomycin.
In summary, the hierarchical clustering analysis led to many correct groupings of compounds with similar MoAs, thereby proving its utility with respect to giving important hints for the putative MoA. On the other hand, the hierarchical clustering failed to recognize all similarities, and moreover, it generated “false-positive” associations. Such limitations of the hierarchical clustering method have been reported before in the context of other applications. 30
Rank-Based MoA Prediction
Because the dendrogram generated by a hierarchical clustering algorithm cannot accurately represent all pairwise distances stored in the distance matrix, it is useful to explicitly investigate the distances calculated for a given compound with an unknown MoA to the reference compound set. We therefore implemented a function in our script that ranks all compounds of the reference set according to their calculated distance to a given query compound (
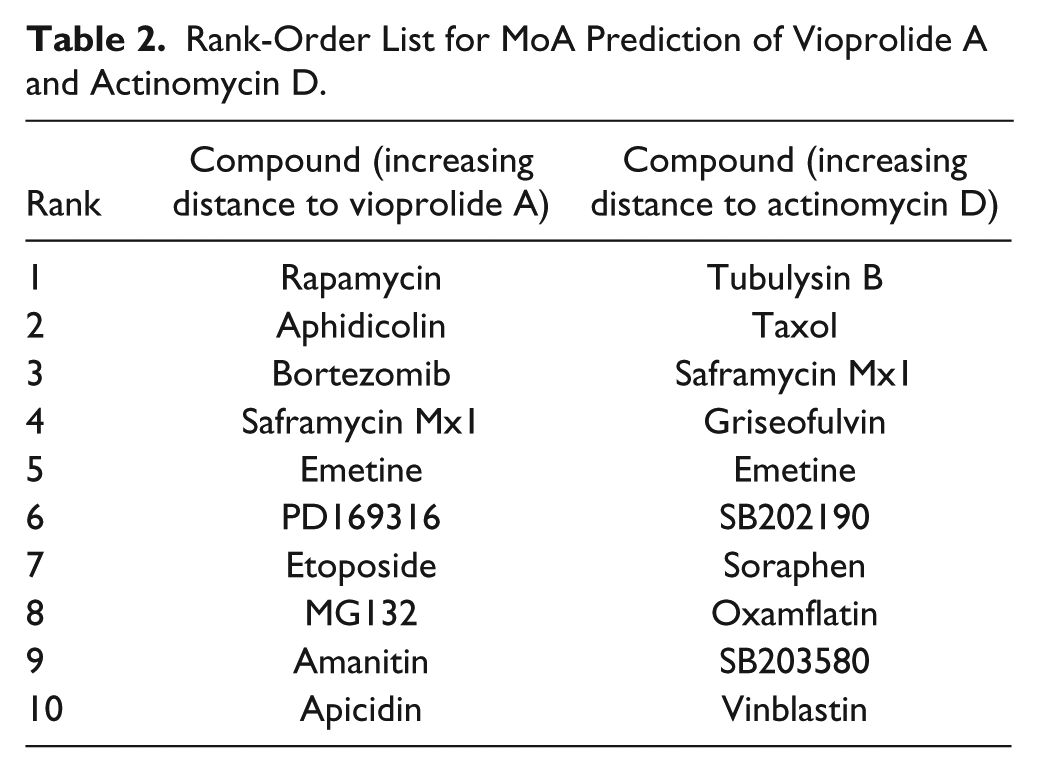
To exemplify the utility of this method, we included the natural product vioprolide A, a cyclic peptide isolated from the myxobacterium Cystobacter violaceus with a hitherto unknown MoA, in the dataset. Vioprolide A exhibits potent cytotoxic effects and also inhibits type I interferon signaling, which may be due to the modulation of more than one target.31,32 In hierarchical clustering and in the rank-order list, the compound was grouped closely to rapamycin, a natural product that gave a hint and the name to its target, the kinase mTOR (
Rank-Order List for MoA Prediction of Vioprolide A and Actinomycin D.
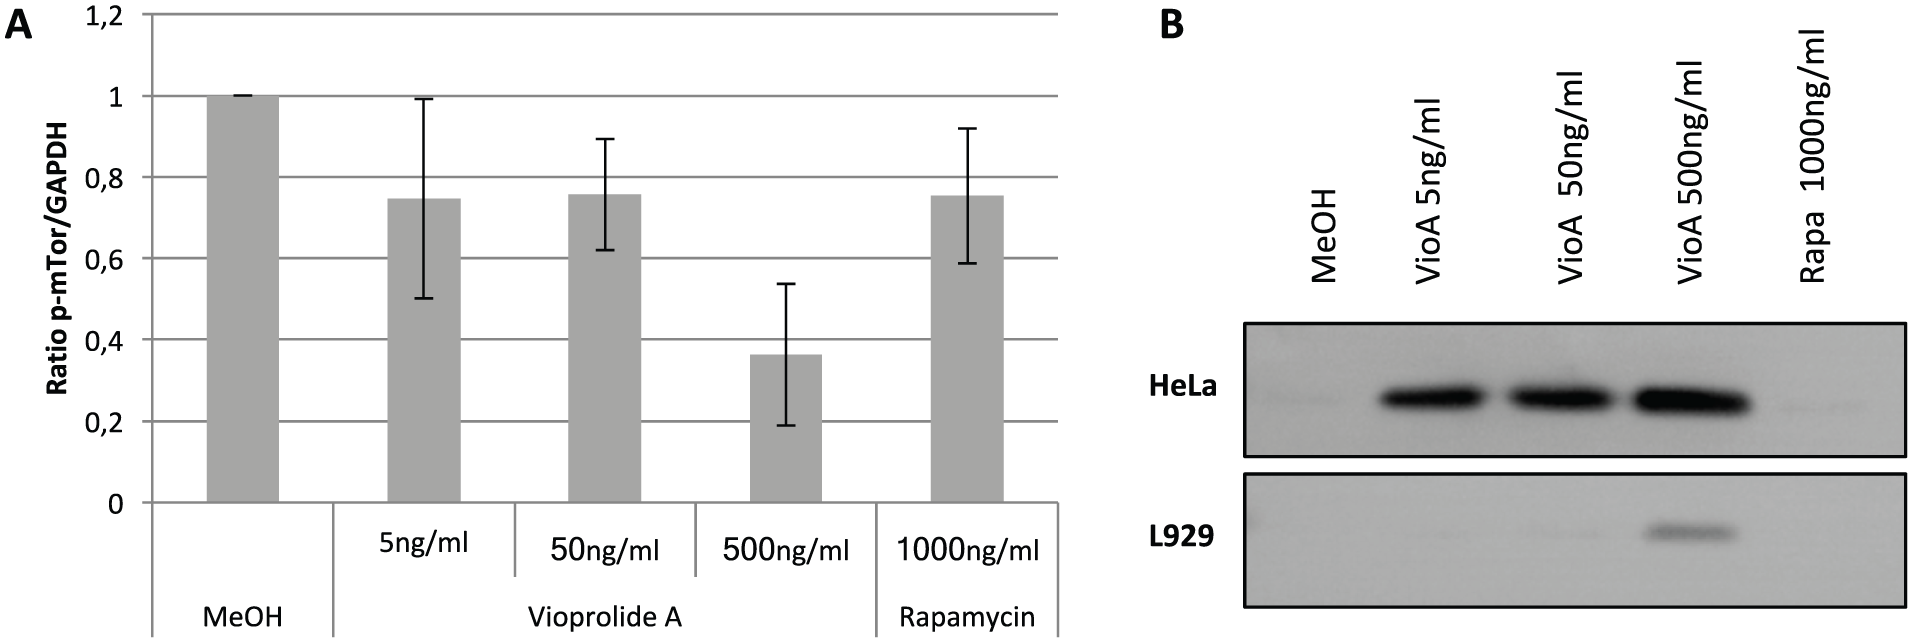
Effects of vioprolide A on the level of phosphorylated mTOR and γH2AX (histone H2AX phosphorylated at Ser139). (
In the dendrogram in Figure 3 , aphidicolin is not in immediate proximity to vioprolide A. Another small cluster in close proximity to vioprolide A consists of the two proteasome inhibitors MG-132 and bortezomib (velcade), and the p38 MAPK inhibitor PD169316, for which proteasome modulatory properties have also been described. 37
To investigate whether vioprolide A could induce DNA damage, we checked the level of phosphorylated histone H2AX (phosphorylated at Ser139) by Western blot analysis. Detecting such γH2AX (the phosphorylated form of H2AX) is a common indicator of DNA double-strand breaks. 38 Inhibition of the proteasome is also linked to an increase of the γH2AX level, 39 which explains why the proteasome inhibitors were close to DNA damage inducers in the rank-order list.
In HeLa and L929 cells, we indeed observed an effect of vioprolide A on the γH2AX level, and for HeLa cells, even at low concentrations of 5 ng/mL or 6 nM ( Fig. 4B ). In L929 cells, γH2AX is detected after treatment with a higher vioprolide A concentration (500 ng/mL or 600 nM). These results provide evidence that vioprolide A treatment indeed induces DNA double-strand breaks, as its near neighbors in the impedance curve analysis via rank-based MoA prediction.
In a second application example, we paid closer attention to actinomycin D, a peptide antibiotic that also exhibits antitumor activities. Actinomycin is known and widely applied as a DNA intercalator and inhibitor of transcription and translation. 40 But surprisingly, actinomycin D was found in a cluster with tubulysin A, an inhibitor of tubulin polymerization, in the dendrogram. 41 In close proximity, the protein synthesis inhibitor emetine and the DNA synthesis inhibitor saframycin Mx1 are found. In the ranked-based MoA prediction, tubulysin B and taxol are on the top of the list ( Table 2 ). Indeed, Rajagopalan and Gurnani observed that actinomycin D inhibited tubulin assembly into microtubules in in vitro assays. 42 Whereas this was observed when actinomycin D was applied to tubulin in equimolar amounts, we here used approximately 100 fold lower concentrations. However, actinomycin D was also described to have profound effects on tubulin mRNA production and protein synthesis. Ben-Ze’ev et al. showed that tubulin protein levels in cells were highly sensitive to treatment with actinomycin D, along with low levels of translatable tubulin mRNA. 43 A shortage of tubulin in cells in turn results in reduced microtubule turnover and increased microtubule stabilization. 44
Discussion
A potential problem of compound profiling methods that involve reference compounds concerns the difficulty to find probes that selectively modulate only one target. Many bioactive compounds that are used as potent inhibitors of specific targets have off-targets and/or show additional downstream effects that are not even known or fully understood. This hampers the definition of clear-cut MoA classes, even within the set of 59 reference compounds used for this study.
In addition, the impedance readout is not unbiased in terms of an equally strong response to every MoA. For instance, compounds acting on the cytoskeleton have a more pronounced effect on the cellular impedance than compounds modulating intracellular pathways. For the latter group, the direct effect on a target is not sampled, but rather the secondary, downstream events become manifest by the impedance curve. These effects might also overlap with compounds that have a different direct target, thereby giving rise to similar curve shapes and close groupings in the clustering or rank-order tables, and eventually to false-positive “assignments.”
Another limitation is given by the finite number of MoA classes represented in the reference compound set. If the MoA of a compound of interest is not covered by the reference set, it is a priori not possible to find it by this (or any other) correlation method. Even worse, the clustering and ranking will always give a closest match, and the quantitative distances often do not clearly discern such a closest match as a false positive. Therefore, an independent biochemical or biophysical validation of a prediction generated by a profiling method is always necessary. MoA elucidation will most often not be achieved by a single methodology, but rather by an integration of diverse, complementary methods. 45
Nevertheless, the method has proven to be effective in generating new and valid hypotheses on the cellular effects of a compound. For the natural product vioprolide A, an important cellular effect (DNA damage) was predicted and verified in independent experiments. The method is also well suited to discover previously unknown or unexpected compound (off-target) effects, as shown for actinomycin D, which in addition to its effect on transcription and translation modulates microtubule stability.
Our data mining pipeline makes high-content screening using impedance measurements accessible. We introduced several improvements to the data mining workflow (median polish, local normalization, rank-based score) that led to an improved reproducibility and easier interpretability of results.
The combination of descriptors derived from other profiling technologies, such as automatic microscopy and transcriptomics with the TCRP-derived descriptors, is a promising strategy for future investigations to improve the quality of the MoA predictions. Moreover, it would be interesting to generate data in different cell lines at a range of different concentrations to compare the outcomes and eventually also combine the derived descriptors for higher predictive power in future studies. All the data and scripts used for this study can be accessed via GitHub: https://github.com/raimofranke/xCELLanalyzer.
Supplemental Material
Supplemental_Information_rev – Supplemental material for xCELLanalyzer: A Framework for the Analysis of Cellular Impedance Measurements for Mode of Action Discovery
Supplemental material, Supplemental_Information_rev for xCELLanalyzer: A Framework for the Analysis of Cellular Impedance Measurements for Mode of Action Discovery by Raimo Franke, Bettina Hinkelmann, Verena Fetz, Theresia Stradal, Florenz Sasse, Frank Klawonn and Mark Brönstrup in SLAS Discovery
Footnotes
Acknowledgements
We would like to thank Dr. Herbert Weich for helpful discussions and Dr. Randi Diestel and Torben Schulze for initial experiments.
Supplemental material is available online with this article.
Declaration of Conflicting Interests
The authors declared no potential conflicts of interest with respect to the research, authorship, and/or publication of this article.
Funding
The authors disclosed receipt of the following financial support for the research, authorship, and/or publication of this article: This work has been supported by the President’s Initiative and Networking Funds of the Helmholtz Association of German Research Centres (HGF) under contract number VH-GS-202, and by the EU-funded European Marine Biological Research Infrastructure Cluster (EMBRIC, code 654008).
References
Supplementary Material
Please find the following supplemental material available below.
For Open Access articles published under a Creative Commons License, all supplemental material carries the same license as the article it is associated with.
For non-Open Access articles published, all supplemental material carries a non-exclusive license, and permission requests for re-use of supplemental material or any part of supplemental material shall be sent directly to the copyright owner as specified in the copyright notice associated with the article.