SLC6A19 (B0AT1) is a neutral amino acid transporter, the loss of function of which results in Hartnup disease. SLC6A19 is also believed to have an important role in amino acid homeostasis, diabetes, and weight control. A small-molecule inhibitor of human SLC6A19 (hSLC6A19) was identified using two functional cell-based assays: a fluorescence imaging plate reader (FLIPR) membrane potential (FMP) assay and a stable isotope-labeled neutral amino acid uptake assay. A diverse collection of 3440 pharmacologically active compounds from the Microsource Spectrum and Tocriscreen collections were tested at 10 µM in both assays using MDCK cells stably expressing hSLC6A19 and its obligatory subunit, TMEM27. Compounds that inhibited SLC6A19 activity in both assays were further confirmed for activity and selectivity and characterized for potency in functional assays against hSLC6A19 and related transporters. A single compound, cinromide, was found to robustly, selectively, and reproducibly inhibit SLC6A19 in all functional assays. Structurally related analogs of cinromide were tested to demonstrate structure–activity relationship (SAR). The assays described here are suitable for carrying out high-throughput screening campaigns to identify modulators of SLC6A19.
SLC6A19 (B0AT1) transports neutral amino acids in an electrogenic, Na+-dependent manner, and is responsible for the reabsorption of these amino acids in the brush border epithelia of the kidney and intestine.1,2 SLC6A19 requires an obligatory subunit, collectrin (TMEM27) in kidney and angiotensin-converting enzyme 2 (ACE2) in intestine, for functional expression on the cell surface.3–7 The SLC6 family of transporters to which this transporter belongs also includes several other transporters.8,9 Chief among these are the neurotransmitter and GABA subfamily of transporters for which considerable information exists on function and expression, including several pharmacological tools (agonists and antagonists) for functional evaluation. Relatively little is known about the amino acid transporter subfamily of SLC6, and few pharmacological tools exist for their evaluation. SLC6A19 is implicated in Hartnup disorder, an autosomal recessive disorder, and individuals with loss-of-function mutations in this gene show the characteristic aminoaciduria, pellagra-like symptoms, cerebellar ataxia, skin rash, and photosensitivity.10,11 Recently, SLC6A19 (–/–) mice were shown to exhibit better glycemic control with increased levels of GLP-1 and FGF21, suggesting that targeting SLC6A19 function could be beneficial in treating diabetes.12,13 Due to its critical role in amino acid reabsorption, SLC6A19 plays an important part in maintaining amino acid homeostasis.14,15 Additionally, the role of SLC6A19 in weight control is being investigated.15 Targeting SLC6A19 specifically with pharmacological tools like small-molecule inhibitors should allow further understanding of its role in major physiological disorders while demonstrating its pharmaceutical potential. A fluorescence imaging plate reader (FLIPR) membrane potential (FMP) assay was developed and validated to evaluate the effect of small-molecule compounds on the membrane potential change associated with the cotransport of a neutral amino acid (l-isoleucine) and a Na+ ion in MDCK cells stably expressing the human SLC6A19 and TMEM27. Simultaneously, an assay to measure uptake of a stable isotope of l-isoleucine was developed, and a liquid chromatography/mass spectrometry (LC/MS)-based method to quantify the amount of stable isotope taken up in hSLC6A19 + TMEM27-expressing MDCK cells was established. Both assays were used in parallel to screen 3440 compounds contained in the MicroSource Spectrum and TocriScreen collections of known pharmacological modulators with well-annotated biological activity. By selecting compounds that had significant inhibition of SLC6A19 function in both assays and by filtering the hits through a series of functional selectivity assays that measured activity against other related transporters, a single compound, cinromide, was identified as a selective SLC6A19 inhibitor. Structurally related analogs of cinromide existing in internal compound collections demonstrated a range of potencies pointing to key features in the structure–activity relationship (SAR).
Materials and Methods
Cell Culture
All cell culture materials were purchased from Thermo Fisher Scientific (Waltham, MA) unless otherwise specified. MDCK cells (NBL-2; ATCC, Manassas, VA) stably expressing human SLC6A19 + TMEM27 were generated in-house and cultured in Dulbecco’s modified Eagle’s medium (DMEM) with 10% fetal bovine serum (FBS) supplemented with 5 µg/mL blasticidin and puromycin. All experiments described here were conducted using cells that had undergone less than five passages.
Test Compound Collection
The Microsource Spectrum collection (2320 compounds; Microsource Discovery Systems, Gaylordsville, CT) and the TocriScreen Plus collection (1120 compounds; Tocris BioScience, Minneapolis, MN) were obtained as 10 mM DMSO stock solutions in source plates. Appropriate amounts of the stock solutions were plated onto the 384-well assay plates for testing in the FLIPR and uptake assays using the ECHO 555 Liquid Handler (Labcyte, Inc., San Jose, CA). Assay buffer was added to dissolve the compounds and achieve a final test concentration of 10 µM for each compound and a DMSO concentration of 0.1% v/v. The 3440 test compounds were distributed across 12 assay plates with approximately 320 test compounds per 384-well plate.
FLIPR Membrane Potential Assay
MDCK cells stably expressing hSLC6A19 + hTMEM27 were grown in culture medium to 80% confluence in T225 tissue culture flasks in a humidified 37 °C, 95%/5% air/CO2 incubator. Cells were harvested with trypsin and washed twice with assay buffer (HBSS + 20 mM HEPES, pH 7.4), and a cell suspension at a density of 1 × 10⁶ cells/mL in assay buffer was prepared. Fifteen microliters of the cell suspension in assay buffer was plated per well of a poly-d-lysine-coated, black, clear-bottom, 384-well microplate (Corning Life Science, Corning, NY) for a density of 15,000 cells/well and allowed to incubate for 3 h in a humidified 37 °C, 95%/5% air/CO2 incubator. Following incubation, cells were dye loaded with 15 µL/well of FLIPR membrane potential dye (Molecular Devices LLC, San Jose, CA) reconstituted in assay buffer and incubated at room temperature for an hour. The assay plate was moved to a FLIPR Tetra (Molecular Devices LLC) and a short baseline fluorescence reading was obtained (Ex/Em 530 nm/565 nm) prior to adding test compounds (4×; 15 µL/well) prepared in assay buffer. After incubating cells with test compounds for 15 min, membrane depolarization was induced by adding 15 µL/well of 12 mM l-isoleucine (4×; Sigma Aldrich, St. Louis, MO) in assay buffer (3 mM final l-isoleucine concentration in well) and fluorescence was measured for an additional 5 min. The baseline fluorescence reading measured just prior to adding isoleucine (min) was subtracted from the maximum fluorescence reading after adding isoleucine (max) to obtain max-min measurements that were used to compare the same obtained in wells with no compounds (control buffer only) to determine percent inhibition with compounds. One column (16 wells) of each plate was dedicated for positive control for inhibition (control buffer without substrate l-isoleucine representing 0% transporter activity or 100% inhibition), and two columns (32 wells) were dedicated for negative controls for inhibition (l-isoleucine at 12 mM [4×; 3 mM in-well concentration] representing 100% transporter activity or 0% inhibition). One column (16 wells) was dedicated to carry a reference inhibitor in a dose–response fashion (eight concentrations in duplicate). The Z′ of each plate was determined by using the average and standard deviation obtained from the negative and positive control wells using the standard formula Z′ = 1 – [3(SDNeg + SDPos)/(MeanPos – MeanNeg)]. Only plates with a Z′ > 0.4 were accepted. The dose–response curve and IC50 of the reference compound obtained from each plate were tracked and evaluated for reproducibility of assay performance across plates.
Stable Isotope Uptake Assay
MDCK cells stably expressing hSLC6A19 + hTMEM27 were plated in a poly-d-lysine-coated, black, clear-bottom, 384-well microplate (Corning Life Sciences) at a density of 2200 cells/well in culture medium and allowed to incubate for 48 h in a humidified 37 °C, 95%/5% air/CO2 incubator. Following the incubation period, the culture medium was aspirated and cells were washed twice with HBSS. Cells were incubated at 37 °C for 20 min with 20 µM (2×) of test compounds in assay buffer (137 mM NaCl, 5 mM KCl, 1 mM CaCl2, 1 mM MgCl2, 10 mM HEPES, 10 mM glucose, pH 7.2) following which 2 mM 13C6, 15N-l-isoleucine (Sigma Aldrich) in assay buffer was added and incubated for 20 min more. One column (16 wells) of each plate was dedicated for positive control (preincubated with a saturating concentration of an internally identified specific SLC6a19 reference inhibitor before adding 2 mM substrate 13C6, 15N-l-isoleucine; 0% transporter activity or 100% inhibition), and two columns (32 wells) were dedicated for negative controls (13C6, 15N-l-isoleucine at 2 mM for uptake assay without reference inhibitor; 100% transporter activity or 0% inhibition). One column (16 wells) was dedicated to carry a reference inhibitor in a dose–response fashion (eight concentrations in duplicate). The solution was then aspirated and cells were washed six times in cold assay buffer and most liquid was aspirated. Plates were air-dried and subjected to a freeze–thaw cycle to lyse cells. Extraction buffer (30 µL/well; 10% methanol, 1% formic acid, 250 nM l-leucine-1-13C and cell dissociation buffer) was added and plates were shaken for 5 min and incubated at 37 °C for 15–20 min, following which an additional 60 µL of extraction buffer was added per well. Eighty microliters of cell extract was clarified by centrifuging through an AcroPrep 384-well, 30K cutoff filtration plate (Pall Corporation, Port Washington, NY). The clarified cell extracts were analyzed using a Thermo Fisher LX-4 chromatograph coupled to an ABsciex API-4000 triple quad mass spectrometer (Sciex, Framingham, MA). Waters Acquity UPLC BEH 2.1 × 30 mm C18 chromatography columns (Waters Corporation, Milford, MA) were used, and mobile phases A and B were water with 0.1% formic acid and acetonitrile with 0.1% formic acid, respectively. The columns were held at room temperature and the sample injection size was 5 µL. The chromatography was run at a flow rate of 0.5 mL/min, with the initial condition being 95% mobile phase A. The 95% mobile phase A condition was held for 12 s after injection, followed by a 6 s gradient to 50% mobile phase A, and held for 10 s before returning to the initial condition. The ABsciex API-4000 mass spectrometer was operated in positive mode monitoring the 133→86 m/z transition for l-leucine-1-13C and 139→92 m/z for 13C6, 15N-l-isoleucine using a collision energy of 16 eV. The peak areas of 13C6, 15N-l-isoleucine were normalized to l-leucine-1-13C, which served as an internal standard. The Z′ of each plate was determined as previously mentioned, and only plates with a Z′ > 0.4 were accepted. The dose–response curve and IC50 of the reference compound obtained from each plate were tracked and evaluated for reproducibility of assay performance across plates.
LAT1 Uptake Assay
HEK293 cells (ATCC) were grown in T225 tissue culture flasks, harvested, rinsed, and resuspended in sodium-free HBSS (125 mM choline chloride, 4.8 mM KCl, 1.2 mM MgSO4, 1.2 mM KH2PO4, 1.3 mM CaCl2, 5.6 mM glucose, 25 mM HEPES, pH 7.4) and plated at 40,000 cells/well in 45 µL/well in 384-well Cytostar-T Plates (PerkinElmer, Waltham, MA). After incubation at 37 °C for 2 h, 5 µL/well of 14C-labeled leucine (0.125 µCi/well; PerkinElmer) diluted in sodium-free HBSS was added and plates were sealed and incubated at room temperature for 5 h. Plates were read using a MicroBeta (PerkinElmer) with the 14C SPA standard settings at 15 s/well. The range of uptake was determined by subtracting readings from wells treated with 10 µM of a specific LAT1 inhibitor, KYT-0353 (Sigma Aldrich; 0% uptake), from those treated with DMSO (100% uptake). The readings from wells treated with test compounds were fit within this range to estimate the percent uptake.
SGLT1 Uptake Assay
HEK293T cells stably expressing hSGLT1 were generated in-house and were cultured in MEM supplemented with 10% FBS and 1 µg/mL puromycin. Cells were harvested, rinsed, and resuspended in Dulbecco’s phosphate-buffered saline (D-PBS) and plated at 40,000 cells/well in 45 µL/well in 384-well Cytostar-T Plates (PerkinElmer) and incubated at 37 °C for 2 h. Five microliters of 14C AMG (methyl α-d-glucopyranoside; 0.125 µCi/well; PerkinElmer) diluted in D-PBS buffer was added per well, and the plates were sealed and incubated at 37 °C for 10 h at room temperature. Plates were read using a MicroBeta (PerkinElmer) with the 14C SPA standard settings at 15 s/well. The range of uptake was determined by subtracting readings from wells treated with 25 µM phlorizin (0% uptake) from those treated with DMSO (100% uptake). The readings from wells treated with test compounds were fit within this range to estimate the percent uptake.
Xenopus laevis Oocyte Electrophysiological Assay
Defolliculated Xenopus laevis oocytes were purchased from Ecocyte Bioscience (Austin, TX) and plated at one oocyte per well of a 96-well, V-bottom, clear microplate (Nunc) containing 250 µL/well of Barth solution (88 mM NaCl, 2.4 mM NaHCO3, 1 mM KCl, 0.33 mM Ca(NO3)2, 0.41 mM CaCl2, 0.82 mM MgSO4, 5 mM Tris-HCl, pH 7.4, supplemented with 50 µg/mL gentamycin). cRNA for hSLC6A19 or hTMEM27 was in vitro transcribed using as template linearized plasmids containing the appropriate cDNA and the mMessage mMachine kit with T7 primers according to the manufacturer’s instructions. Each oocyte was injected with 20 nL of cRNA mixture at a ratio of 5 ng of hSLC6A19 to 1 ng of hTMEM27 using the RoboInject automated injector (Multi Channel Systems MCS GmbH, Reutlingen, Germany). Negative control oocytes were injected with an equal amount of distilled water. The plate containing the injected oocytes was incubated at 18 °C for 72 h, following which the buffer in the wells was exchanged to ND-96 (93.5 mM NaCl, 2 mM KCl, 1.8 mM CaCl2, 2 mM MgCl2, 5 mM HEPES, pH 7.4). l-Isoleucine-induced currents were measured using the two-electrode voltage clamp (TEVC) method on the HiClamp instrument (Multi Channel Systems MCS GmbH) following the manufacturer’s settings. Briefly, oocytes were held at −100 mV to measure baseline currents, transferred to wells containing appropriate concentrations of test solutions for 1 min, and then transferred to wells containing a combination of test compound and 0.5 mM l-isoleucine for 30 s. The peak current induced by 0.5 mM l-isoleucine with increasing concentrations of the test compound was measured and plotted against the concentration to generate a concentration–response curve.
Data Analysis Software
Percent inhibition data were analyzed using macro-based Excel analysis sheets generated in-house. Dose–response data were plotted using a four-parameter, variable-slope equation without constraints on the curve top and bottom provided in the curve-fitting program Prism (GraphPad Software, La Jolla, CA). The equation was of the form Y = Bottom + (Top – Bottom)/(1 + 10^((LogIC50 − X)*HillSlope)). Screening data were visualized using SpotFire (Tibco Software, Inc., Palo Alto, CA).
Results
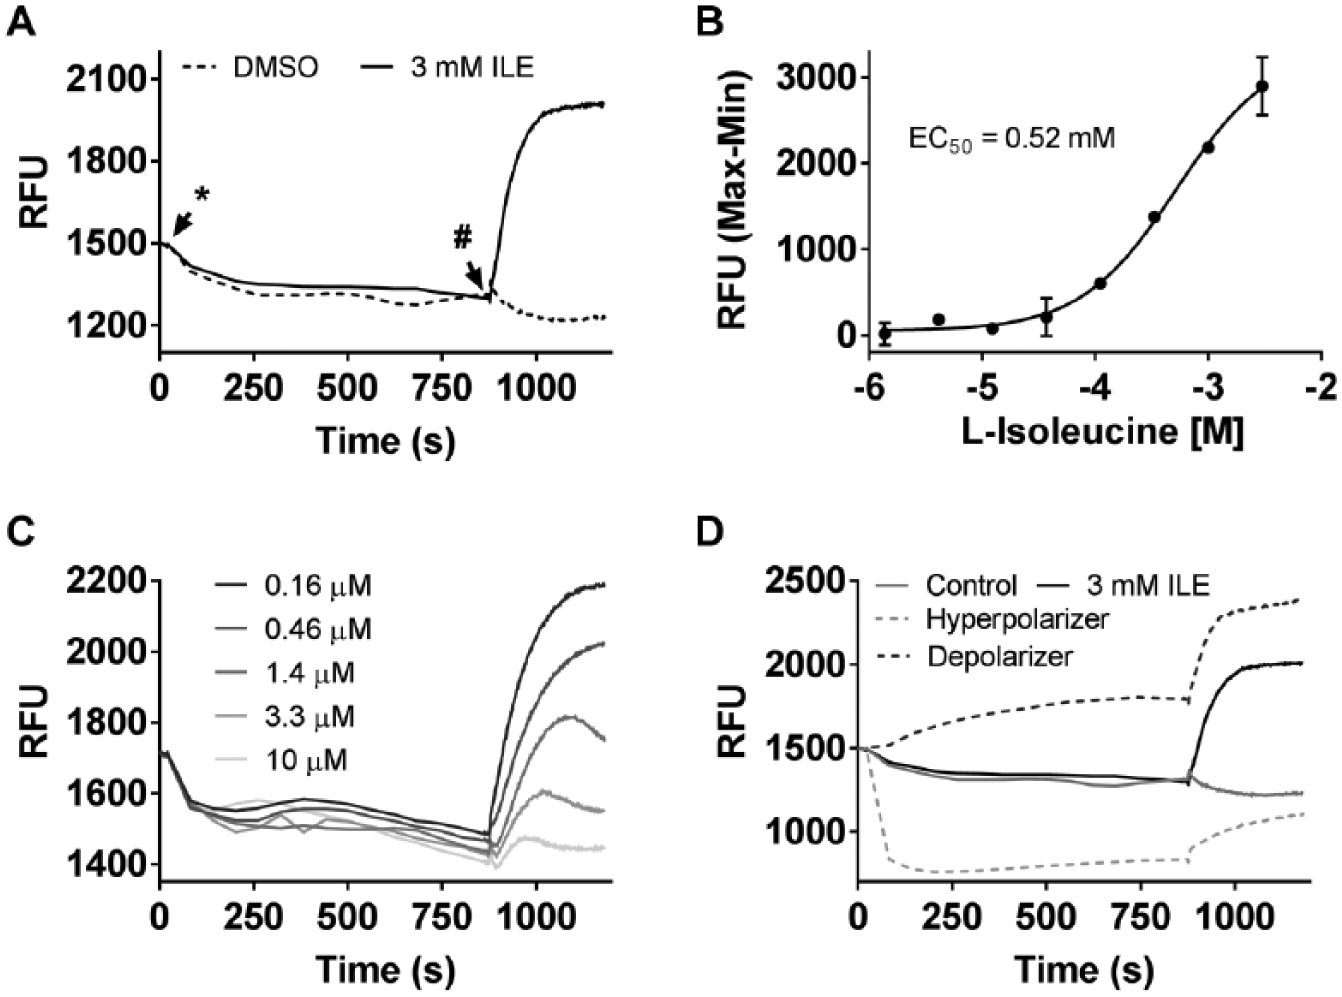
An FMP assay was developed to identify antagonists of the neutral amino acid transporter, SLC6A19, stably expressed along with its obligatory subunit TMEM27 in MDCK cells. SLC6A19 cotransports a molecule of Na+ along with a molecule of the amino acid. The electrogenic net influx of Na+ due to this cotransport results in membrane depolarization, which is measured as an increase in fluorescence of the membrane potential-sensitive dye preloaded in the cells (
Fig. 1A
). Therefore, amino acid-induced membrane depolarization can be used as a surrogate for SLC6A19 activity. Using this assay, a dose–response curve for a neutral amino acid (l-isoleucine) was generated and the EC50 was established to be 0.52 mM (
Fig. 1B
). Similarly, the assay was used to characterize the dose-dependent inhibition of membrane depolarization induced by a fixed concentration (3 mM) of l-isoleucine caused by a reference SLC6A19 inhibitor (
Fig. 1C
). The assay was validated for reproducibility of response over multiple plates and multiple days at three concentrations (high, medium, low) of an internally identified reference inhibitor to make it suitable to screen for SLC6A19 inhibitors at a fixed concentration of 10 µM (data not shown). One of the drawbacks of the FMP assay is the high hit rate associated with a fluorescent membrane potential readout, as several compounds are known to impact the resting membrane potential by various mechanisms in either direction (hyperpolarizers and depolarizers). By tracking the fluorescent baseline upon adding compound and prior to the addition of isoleucine, compounds that impact the membrane potential significantly on their own can be tagged and removed from analysis (
Fig. 1D
).
FMP assay. (A) Assay window between the depolarization caused by the addition of DMSO and 3 mM l-isoleucine. The point of test compound addition is indicated by an *, and addition of 3 mM l-isoleucine is indicated with a #. (B) Dose–response of l-isoleucine-induced membrane depolarization. (C) Representative traces depicting the block of 3 mM l-isoleucine-induced membrane depolarization with 15 min prior incubation with varying doses of an SLC6A19 inhibitor. (D) Representative traces indicating the change in baseline fluorescence upon addition of certain compounds.
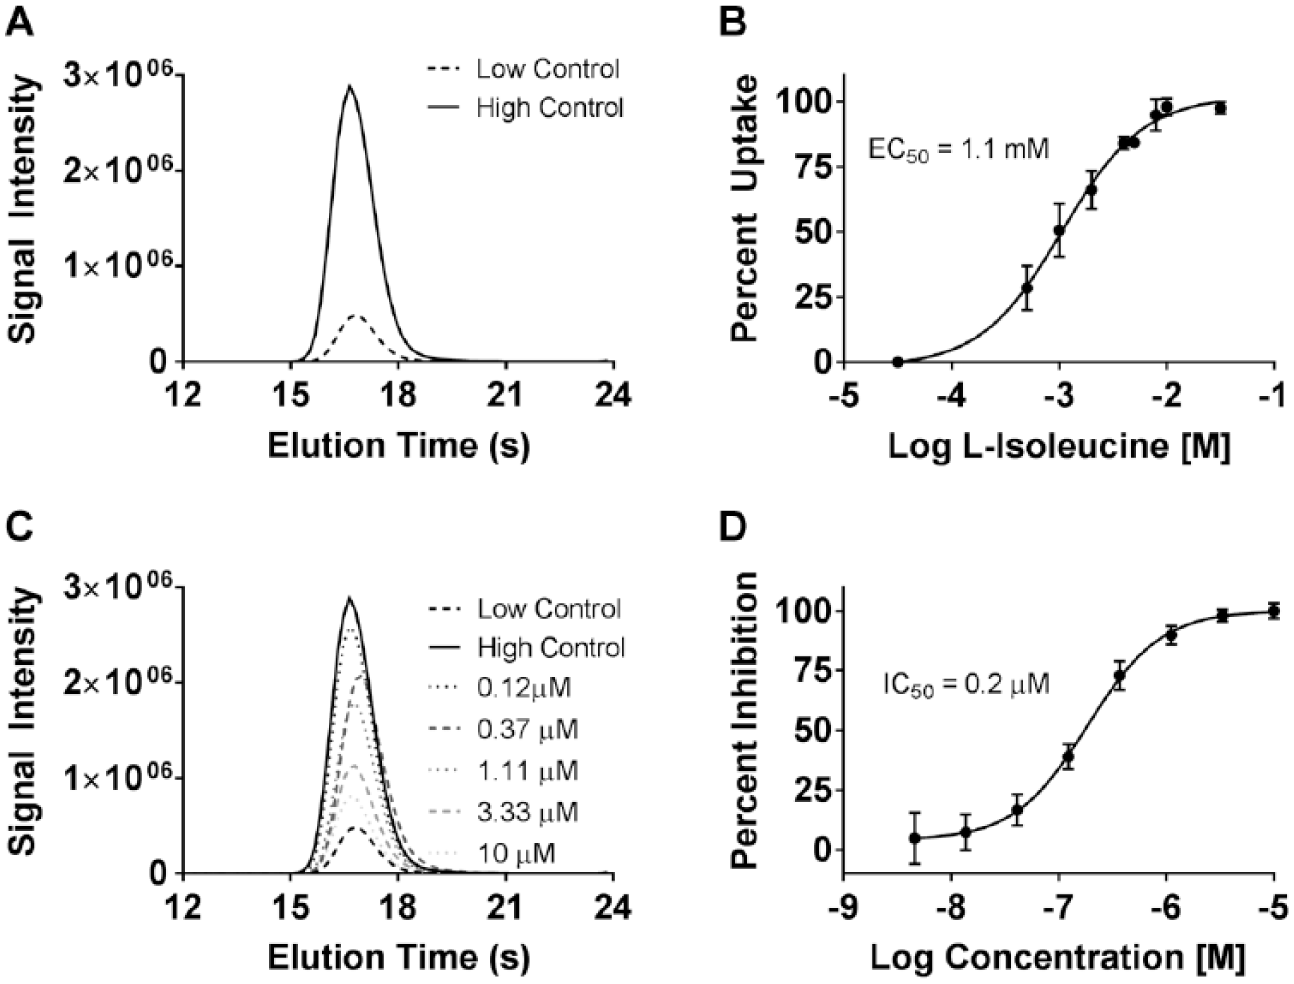
In order to avoid the use of a radioactively labeled isotope of l-isoleucine, a cell-based assay was established to measure the uptake of a stable heavy isotope of l-isoleucine (13C6, 15N-l-isoleucine) in MDCK cells expressing human SLC6A19 and TMEM27. A robust assay window was observed in the specific uptake activity by measuring the amount of stable isotope taken up by the cells using an LC/MS method to detect it in cell lysates (
Fig. 2A
). This method was used to determine the dose-dependent increase of cellular uptake with exposure to increasing concentrations of the stable isotope (
Fig. 2B
). An EC50 of 1.1 mM for isoleucine was obtained, which is in close approximation to that determined using a radioactively labeled isoleucine isotope in a previously published study.13 Preincubation of test cells with SLC6A19 inhibitors could specifically inhibit the stable isotope uptake in a dose-dependent manner (
Fig. 2C
,
D
).
Stable isotope uptake assay. (A) Representative LC/MS chromatograms depicting assay window observed during analysis of cell lysates from cells treated with DMSO control (low) and 2 mM 13C6, 15N-l-isoleucine (high). (B) Dose–response of uptake with increasing concentration of the stable l-isoleucine isotope. (C) Representative LC/MS chromatograms showing a dose-dependent decrease of stable isotope uptake in cells pretreated with an SLC6A19 inhibitor. (D) Sample dose-dependent inhibition curve of an SLC6A19 blocker obtained using the uptake assay.
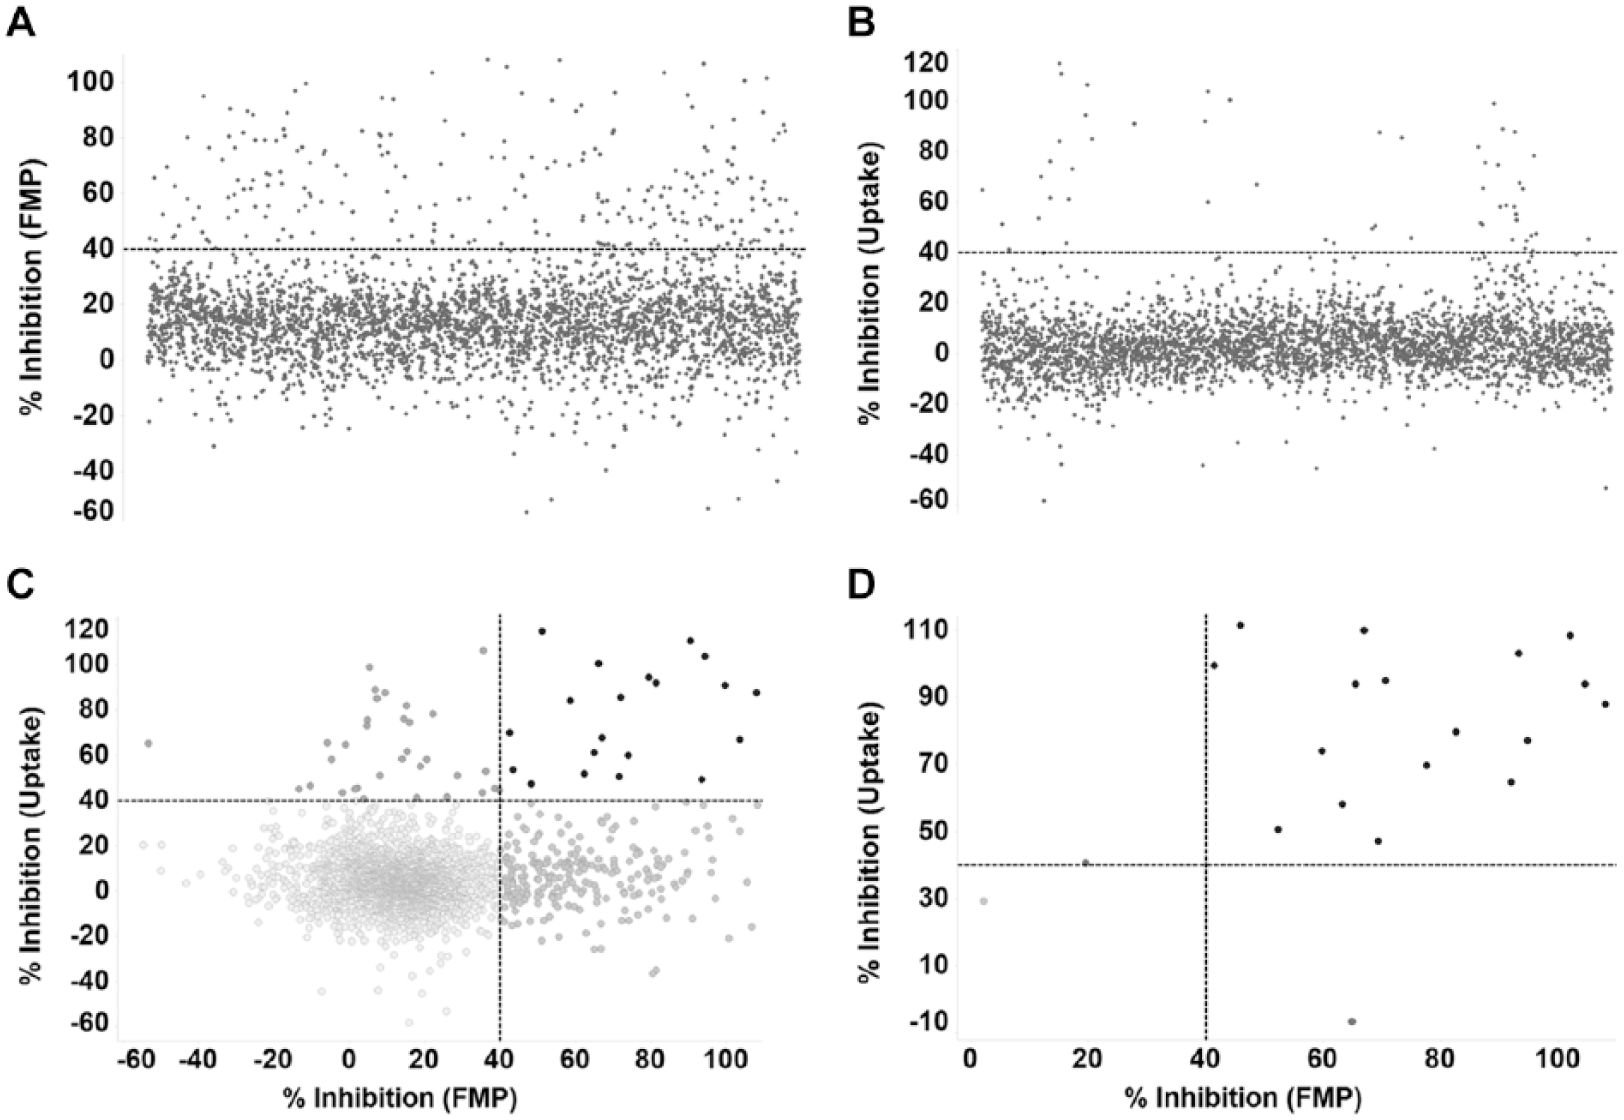
The 3440 compounds from the Microsource Spectrum and TocriScreen collections were tested at 10 µM against hSLC6A19 expressed in conjunction with hTMEM27 in MDCK cells using the FMP assay (
Fig. 3A
). The ability of the compounds to inhibit the depolarization induced by 3 mM l-isoleucine was measured, and compounds with ⩾40% inhibition were designated as “hits.” During this first phase of hit identification, 242 compounds were marked as hits, representing a hit rate of 7%. Simultaneously, the 3440 compounds were also tested in the same cell type using the stable isotope uptake assay, and the ability of compounds at 10 µM to inhibit the uptake of 2 mM of a stable isotope of l-isoleucine (13C6, 15N-l-isoleucine) was measured (
Fig. 3B
). Again, compounds that inhibited ⩾40% of the uptake observed in cells not treated with test compound were designated as hits. Fifty-three compounds were identified as hits, representing a hit rate of 1.5%. Upon evaluating the percent inhibition observed for the same compound in the FLIPR MP assay and the stable isotope uptake assay, only 20 compounds had ⩾40% inhibition in both readouts, for a combined hit rate of 0.6% (
Fig. 3C
). These 20 compounds were cherry-picked and tested at 10 µM, again using the two assay readouts. Seventeen out of 20 compounds were again confirmed to inhibit ⩾40% of the readout in both assays for a combined confirmation rate of 85% (
Fig. 3D
).
Screening of compounds from the Microsource Spectrum and TocriScreen collections. (A,B) Percent activity inhibition by 3440 compounds tested at 10 µM in the FMP and uptake assays, respectively. Compounds with greater than 40% inhibition in each assay were considered hits for that particular assay. (C) Comparison of activity inhibition for all test compounds in the FMP and uptake assays. (D) Comparison of reconfirmation of inhibitory activity of combined hits identified in the FMP and uptake assays.
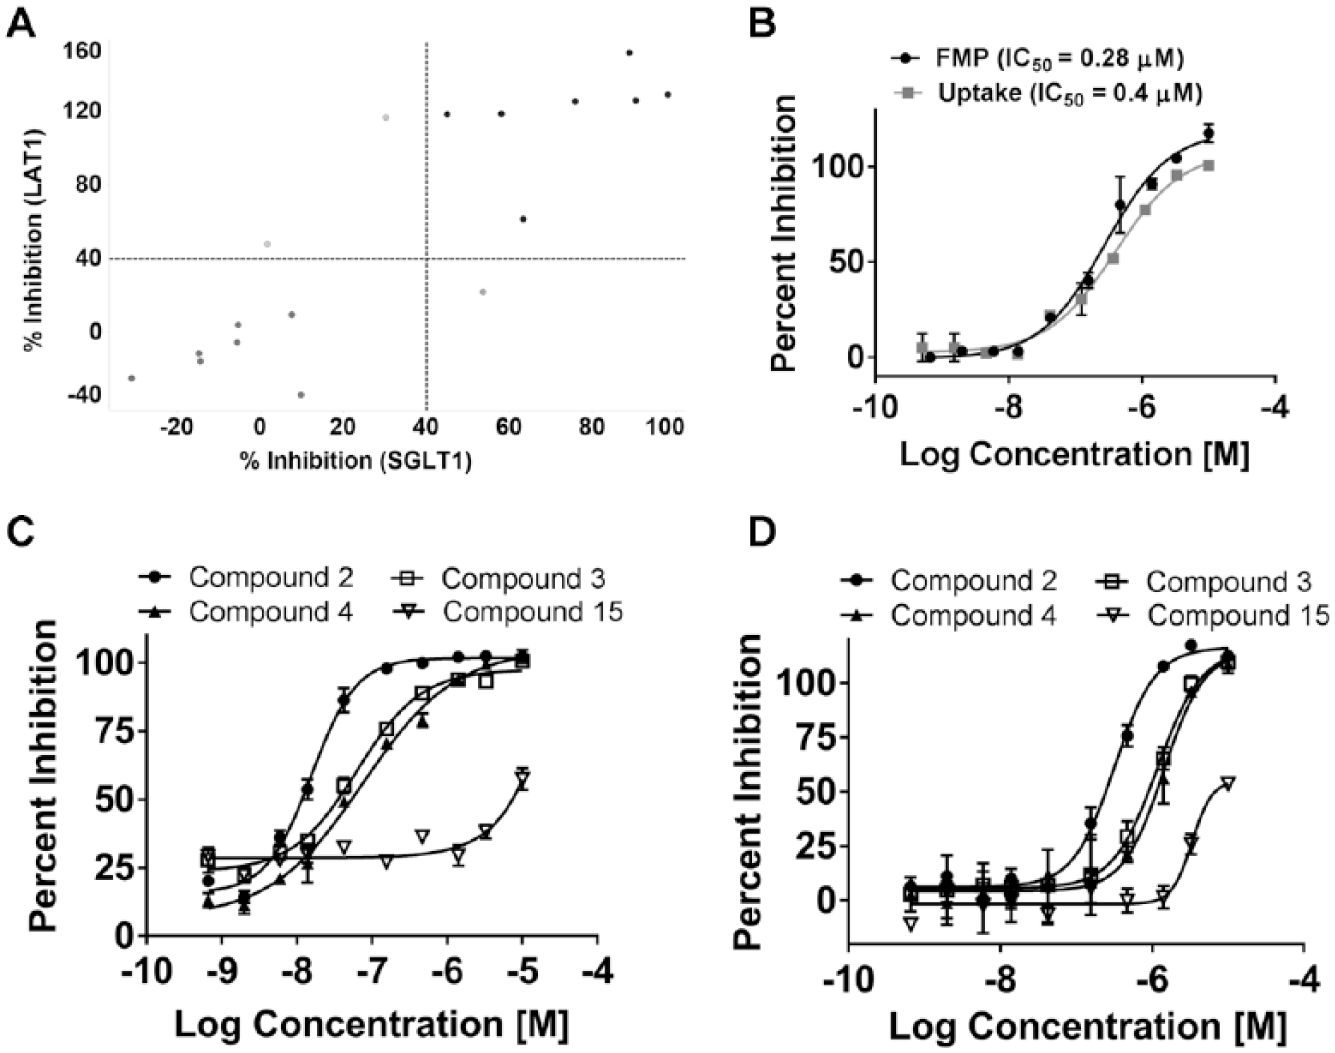
In order to determine selectivity of the identified and confirmed hits to inhibit SLC6A19 activity, the 17 compounds were tested at 10 µM for their ability to inhibit non-sodium-dependent uptake of 14C-labeled l-isoleucine by an amino acid transporter, LAT1, endogenously expressed in HEK293 cells using the scintillation proximity assay (SPA). In addition, the 17 compounds were also tested at 10 µM for their ability to inhibit sodium-dependent uptake of a 14C-labeled analog of glucose (methyl α-d-glucopyranoside) in HEK293 cells stably expressing the human renal glucose transporter SGLT1. Only 7 out of the 17 compounds did not inhibit either LAT1 or SGLT1 uptake by ⩾40% and were considered to be selective for hSLC6A19 (
Fig. 4A
).
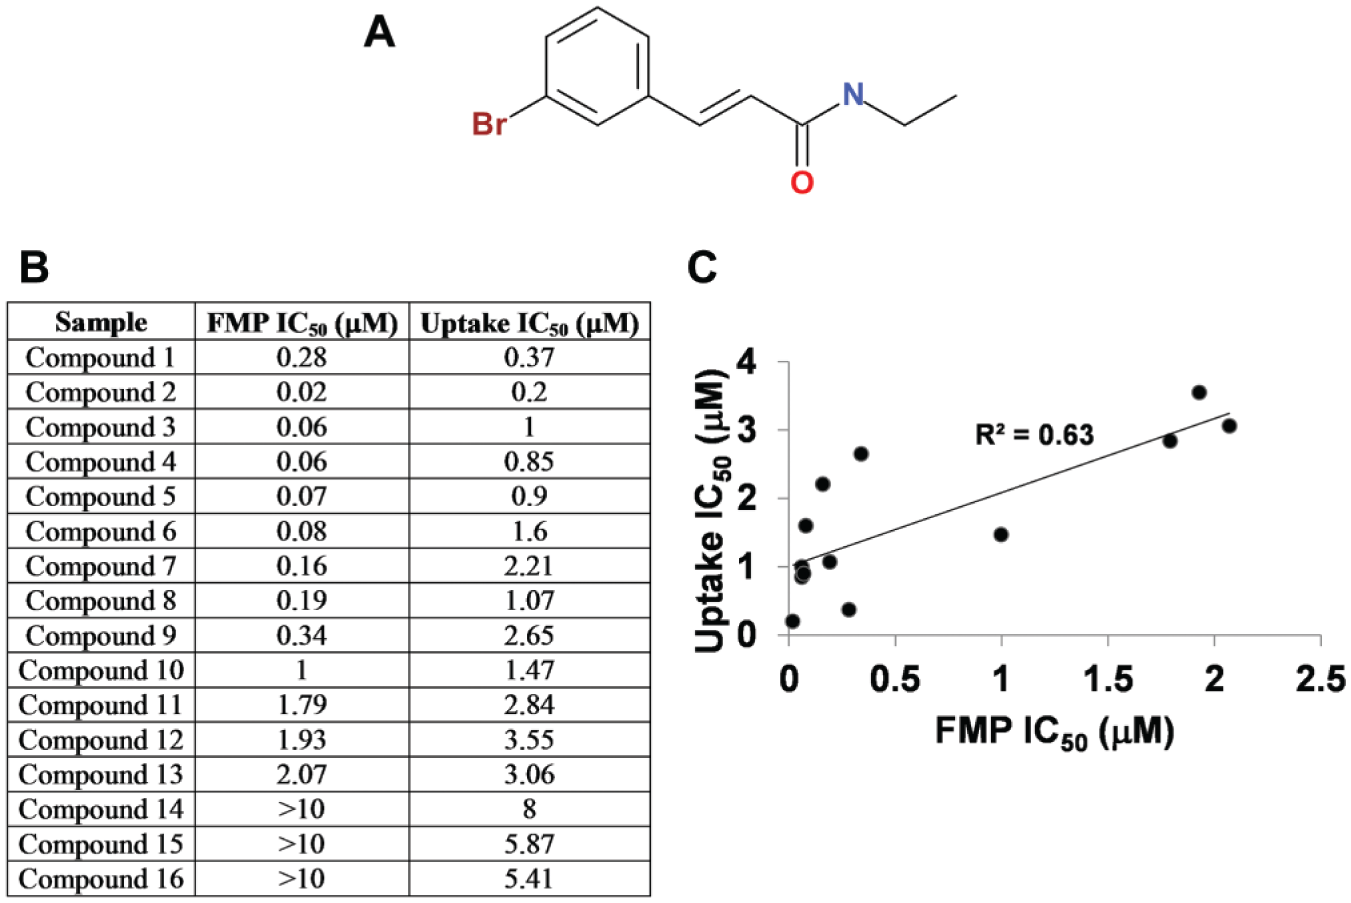
(A) Comparison of inhibitory activity of selected hits against uptake in the LAT1 and SGLT1 assays. (B) Dose-dependent activity of cinromide (compound 1) in the FMP and uptake assays. (C,D) Dose-dependent activity of selected cinromide analogs in the FMP and uptake assays, respectively.
The chemical structures of the seven confirmed hits were evaluated, and only one out of the seven was determined to possess favorable drug-like physicochemical properties. The compound, cinromide (3-bromo-N-ethylcinnamamide), hereby designated as compound 1 (
Fig. 5A
), was therefore the only one selected for further evaluation. Based on a structural similarity query of all compounds carried within the in-house collections, 15 additional structural analogs of cinromide were identified (designated as compounds 2–16) and selected for evaluation of SAR. Cinromide (compound 1) displayed relatively similar IC50 values of 0.28 and 0.37 µM when tested in the FMP and uptake assays, respectively (
Fig. 4B
). The 15 structural analogs displayed a wide range of activities in both the FMP and uptake assays (
Fig. 4C
,
D
). The potencies of all analogs tested in the two assays are summarized in
Figure 5B
. The IC50 values determined using the FMP assay were lower by a margin of 1- to 20-fold than those determined in the uptake assay. However, the rank order of compound potencies determined in each individual assay correlated well (R2 = 0.63;
Fig. 5C
).
(A) Chemical structure of cinromide (compound 1). (B) Potency of structurally related cinromide analogs to inhibit SLC6A19 activity as determined in the FMP and uptake assays. (C) Correlation of IC50 values for cinromide and its analogs determined in the two assays.
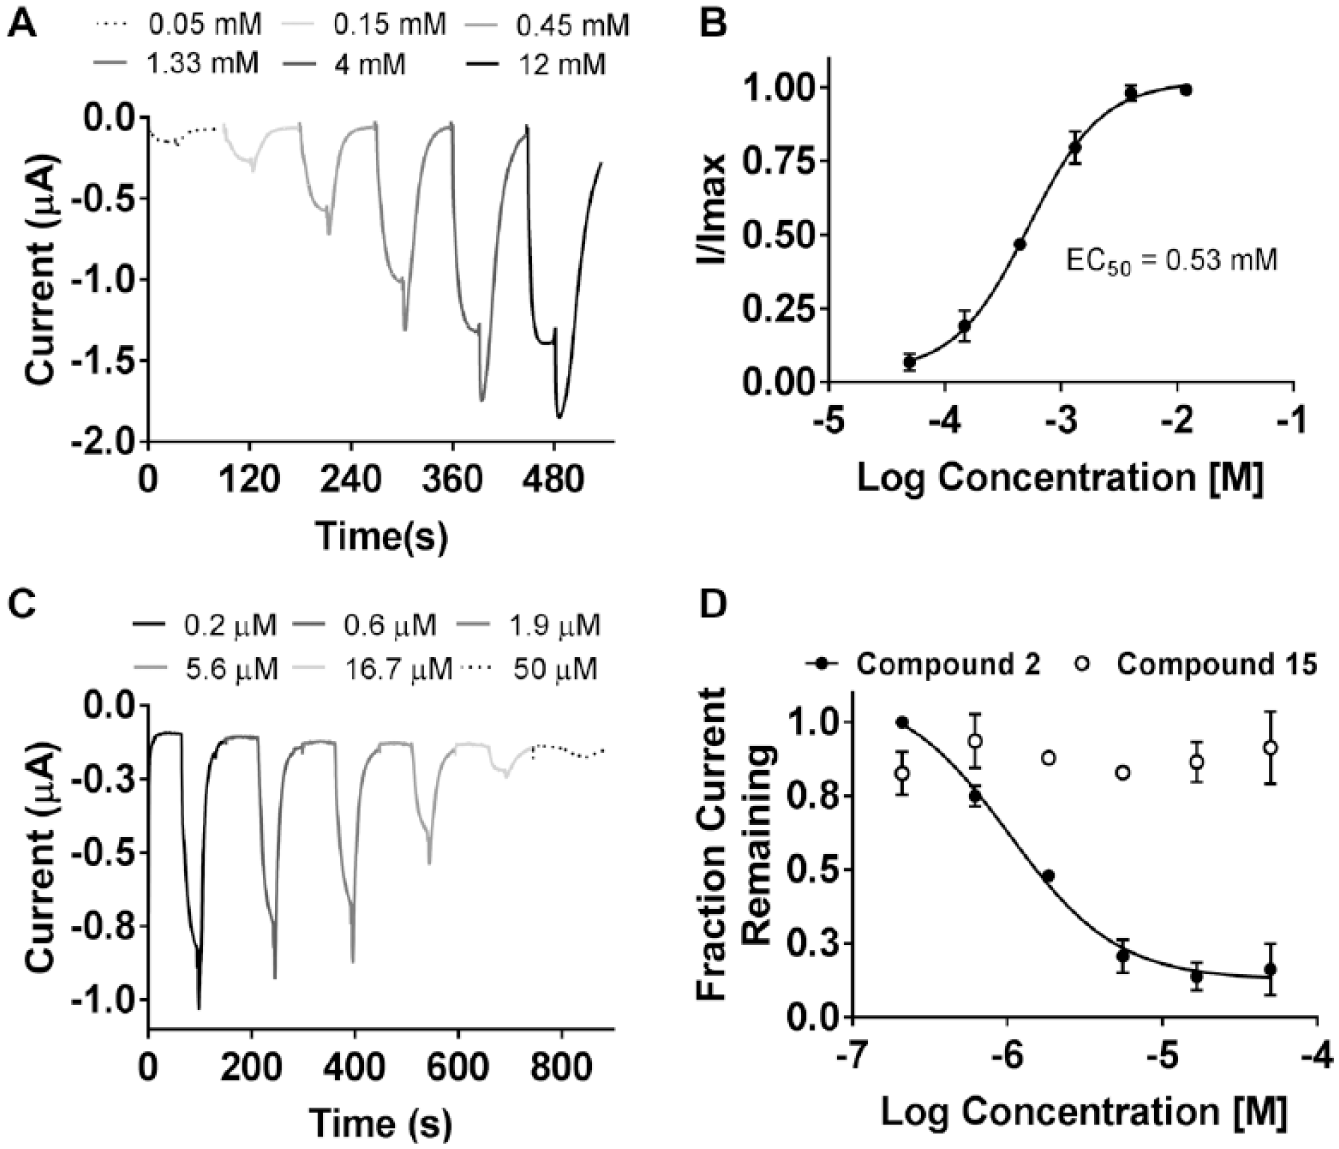
Functional transporter assays in cellular backgrounds are often confounded by the contribution of other related endogenous transporters to the one being investigated. X. laevis oocytes are generally considered ideal backgrounds in which to measure transporter function due to the low level of endogenous transporters. To evaluate the effect of SLC6A19 modulators on transporter function, a TEVC assay was established to measure amino acid (l-isoleucine)-induced inward Na+ currents in X. laevis oocytes injected with cRNA for human SLC6A19 and TMEM27. Seventy-two hours postinjection, a reversible, dose-dependent inward current was detected in oocytes expressing SLC6A19 + TMEM27 when held at −100 mV and upon exposure to l-isoleucine (
Fig. 6A
). This current was not observed in the control, water-injected oocytes (data not shown). Using the TEVC assay, the EC50 for l-isoleucine was determined to be 0.53 mM (
Fig. 6B
), which closely approximates that observed in the cell-based assays described above. Two cinromide analogs of varying potencies (compounds 2 and 15), as determined in the cell-based assays, were selected to evaluate dose-dependent inhibition of 0.5 mM l-isoleucine-induced currents in the TEVC assay (
Fig. 6C
). Although the rank orders of inhibitory potencies were similar to those obtained in the cell-based assays, the IC50 values determined in the TEVC assay were significantly right shifted (
Fig. 6D
). This shift in potency determined by the TEVC assay has been observed before for other transporter and ion channel targets measured using X. laevis oocytes and could be attributed to the large hydrophobic composition of the yolk causing loss of compound and the lack of complete equilibration of the test compound concentration with the oocyte in the automated preset timing of the instrument. However, the inhibitory effect of the cinromide analogs on SLC6A19 transporter function was confirmed, validating the screening and hit selection strategy.
X. laevis TEVC assay. (A) Representative traces showing the dose-dependent increase of inward currents in oocytes expressing human SLC6A19 + TMEM27 upon exposure to increasing concentrations of l-isoleucine. (B) Dose–response curve for l-isoleucine obtained using the TEVC assay. (C) Representative traces indicating a dose-dependent block of 0.5 mM l-isoleucine-induced inward currents in oocytes preincubated with increasing doses of an SLC6A19 inhibitor. (D) Comparison of potencies of selected cinromide analogs in the TEVC assay.
Discussion
Solute carrier transporters (SLC) represent a class of highly attractive drug targets due to their surface expression and singular role in controlling cellular levels of substrates implicated in several diseases.16–18,26 Perhaps the most successful demonstrations of the clinical effectiveness of inhibiting SLC transporter function has been the success of selective serotonin reuptake inhibitors (SSRIs) targeting SLC6A4 (SERT) in treating depression19 and the recent approvals of small-molecule inhibitors of the renal glucose transporter, SLC5A2 (SGLT2), for improving glycemic control in patients with type 2 diabetes.20 Transporter function can be measured in vitro using a variety of functional assay readouts that are commonly employed during drug discovery and development.21 Measuring the uptake of a radioactively labeled substrate in cells expressing the transporter either endogenously or recombinantly is the most commonly used assay for evaluating transporter function and is considered the gold standard. When properly controlled, this uptake assay is rapid, inexpensive, and amenable for high-throughput screening and a direct measure of transporter function. However, the use of radioactive material makes this assay less attractive and alternative methods of evaluating transporter activity are gaining favor. Two such functional assays are described, and their combined use in screening a set of 3440 compounds to identify specific inhibitors of a neutral amino acid transporter, SLC6A19, is described.
The membrane potential assay has been previously applied for evaluating other electrogenic transporters, such as PEPT1,22 GlyT2,23 choline,24 and SLC6A19.13 This assay is robust, reproducible, and adaptable for automation and high-throughput screening. However, the membrane potential readout is associated with a high hit rate and left shift of compound dose–response curves compared with uptake assays. As several parameters can impact the membrane potential, such as compound interaction with endogenous cellular ion channels and G protein-coupled receptors (GPCRs), interaction with membrane potential dye, and the fluorescent nature of some compounds, appropriate controls are necessary. In the screen described above, the FMP assay falsely identified several compounds that are known to increase cAMP levels (forskolin analogs, agonists of endogenous GPCRs like isoproterenol and prostaglandin E2) as potent inhibitors of SLCA19. Therefore, a second assay in which uptake of a stable isotope of isoleucine in the same cells (MDCK expressing SLC6A19 + TMEM27) used in the FMP assay was employed for screening, and only compounds identified as hits in both assays were picked for further characterization.
By using a stable isotope of isoleucine to measure the uptake into cells by SLC6A19, the use of radioactively labeled isotope can be avoided. The uptake assay described here takes advantage of the ability of LC/MS technology to distinguish between the natural isoleucine existing in cell lysates and its mass-shifted heavy stable isotope. It is necessary to spike the cell lysate samples with a constant concentration of another heavy stable analyte (l-leucine-1-13C in this case) and use it to normalize the measurements of the desired analyte to eliminate variations due to analyte handling and instrument variability. As isoleucine uptake in MDCK cells can happen in both an SLC6A19-dependent (+Na+) and SLC6A19-independent (–Na+) manner, it is necessary to normalize the results to a known SLC6A19 reference inhibitor used at a concentration known to block most of the SLC6A19-dependent uptake. The uptake assay described here is also robust, reproducible, and amenable to high-throughput screening.
There were several compounds identified as inhibitors in only the FMP or uptake assays that were not evaluated further as it was unclear if there was a specific mechanism by which compounds could inhibit SLC6A19 function uniquely in one readout only. However, it cannot be ruled out that some specific inhibitors could have been missed by proceeding with a dual-assay filter. To eliminate non-SLC6A19-specific inhibitors, activity against two transporters, LAT1 and SGLT1, was evaluated, as these represent a major non-Na+-dependent amino acid transporter (LAT1) and a Na+-dependent uptake mechanism (SGLT1).
Cinromide was previously clinically tested for its anticonvulsive potential for benefit in epilepsy.25 However, due to less than modest benefit over other marketed anticonvulsants and its associated central nervous system and gastrointestinal toxicity, the compound was not further pursued. These clinical manifestations also preclude the use for cinromide for any physiological use in any SLC6A19 models and at best limit it as a tool compound for in vitro testing. A limited set of structural analogs also showed varying activities against SLC6A19 in the functional assays, indicating that a SAR exists that can be further exploited to improve activity and reduce the adverse effects associated with the parent cinromide.
Footnotes
Acknowledgements
The authors acknowledge and thank Lilu Guo, Cliff Phaneuf, Alla Kloss, and Alexei Belenky from the Predevelopment Sciences Analytical R&D group in Sanofi-Genzyme, Waltham, Massachusetts, for the technical support and guidance provided during the development of the method for the quantification of analytes from cell extracts generated in the uptake assay.
Declaration of Conflicting Interests
The authors declared no potential conflicts of interest with respect to the research, authorship, and/or publication of this article.
Funding
The authors received no financial support for the research, authorship, and/or publication of this article.
References
1.
BröerA.KlingelK.KowalczukS.et al. Molecular Cloning of Mouse Amino Acid Transport System B0, a Neutral Amino Acid Transporter Related to Hartnup Disorder. J. Biol. Chem. 2004, 279, 24467–24476.
2.
BöhmerC.BröerA.MunzingerM.et al. Characterization of Mouse Amino Acid Transporter B0AT1 (slc6a19). Biochem. J. 2005, 389, 745–751.
3.
DanilczykU.SaraoR.RemyC.et al. Essential Role for Collectrin in Renal Amino Acid Transport. Nature2006, 444, 1088–1091.
4.
MalakauskasS. M.QuanH.FieldsT. A.et al. Aminoaciduria and Altered Renal Expression of Luminal Amino Acid Transporters in Mice Lacking Novel Gene Collectrin. Am. J. Physiol. Renal Physiol. 2007, 292, F533–F544.
5.
KowalczukS.BröerA.TietzeN.et al. A Protein Complex in the Brush-Border Membrane Explains a Hartnup Disorder Allele. FASEB J. 2008, 22, 2880–2887.
6.
FairweatherS. J.BröerA.O’MaraM. L.et al. Intestinal Peptidases Form Functional Complexes with the Neutral Amino Acid Transporter B(0)AT1. Biochem, J. 2012, 446, 135–148.
7.
SingerD.CamargoS. M.Collectrin and ACE2 in Renal and Intestinal Amino Acid Transport. Channels (Austin)2011, 5, 410–423.
8.
BröerS.The SLC6 Orphans Are Forming a Family of Amino Acid Transporters. Neurochem. Int. 2006, 48, 559–567.
9.
BröerS.GetherU.The Solute Carrier 6 Family of Transporters. Br. J. Pharmacol. 2012, 167, 256–278.
10.
SeowH. F.BroerS.BroerA.et al. Hartnup Disorder Is Caused by Mutations in the Gene Encoding the Neutral Amino Acid Transporter SLC6A19. Nat. Genet. 2004, 36, 1003–1007.
11.
KletaR.RomeoE.RisticZ.et al. Mutations in SLC6A19, Encoding B0AT1, Cause Hartnup Disorder. Nat. Genet. 2004, 36, 999–1002.
12.
JiangY.RoseA. J.SijmonsmaT. P.et al. Mice Lacking Neutral Amino Acid Transporter B(0)AT1 (Slc6a19) Have Elevated Levels of FGF21 and GLP-1 and Improved Glycaemic Control. Mol. Metab. 2015, 4, 406–417.
13.
ChengQ.ShahN.BröerA.et al. Identification of Novel Inhibitors of the Amino Acid Transporter B(0)AT1 (SLC6A19), a Potential Target to Induce Protein Restriction and to Treat Type-2 Diabetes. Br. J. Pharmacol. 2017, 174, 468–482.
BröerA.JuelichT.VanslambrouckJ. M.et al. Impaired Nutrient Signaling and Body Weight Control in a Na+ Neutral Amino Acid Cotransporter (Slc6a19)-Deficient Mouse. J. Biol. Chem. 2011, 286, 26638–26651.
16.
LinL.YeeS. W.KimR. B.et al. SLC Transporters as Therapeutic Targets: Emerging Opportunities. Nat. Rev. Drug Discov. 2015, 14, 543–560.
17.
César-RazquinA.SnijderB.Frappier-BrintonT.et al. A Call for Systematic Research on Solute Carriers. Cell2015, 162, 478–487.
18.
HedigerM. A.ClémençonB.BurrierR. E.et al. The ABCs of Membrane Transporters in Health and Disease (SLC Series). Mol. Aspects Med. 2013, 34, 95–107.
ScheenA. J.SGLT2 Inhibition: Efficacy and Safety in Type 2 Diabetes Treatment. Expert Opin. Drug Saf. 2015, 14, 1879–1904.
21.
BrouwerK. L.KepplerD.HoffmasterK. A.et al. International Transporter Consortium. In Vitro Methods to Support Transporter Evaluation in Drug Discovery and Development. Clin. Pharmacol. Ther. 2013, 94, 95–112.
22.
FariaT. N.TimoszykJ. K.StouchT. R.et al. A Novel High-Throughput PepT1 Transporter Assay Differentiates between Substrates and Antagonists. Mol. Pharm. 2004, 1, 67–76.
23.
BenjaminE. R.SkeltonJ.HanwayD.et al. Validation of a Fluorescent Imaging Plate Reader Membrane Potential Assay for High-Throughput Screening of Glycine Transporter Modulators. J. Biomol. Screen. 2005, 10, 365–373.
24.
RuggieroA. M.WrightJ.FergusonS. M.et al. Nonoisotopic Assay for the Presynaptic Choline Transporter Reveals Capacity for Allosteric Modulation of Choline Uptake. ACS Chem. Neurosci. 2012, 3, 767–781.
25.
WilenskyA. J.OjemannL. M.FrielP. N.et al. Cinromide in Epilepsy: A Pilot Study. Epilepsia1983, 24, 401–409.
26.
BröerS.Amino Acid Transporters as Disease Modifiers and Drug Targets. SLAS Discov. 2018, 23, 303–320.