
Abstract
Both glycolysis and mitochondrial energetics are targets of interest for developing antiproliferative cancer therapeutics. We developed a novel multiple-read assay based on long-term expression in K562 cells of a genetically encoded intramolecular Förster resonance energy transfer sensor for adenosine triphosphate (ATP). The assay, conducted in a fluorescent plate reader, can identify compounds that inhibit oxidative phosphorylation-dependent ATP production, glycolysis, or both after short-term treatment. We screened a National Cancer Institute (NCI) compound library, identifying inhibitors of oxidative phosphorylation-dependent ATP production and glycolysis. Three glycolysis inhibitors blocked hexokinase activity, demonstrating that our assay can serve as the initial step in a workflow to identify compounds that inhibit glycolysis via a defined desired mechanism. Finally, upon reviewing the literature, we found surprisingly little evidence that inhibiting glycolysis with small molecules is antiproliferative. Using NCI data on proliferation of K562 cells, we found that inhibitors of oxidative phosphorylation-dependent ATP production were no more antiproliferative than the overall library, whereas all glycolysis inhibitors were in the top third of most effective antiproliferative compounds. Our results thus present a powerful new way to screen for compounds that affect cellular metabolism and also provide important support for the idea that blocking glycosis is antiproliferative.
Keywords
Introduction
Attention has recently returned to cancer cell metabolism as a target for development of small-molecule antiproliferatives. 1 Many cancer cells obtain most of their adenosine triphosphate (ATP) from glycolysis even when oxygen is available, a phenomenon known as the Warburg effect. There is considerable interest in this phenomenon as a potential target for antiproliferative small-molecule therapeutic development.1–4 At the same time, there is significant interest in targeting oxidative phosphorylation, either alone or as an adjunct to glycolysis inhibition.5,6
While in vitro assays using purified glycolytic enzymes or transporters can be performed to identify novel inhibitors (e.g., ref. 7), a powerful alternate strategy that has emerged recently to screen for inhibitors of glucose transporter (GLUT) transporters uses cell-based ATP measurements as a primary screen.8,9 In these efforts, a combinatorial approach is taken: oxidative phosphorylation is blocked with inhibitors, and compounds that suppress remaining ATP production are considered to be putative GLUT inhibitors and tested for this activity. Luciferase, which is most commonly used as a viability/proliferation measure, has been used to measure ATP levels in these efforts. The main advantage of cell-based approaches to glycolysis inhibitor discovery is that compounds identified are essentially guaranteed to be active in the cellular context. This is not the case for compounds discovered using cell-free biochemical approaches, which must be assessed in follow-up experiments for cellular efficacy.
The past several decades have seen an explosion in the use of genetically encoded sensors based on Förster resonance energy transfer (FRET) in basic cell biology research (see ref. 10 for a recent review). These sensors have seen relatively little use in screening, likely because there is a misperception that the signals they generate are too small to be useful. Imamura et al. 11 developed a sensor for intracellular ATP levels based on cyan fluorescent protein (CFP) and yellow fluorescent protein (YFP) fused at the N and C termini, respectively, of the epsilon subunit of a Bacillus subtilis F0F1-ATP synthase that reports ATP levels in the physiological range. We expressed ATeam in long-term K562 transfectants and used the cells to develop a novel 96-well multiple-read assay that can identify compounds that after short-term treatment inhibit oxidative phosphorylation-dependent ATP production, glycolysis, or both. We tested the effects of glycolysis inhibitors on hexokinase (HK) activity, identifying three novel inhibitors, which demonstrates that our assay can serve as the initial step in a screening campaign to identify compounds that inhibit specific glycolytic enzymes or transporters of interest. We believe that our assay will be of use to researchers who want to find either glycolysis inhibitors or inhibitors of oxidative phosphorylation and wish to exclude the other activity during the initial screen or, alternatively, researchers who want to find compounds that affect metabolism by either mechanism. Finally, we used National Cancer Institute (NCI) data to examine effects of metabolically active compounds on cellular proliferation. We found that inhibitors of oxidative phosphorylation-dependent ATP production were no more antiproliferative than the overall library, whereas all glycolysis inhibitors were in the top third of most effective antiproliferative compounds. This provides important support that is currently lacking for the idea that glycolysis inhibition is an effective means of blocking proliferation.
Materials and Methods
Cells, Constructs, and Reagents
K562 cells were obtained from ATCC (Manassas, VA) and cultured in Iscove’s medium containing 10% newborn calf serum, 1% penicillin-streptavidin, and 1% L-glutamine. Additional cell lines tested in
FRET Measurements and Screening
A Molecular Devices SpectraMax i3x plate reader (Sunnyvale, CA) was used to measure the fluorescence of cells expressing ATeam and FLII 12 pGLU-600µ in three channels: CFP (450/9 nm excitation, 485/15 nm emission), FRET (450/9 nm excitation, 535/15 nm emission), and YFP (485/9 nm excitation, 535/15 nm emission). For screening with ATeam, cells were washed in glucose-free Ringer’s and added to flat-bottomed Greiner half-area 96-well plates, with ~100,000 cells in 100 µL per well. One microliter of DMSO or 1 µL test compounds at 1 mM was added to wells, producing a final compound concentration of 10 µM. After addition of cells, plates were vortexed and incubated for 30 min at 37 °C in a humidified CO2 incubator.
The following equation was used to calculate FRET ratios

where FRETc and CFPc are the fluorescence intensities of cells and FRETb and CFPb are the background fluorescence intensities of wells containing 100 µL Ringer’s solution.
The FRET ratio was determined from cells treated with glucose but not Na azide (P), treated with compounds (C), or treated with Na azide but not glucose (N), and percentage inhibition is defined as

Percentage inhibition of oxidative phosphorylation-dependent ATP level was determined from read 1, whereas percentage inhibition of glycolysis-dependent ATP level was determined from read 3.
Generating Responses Representing Four Compound Classes
No effect on ATP production. Cells were washed with 0 glucose solution and then treated with sodium azide, then glucose.
Inhibition of oxidative phosphorylation-dependent ATP production. Cells were treated with 5 mM oligomycin, then sodium azide, then glucose.
Glycolysis inhibition. Cells were washed with 0 glucose solution, then treated with sodium azide.
Inhibition of both glycolysis and oxidative phosphorylation-dependent ATP production. Cells were treated with 5 mM oligomycin, then sodium azide.
Hit Confirmation by Cell-Titer Glo
Cells were washed in glucose-free Ringer’s and incubated with DMSO or test compounds for 30 min at 37 °C. Fifty microliters of Titer Glo reagent was added to 50 µL of cells (10,000 cells per well), mixed, and incubated for 10 min. Luminescence was measured on the Spectramax i3x plate reader.
HK Activity Assay
K562 cells (50,000 cells per condition) were lysed with supplied lysis buffer, and 25 µL of cell lysate was incubated with DMSO or test compounds for 10 min at room temperature. Twenty-five microliters of reaction mix (freshly prepared according to the manufacturer’s protocol) was added, and absorbance at 450 nm was measured on the plate reader in kinetic mode. A standard curve of NADH was used to convert deltaOD450 to HK activity.
Dose-Response Measurements
Compounds that were confirmed active in a repeat of the primary assay were resupplied from NCI in powder and dissolved in DMSO. Concentrations between 0.1 and 10 µM were tested at twofold dilutions on cells. Percentage inhibition data were fitted to the Hill equation as described previously.
Statistical Analysis
Effects of compounds on proliferation were analyzed using nonparametric analysis of variance (ANOVA; Kruskal-Wallis test). Data were not paired, and Dunn’s correction for multiple comparisons was applied. Prism 7 software (Graphpad Software, Inc., La Jolla, CA) was used to perform the test.
Results
Assessing the Metabolic Phenotype of K562 Cells Using a Genetically Encoded FRET Sensor for ATP
We generated long-term transfectant K562 cells expressing ATeam, a genetically encoded FRET sensor for ATP, 11 by transfecting cells and then sorting them based on YFP expression ~2 wk and ~4 wk posttransfection. Although we did not clone cells, this procedure gives rise to cells that express the sensor in a temporally stable fashion. Figure 1 shows a characterization of the long-term transfectants using flow cytometry. ATeam is expressed at high levels, as demonstrated by the YFP fluorescence histogram ( Fig. 1B ). To assess signal amplitude, we compared two conditions. Cells were incubated in the presence of 20 mM glucose to generate a high-ATP signal ( Fig. 1D ) or washed in glucose-free solution and treated with Na-azide to deplete ATP and generate a low-ATP signal ( Fig. 1C ). FRET ratios were higher in cells when glucose was present, and the capacity for oxidative phosphorylation was more intact than in the absence of glucose and the presence of azide.
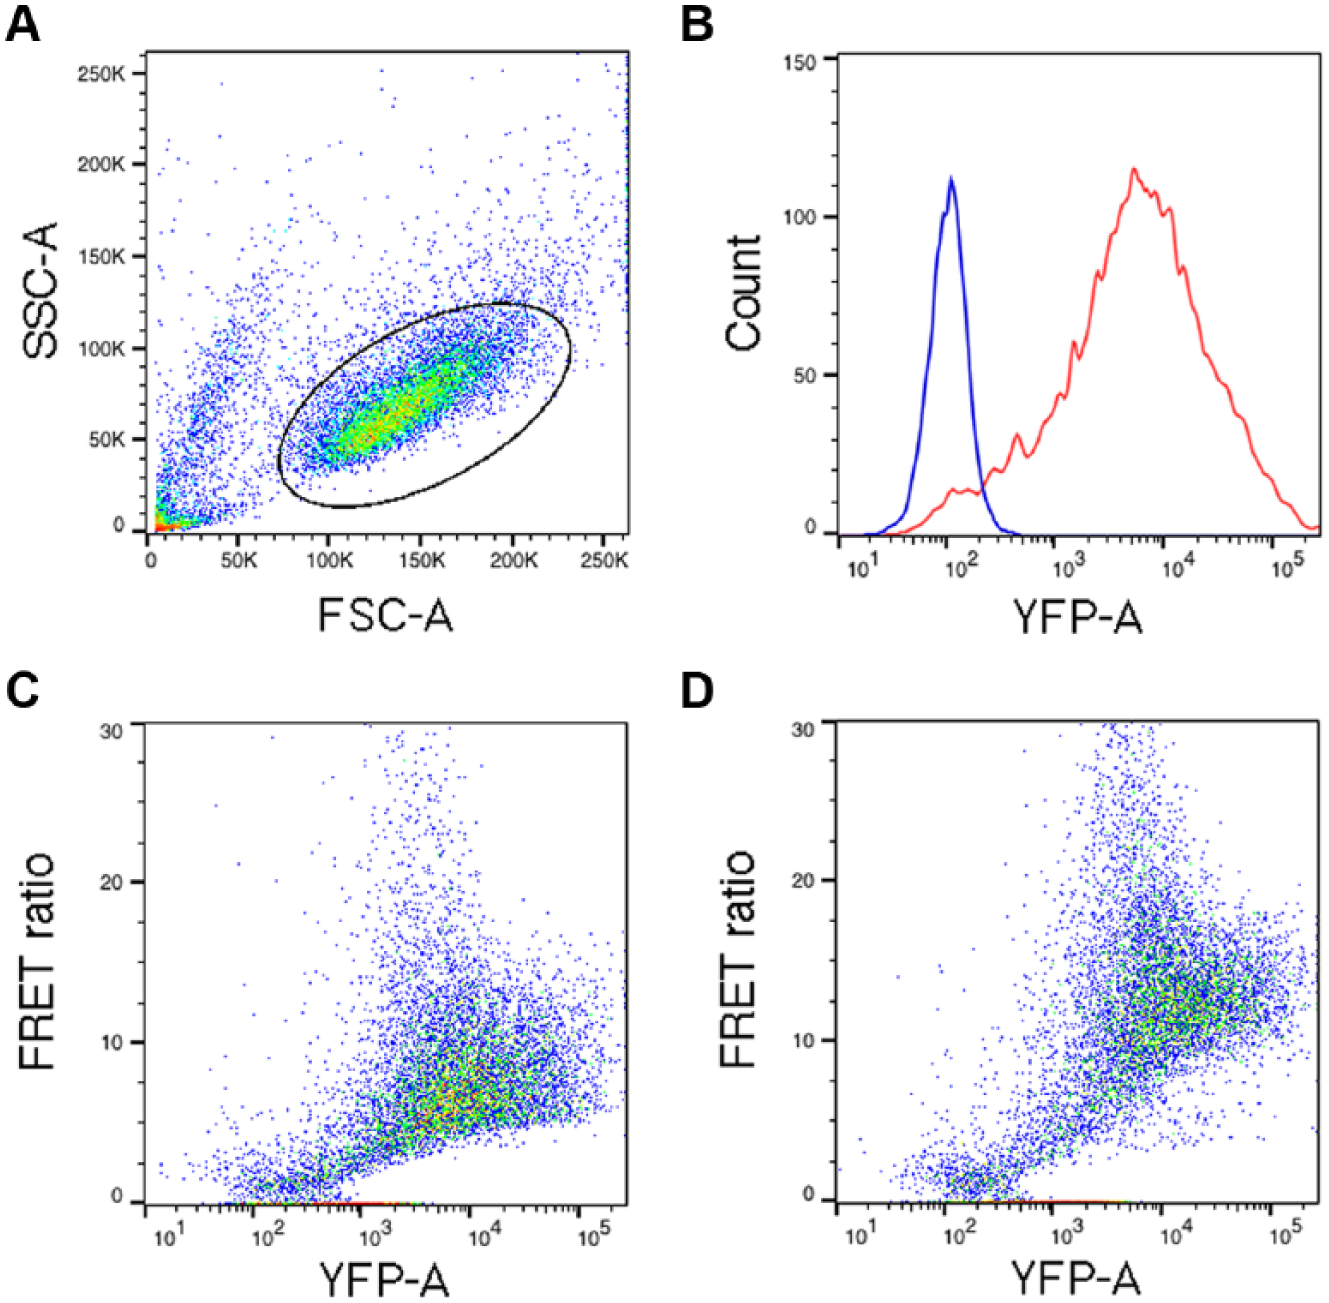
Förster resonance energy transfer (FRET) measurements with a genetically-encoded adenosine triphosphate (ATP) sensor in K562 cells using flow cytometry. (
Although we had previously used flow cytometry to measure intramolecular FRET signals for screening, 13 expression levels of those sensors were not particularly high, and the FRET ratio changes were fairly small. The high levels of expression in the ATeam cells together with the sensor’s relatively large dynamic ratio encouraged us to explore whether signals could be measured using a standard fluorescence plate reader. We found that using ~105 cells/well, we could obtain signals in both the FRET and CFP channels that were ~10-fold higher than background ( Fig. 2Ai and ii ). Although there was variation in the signal level between wells that likely reflects variation in the number of cells, when we computed the FRET ratio (FRET/CFP; Fig. 2Aiii ), variability decreased markedly, as expected.
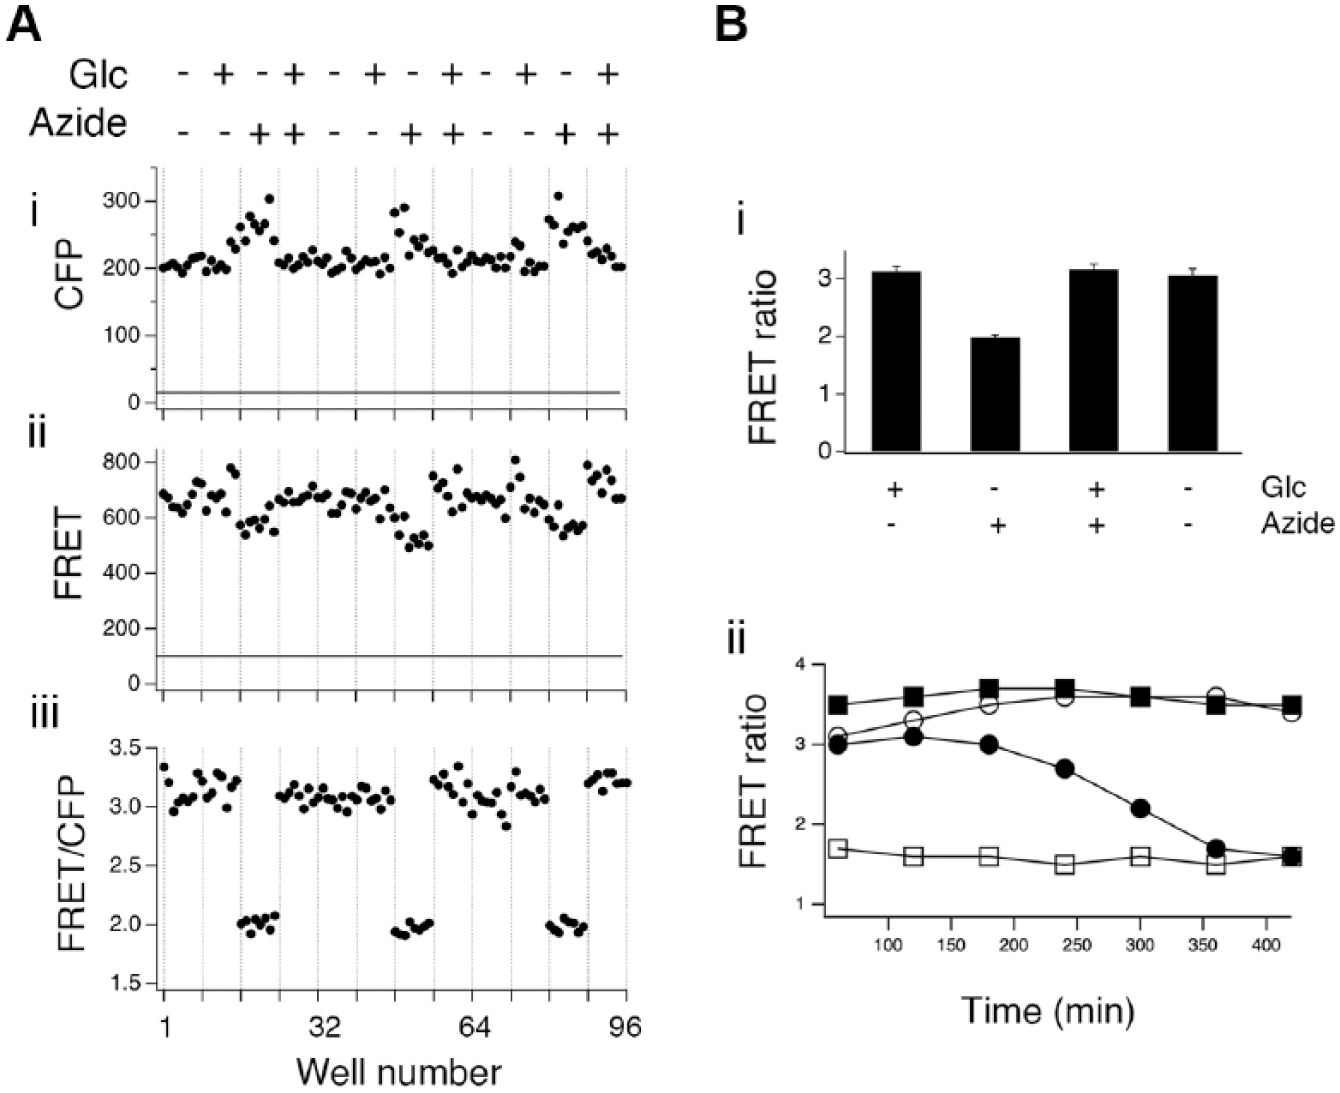
Measuring ATeam Förster resonance energy transfer (FRET) using a plate reader. (
We used the ATeam-expressing cells and the plate reader to characterize the metabolic activity of K562 cells (
Fig. 2Bi
). As was seen using flow cytometry, ATP levels were high in cells when glucose was present and oxidative phosphorylation was not inhibited. ATP levels remained high if oxidative phosphorylation was inhibited by adding azide, provided glucose was present. ATP levels fell only when azide was added and glucose was removed. As azide and glucose removal might be seen by some as nonspecific means of altering metabolism, we tested the effects of using oligomycin to inhibit oxidative phosphorylation and 2-deoxyglucose (2-DG) to inhibit glycolysis. For these experiments, extracellular glucose was reduced to 5 mM, as 2-DG competes with glucose for entry via GLUT transporters. Identical results to those observed with azide and glucose-free solution were obtained using oligomycin in combination with 2-DG (
Identifying Metabolically Active Compounds in the NCI Mechanistic Set
We designed a three-step assay protocol based on the results of Figure 2 and the previous work of Ulanovskaya et al. 8 and Sibeneicher et al. 9 to identify compounds that inhibit glycolysis, oxidative-phosphorylation dependent ATP production, or both ( Fig. 3 ). We first washed cells in glucose-free solution and measure FRET ratio (read 1) to identify compounds that inhibit glucose-independent oxidative phosphorylation-dependent ATP production. ATP is high under these conditions unless oxidative phosphorylation is inhibited. We then added azide to block respiratory complex IV and deplete ATP in all samples. Plates are read again (read 2) after ~20 min to reveal compounds that affect FRET ratios via fluorescence artifacts and confirm azide efficacy. Finally, 20 mM glucose is added to initiate glycolysis, and plates are read again after an additional 20 min (read 3). Glycolysis inhibitors will prevent ATP from increasing after glucose addition. Note that using this protocol, we would not be able to identify compounds that inhibit oxidative phosphorylation-dependent ATP production or glycolysis with a delayed mechanism of action. Figure 3A shows a test plate treated using this protocol. Reponses were robust, and there was excellent separation between the signals, consistent with the hypothesis that an assay based on this protocol can be used for screening 96-well plates. When assessed using standard assay performance metrics, 14 we routinely obtained values Z′ > 0.5. For the plate shown, the Z′ calculated from 80 wells comparing incubation in glucose-free saline to incubation in glucose-free saline + azide was 0.79. As described below, these conditions correspond to what is expected for inhibitors of oxidative phosphorylation-dependent ATP production. The Z′ calculated from 80 wells comparing incubation in glucose-free saline + azide to 20 mM glucose + azide was 0.82. As described below, these conditions correspond to what is expected for inhibitors of glycolysis.
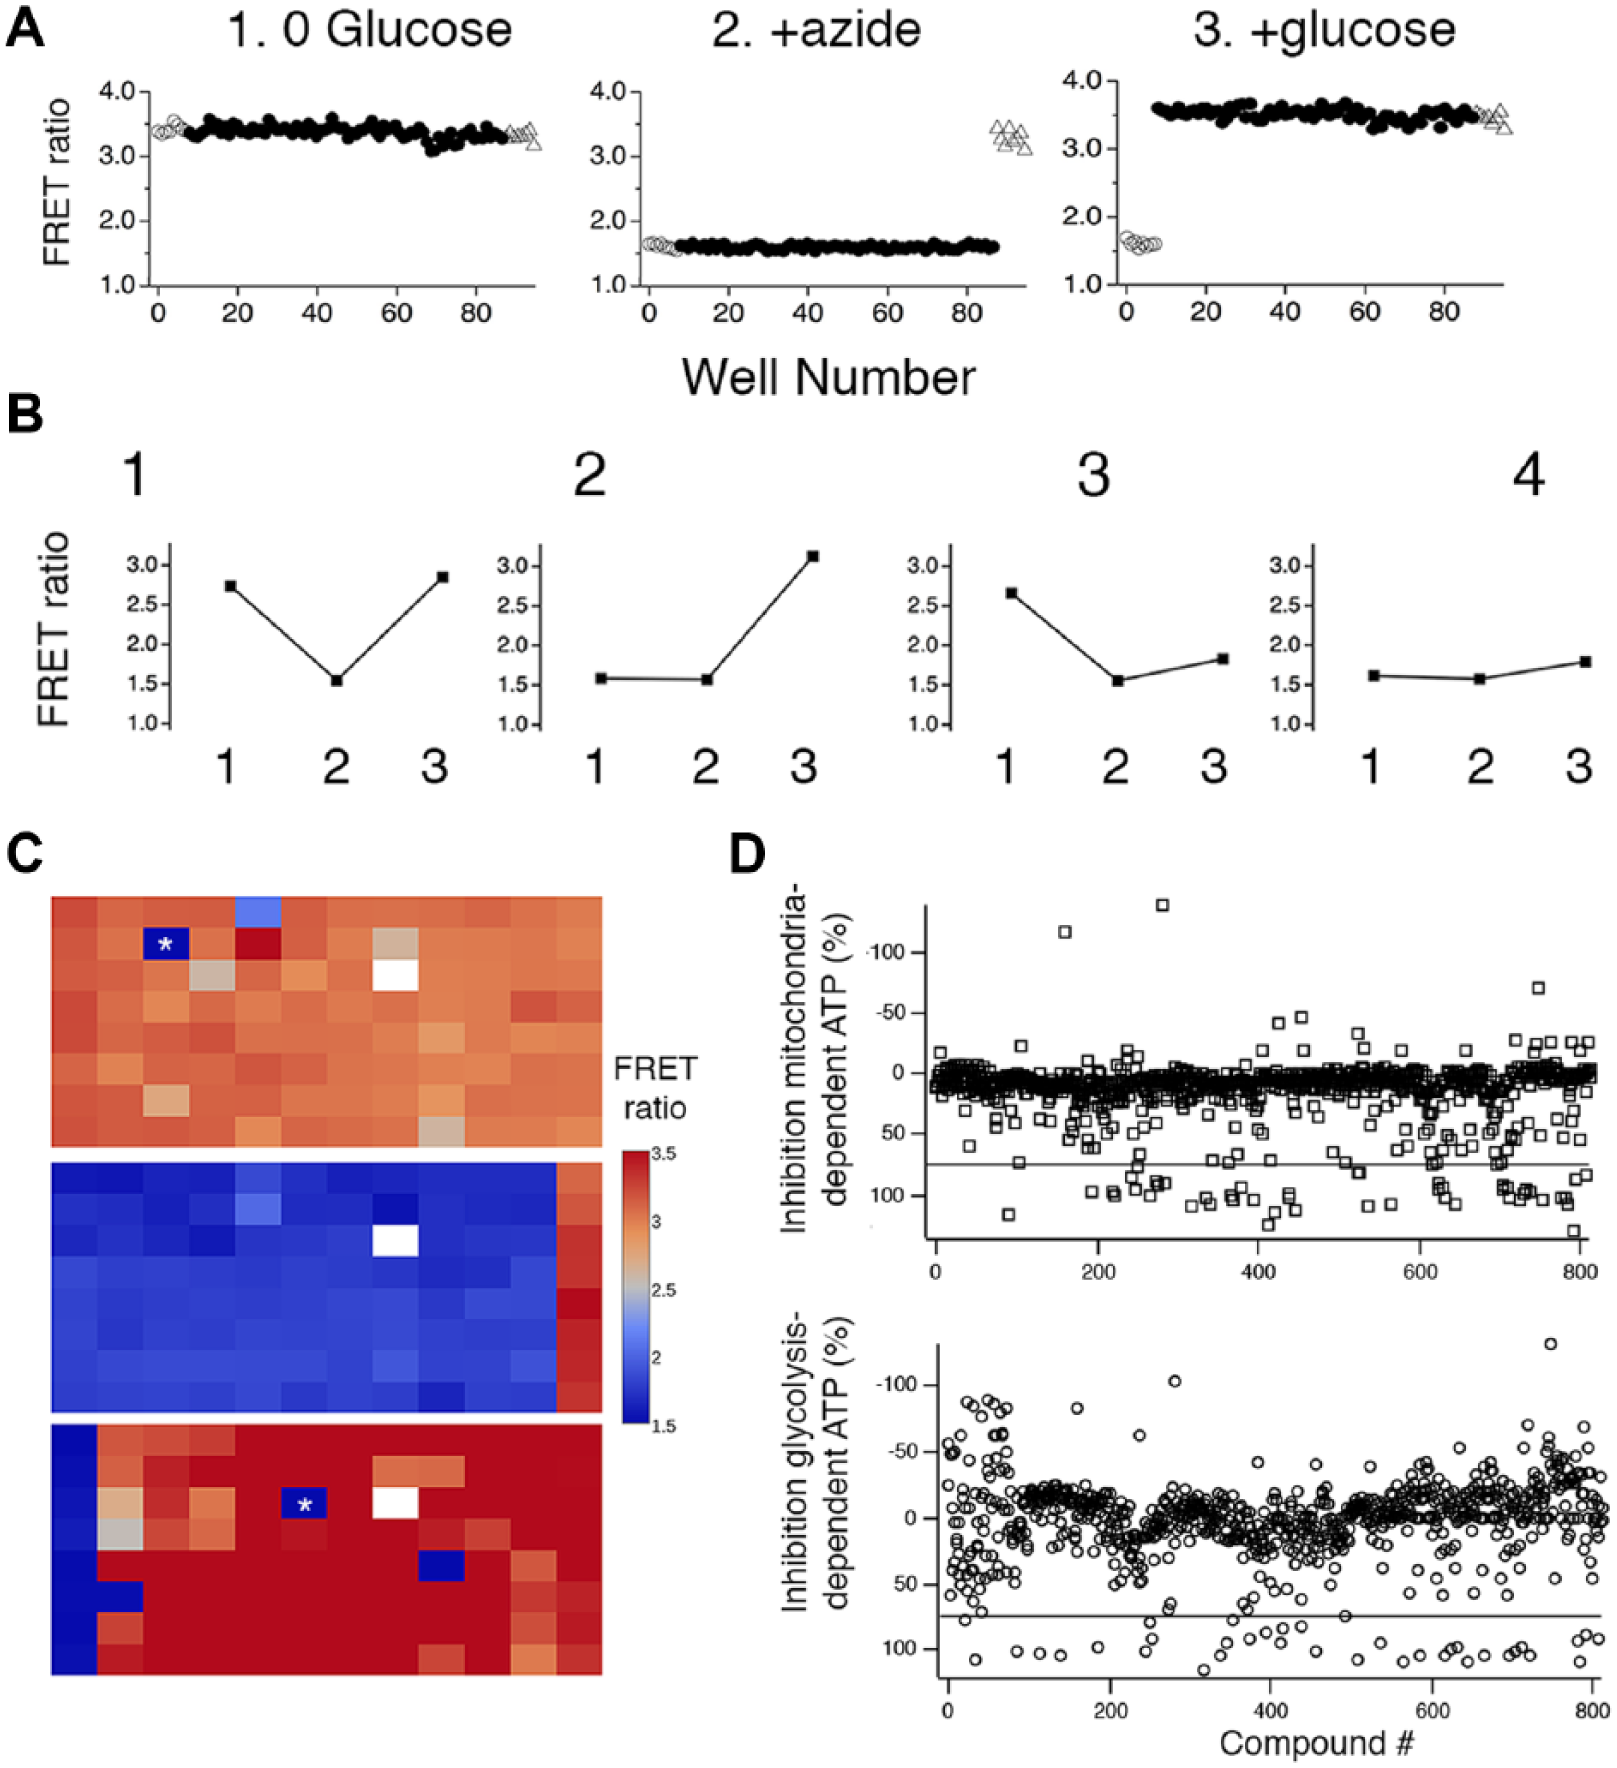
A multiple-read protocol enables detection of inhibitors of both glycolysis and oxidative phosphorylation-dependent adenosine triphosphate (ATP) production. (
We envisioned that compounds with four kinds of effect could be identified using this protocol ( Fig. 3B ). Most compounds would have no effect on either oxidative-phosphorylation or glycolysis ( Fig. 3B1 ). These would display high FRET signals in the first read, low FRET signals in the second read, and high FRET signals in the third read. For compounds that inhibit oxidative phosphorylation-dependent ATP production, FRET ratios would be low in the first and second reads and high in read 3 ( Fig. 3B2 ). Compounds that inhibit glycolysis would have high FRET ratios in read 1 and low FRET ratios in reads 2 and 3 ( Fig. 3B3 ). Finally, compounds that inhibit both oxidative phosphorylation-dependent ATP production and glycolysis would display low FRET ratios in all three reads ( Fig. 3B4 ), as might compounds that, via their fluorescent properties, caused an artifactual decrease in FRET ratio.
We used the protocol we developed to screen the 813 compounds in the NCI’s Mechanistic Set III in 96-well plates at 10 µM final concentration (
Metabolically Active Compounds in NCI Mechanistic Set III. a
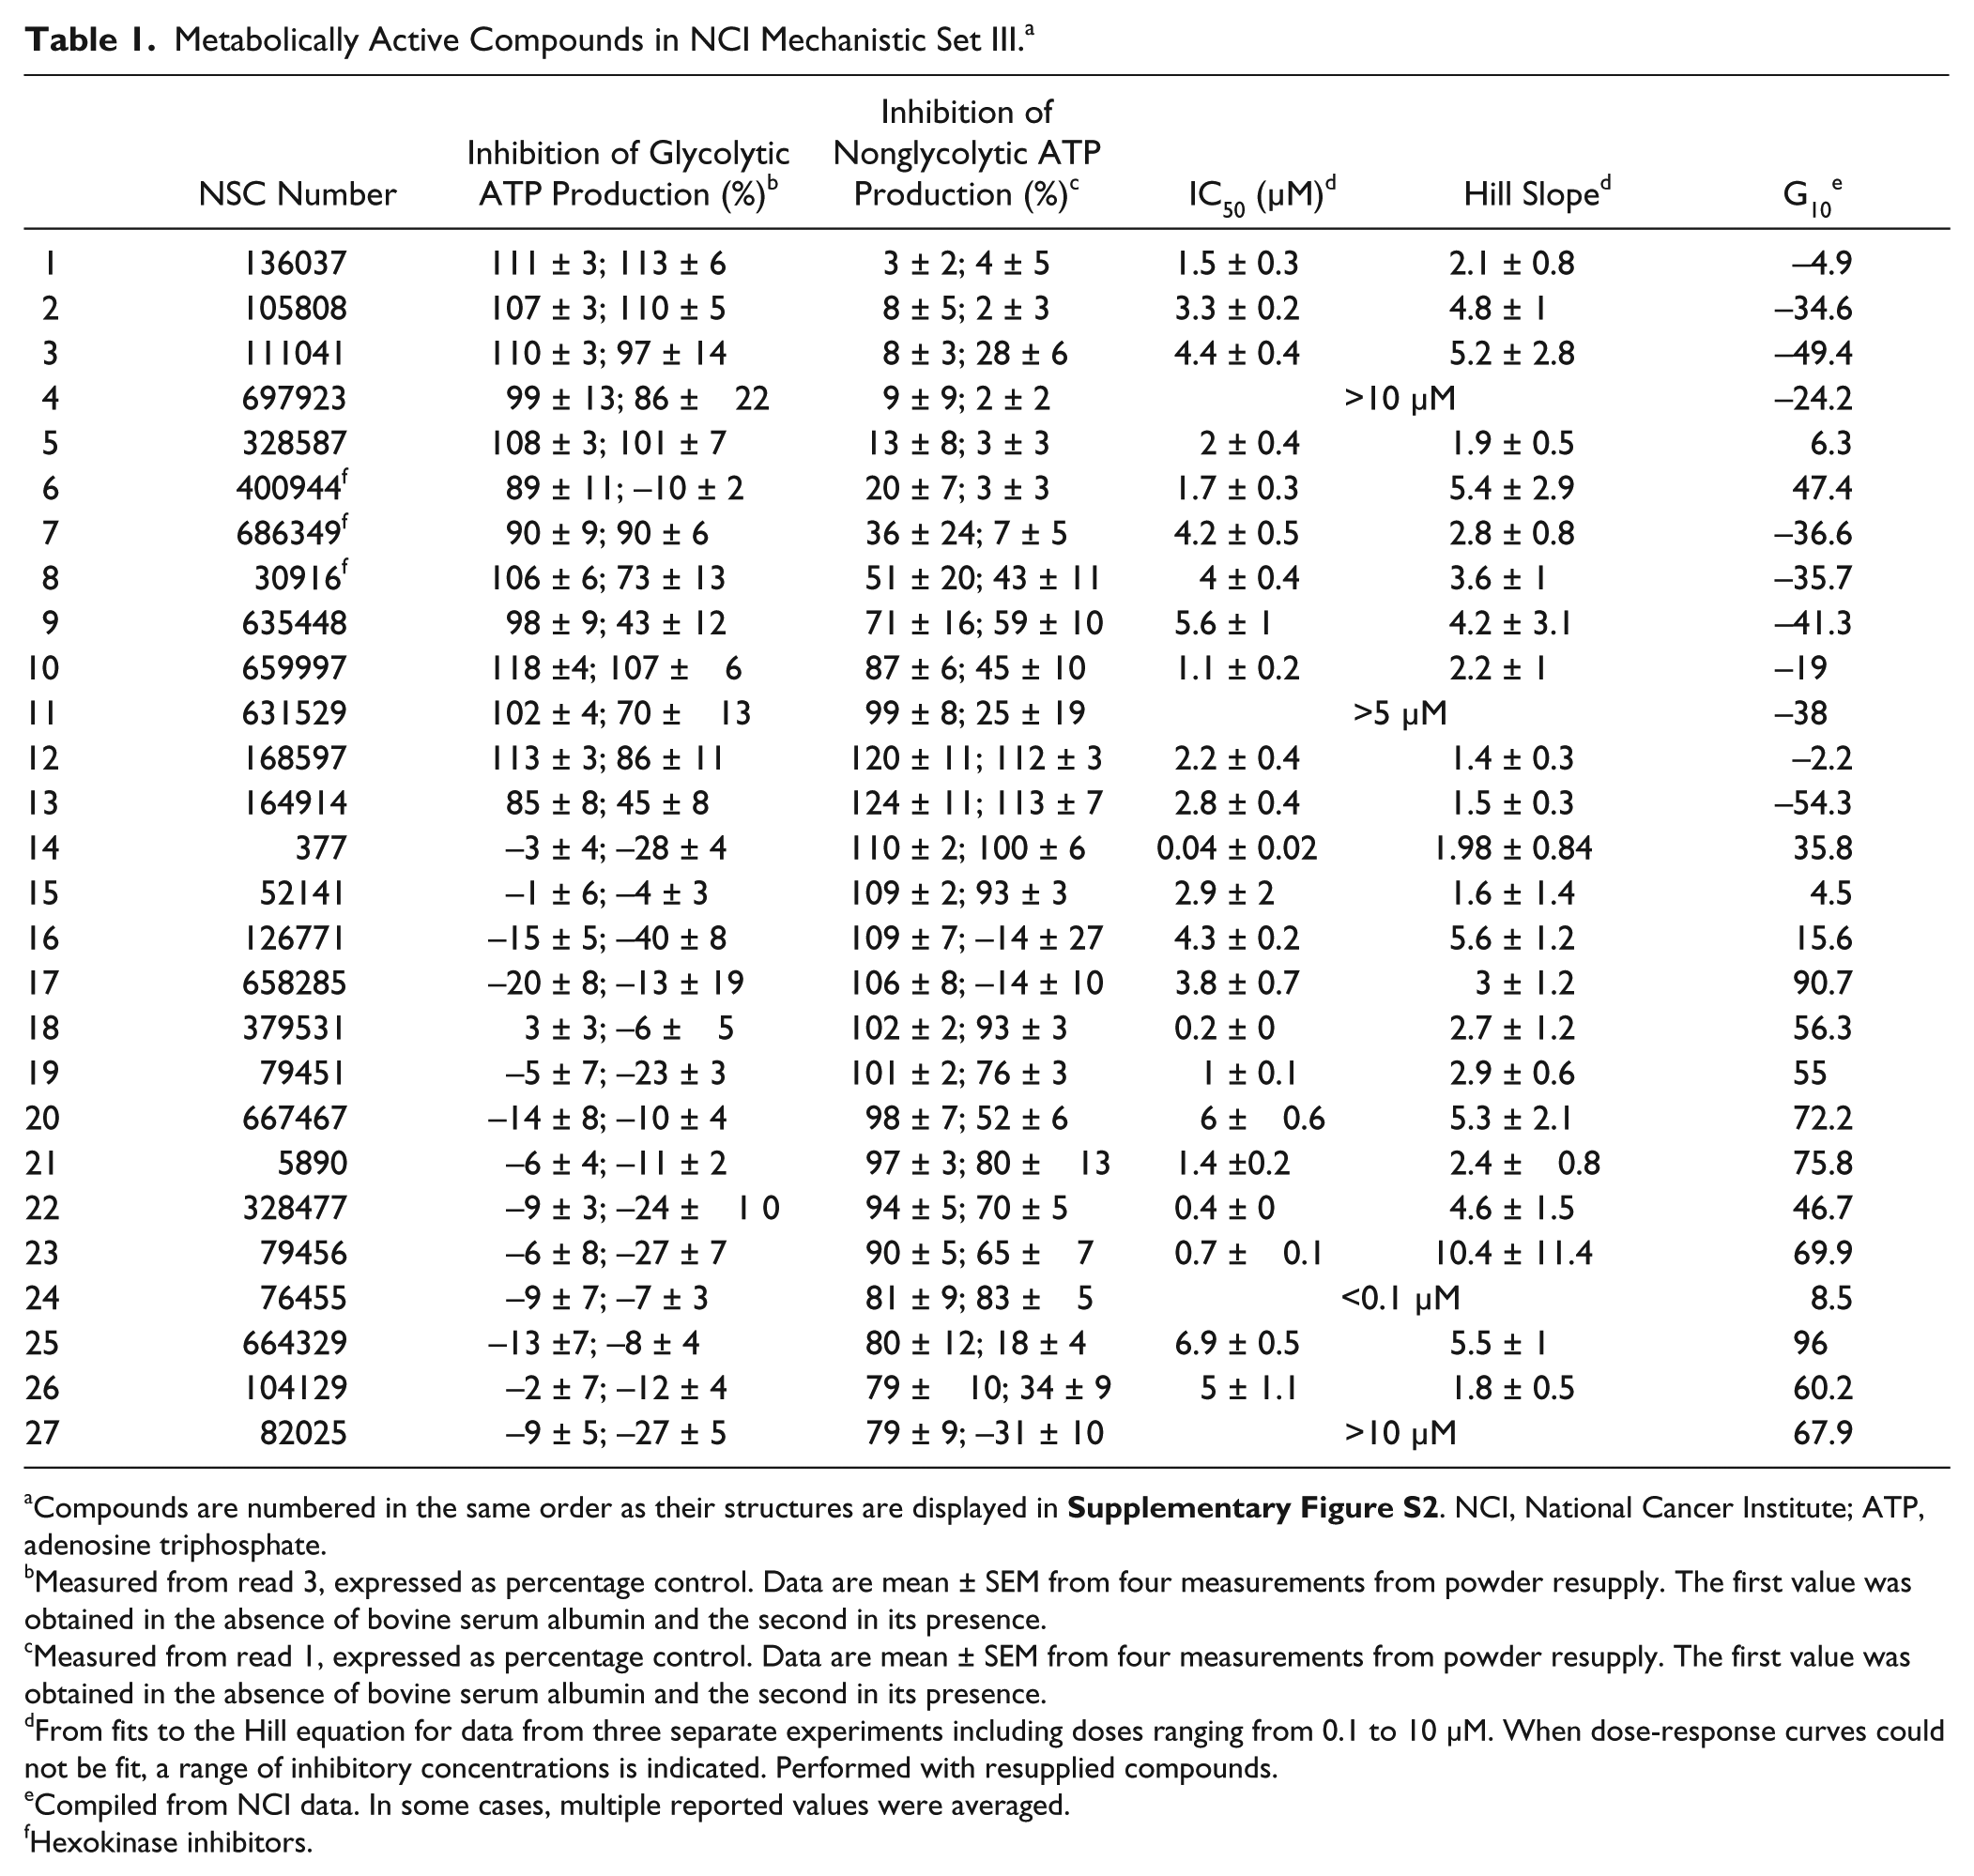
Compounds are numbered in the same order as their structures are displayed in
Measured from read 3, expressed as percentage control. Data are mean ± SEM from four measurements from powder resupply. The first value was obtained in the absence of bovine serum albumin and the second in its presence.
Measured from read 1, expressed as percentage control. Data are mean ± SEM from four measurements from powder resupply. The first value was obtained in the absence of bovine serum albumin and the second in its presence.
From fits to the Hill equation for data from three separate experiments including doses ranging from 0.1 to 10 µM. When dose-response curves could not be fit, a range of inhibitory concentrations is indicated. Performed with resupplied compounds.
Compiled from NCI data. In some cases, multiple reported values were averaged.
Hexokinase inhibitors.
Both limbs of our multiple-read assay detected effects on the output of an entire pathway. Compounds that inhibit oxidative phosphorylation-dependent ATP production could act via multiple mechanisms: they could inhibit respiratory complexes; depolarize the mitochondrial membrane potential; inhibit the import of energy-providing substrate(s), adenosine diphosphate, or phosphate into mitochondria; or could block export of ATP. Three of the inhibitors of oxidative phosphorylation-dependent ATP production that we found—nonactin (NSC 52141), usnic acid (NSC 5890), and peliomycin (NSC 76455)—are known inhibitors of oxidative phosphorylation,15–17 confirming that that limb of the assay can identify compounds with desired mechanism of action. Glycolysis inhibitors could act on one or more of the enzymes or transporters involved in the glycolytic pathway. To our knowledge, none of the compounds we identified have been reported previously to inhibit glycolysis. To assess the mechanism of action of glycolysis inhibitors, we first tested effects on glucose influx (
Fig. 4A
), as K562 cells are known to express glucose transporter 1 (GLUT1) at high levels.
18
We created a long-term K562 cell line expressing a FRET sensor for intracellular glucose
12
(see
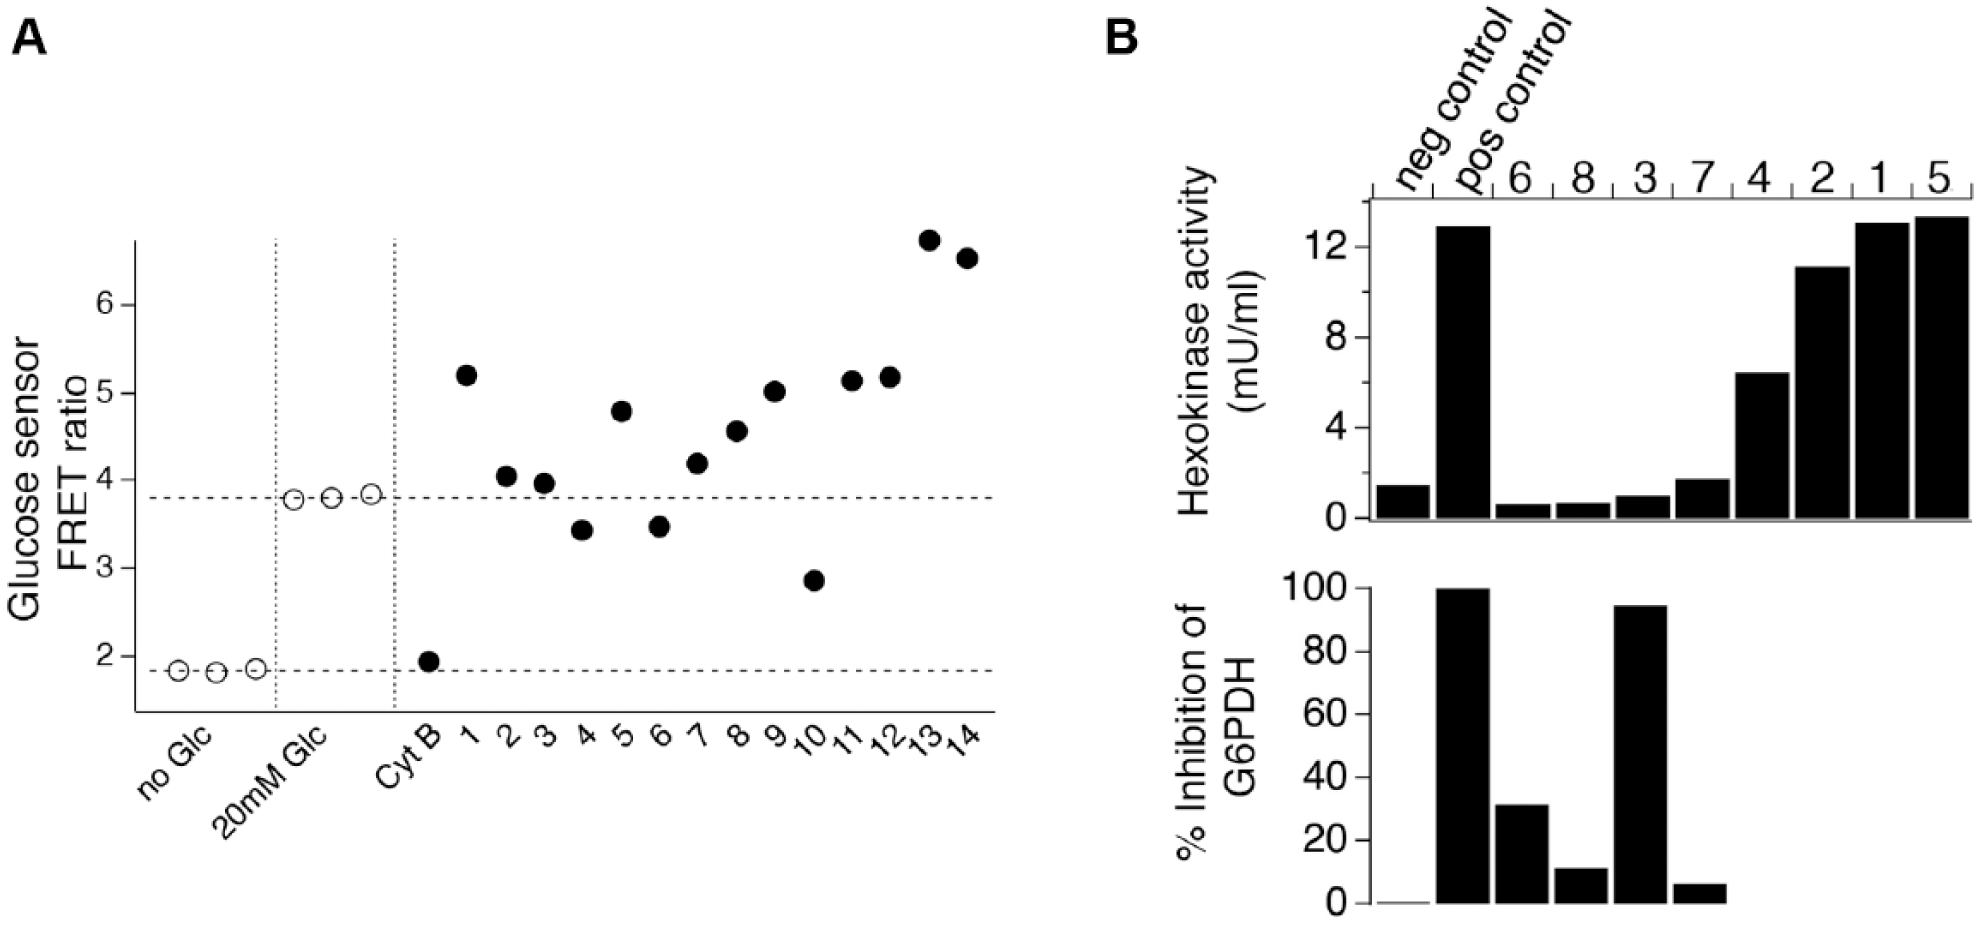
Examining molecular mechanism of action for select glycolysis inhibitors. (
We next tested effects on HK activity using a kit that monitors NADH produced from NAD by Aspergillus glucose-6-phosphate dehydrogenase (which is supplied) to measure the conversion of glucose to glucose-6-phosphate by HK activity in cell lysate samples that were treated with compounds or DMSO (
Fig. 4B
). Four of the eight compounds we selected for testing inhibited production of NADH when glucose was added to cell lysate samples, consistent with inhibition of HK activity. However, one compound, NSC 111041, also inhibited NADH production when glucose-6-phosphate was added directly to the reaction mix, indicating that it blocks Aspergillus glucose-6-phosphate dehydrogenase (
Fig. 4B
). Dose-response measurements indicate that the three HK inhibitors we identified exhibit micromolar potency in glucose-containing saline solution (
Glycolysis-Inhibiting Compounds Are Effective at Blocking Proliferation
The effects of NCI library compounds on cell proliferation have been extensively characterized and are available in an online database (described in ref. 20, https://dtp.cancer.gov/databases_tools/default.htm). This allowed us to assess the effects of the hits we found on proliferation ( Fig. 5 ). We had in mind a simple idea: if inhibiting a particular metabolic process is an effective means of blocking proliferation, then all inhibitors of that process should be antiproliferative and thus the ensemble of inhibitors will be significantly more antiproliferative than the library as a whole. In contrast, if inhibiting a given process does not reduce proliferation, then inhibitors will only be as effective as the library because effects on proliferation will be no different than for compounds selected at random from the library. We downloaded the complete dose-response data set for growth measurements on the NCI 60 cell panel, which were assessed using a formula that accounts for cell proliferation during the 2-d course of the assay. Compounds that do not inhibit growth give a percentage growth of 100. Compounds whose actions result in the same number of cells after 2 d compared with at the start of the experiment give a percentage growth of 0. Finally, compounds that reduce the number of cells at the end of 2 d compared with the start of the experiment give negative percentage growth—a complete absence of cells after 2 d would correspond to −100% growth. We extracted the data obtained at 10 µM compound concentration (percentage growth at 10 µM, which we call G10) for the effects of compounds in Mechanistic Set III on K562 cells. We chose this concentration because at 10 µM, all of the inhibitors of glycolysis-dependent and oxidative phosphorylation-dependent ATP production we identified were >75% effective ( Table 1 , see below). Data were available for 714 of the 813 compounds in the set, including all of the metabolically active compounds we identified. We plotted G10 for the compound collection in histogram form ( Fig. 5A ) and then, as a means of assessing the relative fraction of each of these kinds of compounds, computed the cumulative density function for the plated compounds ( Fig. 5B ). The median G10 in the library was 49.
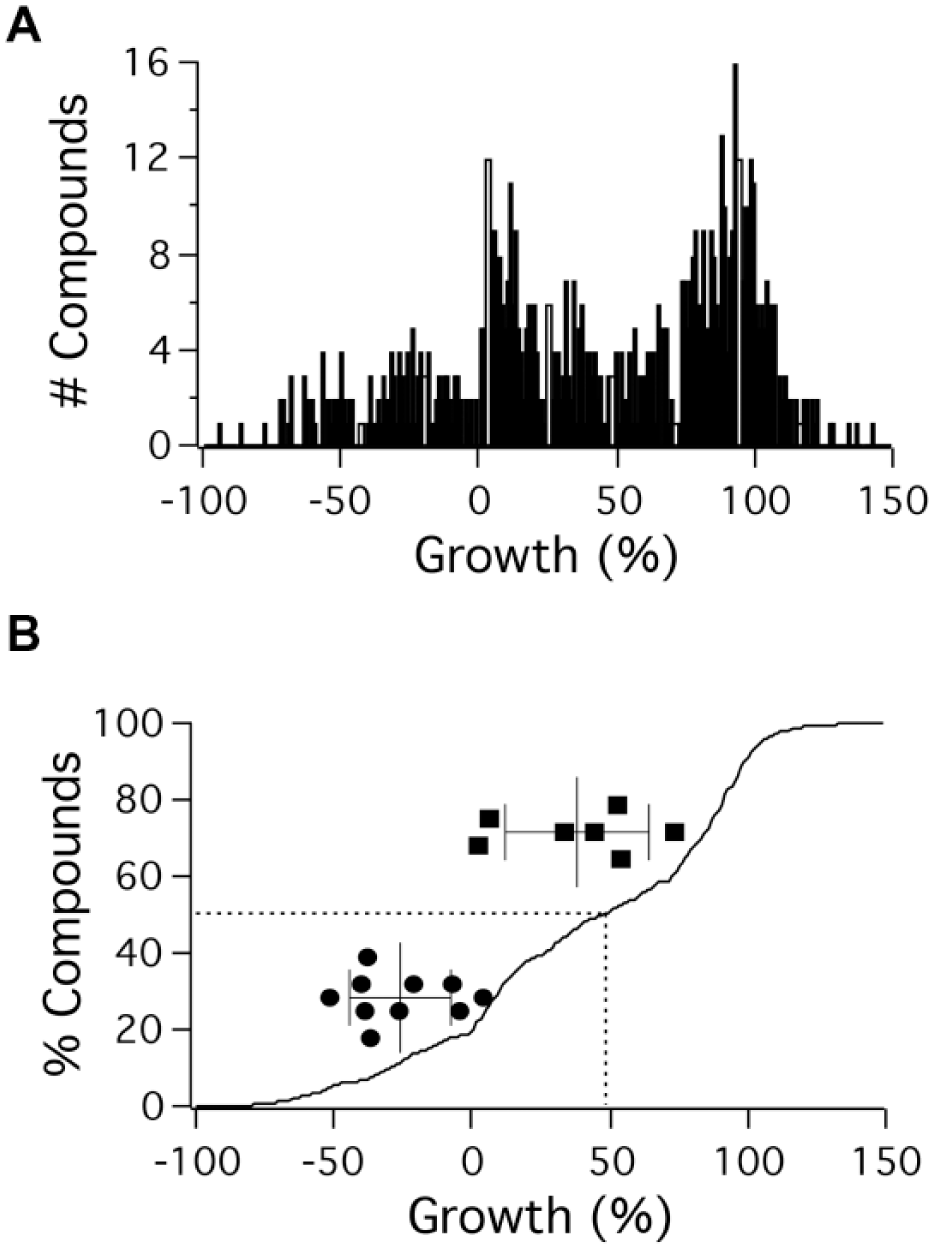
Assessing effects of metabolically active small molecules on K562 cell proliferation. (
When we initially examined the effects on proliferation of our hits, we found that inhibitors of oxidative phosphorylation-dependent ATP production had a wide range of effects (
Table 1
). Only some reduced proliferation, which is inconsistent with inhibition of oxidative phosphorylation-dependent ATP production representing an effective means of blocking growth. In contrast, all of the glycolysis inhibitors except one, NCI 400944, were fairly effective at inhibiting proliferation. We believe that if even one glycolysis inhibitor that was effective in cells was to fail to block proliferation, it would cast doubt on the idea that inhibiting glycolysis inhibits proliferation. However, in attempting to find experimental reasons why discordant results could be obtained, we noted that the NCI’s experiments effects on proliferation were measured in growth medium that was supplemented with 5% serum, whereas our screening was conducted in serum-free saline (serum is sufficiently fluorescent that it increases background and compromises FRET measurements; not shown). Because serum proteins, primarily BSA, can bind some compounds and reduce their free concentration,
21
we assessed the effects of compounds on ATP production in the presence of 0.12% BSA, which is close to the amount of BSA present in medium containing 5% serum. Including BSA increased background fluorescence but not so much as to prevent measurement of FRET signals. We found that several metabolically active compounds, including NCI 400944, were not effective in the presence of BSA. We excluded these compounds from our analysis of effects on proliferation. The seven oxidative phosphorylation inhibitors (squares in
Fig. 5B
) that were found to inhibit by >70% in the presence of BSA had G10 ranging from 4.5% to 75%, with a mean of 40% ± 26% (mean ± SD), not different from the overall compound set mean of 43 ± 51 (p = 0.98, as assessed using nonparametric one-way ANOVA). By contrast, the 10 compounds that inhibited glycolysis >70% in the presence of BSA (circles in
Fig. 5B
) had G10 values ranging from −54% to 6.3%, with a mean of −24% ± 18%, significantly different from the mean of the overall compound set (p < 0.0001). We assessed growth inhibitory effects of the metabolic inhibitors we identified on the five other leukemic lines in the NCI 60 cell line panel (
Discussion
Our multiple-read FRET sensor-based assay protocol offers the ability to detect multiple kinds of metabolically active compounds. This is a major advantage over the assays that others have used to identify glycolysis-inhibiting GLUT transporter blockers.8,9 We note that in the original luciferase assays, multiple reads were impossible, as cells needed to be lysed to measure ATP. Subsequent work used stably expressed luciferase and caged luciferin. 22 Multiple reads could be performed using that system. Identification of HK inhibitors confirms that with appropriate follow-up assays, our screen could serve as the first step in identifying inhibitors of specific glycolytic enzymes or transporters of interest. Follow-up assays could likely be devised to identify inhibitors of oxidative phosphorylation-dependent ATP production that affect particular steps of interest, although we tested only two of the possible targets. As our assay involves only solution additions, it seems likely that it could adapted to higher-density formats. It is surprising to us that so little use of genetically encoded FRET reporters is made in screening; provided expression levels are high enough and FRET ratio changes are large enough, our results with the ATP sensor and the glucose sensor confirm signals can be obtained in a plate reader that are more than adequate. We note that a multiple-read protocol was used by Allen et al. 23 in 2006 to measure activators and inhibitors of adenylyl cyclase using a FRET reporter measured in a plate reader.
Despite the interest in targeting metabolism as a means of inhibiting cancer cell proliferation, upon review, we found that there were weaknesses with some of the evidence supporting the idea. This is particularly true for glycolysis, which has received relatively more attention. Although it is abundantly clear that a number of glycolytic proteins are up-regulated in cancer cells,24,25 and knockouts or knockdowns of glycolytic enzymes can inhibit cancer initiation and progression in animal models,26,27 functions of glycolytic enzymes unrelated to glycolysis can confound results of genetic studies. For example, HK2 binds to the mitochondrial outer membrane and may regulate the permeability transition pore that releases cytochrome C during apoptosis, 28 pyruvate kinase M2 can act directly as a transcription factor, 29 and glycerlaldehyde-3-phosphate dehydrogenase regulates vesicle transport. 30 Knocking these proteins down could thus affect proliferation in ways unrelated to effects on glycolysis.
There are also issues with support from small-molecule inhibitors. Compounds such as 2-DG and 3-bromopyruvate 4 were among the first to be explored, but each has effects apart from glycolysis inhibition that could inhibit growth. 2-DG inhibits n-linked glycosylation, which may be responsible for inhibiting proliferation under normoxic conditions, 31 and 3-bromopyruvate is an alkylating agent 32 that may have multiple additional affects. ENOBlock, originally reported to be an enolase 1 inhibitor, 33 appears not to block enolase and does not affect proliferation via glycolysis at all, 34 whereas STF-31, originally identified in a cytotoxicity screen and subsequently shown to block GLUT1, may affect proliferation via effects on nicontinamide phosphoribosyltransferase. 35 GlaxoSmithKline developed a series of HK2-inhibiting glucosamine derivatives, but effects on growth were not reported. 7 Bayer developed a series of GLUT1 inhibitors,9,22 but the concentrations of these agents required to inhibit proliferation are orders of magnitude higher than those required to block GLUT1. 36 Thus, the link between small-molecule inhibition of glycolysis and antiproliferative effects remains uncertain. This is reflective of a general problem encountered when using small molecules to validate potential drug targets. Compounds available prior to a large-scale screening and chemical optimization effort almost always have multiple effects, so the level of support they provide for a given target can in fact be quite weak. 37 In fact, even after optimization, establishing that effects on a particular target produce a phenotype of interest can be quite difficult. This is particularly problematic when the phenotype is, like reduced proliferation, a decrease in fitness (see ref. 38 for a thoughtful discussion of the issue).
Our results and the NCI’s database allow us to do something that we believe to be novel: assess the effects on proliferation of ensembles of compounds identified through a phenotypic screen designed to isolate specific kinds of actions—in this case, on metabolism—and compare them to the effects of the library as a whole. Critically, as our assay is cell based, we know that the compounds we selected for our analysis were active under the conditions in which proliferation was measured. This minimizes the chances that experimental considerations can skew the comparison. Our results show that glycolysis inhibitors are significantly more effective at blocking proliferation than the library as a whole, whereas inhibitors of oxidative phosphorylation-dependent ATP production are not. Thus, it seems unlikely that inhibiting oxidative phosphorylation-dependent ATP production per se is antiproliferative in K562 cells. If we assume that the antiproliferative properties of the library as a whole define the probability of a randomly selected compound having antiproliferative effects, we can use the binomial distribution to estimate the chances of selecting any number of compounds with a given antiproliferative efficacy from the library at random. For the least effective glycolysis inhibitor we found, NSC 328587, G10 was 6, corresponding to a 94% inhibition of proliferation, a significant antiproliferative effect that we can then use to calculate the likelihood of obtaining compounds at least as antiproliferative from the library purely by chance. 189 of the 714 compounds (26.4%) for which G10 values were available for K562 cells had G10 values ≤6. According to the binomial distribution, the chances of selecting 10 out of 10 compounds at least this effective at random are 1.7 × 10⁻⁶, odds so small they suggest strongly that glycolysis inhibition is an effective means of blocking proliferation in K562 cells.
In summary, we present here a cell-based assay that could serve as the basis for screening efforts to identify compounds that inhibit glycolysis, oxidative phosphorylation, or both. We envision that the assay could be used in a workflow that involves identifying pathway inhibitors in the initial screen and then testing effects on specific mechanisms of action in a second stage. We believe that using such an assay system to expand the repertoire of available compounds could help provide tools that will aid in efforts to probe the links between cellular metabolism and proliferation.
Supplemental Material
Supplemental_material_for_Zhao_et_al._ATP_FRET_sensor – Supplemental material for A Novel Multiple-Read Screen for Metabolically Active Compounds Based on a Genetically Encoded FRET Sensor for ATP
Supplemental material, Supplemental_material_for_Zhao_et_al._ATP_FRET_sensor for A Novel Multiple-Read Screen for Metabolically Active Compounds Based on a Genetically Encoded FRET Sensor for ATP by Ziyan Zhao, Rahul Rajagopalan and Adam Zweifach in SLAS Discovery
Footnotes
Acknowledgements
We acknowledge the help of Dr. Wu He of the University of Connecticut’s COR2E Flow Cytometry Facility. We thank Dr. Ming-hui Chen of the Department of Statistics at the University of Connecticut for advice. We are particularly grateful to Dr. Daniel Zaharevitz of the National Cancer Institute for helpful advice on downloading data from the NCI’s database. Data sets will be provided upon reasonable request. ATeam-expressing K562 cells will be provided if the requestor pays for shipping.
Supplementary material is available online with this article.
Declaration of Conflicting Interests
The authors declared no potential conflicts of interest with respect to the research, authorship, and/or publication of this article.
Funding
The authors disclosed receipt of the following financial support for the research, authorship, and/or publication of this article: We thank the University of Connecticut for funding.
References
Supplementary Material
Please find the following supplemental material available below.
For Open Access articles published under a Creative Commons License, all supplemental material carries the same license as the article it is associated with.
For non-Open Access articles published, all supplemental material carries a non-exclusive license, and permission requests for re-use of supplemental material or any part of supplemental material shall be sent directly to the copyright owner as specified in the copyright notice associated with the article.