
Abstract
A high-throughput screen (HTS) of human 6-phosphofructo-2-kinase/fructose-2,6-biphosphatase 3 (PFKFB3) resulted in several series of compounds with the potential for further optimization. Informatics was used to identify active chemotypes with lead-like profiles and remove compounds that commonly occurred as actives in other HTS screens. The activities were confirmed with IC50 measurements from two orthogonal assay technologies, and further analysis of the Hill slopes and comparison of the ratio of IC50 values at 10 times the enzyme concentration were used to identify artifact compounds. Several series of compounds were rejected as they had both high slopes and poor ratios. A small number of compounds representing the different leading series were assessed using isothermal titration calorimetry, and the X-ray crystal structure of the complex with PFKFB3 was solved. The orthogonal assay technology and isothermal calorimetry were demonstrated to be unreliable in identifying false-positive compounds in this case. Presented here is the discovery of the dihydropyrrolopyrimidinone series of compounds as active and novel inhibitors of PFKFB3, shown by X-ray crystallography to bind to the adenosine triphosphate site. The crystal structures of this series also reveal it is possible to flip the binding mode of the compounds, and the alternative orientation can be driven by a sigma-hole interaction between an aromatic chlorine atom and a backbone carbonyl oxygen. These novel inhibitors will enable studies to explore the role of PFKFB3 in driving the glycolytic phenotype of tumors.
Introduction
Tumors under nutrient and hypoxic stress undergo metabolic reprogramming, including increased dependence on glucose and glycolytic flux, to generate adenosine triphosphate (ATP) and glycolytic intermediates to fuel biosynthetic pathways. A wide range of tumors displays a strong fluorodeoxglucose (FDG) positron emission tomography (PET) signal, confirming the clinical relevance and highlighting a novel therapeutic approach to target the increased glycolytic flux in tumors. 1 Therefore, direct targeting of the glycolysis pathway represents a potential therapeutic opportunity. Indeed, tumors demonstrate increased metabolism of glucose to lactate even in aerobic conditions—also known as the Warburg effect. 2 The rate-limiting step in glycolysis is catalyzed by phosphofructokinase 3 (PFK), which is allosterically activated by fructose 2,6-bisphosphate (Fru-2,6-P2). 4 Levels of Fru-2,6-P2 are controlled by the 6-phosphofructo-2-kinase/fructose-2,6-bisphosphatases (PFKFBs), which are bifunctional kinase/phosphatases. Of the 4 known isoforms, the inducible PFKFB3 (or IPFK2) exhibits the highest kinase/phosphatase ratio (~700/1) 5 and is thought to be the key tumor-associated isoform. Inhibition of PFKFB3 is predicted to selectively inhibit tumor metabolism through blocking glycolysis, producing an antiproliferative effect (see Fig. 1 ).
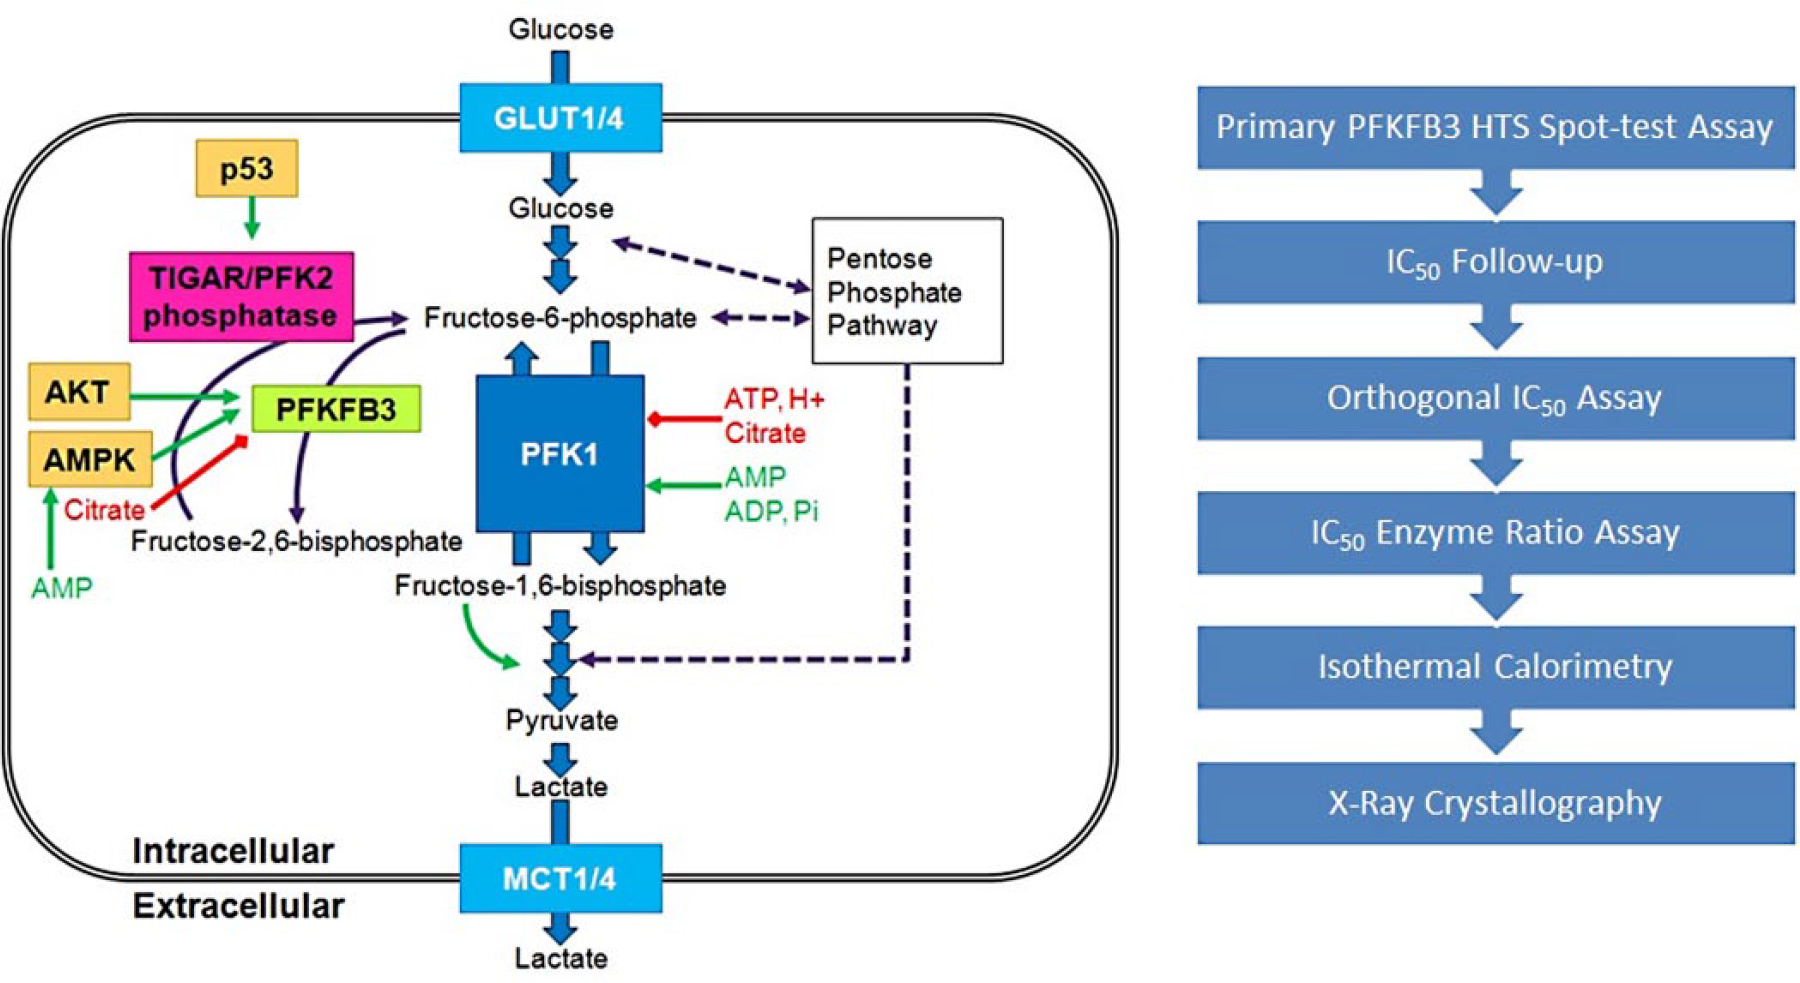
On the left, a schematic of the glucose metabolic pathway showing the PFKFB3 position (green box), and to the right, an overview of the workflow used to evaluate the screen and hits.
Several X-ray crystal structures of PFKFB3 exist in the public domain showing the kinase and phosphatase domains of the protein with ligands bound. 6 The kinase domain active site is enclosed and dissimilar to a Ser/Thr/Tyr kinase active site, with a recognition site for the phosphofructose and another for ATP. The phosphofructose binding site is more polar than the ATP site (see Suppl. Fig. S1 ).
A limited number of PFKFB3 inhibitors had been reported at the time of the study7–13 (see Suppl. Table S1 ). Here we describe the discovery of a dihydropyrrolopyrimidinone series of active compounds identified by high-throughput screening (HTS) and profiled through biochemical and biophysical testing. A number of false-positive compounds were identified, and a combination of biochemical and biophysical experiments was required to confirm the true active compounds and identify the best series of confirmed active compounds to progress. This dihydropyrrolopyrimidinone series was ultimately not progressed into the optimization phase of the drug discovery project, although an alternative series identified by this process did progress, which had a better profile.
Materials and Methods
DNA Synthesis and Cloning of Human PFKFB3 for Screening and Isothermal Calorimetry Studies
The full-length coding sequence (residues 1–520) for the human PFKFB3 protein (Q16875) was synthesized in vitro by GeneArt AG (Life Technologies, Gegensburg, Germany). The sequence was codon optimized for Spodoptera frugiperda (Sf21) expression. The synthesized DNA fragment was restriction cloned into a modified version of the pFastBac1 baculovirus expression vector (Life Technologies, Paisley, Renfrewshire, UK), downstream of an N-terminal 6His tag and a TEV protease cleavage recognition sequence.
Expression and Purification of PFKFB3 for Screening and Isothermal Calorimetry Studies
Routine Sf21 cell maintenance, generation of bacmid DNA, generation of recombinant baculoviruses, expression studies in 24-deep-well blocks (24DWBs), and roller bottles were carried out essentially as previously described, 14 except that no gentamicin antibiotic was added to insect cell cultures. SF900II medium for Sf21 cells was from Invitrogen (Life Technologies, Paisley, Renfrewshire, UK). Fetal bovine serum (FBS) was from PAA Laboratories (Leeds, West Yorkshire, UK).
Insect cell pellets from 5 L of culture were thawed from −80 °C and resuspended by homogenization in 1 L of lysis buffer (20 mM Tris [pH 8.0], 200 mM NaCl, 20 mM imidazole, 1 mM Tris(2-carboxyethyl)phosphine [TCEP], and 20 EDTA-free protease inhibitor tablets; Roche, Welwyn Garden City, Hertfordshire, UK). The cells were lysed by sonication on ice (5-s × 30-s bursts) and crude lysate clarified by centrifugation at 34,000 g for 2 h at 4 °C. The supernatant was loaded at 3.0 mL/min onto a 25-mL column of Ni-NTA Superflow resin (Qiagen, Manchester, UK), preequilibrated in lysis buffer. Following the supernatant loading, the column was washed with lysis buffer to baseline and by buffer A (20 mM Tris [pH 8.0], 200 mM NaCl, 20 mM imidazole, 1 mM TCEP), again to baseline. Bound protein was eluted with 100% buffer B (buffer A with 200 mM imidazole). Fractions containing PFKFB3 protein, based on sodium dodecyl sulfate polyacrylamide gel electrophoresis (SDS-PAGE), were pooled, concentrated using centrifugal concentrators (Amicon ultrafree-15 10-kDa molecular weight cutoff [MWCO]) to 30 mL, and further purified by applying 15-mL volumes onto a 320-mL Superdex 75 (XK26/60) (GE Healthcare Life Sciences, Amersham, Buckinghamshire, UK) at 1 mL/min column, preequilibrated with buffer C (20 mM Tris [pH 8.0], 100 mM NaCl, 10% glycerol, 1 mM TCEP, 0.1 mM EDTA). The purest fractions, as judged by SDS-PAGE, were pooled and snap-frozen in liquid nitrogen. The final yield of purified PFKFB3 was ~37 mg/L of cell paste. The protein was stored at −80 °C.
HTS and IC50 Inhibition Assay
Compound screening was performed using an ADP-Glo format 15 (Promega, Madison, WI), which uses a two-step process. PFKFB3 was incubated with compound, ATP, and fructose-6-phosphate (F6P), in a buffer containing 1 mM dithiothreitol (DTT), 5 mM MgCl2, 5 mM KPi (pH 7.0), 200 mM KCl, 0.1 mM Triton X-100, and 50 mM HEPES (pH 7.0) to give final concentrations of PFKFB3 8.75 nM, ATP (Km) 34 µM, and F6P (Km) 15 µM ( Suppl. Fig. S5 ). For the primary HTS run in the 1536 format and the HTS concentration-response testing, 1 µL enzyme and 1 µL substrate additions were made simultaneously using a BioRAPTR FRD (Beckman Coulter, Indianapolis, IN) to give a final volume of 2 µL. All other assays were assembled in the same way by adding an aliquot of enzyme solution first with reactions initiated by addition of an equal volume of substrate mix using a Multidrop Combi (ThermoFisher Scientific, Waltham, MA). After at least 1 h (determined by PFKFB3 kinetics), ADP-Glo reagent was added to terminate the kinase reaction and deplete the remaining ATP. Forty minutes later, the kinase detection reagent was added to first convert adenosine diphosphate (ADP) back to ATP, and then the newly formed ATP was quantitated by the luciferase/luciferin reaction, where 1 molecule of ADP produced equaled 1 molecule of ATP regenerated. Luminescence was measured using an EnVision Multilabel Reader (PerkinElmer, Waltham, MA). Inhibitors of PFKFB3 indicate a reduced signal with respect to uninhibited enzyme. Assay ready plates were generated by acoustically dispensing stock solutions of test compounds, at 10 mM in DMSO, into white, medium binding plates (Greiner Bio-One, Kremsmünster, Austria) using an Echo 555 (Labcyte, Sunnyvale, CA). The primary screen and follow-up were carried out under the same final conditions in both a 1536-well and a 384-well low-volume plate format, respectively. Regarding the PFKFB3 assay, in the 1536-well format, 1 µL enzyme and 1 µL substrate additions were made to give a final assay volume of 2 µL. For the low-volume 384-well format, 2.5 µL and 2.5 µL additions were made to give a final assay volume of 5 µL. The ADP-Glo reagents were added according to the manufacturer’s recommendation at a ratio of 1:1:2 for the PFKFB3 assay volume/ADP-Glo reagent/kinase detection reagent for each plate format. Bovine serum albumin (BSA) is well known to bind drug-like molecules, many of which are bona fide enzyme inhibitors. Therefore, using BSA for determination of nonspecific binding to a target protein runs the risk of eliminating genuine hits from the HTS output (i.e., false negatives). Thus, it was deemed preferable to use the actual protein of interest, especially as we were able to construct a kinetically equivalent assay at both concentrations used. The HTS was performed at a 10-µM compound concentration, and full IC50 curves were performed on a subset of hit compounds. A total of 837,387 unique compounds were tested. Data were analyzed using proprietary AstraZeneca software, which included data normalization, based on quality control plates for the primary screen and on-plate controls for the IC50 curves. After HTS, all the compounds selected for PFKFB3 IC50 determination were also tested in a technology artifact IC50 format whereby just the detection arm of the ADP-Glo assay was run without PFKFB3 enzyme and instead replaced with a concentration of ADP/ATP equivalent to that generated by the kinase reaction. If compounds interfered with detection of the ADP/ATP mixture, then a signal decrease would be observed, but no compound alone effects were identified in this assay (data not shown).
Orthogonal Inhibition Assay
Compounds were also tested using the Transcreener ADP Fluorescent Intensity Assay (product code 3013-10K; BellBrook Labs, Madison, WI). The Transcreener ADP2 FI assay is a competitive fluorescence intensity assay based on the detection of ADP and therefore is compatible with any enzyme class that produces ADP. 16 The assay conditions were optimized to match the ADP-Glo conditions as far as possible; however, compared to the ADP-Glo conditions (8 nM, 1 h), a lower protein concentration of 4 nM gave a linear reaction to 2 h and a suitable signal window ( Suppl. Fig. S5 ). Consequently, 4 nM enzyme was used compared with 8 nM in the ADP-Glo format. The assay was performed in two steps. First, PFKFB3 was incubated with compound, ATP, and F6P in a buffer containing 1 mM DTT, 5 mM MgCl2, 5 mM KPi (pH 7.0), 200 mM KCl, 0.1 mM Triton X-100, and 50 mM HEPES (pH 7.0) to give final concentrations of 4.4 nM PFKFB3, 34 µM ATP (determined Km value), and 15 µM F6P (determined Km value), respectively, for 2 h at room temperature. Next, ADP was detected using a quenched ADP Alexa 594 tracer bound to the ADP2 monoclonal antibody conjugated to an IRDye QC-1. The tracer is displaced by ADP and becomes unquenched in solution, leading to a positive increase in fluorescence intensity. Therefore, ADP production is proportional to an increase in fluorescence and correlates to kinase activity. Fluorescence (excitation 580 nm, emission 620 nm) was measured using a Pherastar Microplate Reader (BMG Labtech, Ortenberg, Germany). Assay-ready plates were generated by acoustically dispensing stock solutions of test compounds, at 10 mM in DMSO, into black, low-volume 384-well polystyrene plates (product code 7840; Greiner Bio-One, Kremsmünster, Austria) using an Echo 555 (Labcyte, Sunnyvale, CA). For the low-volume 384-well format, 2.5 µL of 2× PFKFB3 working solution and 2.5 µL of 2× ATP/F6P substrate working solution additions were added using a Multidrop Combi to give a final assay volume of 5 µL. After a 2-h incubation, 5 µL of detection solution was added to all wells of the plate, and following a further incubation of 60 min at room temperature, plates were read. Dose-response curves were analyzed using an Origin software package proprietary to AstraZeneca (OriginLab Corporation, Northampton, MA). The IC50 values generated were compared with those from the ADP-Glo assay, and a good correlation between the compound potency values measured using both technologies was seen.
PFKFB1 Selectivity Assay
The PFKFB1 isoform assay was performed essentially as described above for the PFKFB3 1536 format assay under final concentrations of 35 nM PFKFB1, 14 µM ATP (equivalent to Km), and 2 µM F6P (equivalent to Km), respectively.
HTS Cheminformatic Analysis
Clustering was performed and maximum common substructures (MCS) were generated and used to analyze the enrichment of cores in the set of active compounds. In-house software 17 was used to estimate the frequency that a compound appears active in HTS experiments and thereby identify “frequent hitters,” and LogP was calculated for all compounds. Compounds were selected for further testing based on potency, lipophilicity, frequent hitter status, average potency of the cluster, and fraction of active near-neighbors.
Compound Repeat Cheminformatic Analysis
The set of compounds with IC50 measurements from the HTS compound repeat set was clustered with two complementary techniques: an in-house compound fingerprint clustering approach and a form of maximum common substructure (MCS) clustering. The clusters from each technique were combined to form a new set of clusters. Combined clusters were selected according to the following criteria: greater than or equal to three members, threefold as many active as inactive compounds (where inactive compounds have a pIC50 ≤4) in a cluster, average cluster molecular weight (MW) <350, average logP <3.5, and average cluster lipophilic ligand efficiency (LLE) >3. A parallel and complementary procedure used the following considerations as judged by an experienced medicinal chemist: compound potency, cluster size, ligand efficiency and lipophilic ligand efficiency, low hit rate in previous HTS, confirmatory structure activity relationships (SAR), or reasonable structures. In total, 457 compounds were identified for follow-up testing with a range of chemotypes and up to 40 members in a cluster.
Hill Slope Analysis
The Hill slope of a dose-response curve can indicate undesirable nonspecific compound effects on the target, such as colloidal aggregation, reactivity to the enzyme, and for potent compounds when Kd is lower than the concentration of the enzyme. Ideally, compounds with a binding stoichiometry of 1 should have a slope equal to 1, but in reality, a slope of 0.8 to 1.5 is acceptable. Outside these parameters, a Hill slope of greater than 1.5 may be an indication of nonspecific interactions. The Hill slopes were obtained for all the IC50 curves.
Enzyme Ratio Testing
A second enzyme test to determine nonspecific compound effects was used where the enzyme concentration was increased 10-fold and the incubation time was decreased 10-fold (from 60 min to 6 min). Any shift in IC50 indicates a potential time-dependent or enzyme concentration–dependent effect that may arise due to problems with the behavior of the compound in the enzyme assay, such as compound aggregation.18,19
Compound Mode of Inhibition Testing
Example compounds were selected after the enzyme ratio testing, and assays were run under Km and 10× Km conditions for both substrates. No evidence for competitive kinetics versus F6P was seen, whereas there was an increased IC50 at higher ATP concentration across multiple series (data not shown). These data indicate that compounds are likely to bind and compete in the ATP binding pocket of the enzyme.
Nephelometry
Assay-ready plates were generated by acoustically dispensing varying volumes of test compound stock solutions at 10 mM, 1 mM, or 0.1 mM in DMSO into clear, 384-well plates (cat. DIS-946-010G; ThermoFisher Scientific, Hemel Hempstead, UK) using an Echo 555 (Labcyte, San Jose, CA). All wells were made up with DMSO to a total compound volume of 500 nL to normalize DMSO concentration across the range. Each compound was replicated in triplicate on each plate. Addition of 50 µL assay buffer (1 mM DTT, 5 mM MgCl2, 5 mM KPi [pH 7.0], 200 mM KCl, 0.1 mM Triton X-100, and 50 mM HEPES [pH 7.0]) diluted the compounds to a final concentration range of 100 µM, 30 µM, 10 µM, 3 µM, 1 µM, 0.3 µM, and 0.1 µM. Plates were lidded and incubated for 1 h before being read on a NEPHELOstar plate reader (BMG Labtech, Aylesbury, UK). Data were analyzed with proprietary AstraZeneca software. A compound concentration that produced a mean signal >3× SD of a buffer control was classified insoluble. The recorded result was “highest soluble concentration.” This was the highest concentration of compound tested that had a signal <3× SD of a buffer control.
Isothermal Calorimetry
Binding partners were contained in 20 mM Tris (tris(2-carboxyethyl)phosphine) pH 8.0, 100 mM NaCl, 1 mM TCEP, 0.1 mM EDTA, 10% glycerol, and 1% DMSO to minimize heat effects due to buffer mismatch or ionization. Isothermal calorimetry (ITC) experiments were carried out using a Microcal iTC200 instrument. In a typical experiment, the syringe containing 300 µM test compound was titrated (injected) into the cell containing a 30 µM protein solution. Data were analyzed by nonlinear regression using Microcal Origin.
Crystallography
X-ray structures were generated using crystals of wild-type human PFKFB3. Full-length PFKFB3 (1–520) was expressed as an N-terminal 6His-tagged fusion protein in BL21(DE3) cells (Novagen, Merck Chemicals Ltd [Millipore], Nottingham, UK). Transformed cells were grown in Terrific Broth media (Sigma-Aldrich Co Ltd, Poole, UK) at 30 °C until OD600 reached approximately 0.6. After decreasing the temperature to 18 °C, cultures were induced with 0.4 mM isopropyl β-D-1-thiogalactopyranoside (IPTG) and grown at 18 °C for 20 h. Cells were harvested by centrifugation at 4000 g for 20 min and stored at −20 °C.
Harvested cells were resuspended in lysis buffer (50 mM sodium phosphate [pH 8.0], 300 mM NaCl, 20 mM imidazole, 10% glycerol, 0.5 mM EDTA, 0.5 mM TCEP, 1 mM phenylmethylsulfonyl fluoride [PMSF], and 5 mM benzamidine) and lysed by one pass through a cell disrupter (Constant Systems, Daventry, Northants, UK) at 30 KPSI. Insoluble material was removed by centrifugation at 46,000 g for 1 h at 4 °C, and the supernatant was filtered using a 0.22-µm cutoff membrane. Filtered material was loaded on a His-trap FF column (GE Healthcare, Amersham, Buckinghamshire, UK) preequilibrated with IMAC buffer (50 mM Tris [pH 8.0], 300 mM NaCl, 20 mM imidazole, 10% glycerol, and 0.5 mM TCEP). The column was washed with IMAC buffer modified with 40 mM imidazole. PFKFB3 was eluted from the column with IMAC buffer modified with 500 mM imidazole. To remove the His tag, fractions containing PFKFB3 were pooled and dialyzed overnight at 4 °C in 50 mM Tris (pH 7.5), 100 mM NaCl, 10% glycerol, 0.5 mM TCEP, 0.5 mM EDTA, and 5 mM NaPi containing 0.5 mM tobacco etch virus (TEV) protease. To isolate PFKFB3 without the His tag, the material was reapplied to a HisTrap FF column, and PFKFB3 was eluted with IMAC buffer supplemented with 40 mM imidazole. The TEV-cleaved PFKFB3 material was buffer exchanged into Resource Q buffer (50 mM Tris [pH 8.5], 10% glycerol, 0.5 mM EDTA, 5 mM NaPi, and 0.5 mM TCEP) using PD10 columns. PFKFB3 was then applied to a Resource Q column (GE Healthcare, Amersham, Buckinghamshire, UK) and eluted with an ascending linear gradient using Resource Q buffer supplemented with 1 M NaCl over 20 column values (CV). Fractions containing PFKFB3 were pooled, concentrated and then buffer exchanged into a Reactive Yellow chromatography buffer (50 mM Tris [pH 7.5], 5% glycerol, 0.5 mM EDTA, 0.5 mM TCEP, and 5 mM NaPi) using PD10s. PFKFB3 was loaded onto a Reactive Yellow 3–Agarose column (Sigma-Aldrich Co Ltd, Poole, UK) preequilibrated with Reactive Yellow buffer. Material was eluted in a 5 CV gradient using Reactive Yellow 3–Agarose buffer supplemented with 1 M NaCl. Fractions containing PFKFB3 were pooled, concentrated, and buffer exchanged into a crystallography buffer (20 mM Tris [pH 7.5], 10 mM NaPi, 5% glycerol, 0.5 mM TCEP, 0.5 mM EDTA, 1% PEG 400 [w/v], and 3 mM MgCl2). The protein concentration was adjusted to 4 mg/mL, and ADP and fructose-2,6-bisphosphate were added as required to a final concentration of 1.2 mM each.
Crystals of PFKFB3 in complex with ADP and fructose-2,6-bisphosphate were grown by the sitting drop method of vapor diffusion using drops comprising 600 nL protein (4 mg mL–1) and 200 nL of reservoir solution (16%–22% PEG3350 [50% w/v stock]) + 0.2 M sodium malonate (3.4 M stock, pH 7.0) equilibrated against 80 µL of reservoir solution in a MRC 96-well two-drop crystallisation plate (Molecular Dimensions, Newmarket, UK) at 20 °C. Crystals with a rod-shaped morphology appeared after 1 day. A robust platform was developed to support iterative co-structure determination, which involved soaking crystals overnight in 2.5 mM compound (50 mM stock in 100% DMSO), 25% PEG3350 (w/v), and 0.2 M sodium malonate (pH 7.0). Crystals were subsequently flash-frozen in liquid nitrogen using 35% ethylene glycol + 2.5 mM compound, 25% PEG3350 (w/v), and 0.2 M sodium malonate (pH 7.0) as cryoprotectant. Data were collected at 100 K for PFKFB3 crystals soaked with solutions of
The structures of PFKFB3 in complex with
Results
To identify the best series of active compounds to progress into the optimization phase of the project, a series of experiments was carried out to generate data on which decisions could be made. This process confirmed the dihydropyrrolopyrimidinone series of compounds as inhibitors of the PFKFB3 enzyme. In summary, the hit-finding assays comprised an initial single concentration of compound to measure inhibition (“primary spot test”) using an ADP-Glo format and a secondary IC50 follow-up test using the same experimental format with an artifact arm run to assess whether compounds inhibited the luciferase detection arm alone. Compounds were then further profiled in an orthogonal Transcreener ADP Fluorescence Intensity assay at multiple compound concentrations, before selected compounds were tested at various substrate and enzyme concentrations in the original ADP-Glo format to identify aggregating compounds and ascertain the mode of compound inhibition. Selected example compounds were then tested in ITC and nephelometry and subjected to crystallography.
Specifically, 837,387 unique compounds were tested in the high-throughput screen, which is a large subset of the AstraZeneca compound collection, stratified to represent compound diversity and attractive physicochemical properties. 25 The distribution of compounds was centered on 0% inhibition with 97.5% of results between −30% and +30% inhibition (see Suppl. Fig. S2 ). In total, 21,728 compounds were assessed to show statistically significant inhibition based on plate-by-plate assessment. As follow-up concentration response capacity was limited to 10,000 compounds, a compound selection strategy was required and a combination of selection approaches was adopted. The primary approach took those statistically significant hits with greater or equal to 40% inhibition (9862 compounds) as the base set for analysis. These compounds clustered with a Tanimoto distance of 0.3 into 832 clusters of three or more members (the largest having 70 members), 636 clusters with two members, and 3490 clusters with only a single member (singletons). Assessment of hit quality was made through a scoring matrix based on a range of data:
The ratio of active (≥40%) to inactive compounds within a Tanimoto distance of 0.3 to the active cluster seed compounds (large ratio scored highly)
The size of active clusters (large clusters scored highly)
The historic hit rate of compounds in AstraZeneca HTS assays (low hit rate scored highly)
Statistical assessment by in-house software that identifies compounds that frequently appear as actives in HTS screens, 17 which was carried out for all assays and specifically for chemiluminescent end-point assays (low probability of frequent/false hits scored highly)—note there will be some overlap with pan-assay interference compounds (PAINS) compounds, but these are not specifically PAINS filters
Estimated pIC50 extrapolated from single-point HTS data assuming single binding and a Hill slope of 1 (high pIC50 scored highly)
Ligand efficiency (LE) measure [estimated pIC50/heavy atom count] (high LE scored highly)
Lipophilic ligand efficiency measure [estimated pIC50 – cLogP] (high numbers scored highly)
The sum of scores from all these categories was used to rank compound quality. Extremely negative scores in any one category were flagged as potential exclusion criteria, although a relative rather than categorical scoring approach was followed. The quality of clusters was assessed by the average quality score of individual cluster members. Five tiers of clusters were identified from this scoring approach and identification of compounds for follow-up concentration response selected. For the 21 leading clusters, all actives (≥40% inhibition) and all near-neighbors (within Tanimoto distance of 0.3 of actives) were selected (591 compounds); for the 266 second-tier clusters, all actives (≥40% inhibition) and all statistically significant near-neighbors were selected (3097 compounds); for the 1668 third-tier clusters, only actives (≥40% inhibition) were selected (2743 compounds, including 186 doubleton clusters and 1235 singletons); and for the 375 fourth-tier clusters, only higher quality scoring actives (≥40% inhibition) were selected (531 compounds, including 208 compounds from doubleton clusters). A significant number of active compounds with ≥40% inhibition were not selected for follow-up testing by this method, 967 compounds from fourth-tier clusters were dropped, and all 2628 fifth-tier clusters were dropped (3295 compounds, including 242 doubleton clusters and 2255 singletons). In addition, compounds from an analysis of structural cores that were overrepresented in the active set (i.e., statistically significant hits with ≥40% inhibition) relative to the inactive set (identified by in-house software) were also selected for follow-up (1437 compounds). Similarly, active compounds identified as fragment and lead-like library hits (10 heavy atoms or less) were selected (692 compounds). Thus, 9091 compounds were selected for IC50 testing, from which 8931 IC50 measurements were obtained.
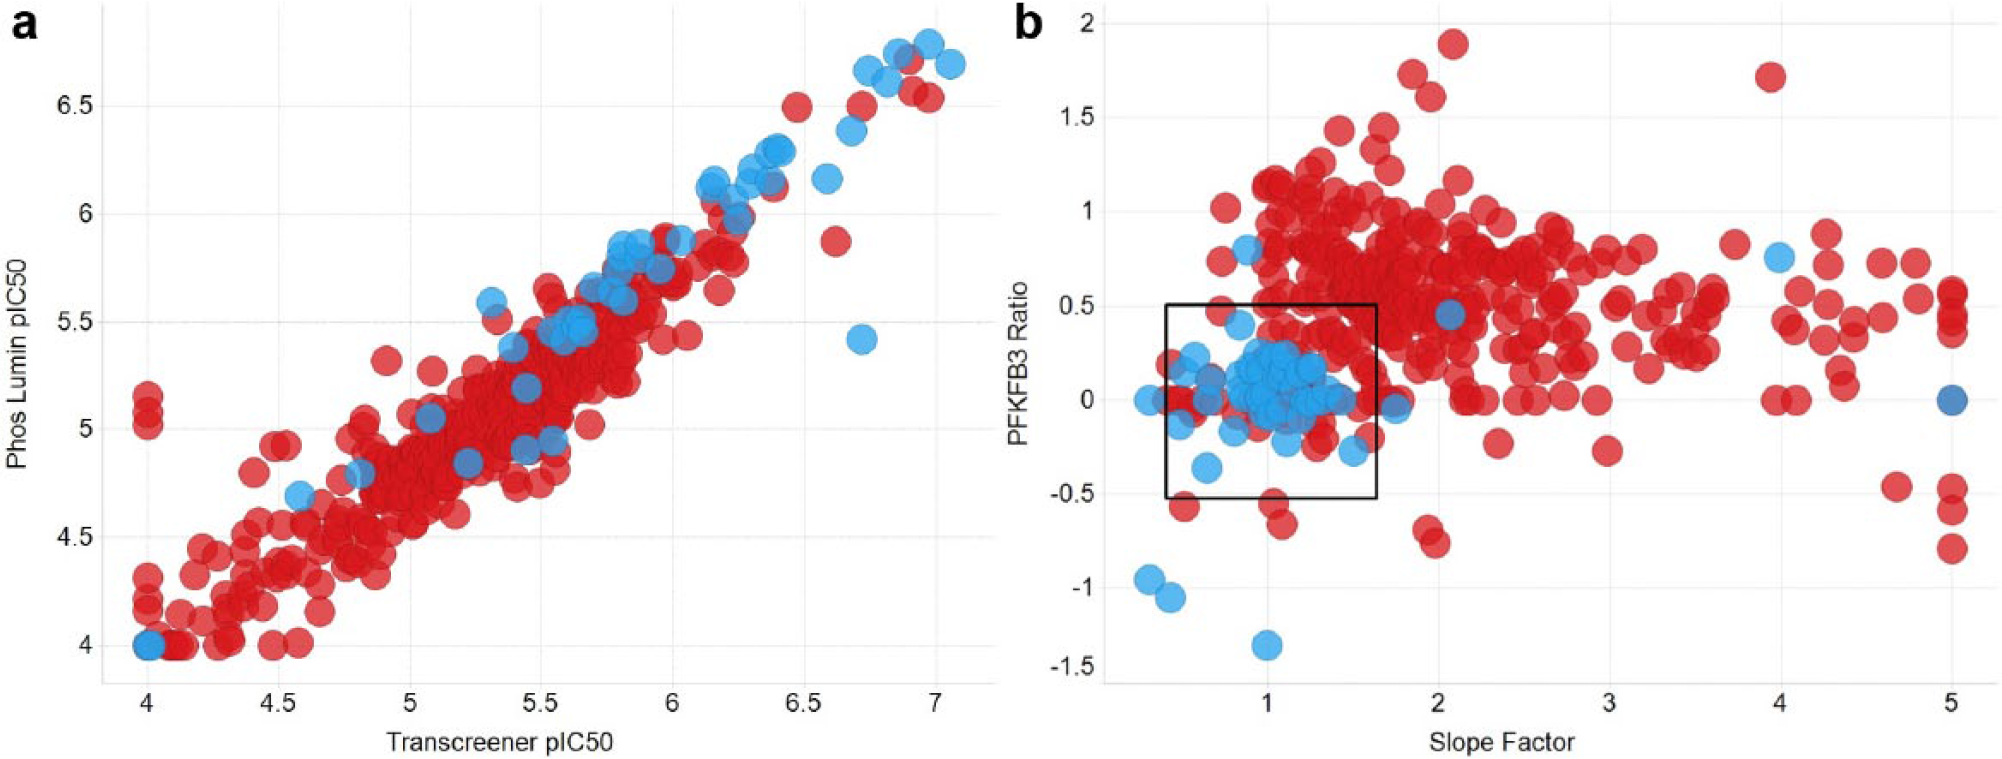
Cheminformatic analysis of the 8931 repeat IC50 values identified 457 compounds for further testing in the primary and orthogonal assays, with a range of chemotypes and up to 40 members in a single cluster. This set gave 391 IC50 results and 54 separate chemotypes. The results from both assay technologies correlated reasonably well, suggesting these compounds were real hits, with a few exceptions off the unity line that appeared to be false positives (see Fig. 2a ).
(
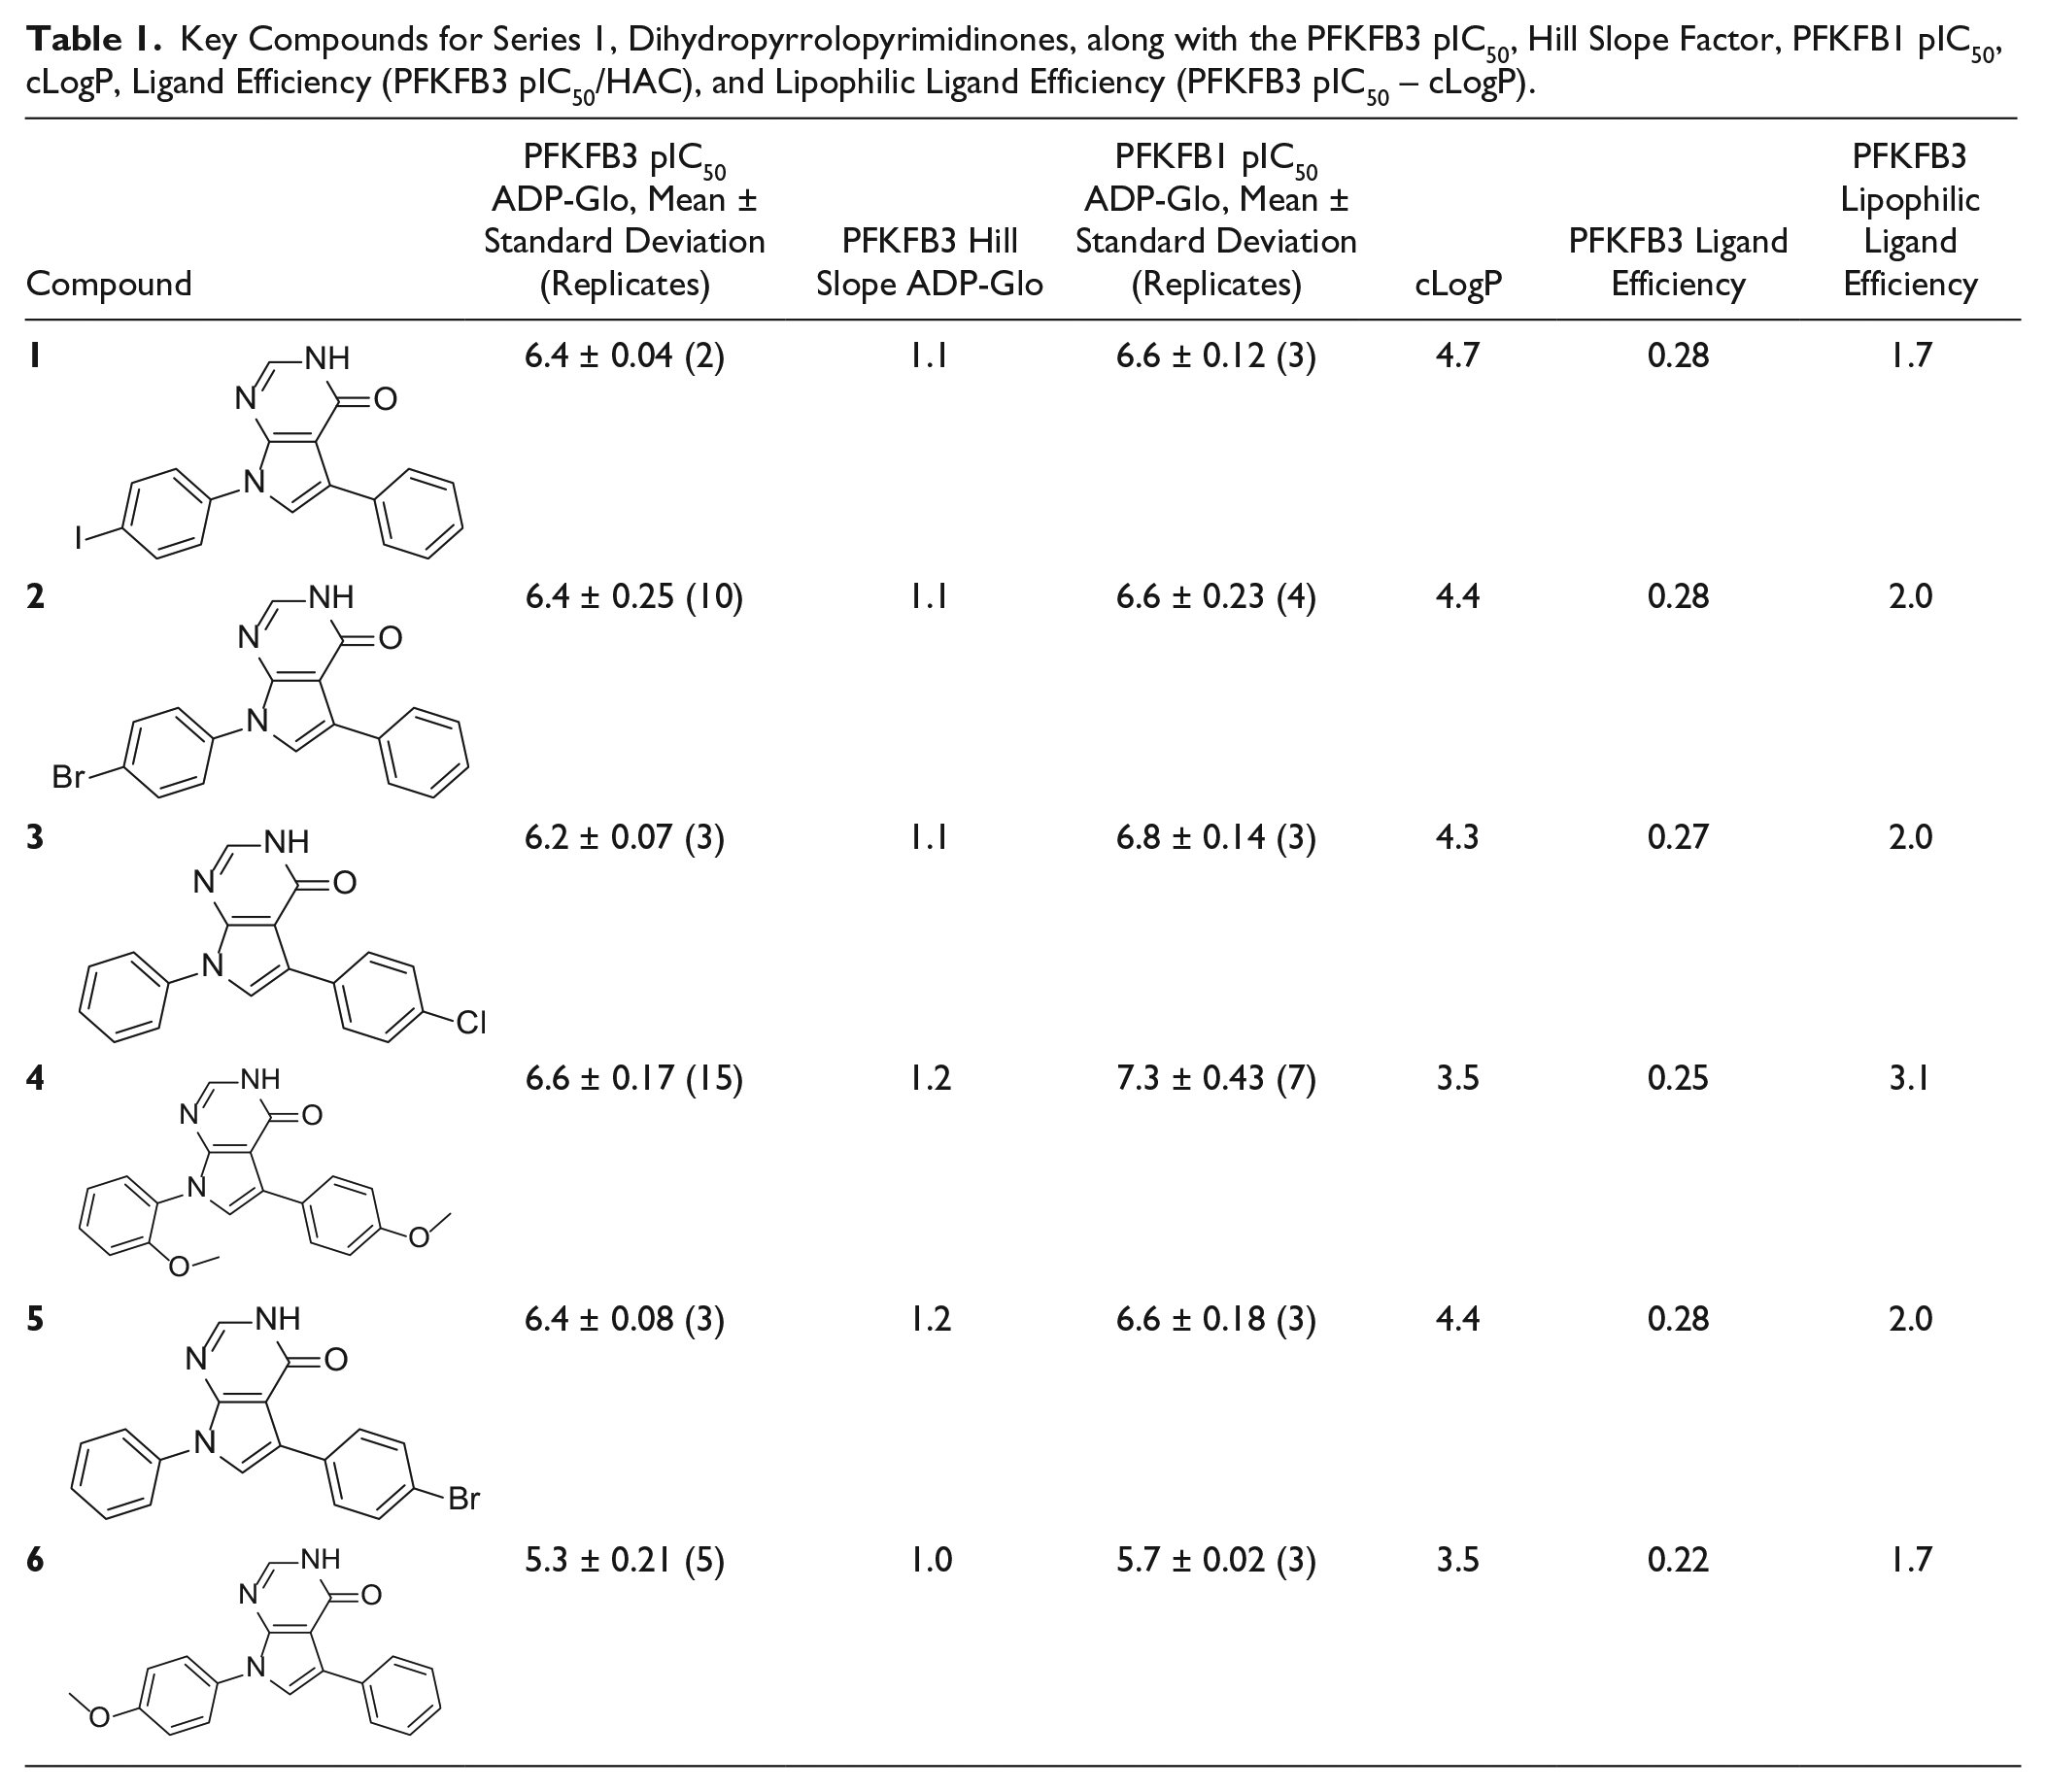
However, it was noted that the Hill slope of IC50 curves of many of the compounds and clusters of potential interest were significantly higher than 1, raising concern that nonspecific effects could be behind the activity seen. Confirmatory ratio testing was carried out, allowing comparison of the original IC50 results with values obtained from the assay run at 10 times the enzyme concentration. Compounds that maintained their inhibitory potency were judged to be true inhibitors while artifacts, through nonspecific effects, resulted in a change in apparent IC50. As the ratio is a combination of two assay results, the random errors are additive, and the estimated standard deviation of a single assay is approximately 0.3 units of pIC50, so the combined standard deviation is approximately 0.5 pIC50 units. Thus, a ratio value of between −0.5 and 0.5 was judged to be acceptable. The Hill slopes from IC50 curves were also included in the detailed analysis, with slopes between 0.8 and 1.5 being considered acceptable. Combining these two methods for analyzing the compounds showed that many compounds, often belonging to whole series, fell outside the acceptable regions (see Fig. 2b ). Some series occupied the lower left quadrant of the desirable profile, suggesting these were real hit series. The series with the highest average potency and good behavior in the Transcreener enzyme assay, ratio test, and Hill slope analysis was series 1, dihydropyrrolopyrimidinones, which have been reported previously as having antimicrobial activity. 26 Thirty-two dihydropyrrolopyrimidinone compounds were identified in the HTS and a further 22 were identified in the AstraZeneca compound bank by substructure searching and were subsequently tested. The results for key compounds are summarized in Table 1 and more extensively in the Supplementary Table S2 .
Key Compounds for Series 1, Dihydropyrrolopyrimidinones, along with the PFKFB3 pIC50, Hill Slope Factor, PFKFB1 pIC50, cLogP, Ligand Efficiency (PFKFB3 pIC50/HAC), and Lipophilic Ligand Efficiency (PFKFB3 pIC50 – cLogP).
To further characterize prioritized hits, five compounds were tested in an isothermal titration calorimetry experiment to confirm binding, and the results of all clearly indicated there was no heat change. The two most likely explanations for these results are that the compounds were nonbinders, or that the enthalpy of binding was not measurable under the conditions used. The compounds tested were
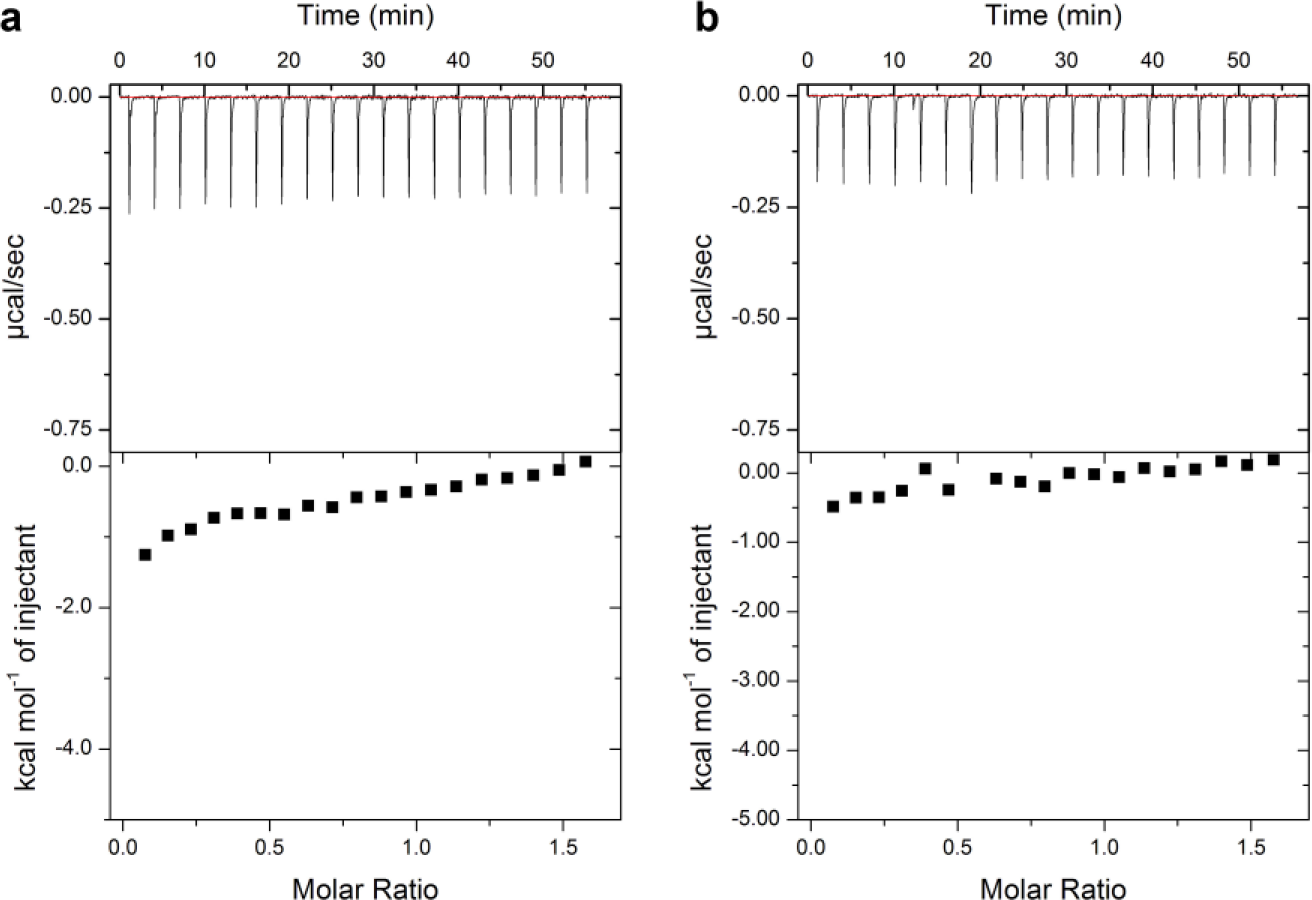
Isothermal titration calorimetry results for
X-ray crystallography structures were solved for PFKFB3 in complex with
Compound
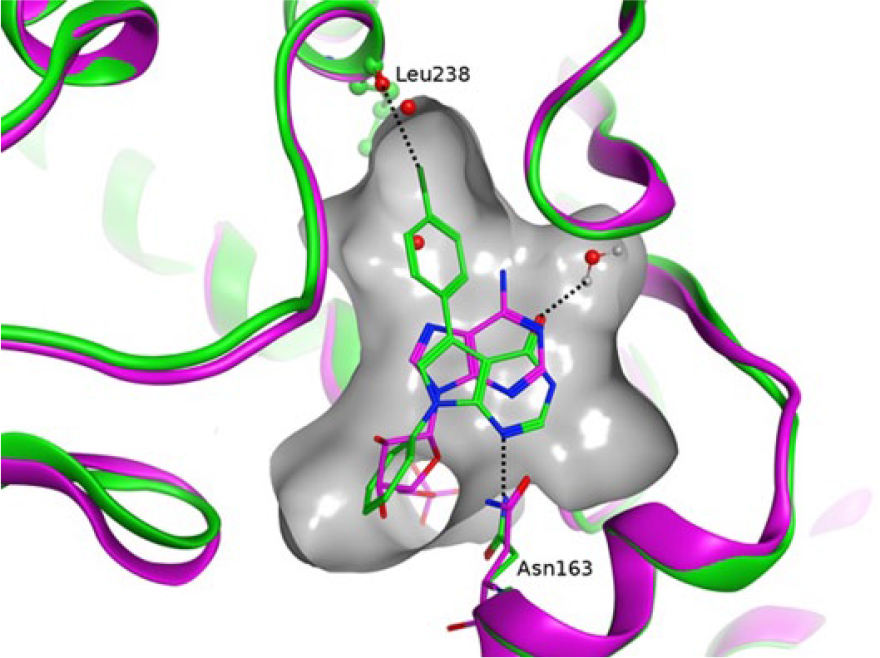
The structure of
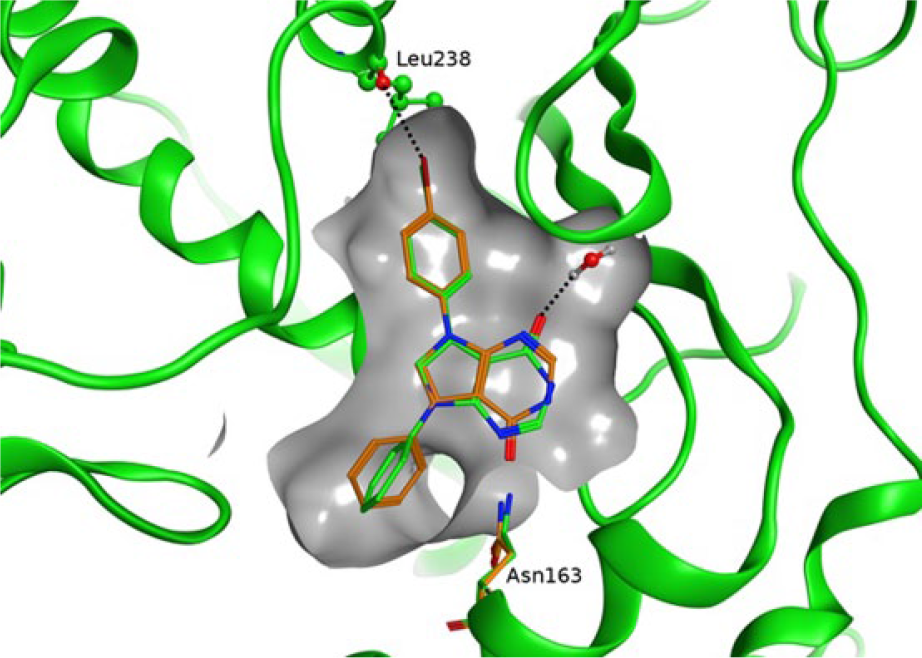
Overlay between compound
The crystal structures of
These biochemical and biophysical experiments provided the necessary information to make rigorous decisions about the best compound series to progress into the optimization phase of the drug discovery project.
Discussion
The key challenge to analyzing the results of a high-throughput screen is to identify the “right” compounds to take forward for further chemical optimization. Once selected, the core template of a series is often clearly recognizable throughout the project lifetime, all the way to the clinic if the project is successful, so this is an important investment decision. The “right” compounds have good lead-like properties28,29 and are confirmed active in multiple assays using orthogonal technologies. Initially, the PFFKB3 HTS seemed to have behaved well, with a response centered on 0% inhibition with a reasonable distribution, suggesting that anything above 40% inhibition was a real hit. The orthogonal assays correlated reasonably well, suggesting the hits were not interfering with the HTS technology. This was a concern as the ADP-Glo enzyme assay is coupled (measures binding by a two-step process), providing more than one way for compounds to interfere and appear as false positives. However, careful historic analysis and structural analysis did not identify any suggestion that the dihydropyrrolopyrimidinone “actives” discovered for PFKFB3 interacted with proteins in undesired and nonspecific ways. Analysis of IC50 Hill slopes and further work with “ratio testing” (comparing compound inhibition results with an assay that has a 10-fold increase in enzyme concentration coupled with a 10-fold decrease in incubation time) showed that many series behaved as nonspecific inhibitors and appeared to be false positives. A combination of the two measures was useful, for while there was general agreement between the two assessment measures, the combination of the two methods was more discriminatory in the identification of series with false-positive activities. This gave confidence in de-prioritization of compounds as there were no obviously unattractive structural features in these compounds, nor was there previous evidence of nonspecific behavior. Also, consideration of both the Hill slope and the ratio data assisted in the assessment of series as a whole, since individual compounds alone could behave either well or poorly in either assessment, as would be expected due to random errors. This assessment of nonspecific behavior dramatically reduced the number of series under consideration, showing this HTS suffered from a high false-positive rate. To explore the possible causes of this behavior, nephelometry, redox potential, and purity measurements were made. While there was some loose association with unacceptable Hill slopes and IC50 ratios, it was not clear what caused this high false-positive rate as these results did not reveal a clear or consistent pattern. Compound solubility studies have been reported to be an important means to judge the veracity of hit compounds and to prioritize them for further studies. 30 However, we did not see a clear correlation between solubility and slope analysis or ratio testing data ( Suppl. Fig. S6 ). Based on our experience, we question the value of nephelometry as a post-HTS triage step. While a general trend was observed that an increasing proportion of compounds failed the ratio test as the highest soluble concentration decreased, it was not a definitive agreement. Application of solubility measures alone to remove compounds from further consideration would have retained 50 that failed the ratio test (13.6% of those tested). Eighty-five compounds that passed the ratio test (23%) would have been excluded ( Suppl. Fig. S7 ). This was deemed too high risk a strategy for large-scale application.
Published pan-assay interference compounds (PAINS) 31 were not explicitly removed from the HTS results, although compounds identified within AstraZeneca’s compound set to be statistically overrepresented in HTS actives were removed. Although PAINS (which could also be known as frequent hitters, or false positives) are important considerations during an HTS workup, they might also be true positives and interesting starting points (as well as marketed drugs 31 ), and in this PFKFB3 assay, many non-PAINS compounds were identified as false positives through rigorous biochemical and biophysical analysis, leading us to conclude that, for whatever reason, our PFKFB3 assay was particularly susceptible to artifactual inhibition.
Isothermal titration calorimetry can be used to confirm whether a compound is binding to a protein target, but for the dihydropyrrolopyrimidinone series identified here, the results showed no saturable heat change. This was a curious result as all the other biochemical methods were confirming this series as our most potent and promising set of compounds. The X-ray crystallography results that were obtained subsequent to the ITC results consistently demonstrated binding, confirming the biochemical results. It is possible that under the conditions of the ITC experiment, there is no binding for these compounds, although other compounds did demonstrate binding (data not shown). Alternatively, these compounds do not generate heat on binding; in other words, there is no enthalpic component to the binding energy, and for exergonic binding, it is purely entropically driven. If this is the case, the interactions observed between the compounds and the protein in the X-ray structure are enthalpically neutral on binding, being balanced by the energy to break the same interacting features in the unbound system with solvent. This has interesting implications for the binding nature of the sigma-hole interaction between the halogen atoms and the backbone carbonyl oxygen in this system, suggesting either there is no enthalpy change for this interaction, or any enthalpy is balanced by other interactions.
If the binding is exergonic with no enthalpic component, then it is due to an increase in disorder of the system. The X-ray crystallography structure of the ADP complex shows two water molecules in the active site in a buried pocket that are displaced on binding these compounds. This release into bulk solvent might increase the disorder of the system. The series of compounds is rigid, so little ordering is required on binding (a small negative entropy change) and reduces the magnitude of unfavorable Gibbs free binding energy change.
The binding modes of
Further label-free biophysical measurements, such as surface plasmon resonance or dialysis, could have been carried out, which are complementary to the calorimetry assessment, but the focus of the study in an industrial drug discovery context was to rapidly identify the best series of compounds to progress. The data collected in this study were already considered sufficient for rigorous decision making, and the primary goal was to confirm engagement with the PFKFB3 molecular target, so no further studies were embarked on.
An example of a series that was rejected because of a combination of high Hill slopes and poor ratio tests (i.e., the PFKFB3 pIC50 changed by about a log unit at 10 times the enzyme concentration) is the aminotriazoloquinolinones (typified by compounds in Suppl. Table S3 ). This series was identified by HTS as a potent cluster of compounds but was discarded early, and consequently, these compounds were not progressed to biophysical profiling by ITC and X-ray crystallography.
The series of dihydropyrrolopyrimidinone compounds identified has good potency for the number of heavy atoms (ligand efficiency) and molecular weight, but their lipophilicity is relatively high, and thus an optimization campaign would need to improve the potency for its lipophilicity (lipophilic ligand efficiency). The HTS identified a separate series of compounds with better lipophilic ligand efficiency, which was selected, and the optimization of this series and progression toward cell activity have been reported, 32 which showed an approximately 100-fold drop-off in potency in the cell compared with their enzyme potency. Some of the more potent dihydropyrrolopyrimidinone compounds were tested in this cell assay but showed no activity at 30 µM, as expected from their enzyme potency.
Although selectivity over other PFKFB isoforms was not a key criterion at this stage, it was measured for a few compounds, and the dihydropyrrolopyrimidinone series was slightly more potent at PFKFB1, whereas the series eventually progressed had slightly better selectivity over PFKFB1.
Footnotes
Acknowledgements
We are grateful to AstraZeneca and Cancer Research Technology for support. We thank Diamond Light Source for access to beamline I03.
Supplementary material is available online with this article.
Declaration of Conflicting Interests
The authors declared no potential conflicts of interest with respect to the research, authorship, and/or publication of this article.
Funding
The authors disclosed receipt of the following financial support for the research, authorship, and/or publication of this article: Funding was provided by AstraZeneca and Cancer Research Technology.
References
Supplementary Material
Please find the following supplemental material available below.
For Open Access articles published under a Creative Commons License, all supplemental material carries the same license as the article it is associated with.
For non-Open Access articles published, all supplemental material carries a non-exclusive license, and permission requests for re-use of supplemental material or any part of supplemental material shall be sent directly to the copyright owner as specified in the copyright notice associated with the article.