
Abstract
A high rate of glycolysis, which supplies energy and materials for anabolism, is observed in a wide range of tumor cells, making it a potential pathway to control cancer growth. ALDOA is a multifunctional enzyme in the glycolytic pathway and also promotes HIF-1α, which is of importance in hypoxic solid tumors. The current method for assaying ALDOA activity involves monitoring the consumption of NADH in vitro using absorbance or intrinsic fluorescence via a coupled enzymatic reaction. Here, we report the development of a homogeneous biochemical assay that can overcome limitations of current methods, in particular for the application of high-throughput drug screening. The assay utilizes the commercially available Elite NADH Assay Kit, which incorporates an enzymatic reaction to measure the level of NADH using a fluorescent probe. Assay optimization and validation are discussed. Its feasibility for high-throughput screening (HTS) was demonstrated by screening 65,000 compounds for the identification of small molecules that inhibit ALDOA. Through a validation screen and dose–response evaluation, four inhibitors with IC50 below 10 µM were identified. In conclusion, we demonstrate that a traditional ALDOA assay can be transformed readily into a fluorescence-based assay utilizing a commercial NADH detection kit that is rapid, sensitive, inexpensive, and HTS friendly.
Introduction
In culture, cancer cells greatly utilize glycolysis for their energy needs, as was originally recognized by Otto Warburg.
1
While initially attributed to defective mitochondrial oxidative phosphorylation,
2
subsequent studies revealed a normal level of oxidative phosphorylation in cancer cells3,4 and high rates of glycolysis in many actively dividing (noncancerous) cells, where in most cases neither ATP nor NADH is limiting for cell growth. It is now thought that glycolysis is critical as a source of metabolic intermediates for efficient anabolism.5,6 Hypoxic conditions (<1% O2 compared with 3%–15% O2 found in normal tissues) are typical of solid tumors, owing to abnormal vasculature and decreased blood flow.
7
In response, cells increase the expression of the hypoxia-inducible transcription factors 1 and 2 (HIF-1/2) to promote angiogenesis and activate cell survival pathways.
7
Tumor hypoxia, acting through increased levels of HIF-1, provides a further stimulus to glycolysis by inducing the expression of the glucose transporter 1 (GLUT-1) and a number of glycolytic enzymes,
8
including aldolase A (ALDOA). ALDOA catalyzes the reversible aldol cleavage of fructose-1,6-bisphosphate (F-1,6-BP) into
Relative to the two other isoforms, ALDOB/C, ALDOA is significantly elevated in a wide variety of human tumor types,13–16 and high ALDOA levels have been associated with decreased patient survival. 16 Two biological activities of ALDOA may promote features of the cancer cell phenotype. First, the glycolytic activity of ALDOA is critical for energy supply, as well as for providing metabolic building blocks for the synthesis of cancer cell biomass.5,6 Second, a glycolysis-HIF-1 feed-forward loop maintains the activity of HIF-1 in the hypoxic environment of solid tumors. 17 Despite the important therapeutic interest, identification of ALDOA inhibitors has been hampered by the lack of assays amenable to high-throughput small-molecule screening.
Here, we present a biochemical assay that can monitor the enzymatic activity of ALDOA by taking advantage of a commercial NADH assay kit. This fluorescence-based assay was optimized for a 384-microwell format and used to cost-efficiently identify inhibitors that block ALDOA activity. To the best of our knowledge, the high-throughput screening (HTS) of ALDOA has yet to be reported, and thus this research is expected to further facilitate the development of ALDOA-targeted cancer therapeutics.
Materials and Methods
Aldolase enzyme (ALDOA) was either purchased from Novous Biologicals (NBP1-40395, Littleton, CO) or prepared using a pNIC28-Bsa4 expression vector subcloned with full-length ALDOA (amino acids 1–364) with an N-terminal His6-tag fusion peptide. In detail, BL21 (DE3) Escherichia coli cells were transfected and expressed overnight and the enzyme was purified out of the lysate using Ni-NTA agarose beads (Qiagen, Valencia, CA) according to the manufacturer’s procedure. F-1,6-BP and β-NADH were purchased from Thermo Fisher (F0752 and N8129, Waltham, MA). Triose-phosphate isomerase (TPI) was purchased as a mixture with α-glycerophosphate dehydrogenase (α-GDH) from Sigma-Aldrich (G1881, St. Louis, MO). α-GDH, phosphate-buffered saline (PBS), HEPES, Triton X-100, NP-40, and bovine serum albumin (BSA) were purchased from Sigma-Aldrich (G6880, P4417, H3375, P1379, 492018, and A2153). Tween 20 was purchased from Amersham Biosciences (17-1316-01, Buckinghamshire, UK). Naphthyl 2,6-bisphosphate (ND1) was synthesized in-house as previously reported. 18 The Elite NADH assay (hereinafter referred to as “Elite kit”) was purchased from eEnzyme (Gaithersburg, MD). The Elite kit was prepared according to the manufacturer’s protocol, added to the assay, and allowed to develop fluorescence at room temperature for 30–60 min before reading on a plate reader.
In general, assays were performed in an assay buffer (1× PBS and 0.1% BSA) using a 384-well polystyrene plate (hereinafter referred to as “assay plate”). Black polystyrene proxyplates (PerkinElmer, 6008260, Waltham, MA) and clear polystyrene plates (Nunc, 262160, Roskilde, Denmark) were used for fluorescence and absorbance reading, respectively. Compounds were diluted in 384-well polypropylene plates (hereinafter referred to as “dilution plate,” Greiner, 781280, Monroe, NC). All assays were performed at room temperature. Fluorescence signal was measured using a Synergy H4 plate reader (Biotek, Winooski, VT) with excitation (ex) and emission (em) set at 540 and 590 nm, respectively. Absorbance was measured using a Synergy H4 plate reader at 340 nm. All liquid handling was performed using a Janus automated workstation (PerkinElmer) or MicroFloSelect (Biotek).
Chemical Compounds
A total of 65,257 compounds were tested for either pilot or primary screenings from the following compound libraries: NIH clinical collection (674 compounds; Evotec, San Francisco, CA), Spectrum collection (2000 compounds; MicroSource Discovery, Gaylordsville, CT), Lopac (1280 compounds; Sigma-Aldrich), fragment sets (18,143 compounds) obtained from Chembridge (San Diego, CA) and Chemdiv (San Diego, CA), kinase set (11,250 compounds; Chembridge), and diversity sets (29,718 compounds) obtained from NCI, Chemdiv, and Maybridge (Thermo Fisher). Additionally, two other libraries were interrogated: (1) a kinase-focused library (600 compounds), custom selected by the Texas Screening Alliance for Cancer Therapeutics (TxSACT) from various vendors (this collection has known activity against around 100 kinases), and (2) an academic collection (2000 unique molecules) with diverse pharmacophores deposited from chemists at The University of Texas at Austin and the University of Kansas. Compounds are plated in either 96- or 384-well plates dissolved in 100% DMSO at 10 mM concentration, in general. While most wells are filled with compounds, wells in columns 1 and 12 in a 96-well format or columns 1, 2, 23, and 24 in a 384-well format are filled with pure DMSO (without any compounds) to serve as controls. Because DMSO is present in every well of every plate at a constant concentration, any DMSO-dependent activity drop will be uniform across the whole screen, and thus the potential of false positives due to the presence of DMSO is negligible.
Development and Optimization of a Fluorescence-Based ALDOA Assay
Optimum ALDOA and substrate concentrations were first determined in an assay volume of 10 µL as follows: (1) Varying concentrations of ALDOA (0, 2.5, 5, 10, and 20 nM, final concentration) dissolved in an assay buffer (1× PBS and 0.1% BSA) were mixed with substrate mixture (1.9 mM F-1,6-BP, 40 µM NADH, and 1.67 U/mL α-GDH, final concentration) prepared in an assay buffer and incubated at room temperature to initiate glycolysis. After a certain period of incubation (0, 10, 20, 40, 60, 80, and 100 min), 10 µL of the Elite kit was added and the resulting fluorescence signal was monitored for 30 min. (2) A 5 µL mixture of 10 nM ALDOA, 80 µM NADH, and 3.2 U/mL α-GDH was added to 5 µL of varying concentrations of F-1,6-BP (0, 10, 31.6, 100, 316, 1000, and 3160 µM, final concentration) in an assay buffer. After a 40 min incubation, 10 µL of the Elite kit was added and incubated for 30 min. The fluorescence was monitored to calculate Km by converting the intensity to a rate according to the equation, Rate = (FIsample – FIbackground)/40 min.
Assessment of assay tolerance for detergents and DMSO was conducted by dispensing 5 µL of ALDOA dissolved in a 1.5× assay buffer into an assay plate and incubating with 2.5 µL of variable amounts of detergent or DMSO diluted in water for 1 h. The ALDOA reactions were initiated with the addition of 2.5 µL of substrate mix (F-1,6-BP, NADH, and α-GDH prepared in an assay buffer). Reactions were incubated for 40 min prior to the addition of 10 µL of the Elite kit, followed by monitoring the fluorescence signal after a 30 min incubation. The final assay contained 2.5 nM ALDOA, 100 µM F-1,6-BP, 40 µM NADH, 1.67 U/mL α-GDH, and varying concentrations of detergent (Triton X-100, Tween 20, or NP-40 at 0, 0.003, 0.006, 0.012, 0.025, 0.05, and 0.1% [w/v]) or DMSO (0, 0.04, 0.08, 0.16, 0.31, 1.25, 2.5, 5.0, and 10% [v/v]). Assay stability was conducted with assay compositions at 5 nM ALDOA, 100 µL of F-1,6-BP, 40 µM NADH, and 1.67 U/mL α-GDH. First, 5 µL of ALDOA in 1.5× assay buffer was preincubated with 2.5 µL of 2% DMSO diluted in water for different times (0, 10, 30, 60, and 150 min) at room temperature. Reactions were initiated by the addition of 2.5 µL of substrate mix. Reactions were incubated for 40 min and quenched with 10 µL of the Elite kit, followed by monitoring fluorescence after 30 min.
Buffer variation and the effect of TPI were tested using 2.5 nM ALDOA, 100 µM F-1,6-BP, and 40 µM NADH, and absorbance of NADH was recorded. HEPES at 25 mM and pH 7.5 was used in place of PBS. Premixed 1.67 U/mL α-GDH:TPI was used in place of 1.67 U/mL α-GDH with other substrate mix.
Assay Validation
Final concentrations of the assay components were set to 5 nM, 100 µM, 40 µM, 1.67 U/mL, and 0.01% for ALDOA, F-1,6-BP, NADH, α-GDH, and Triton X-100, respectively. Assay validation using ND1 was conducted using a twofold dilution series of ND1, starting from 100 µM. Full plate validation was carried out by filling half of the assay plate with 4 µL of ALDOA dissolved in 1.5× assay buffer containing 0.01% Triton X-100 and the other half of the plate with 1.5× assay buffer containing 0.01% Triton X-100 using a Janus liquid handler. The plate was spun down at 800 rpm for 1 min. Two microliters of 2% DMSO diluted in water was dispensed using a Janus liquid handler to mimic compound dilution and incubated for 40 min. Two microliters of substrate mixture containing 0.01% Triton X-100 was dispensed into assay plates using a Janus liquid handler. The assay plates were spun down at 800 rpm, sealed, and shaken at 250 rpm for 5 min, followed by another 1 min spin-down at 800 rpm. After 40 min of incubation, 8 µL of the Elite kit was dispensed into the assay plate using a Microflo select. The assay plates were spun down at 800 rpm for 1 min and sealed. Fluorescence was read after a 30 min incubation.
Primary Compound Screening
The final concentrations of components for pilot screening are 100 µM, 40 µM, 1.67 U/mL, and 0.01% for F-1,6-BP, NADH, α-GDH, and Triton X-100, respectively. Detailed procedures are illustrated in Figure 1A . Two ALDOA concentrations at 2.5 and 5 nM with various assay times (15, 30, and 45 min) were tested. Columns 1–22 in each assay plate were filled with ALDOA dissolved in an assay buffer containing 0.01% Triton X-100, while columns 23 and 24 were filled with assay buffer containing 0.01% Triton X-100 (without ALDOA). Whole library screening (HTS) was conducted in the manner of the pilot screen, except the ALDOA concentration used was 2.5 nM and the assay incubation time after adding substrate mixture was set to 30 min. All compounds were screened at 50 µM concentration as a singleton.
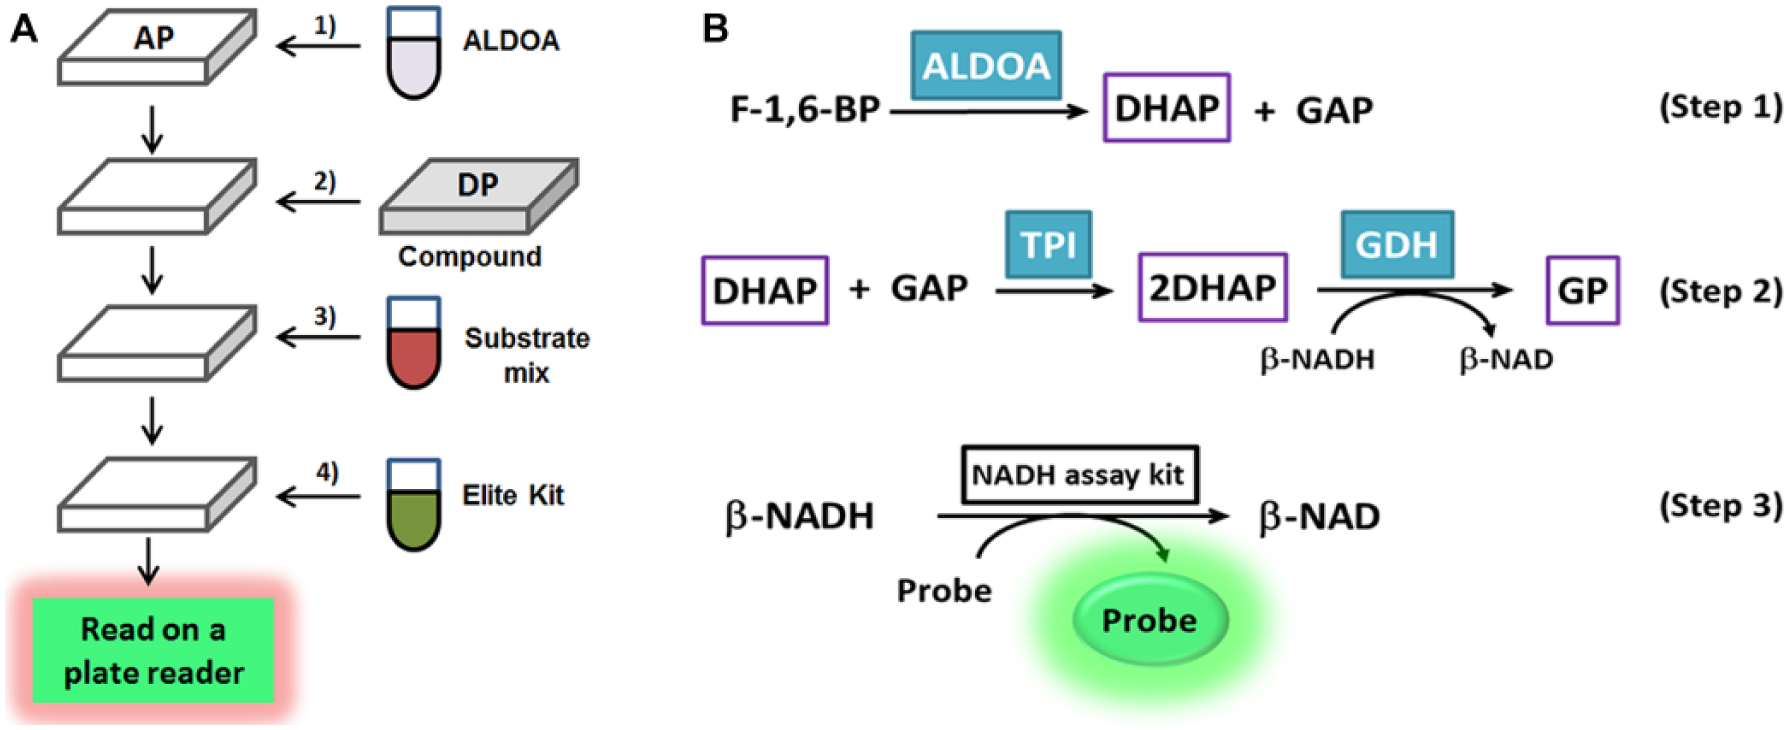
Schematic illustration of aldolase HTS procedure (
Confirmation Screen
Compounds selected from the primary screen were cherry-picked and rescreened using the same assay. Counterscreen assay 1 (C1) was conducted as the primary screen, except that negative and positive controls were reversed. Countercreen assay 2 (C2) was conducted by omitting ALDOA, F-1,6-BP, and α-GDH from the primary screen assay. Concentration–response curve (CRC) validation used the same assay as the primary screen with a twofold dilution series of selected compounds starting from 50 µM.
Results
Development and Optimization of a Fluorescence-Based ALDOA Assay
ALDOA activity was typically assayed by monitoring NADH levels via a coupled enzymatic reaction using glycerol-3-phosphate dehydrogenase and TPI (α-GDH/TPI) (
Fig. 1B
, Steps 1 and 2). These two enzymes work in sequence, where the first helper enzyme (TPI) ensures rapid interconversion of GAP and DHAP and the second helper enzyme (α-GDH) converts DHAP to
Commercial NADH Assay Kits.
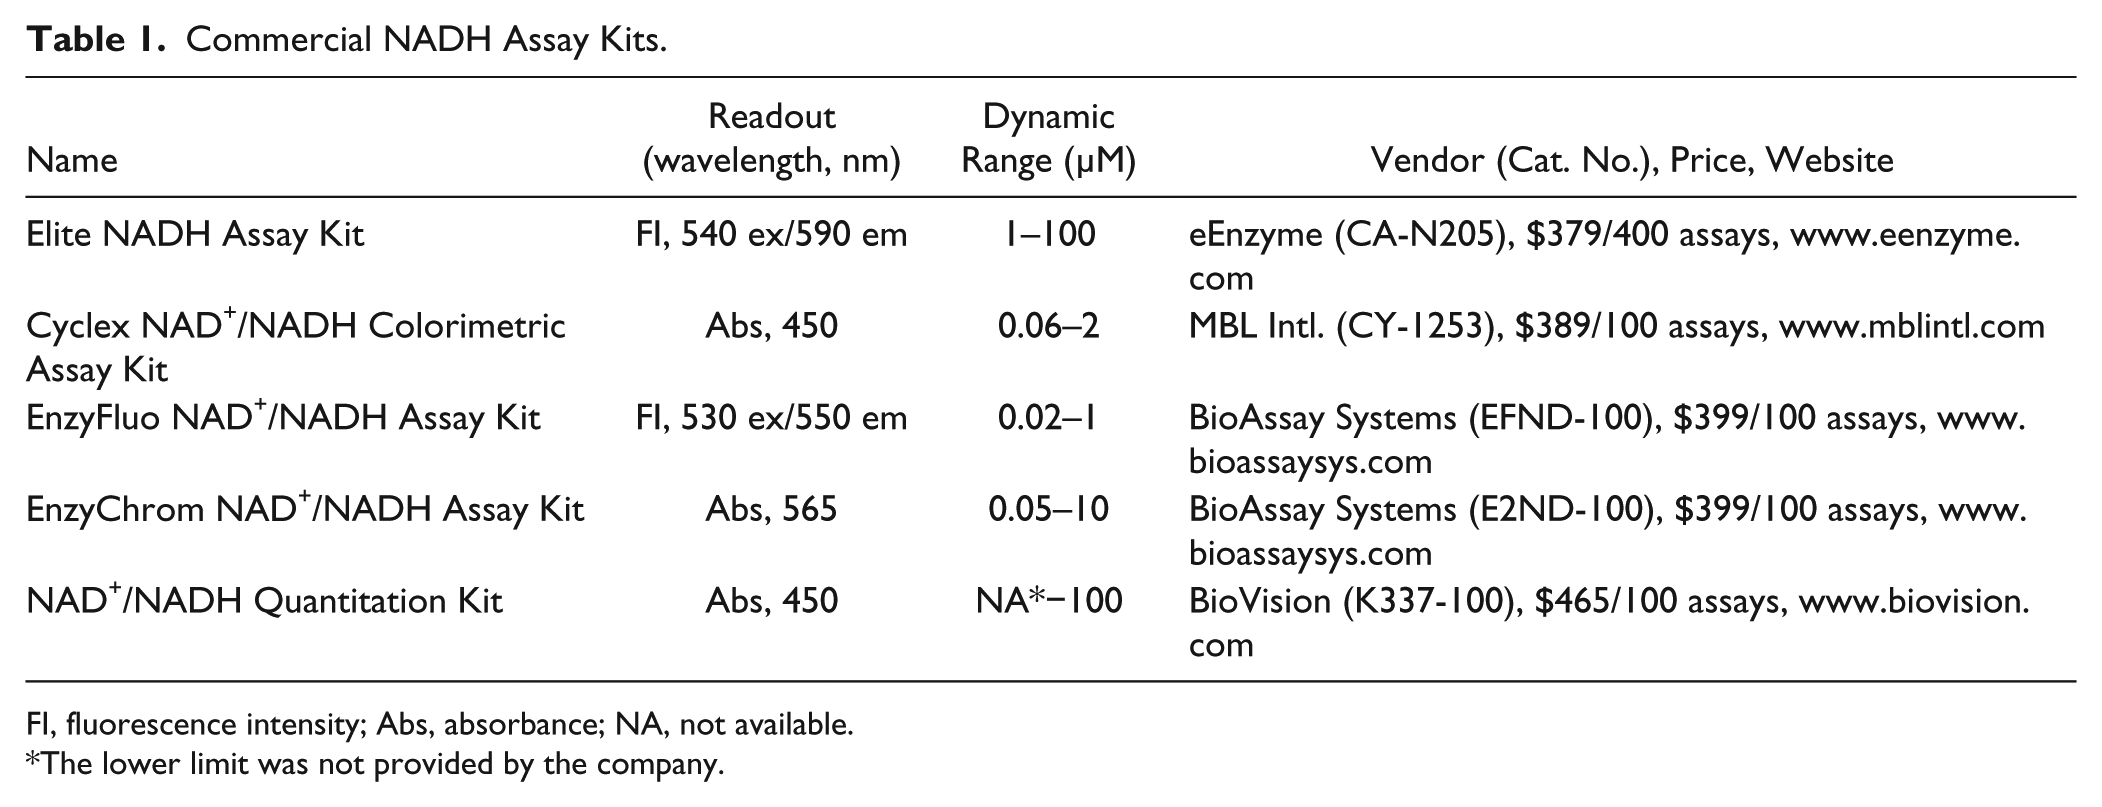
FI, fluorescence intensity; Abs, absorbance; NA, not available.
The lower limit was not provided by the company.
The Elite kit contains an enzyme and a chromophore (not disclosed), where the enzyme reduces the probe into a highly fluorescent product via NADH dehydrogenation, which is excited at 540–570 nm. An assay previously reported by Batchelor and Zhou 19 exhibits similar spectral properties and utilizes the reduction of resazurin. The fluorescence signal is inversely proportional to the activity of enzyme in interest. While the Elite kit is claimed to detect NADH/NAD+ levels in various tissues, cells, and enzymatic reactions, its application to either the assaying of ALDOA or an HTS campaign has not been reported. We believe that the adaptation of an optimized commercial assay kit to an HTS protocol represents a cost- and labor-effective approach, because de novo assay development can take several months to years.
To begin to develop an HTS assay, the optimum ALDOA concentration and incubation time were first determined, corresponding to Step 1 in Figure 1B . In detail, the assay was initially tested in a PBS-based assay buffer with varying concentrations of ALDOA and incubation time at an assay volume of 10 µL and substrate concentration (F-1,6-BP) of 100 µM. The concentration of NADH was initially set to 40 µM because it was expected that the assay could be followed up to the conversion of 40 µM of substrate to product (maximum 40% conversion), which ensures a good signal-to-background ratio (S/B) acceptable for HTS application. As shown in Figure 2A , the assay quickly plateaued (within 20 min) when the ALDOA concentration was above 10 nM, which is not ideal for handling multiple plates simultaneously during an HTS. The assay took ~40 min to plateau at 5 nM ALDOA, while 2.5 nM ALDOA further increased the time to completion to ~80 min. The maximum S/B was 4. We explored whether the S/B could be improved further by fine-tuning the NADH concentration, but the S/B was consistent, because the background signal changed in a manner similar to that of the absolute fluorescence signal (data not shown). In order to make sure that the ALDOA assay was performed as close as possible to the linear range of enzymatic activity, while maintaining a good S/B ratio, ALDOA at 5 nM with 30 min incubation was selected for further development. At this condition, ~75% of NADH was converted to a fluorescence signal that corresponded to ~30% substrate conversion.
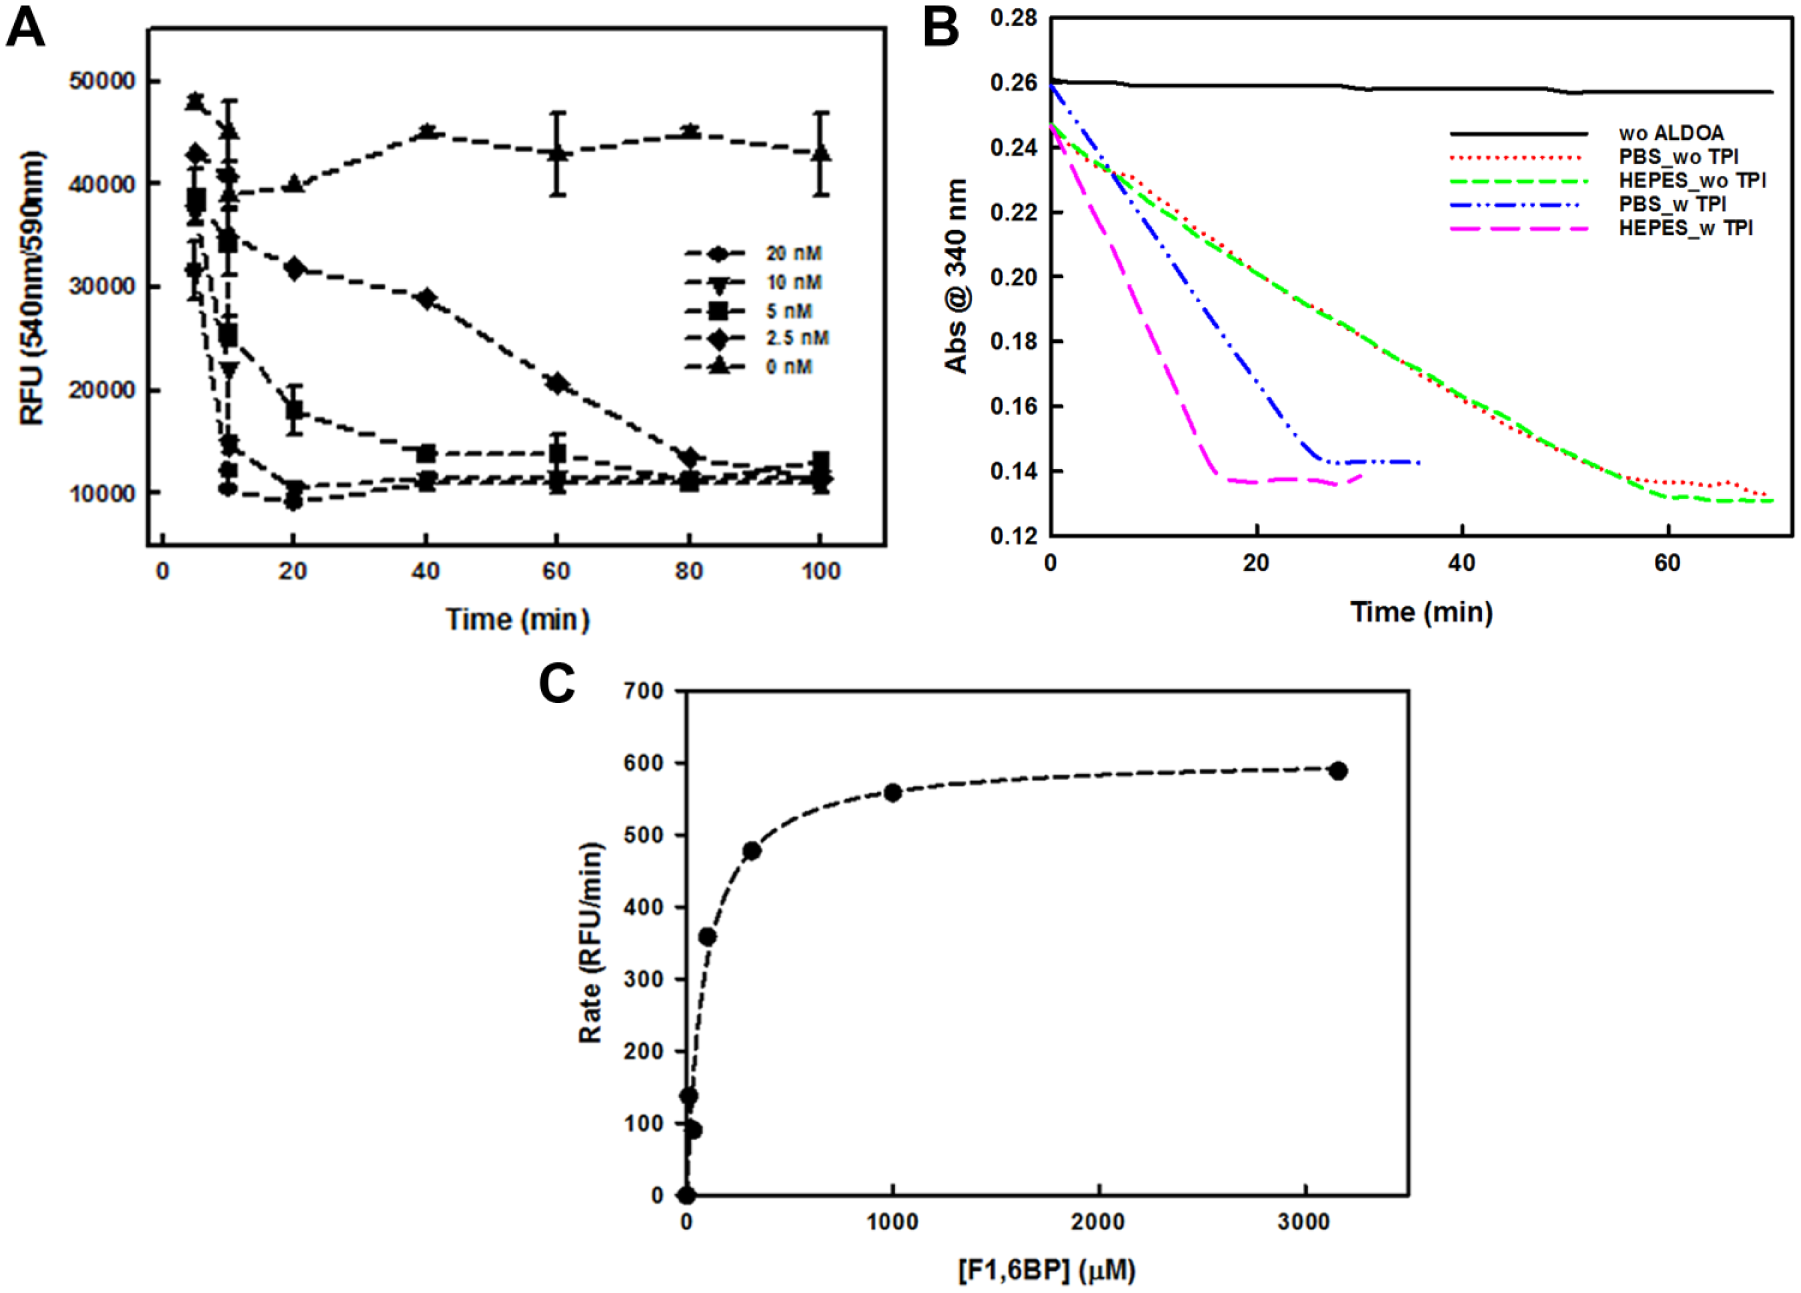
Development of ALDOA assay. (
To further assess the reaction conditions, we tested the effects of TPI (presence vs. absence) and buffer (PBS vs. HEPES at 50 mM, pH 7.4) using a traditional absorbance-based assay. As shown in Figure 2B , the assay was accelerated more than twofold in the presence of TPI, and this acceleration was more significant when the assay was performed in HEPES (threefold) than in PBS (twofold). As predicted, TPI merely accelerates the assay by converting GAP to DHAP, the substrate of α-GDH. In the absence of TPI, the two buffers showed similar activity profiles. To reduce assay complexity, TPI was eliminated from the assay and PBS was chosen as the buffer.
The assay kinetics were then investigated by changing the concentration of the substrate, F-1,6-BP. The reaction reached saturation above 1 mM of F-1,6-BP. The kinetic parameters, Km and kcat, were calculated as 85 µM and ~3 s−1, respectively ( Fig. 2C ). The calculated Km and kcat values were in accordance with previously reported values of 52 µM and 16.7 s−1, respectively, 20 and a concentration of 100 µM was chosen for F-1,6-BP for further assay validation. The concentration of α-GDH was also varied by two orders of magnitude (0.013–1.6 U/mL) to ensure that the α-GDH-mediated step was not limiting the assay (data not shown).
Next, the assay conditions for screening, including detergents and DMSO, were optimized. First, three nonionic detergents commonly used in HTS (Triton X-100, Tween 20, and NP-40) were tested from 0% to 0.1% (w/v). The percent activity was calculated by normalizing the fluorescence signal in the presence of detergent to the signal in the absence of the corresponding detergent. Interestingly, the percent activity increased by ~20% upon increasing the Triton X-100 or Tween 20 concentration up to 0.025% (w/v), after which it dropped gradually. The percent activity dropped in the presence of NP-40, but this was not dependent on the concentration of NP-40 ( Suppl. Fig. S1 ). It was suspected that the assay components could easily adhere to the plastics, and thus Triton X-100 at 0.01% was selected for further optimization. Second, we evaluated assay performance in the presence of various DMSO concentrations and observed that the percent activity was constant over a range of 0%–1.25% DMSO (v/v) (data not shown). This indicated that compound screening at 50 µM (DMSO content at 0.5%) should not lead to any false-positive hits due to DMSO, which often reduces the enzymatic activity. Based on this result, DMSO at 0.5% was chosen for further assay optimization. As the final optimization step, assay stability was examined in order to secure sufficient time for HTS operation by incubating 5 nM ALDOA in an assay buffer for various time points at room temperature before initiating the enzymatic reaction. It was found that ALDOA activity was constant up to 150 min (data not shown), confirming the suitability of this fluorescence-based assay for HTS application.
Assay Validation and Pilot Screen
The potential of this assay for inhibitor identification was validated by evaluating the dose–response of a known inhibitor, ND1, 21 which was reported to be a competitive inhibitor of ALDOA, based on its substrate-like structure. As shown in Figure 3A , fluorescence intensity increased in a dose-dependent mode, giving an IC50 of 5.2 µM. While this is greater than the Ki value of 0.28 µM previously reported, 21 previous assays used a rabbit version of ALDOA under slightly different buffer conditions. Furthermore, the kinetic parameters and the IC50 value that we obtained from the fluorescence assay correspond well to those obtained using the absorbance-based assay with the human enzyme under our buffer conditions (data not shown), supporting the notion that the assay is valid and suitable for identification of ALDOA inhibitors.
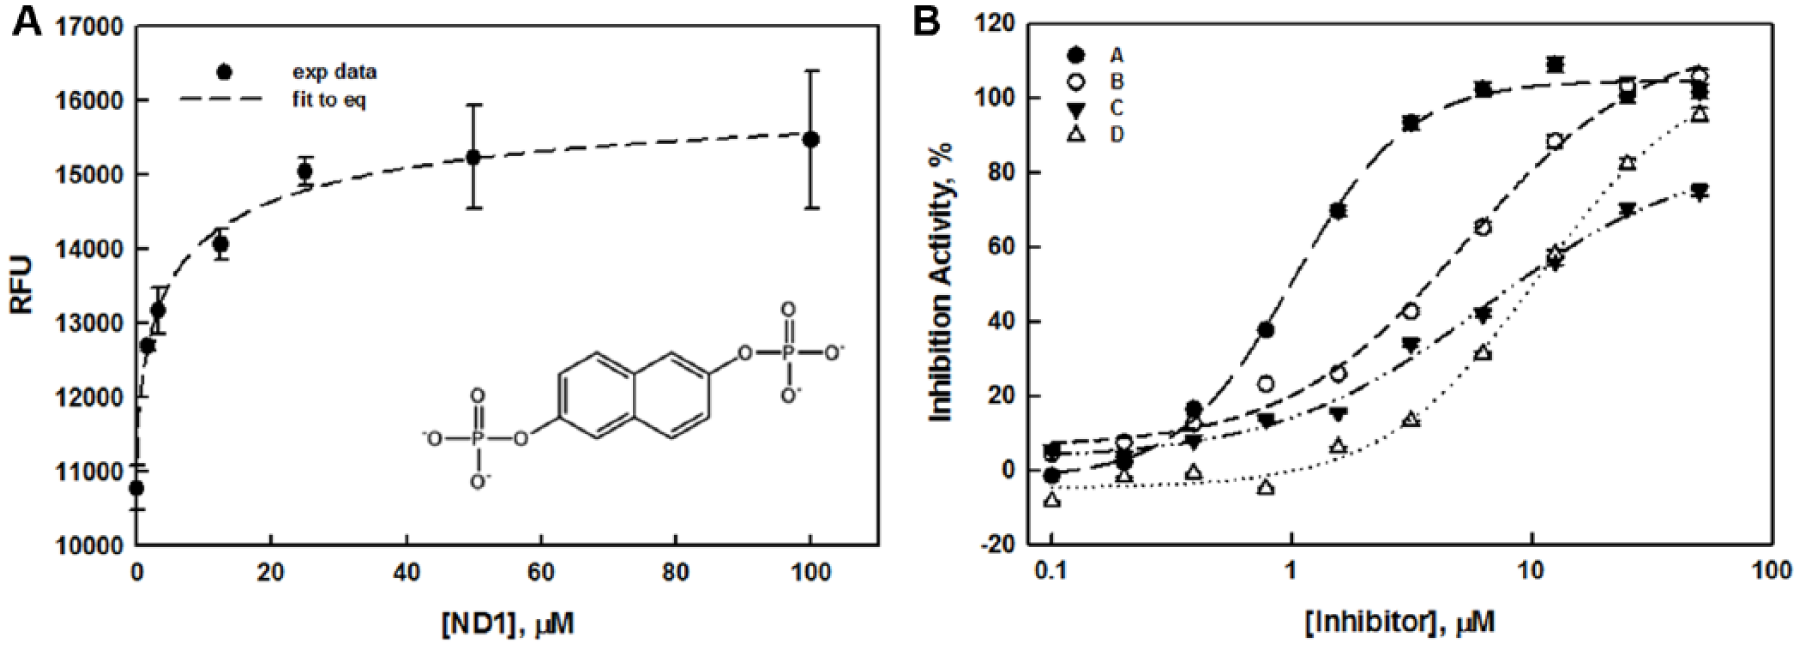
(
Next, plate uniformity of the assay was assessed by filling half of a 384-well plate with a positive control and the other half of the plate with a negative control. The negative control contains all assay components corresponding to fully activated ALDOA, resulting in the lowest fluorescence signal. The positive control contains all assay reagents except ALDOA, corresponding to fully inhibited ALDOA, and exhibits the highest fluorescence intensity. Averaged z′ and S/B values of 0.76 ± 0.08 and 3.94 ± 0.11, from three different experiments, indicated that any plate or systematic effects of the assay that could affect the assay performance were not substantial. These results support the notion that both intra- and interplate variation were fully validated with a successful scaling down to a 384-well format at an assay volume of 8 µL for HTS execution. In particular, this miniaturization allowed us to reduce reagent usage by ~6-fold while improving the S/B by twofold compared with the traditional aldolase assay conducted in a 96-well plate with 100 µL of assay volume. Consequently, the assay cost per compound was estimated at about 60 cents if 16 plates were tested per day. These results justified the fluorescence-based coupled enzymatic assay as cost-effective and sensitive for high-throughput compound screening. It also implies that the NADH-derived fluorescent probe can be easily adapted to other HTS assays involving either NADH production or consumption.
The screening procedure was constructed with multiple steps as illustrated in Figure 1A . Pilot screening with a small number of molecules was conducted before progressing into larger-sized libraries to ensure assay performance. Pilot screening is also beneficial for reoptimizing assay conditions to meet the desired hit rate. We conducted a pilot screening of 320 compounds with known biological activities under five different assay conditions. The pilot screen was evaluated in two different ALDOA concentrations (2.5 and 5 nM) and three different incubation times (15, 30, and 45 min). Compounds were plated in a 384-well plate at a final concentration of 50 µM, excluding columns 1, 2, 23, and 24, as described above in Materials and Methods under Chemical Compounds. Columns 1 and 2 in each assay plate served as a negative control, while columns 23 and 24 served as a positive control to eliminate potential systematic plate-to-plate variation. All assay plates were also duplicated. Hit triage was started with a visual inspection of plate heat maps to flag any outliers in controls from analysis, followed by normalization based on controls within each plate (so-called “control-based normalization”). Normalized percent inhibition and z′ 22 were calculated according to eqs 1 and 2. The z′ value (where it is also known as Z prime or z factor and commonly written as z′) is standard practice for HTS by which to judge the data quality of a particular assay. Additionally, assay data can be normalized by samples (so-called “sample-based normalization”), where most samples are assumed to be inactive in order to serve as their own negative controls. Because the Z score is calculated by using the mean and standard deviation of sample data (eq 3), it cannot recognize outliers within samples, and thus tends to be more sensitive to outliers. Although it also can be affected by the uneven distribution of hits on plates, the Z score represents a useful alternative statistical analysis of the screening data, in particular when the assay does not have good controls.


As summarized in Supplementary Figure S2A,B , both z′ and S/B were very sensitive to ALDOA concentration, as well as incubation time. In general, the highest z′ and S/B were exhibited at longer assay time (45 min) and higher concentration of ALDOA (5 nM). In addition, hit rates were sensitive to assay condition, as summarized in Supplementary Table S1 . Although the hit rate relies on the characteristics of the library employed, we hypothesized that none of the compounds showed inhibition activity when they were incubated for an extended time (i.e., 45 min) at a higher ALDOA concentration (i.e., 5 nM), because the assay was already saturated at this condition, even though the assay quality is best among other conditions. This result emphasized the importance of assay optimization and execution of pilot screening. Due to the limited assay dynamic range where the max S/B was ~4, it was a challenge to balance between reliable hit rate and assay quality. While the compound concentration can be controlled to adjust the hit rate, 50 µM used in this examination is a high limit that is normally used in the HTS campaign. Aiming for a hit rate in the range of 0.3%–1%, 2.5 nM ALDOA with 45 min incubation time was set for primary screening. At this final protocol, the conversion percent of both NADH and substrate was maintained at around 75% and 30%, respectively. Although the S/B value decreased to ~2.9, it still exceeded the assay criterion. 22
Primary Screen
The primary screen was conducted against more than 65,000 compounds at a concentration of 50 µM, in singleton, using a total of 231 plates. A scattered plot of raw data is shown in Supplementary Figure S3A . Statistically, the overall screen was performed with averaged z′ and S/B values of 0.65 ± 0.08 and 2.47 ± 0.34, respectively. Both normalized percent inhibition and Z score were calculated according to eqs 1 and 3, and their scattered plots are presented in Supplementary Figure S3B,C . Normalized percent inhibition of both controls is uniformly distributed ( Suppl. Fig. S3B ), which confirms that normalized percent inhibition effectively eliminates plate-to-plate variation, and thus a consistent hit cutoff is applicable. On the contrary, the calculated Z score of controls showed very wide scattering ( Suppl. Fig. S3C ), reflecting high plate-to-plate variation. Therefore, normalized percent inhibition was applied in this screen to rank compound activity using Collaborative Drug Discovery (CDD, https://www.collaborativedrug.com/) software. Initially, hit criteria of more than 25% inhibition and Lipinski’s rule of 5 were applied to identify 830 compounds, with almost half the compounds showing less than 40% activity (data not shown). Potential compound promiscuity was further investigated by comparing assay data within our in-house HTS campaigns. One hundred and fifteen compounds were identified as frequent hitters, that is, exhibited more than 50% inhibition of activity in at least three previous HTS campaigns. These were removed from further validation (hit rate = 1.09%). Alternatively, any promiscuous inhibitors, including pan-assay interference compounds (PAINS), 23 could be removed by utilizing several web-based applications.24,25 However, we caution against the blind use of PAINS filters to detect and triage compounds, as noted by Capuzzi et al. 26 Hit rates of individual libraries ranged from 0.48 to 2.83 ( Suppl. Table S2 ). A moderate variability (e.g., 0.85 and 1.63) was noted for the hit rate between two fragment collections. Taken together, the data support the use of a uniform compound concentration and consistent hit criteria for the primary HTS screen.
Cherry-Pick Confirmation Screen
Seven hundred and fifteen compounds were cherry-picked and retested under conditions of the primary assay to confirm activity. Owing to the complexity of the coupled enzymatic assay, two counterscreens were conducted (assay compositions and statistics are summarized in Suppl. Table S3 ). Counterscreen C1 assessed compound interference against the entire coupled assay, while the C2 assay specifically examined potential interference toward the Elite kit. Artifacts due to possible inhibition of α-GDH are unlikely, as the enzyme was used in high excess in the primary assay. However, α-GDH can be assayed separately in the presence of DHAP, in order to identify any DHAP-related false positives. In both counterscreens, a decrease in the fluorescence signal corresponds to interference with an assay component. A total of nine plates were assayed, with the majority of the compounds confirmed to have an activity of less than 40% and 260 compounds demonstrating reproducible activity of more than 40% inhibition. Activities of the compounds in the counterscreens generally overlapped (data not shown). One hundred twelve compounds of the 260 exhibiting a threefold higher activity in the primary assay relative to either counterscreen were selected for further validation.
Concentration–Response Curve Validation
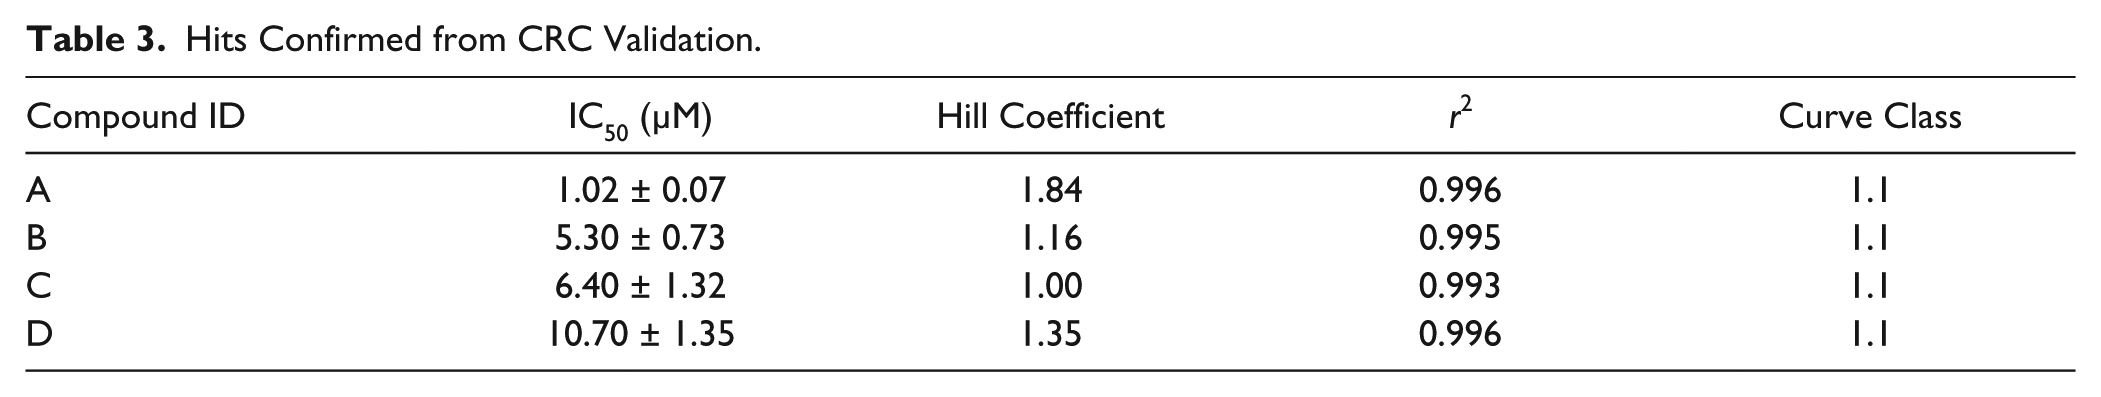
CRC validation was assessed with twofold dilution series using the primary assay for the 112 confirmed hits. Each of the 28 compounds was arrayed on the same plate to avoid effects from plate-to-plate variability and other random and systematic factors. A total of four 384-well plates were assayed with a statistical analysis of z′ = 0.72 ± 0.09 and S/B = 2.33 ± 0.19. Compound activities at 50 µM correlated with those from the confirmation screen. CRCs were generated by fitting the data to a standard four-parameter logistic curve, embedded in the CDD software, and then classified according to CDD’s curve class definition. 27 The curve classification assesses the quality of the curve fit to the data (r2), the magnitude of the response (maximum activity), and the number of asymptotes to the calculated curve. The numerical representation of curve class was originally proposed by Inglese et al. 28 and was considered a useful tool to accurately profile compound activity, in particular for quantitative HTS campaigns. Full descriptions and the number of compounds that fell into each of four curve classes are described in Table 2 . Table 3 and Figure 3B summarize the four most potent hits, which exhibit IC50 values lower than 10 µM and hill coefficients lower than 2. Further investigation of their mechanism of action is reported elsewhere. 17
Curve Classification Criteria and Number of Screened Compounds Corresponding to Each Curve Classes.
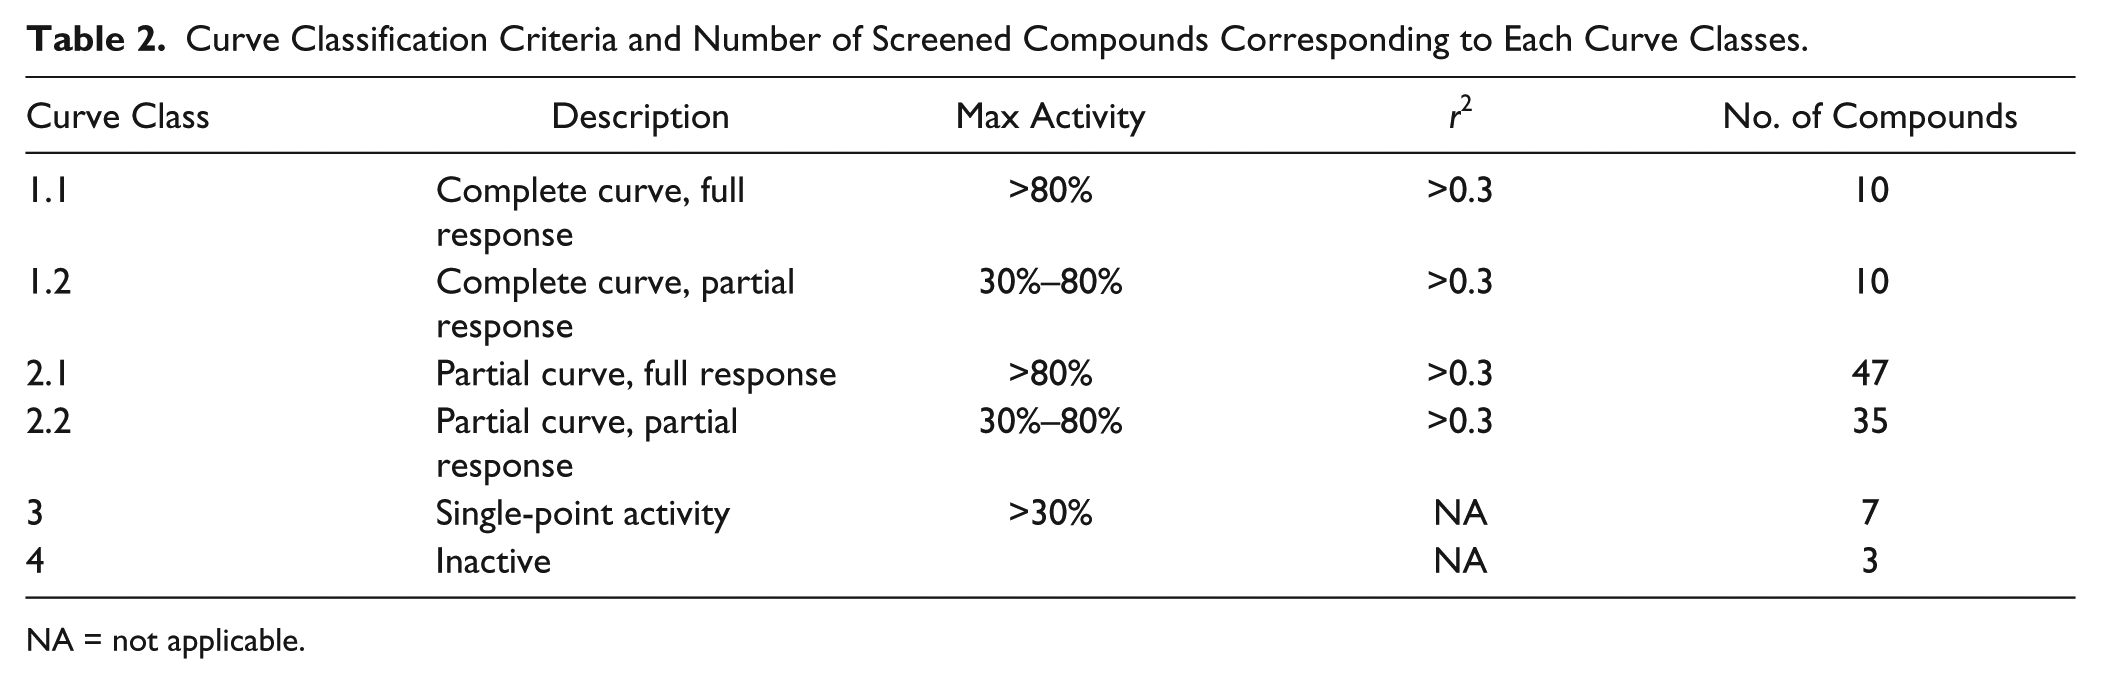
NA = not applicable.
Hits Confirmed from CRC Validation.
Discussion
Recent research supports the notion that many cancer cells have developed a highly active glucose metabolism in order to continuously grow. Other studies show that HIF-1/2 29 mediate a cancer cell’s response to hypoxia and upregulate the transcription of several glycolytic enzymes. Inhibiting key enzymes in these pathways is considered a potential strategy to treat cancer cells. Potent agents blocking ALDOA activity at low nanomolar range have not been discovered, and high-throughput assays to identify small molecular probes that block the catalytic reaction of ALDOA have not been reported. In conclusion, we report the design and development of an assay to monitor the catalytic activity of ALDOA by combining a highly fluorescent and commercially available NADH detection system with the traditional aldolase assay. This newly created assay demonstrates superiority over the traditional methods with enhanced sensitivity, reduced reagent requirement, and reduced compound interference. The assay has proven to be robust and adaptable to high-throughput application. This assay can be readily adaptable to the analysis of many NADH-dependent enzymes.
Footnotes
Acknowledgements
The authors thank Dr. Dean R. Tolan (Boston University) for the generous gift of the pNIC28-Bsa4 expression vector subcloned with full-length ALDOA.
Supplementary material is available online with this article.
Declaration of Conflicting Interests
The authors declared no potential conflicts of interest with respect to the research, authorship, and/or publication of this article.
Funding
The authors disclosed receipt of the following financial support for the research, authorship, and/or publication of this article: This research was supported by grants from CPRIT (RP110532-P1) and NCI (CA216424).
References
Supplementary Material
Please find the following supplemental material available below.
For Open Access articles published under a Creative Commons License, all supplemental material carries the same license as the article it is associated with.
For non-Open Access articles published, all supplemental material carries a non-exclusive license, and permission requests for re-use of supplemental material or any part of supplemental material shall be sent directly to the copyright owner as specified in the copyright notice associated with the article.