
Abstract
We have developed a new high-content cytotoxicity assay using live cells, called “ImageTOX.” We used a high-throughput fluorescence microscope system, image segmentation software, and the combination of Hoechst 33342 and SYTO 17 to simultaneously score the relative size and the intensity of the nuclei, the nuclear membrane permeability, and the cell number in a 384-well microplate format. We then performed a screen of 12,668 diverse compounds and compared the results to a standard cytotoxicity assay. The ImageTOX assay identified similar sets of compounds to the standard cytotoxicity assay, while identifying more compounds having adverse effects on cell structure, earlier in treatment time. The ImageTOX assay uses inexpensive commercially available reagents and facilitates the use of live cells in toxicity screens. Furthermore, we show that we can measure the kinetic profile of compound toxicity in a high-content, high-throughput format, following the same set of cells over an extended period of time.
Introduction
High-throughput cytotoxicity and proliferation assays are often used in the drug discovery process to remove undesirable compounds or, in the case of targeting certain cancer cells, to select desirable compounds.1–4 While very useful, conventional cell viability assays, such as Cell-TiterBlue, CellTiter-Glo, and assays that use fluorescent stains such as CyQUANT generally measure a single aspect of cellular toxicity or proliferation. Furthermore, these methods require multiple independent assay wells to measure growth kinetics or collect time-dependent data on compounds.
These limitations have been one impetus to develop cell viability and proliferation assays that use high-throughput microscopy coupled to automated image segmentation analysis. Several types of high-content cytotoxicity assays have been described, but to our knowledge, they either require a time-consuming fixation step, which means that continuous kinetic assays are not possible,5,6 and/or they have not been optimized for low-volume high-throughput screens and cross-validated in a reasonably large-compound screen.7–11
Here we describe an assay that works on live cells, without the need for a fixation step that gives a higher degree of information on the toxicity of compounds and enables kinetic studies. The new assay, called ImageTOX, is cheap, robust, and flexible and has been developed to be used alone or in conjunction with other readouts, such as with a green fluorescent protein reporter gene or with a far-red dye such as Cy5.5. The method can be adapted depending on the level of information needed. We were interested in the frequency and degree of cytotoxicity of typical collections of screening compounds and demonstrate a detailed comparison with a more conventional cytotoxicity assay. The MetaXpress image segmentation software, which used generic cell features recognition available in many software packages, allowed for the classification of the degree of toxicity of the compounds. The ImageTOX was applied to screen a library of 12,668 compounds in parallel with CellTiter-Glo (CTG) and identified similar sets of toxic compounds. Furthermore, the ImageTOX assay was exhaustively validated using three different cells lines.
Materials and Methods
Chemical Libraries
A total of 12,668 unique compounds from The Rockefeller High-Throughput and Spectroscopy Resource Center library were chosen based on their diversity. A total of 240,000 compounds were analyzed using fingerprint-based (FCFP6) clustering algorithms with Biovia Pipeline Pilot software (http://accelrys.com/products/collaborative-science/biovia-pipeline-pilot). The average cluster size was set to 30, and cluster centers were identified. Subsequently, library plates were ranked by the frequency of clusters therein, similar to that previously described. 12 The top 50 plates were chosen for this study. They were part of the following commercially available libraries: ChemDiv (San Diego, CA), Spectrum Chemical (New Brunswick, NJ), Greenpharma (Orléans, France), Enamine (Monmouth Junction, NJ), BioFocus (Charles River, Wilmington, MA), AnalytiCon discovery (Potsdam, Germany), ChemBridge (San Diego, CA), LOPAC (Sigma, Carlsbad, CA), Pharmakon (MicroSource, Gaylordsville, CT), NIH Clinical Collection, Prestwick Chemical (San Diego, CA), HTSRC Clinical Collection, Selleckchem (Houston, TX). Compound stocks were stored in 384-well polypropylene plates at a final concentration of 5 mM in DMSO at –30 °C. For assay optimization, the controls staurosporine and tamoxifen (Sigma) were arrayed in 384-well plates in different concentrations in DMSO.
Cell Culture
Human SK-N-SH neuroblastoma cells (HTB-11), human MRC5 lung normal fibroblast (CCL-171), and human HepG2 hepatocarcinoma cells (HB-8065) were obtained from the American Type Culture Collection (ATCC, Manassas, VA). Each cell line was grown in Eagle’s Minimum Essential Medium with L-glutamine (EMEM; ATCC) supplemented with penicillin/streptomycin and 10% fetal bovine serum (ATCC) at 37 °C and 5% CO2 up to passage 20. For screening, cells were plated at a density of 1500 cells/well using a Thermo Multidrop Combi dispenser (Thermo Scientific) in 25 µL of cell culture medium in a 384-well microplate (tissue culture treated black with clear bottom for imaging and white for CTG, Greiner Bio-One, Monroe, NC). Plates were then incubated overnight at 37 °C and 5% CO2.
High-Throughput Luciferase-Coupled Adenosine Triphosphate Consumption Assay (CTG)
Compound plates were thawed at room temperature, and 0.05 µL of compound was added into the assay plates containing the cells using a PerkinElmer Janus equipped with a PerkinElmer Nanohead to achieve a final concentration of 10 µM and a final concentration of DMSO of 0.2%, which we empirically determined to not affect cell growth in all three cell lines (data not shown). A negative control (0.2% DMSO) was kept in column 23 and the positive control (staurosporine at 5 µM final concentration) in column 24. The assay plates were incubated for 48 h before adding 25 µL of CTG reagent (Promega, Madison, WI), which produces light in direct proportion to the amount of adenosine triphosphate (ATP) and viable cells present. The plates were shaken at room temperature for 20 min. The luminescence was measured in relative light units using a Synergy NEO multimode HTS plate reader (BioTek, Winooski, VT). The percentage of ATP depletion was normalized as follows:
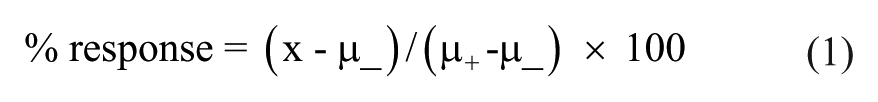
where x is the sample, µ_ is the negative control mean, and µ+ is the positive control mean.
The quality of the screen was assessed by Z′ factor calculated as follows, where (+) denotes the positive control and (–) denotes the negative controls, µ is the mean, and σ is the standard deviation 13 :
High-Content Microscopy Assay (ImageTOX)
Compound addition was performed following the same procedure as the CTG assay. The assay plates were incubated for 48 h before adding 25 µL of a mixture of fluorophores diluted in EMEM to achieve a final concentration of 50 nM of Hoechst 33342 (Life Technologies, Grand Island, NY), 250 nM SYTO 17 (Life Technologies), and 10 µL/mL pSIVA (Bio-Rad, Hercules, CA). The assay plates were imaged using MetaXpress software on the ImageXpress XLS widefield Micro reader (Molecular Devices, Sunnyvale, CA) with the temperature set at 37 °C using the 10× objective. A laser-based autofocus routine was configured for automatic well bottom detection using an empty plate to avoid out-of-focus images. The DAPI (Ex 350–400, Em 415–480), FITC (Ex 460–505, Em 510–565), and Texas Red (Ex 535–585, Em 600–650) filter cubes were used, respectively, to image Hoechst 33342, pSIVA, and SYTO 17. The acquisition setup was configured to image two sites per well to analyze an average of 500 cells/well. The fluorescence of Hoechst 33342 was used to set the image-based autofocus, and the exposure time for each fluorophore was determined using a positive control well where the fluorescence signal was set to 75% of the maximum intensity of the camera.
The ImageTOX assay was intended to explore different parameters associated with cytotoxic mechanisms. Supplementary Table S1 summarizes the parameters assessed in the study and the image segmentation application from the MetaXpress software (Molecular Devices) that we used to build a MetaXpress custom module that automatically analyzed the acquired images. This included a Count Nuclei module that automatically identified nuclei after selecting a minimum and maximum size and set a sample intensity level above the local background. Total nuclei, mean area, and average intensity per well were extracted from this module. A Translocation module that measured the intensity movement from one compartment to another was added to determine the nuclear or cytoplasmic status of the SYTO 17. To determine the level of cytotoxicity of each compound tested, the values for each parameter were normalized based on positive and negative controls using Eq. 1.
A compound was classified as a positive hit for any of the parameters when the normalized value (Eq. 1) was more than five standard deviations (SDs) of the mean of the negative controls away for each parameter assessed. The results of the primary screen for each parameter of the ImageTOX and CTG assays are presented in a table in the supplementary data section. The ImageTOX score represents the number of positive parameters for each compound.
Cheminformatics and Data Handling
Acquired images were stored in the MDCStore database and analyzed using the MetaXpress software (Molecular Devices). Output data were uploaded and analyzed using the CDD Vault from Collaborative Drug Discovery (Burlingame, CA, http://www.collaborativedrug.com). MS Office Excel (Microsoft, Redmond, WA), Vortex (Dotmatics, Bishop’s Storford, UK), and GraphPad Prism (GraphPad, La Jolla, CA) software were also used to analyze and visualize the MetaXpress software output.
Concentration-Response Studies and Toxicity Kinetics of Hit Compounds
Compounds selected for retesting in concentration-response experiments to determine half maximal inhibitory concentrations (IC50’s) were serially diluted by half for a total of 10 dilutions to achieve an assay concentration ranging from 20 µM to 0.03 µM. IC50’s were calculated by CDD software.
For time course experiments using CTG, cells were incubated with the compounds from 2 to 72 h using a different plate per time point before adding 25 µL of CTG reagent.
For time course experiments using the ImageTOX, cells were incubated with the compounds from 2 to 72 h, and the dye mixture was added 30 min before the first time point. The same plate was imaged for all time points.
Results
Design of a Multiparametric High-Content Assay (ImageTOX)
The addition of a compound to a cell can lead to the disruption of a large variety of biological processes that can be assessed in a phenotypic assay. Our efforts focused initially on identifying stains that could be used to mark aspects of cell morphology that might change when a xenobiotic is added. Although several interesting possibilities existed, it became clear to us that we would encounter spectral overlap when trying to read many stains simultaneously. It was important that these dyes allowed for live-cell studies. Three dyes were chosen: Hoechst 33342 (Ex 350/Em 460 nm), SYTO 17 (Ex 621/Em 634 nm), and pSIVA (Ex 465/Em 535 nm) because they were not spectrally overlapping and allowed for the highest degree of simultaneous cellular events in a single image capture. 14
First, the nuclear stain Hoechst 33342, which binds to DNA, was used to count the cells. Cell number has been described as the parameter most frequently affected and the most sensitive indicator of cytotoxicity.5,8,15,16 The same dye was also used to assess shape changes (nuclear area and nuclear intensity) in nuclei, which has also been described as a sensitive endpoint. The numerical value of nuclear area and nuclear intensity can increase or decrease indicating compromised cell health as toxic compounds can induce DNA condensation while nuclear swelling is typical for known cell-cycle blockers and DNA-damaging compounds as carcinogens.7,17,18
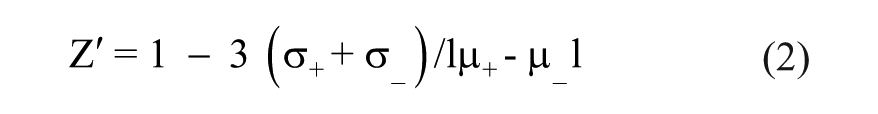
Second, we tested a number of SYTO dyes, which have been described as cell-permeant nucleic acid stains that differ from each other with regard to cell permeability, fluorescence enhancement upon binding nucleic acids, fluorescence spectra, and nucleic acid selectivity. 19 Eukaryotic cells incubated with SYTO dyes generally showed cytoplasmic as well as nuclear staining. SYTO dyes, especially SYTO 16 and SYTO 17, have been well described as markers of cell demise in flow cytometry studies. 20 We tested SYTO 40 (blue) and SYTO 17, 59-64 (red) at different concentrations. We noticed that some of the dyes behaved differently depending on their concentration. A key finding for us was that, at a concentration below 1 µM, SYTO 17, 60, and 62 stained only the cytoplasm in the three cell lines tested. When the cells were treated with toxic compounds such as tamoxifen, staurosporine, or doxorubicin, we observed that the dyes were translocated into the nucleus. We focused on SYTO 17 because it showed the stronger signal, and we used it in our assay at a concentration of 250 nM, at which concentration, the dye was excluded from the nucleus. Because changes in membrane permeability are well described indicators of cellular adverse effects by toxic compounds, we could now explore adverse cellular events by monitoring the translocation of SYTO 17 into the nucleus. Figure 1A shows the effect of concentration of SYTO 17 on nuclear localization in the MRC5 cell line.
Development of the ImageTOX high-content assay. (
Third, we used a previously described polarity-sensitive indicator of viability and apoptosis, pSIVA. This Annexin XII–based, polarity-sensitive probe of apoptosis and other forms of cell death is sensitive to phosphatidylserine exposure, which is a marker of apoptosis, persists throughout the cell death process, and allows for the visualization of real-time apoptotic changes without perturbing the cellular environment. 21
These three dyes together allowed us to simultaneously score our five parameters described in Supplementary Table S1 : cell number, nuclear area, nuclear intensity, apoptosis, and nuclear membrane permeability. The cytotoxic changes observed in cells using the three dyes are illustrated in Figure 1B, C . The addition of staurosporine resulted in a morphological change of the nuclei. The nuclear area was reduced while its intensity was increased, indicating the DNA condensation. The permeability of the nuclear membrane was also increased, allowing the SYTO 17 dyes to enter in the nuclear compartment. A number of cells scored positive in the pSIVA channel, indicating cells undergoing apoptosis were increased compared with the DMSO treatment. In addition, we conducted independent experiments to show that the three dyes were not toxic to the cells at the concentrations required for imaging in a 72 h incubation period, monitoring the cell growth using the CTG assay in presence or absence of the dyes ( Suppl. Fig. S2 ).
Assay Development
Staurosporine and tamoxifen were evaluated for their use as a positive control in the ImageTOX assay in three immortalized human cell lines, SK-N-SH, MRC5, and HepG2, and the results were compared with the well-accepted CTG assay that quantifies ATP level, an indicator of metabolically active cells. Staurosporine is known to be a nonspecific protein kinase inhibitor inducing apoptosis in cells22,23 and tamoxifen, an antagonist of estrogen receptor, has been reported toxic especially in liver cells.24,25 We determined in a concentration-response experiment the 50% inhibition concentration (IC50) using each parameter of the ImageTOX assay and the CTG. In CTG, tamoxifen showed similar IC50’s in the three cell lines (7.6 µM in HepG2, 6.7 µM in MRC5, and 5.1 µM in SK-N-SH) as well as staurosporine (0.59 µM in HepG2, 0.23 µM in MRC5, and 0.21 µM in SK-N-SH;
Suppl. Fig. S3A, B
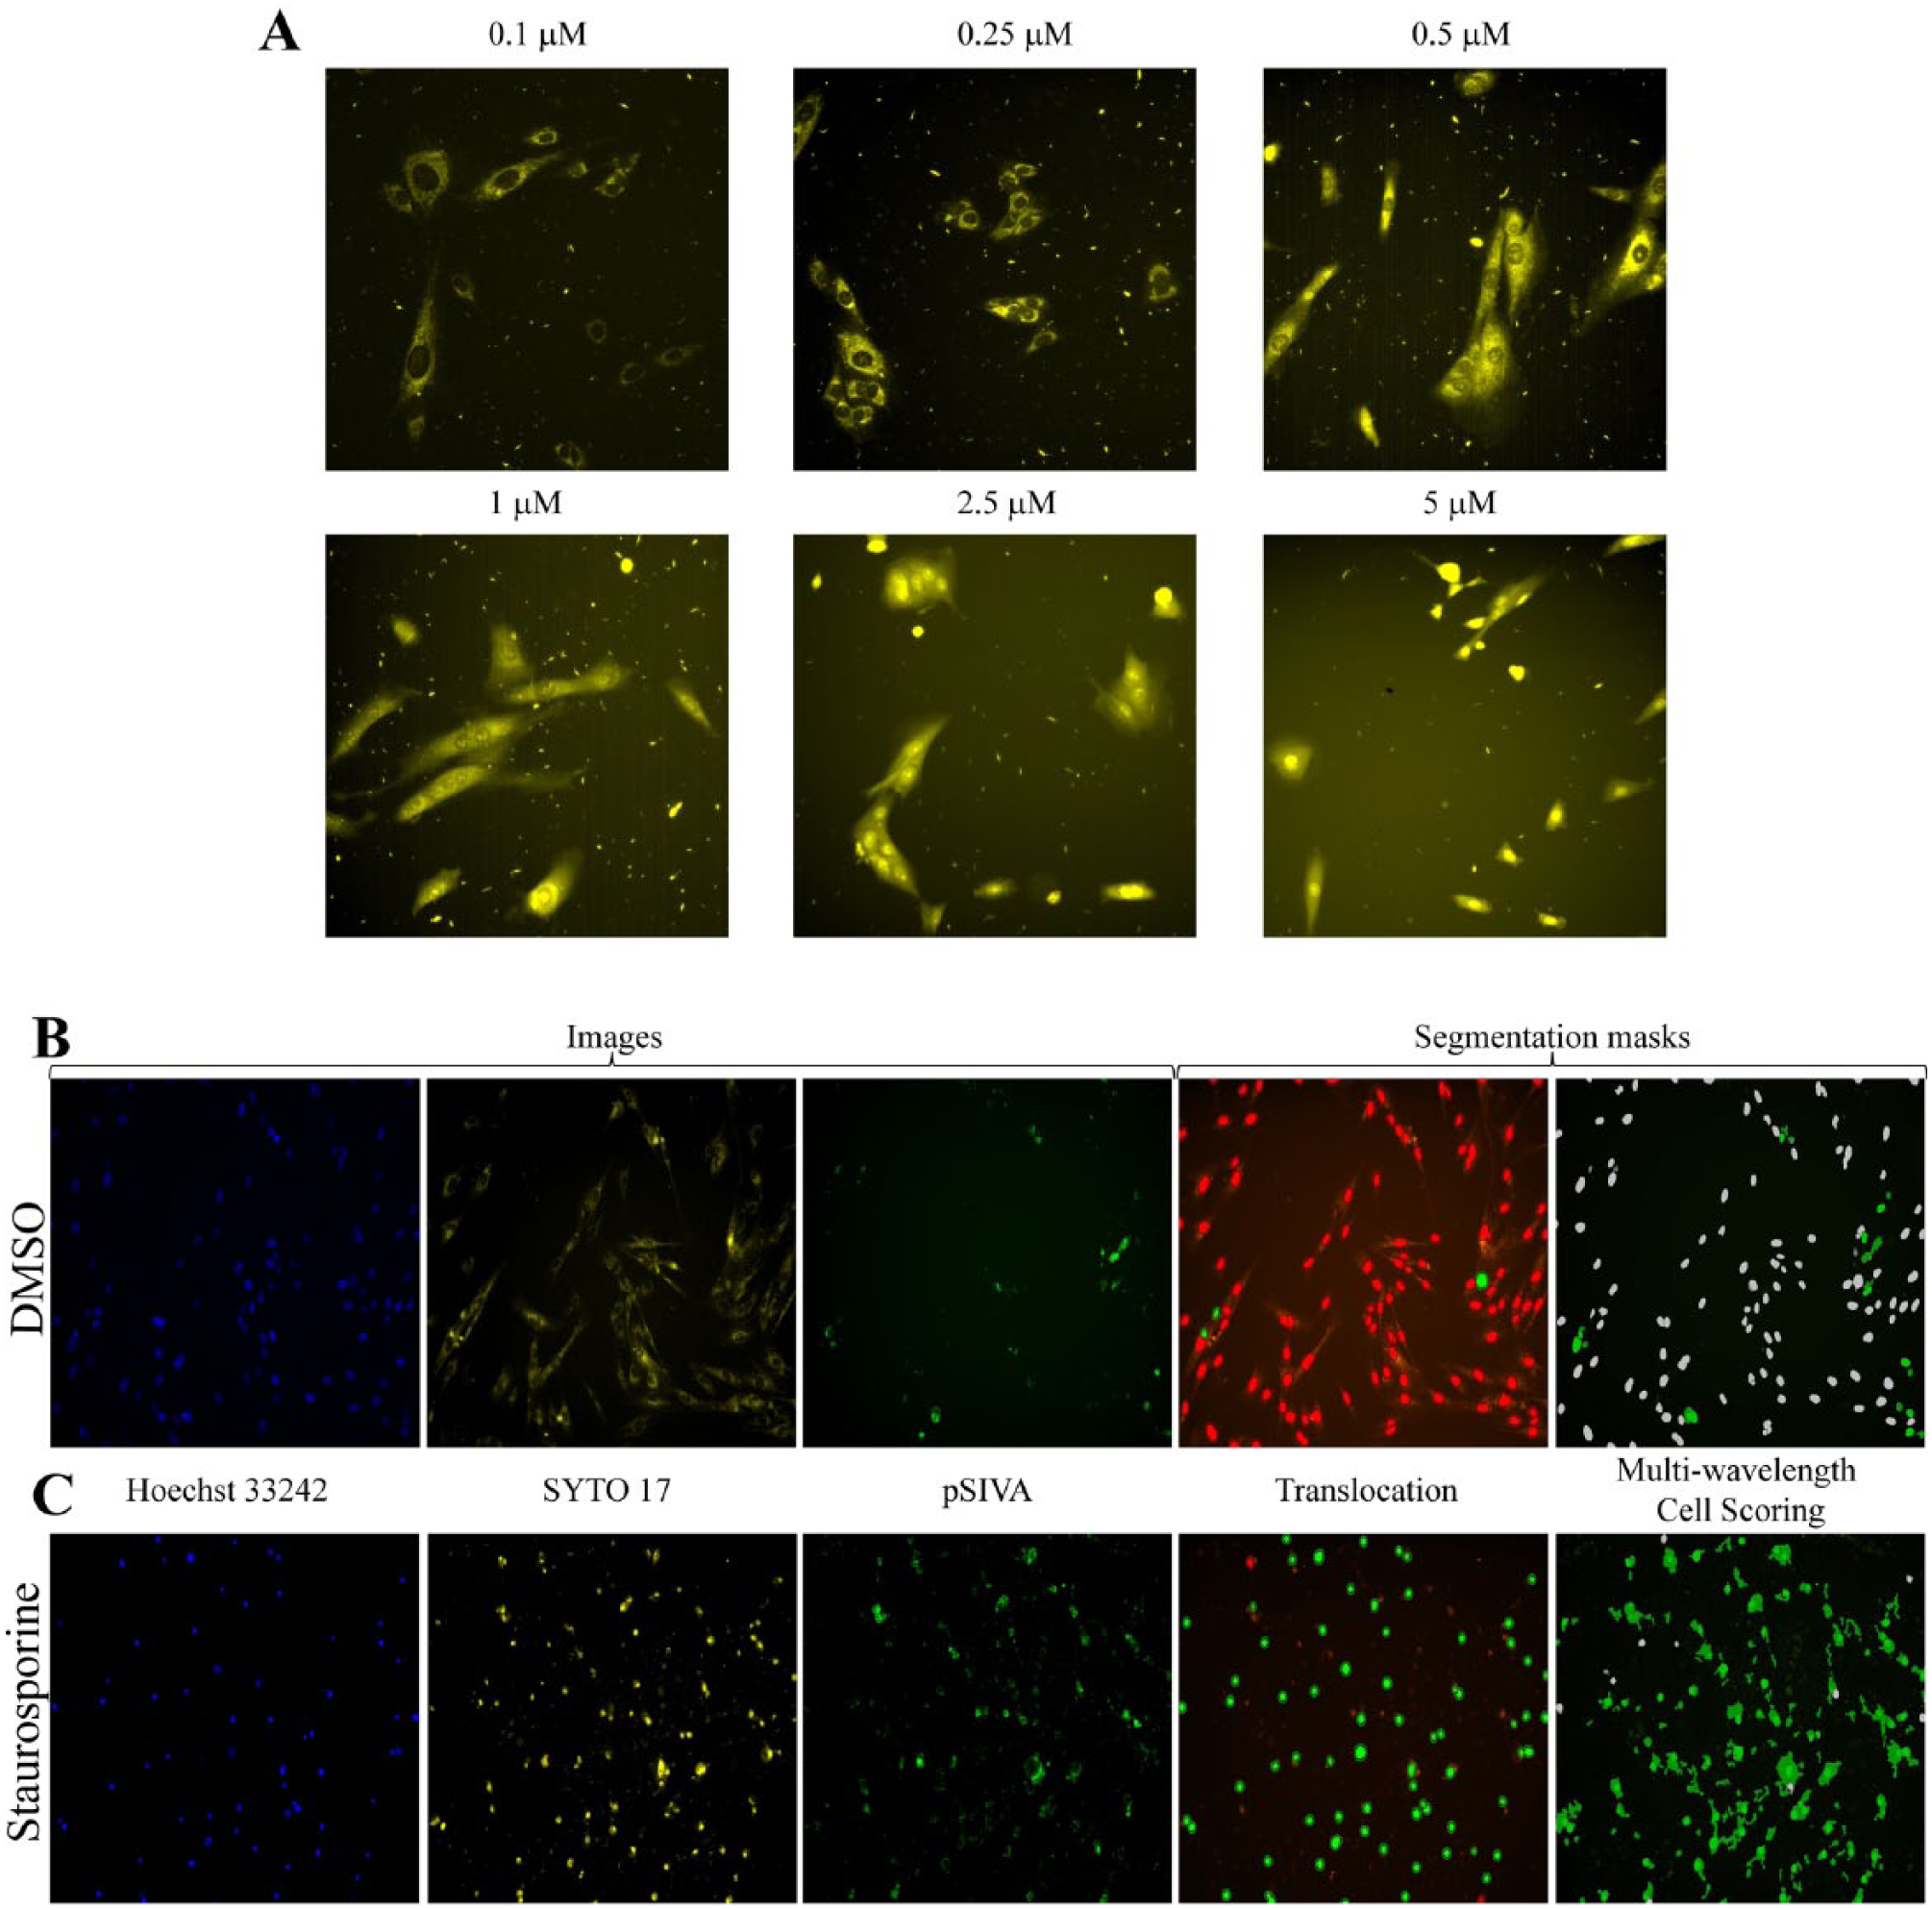
). Both compounds were confirmed as cytotoxic, but they induced distinct morphological changes. Tamoxifen caused a nuclear swelling at concentration lower than 5 µM followed by a nuclear condensation at higher concentration. The nuclear intensity and nuclear area parameters were thus difficult to assess because they could not produce a well-defined sigmoidal response curve for IC50 determination. Staurosporine instead was able to produce a concentration response for each parameter, and the IC50’s determined were in agreement with the CTG (
Fig. 2A, E
). The cell number was the most sensitive parameter. The IC50’s were very close (HepG2 0.16 µM, MRC5 0.78 µM, and SK-N-SH 0.34 µM) to the IC50’s in the CTG assay. The other parameters seemed to be cell line dependent. Based on the IC50’s obtained for nuclear area and intensity, nuclear membrane permeability, and apoptosis, HepG2 were the most resistant cells while SK-N-SH were the most sensitive to the adverse cellular effects of staurosporine. The IC50 values for each ImageTOX parameters and CTG are summarized in the
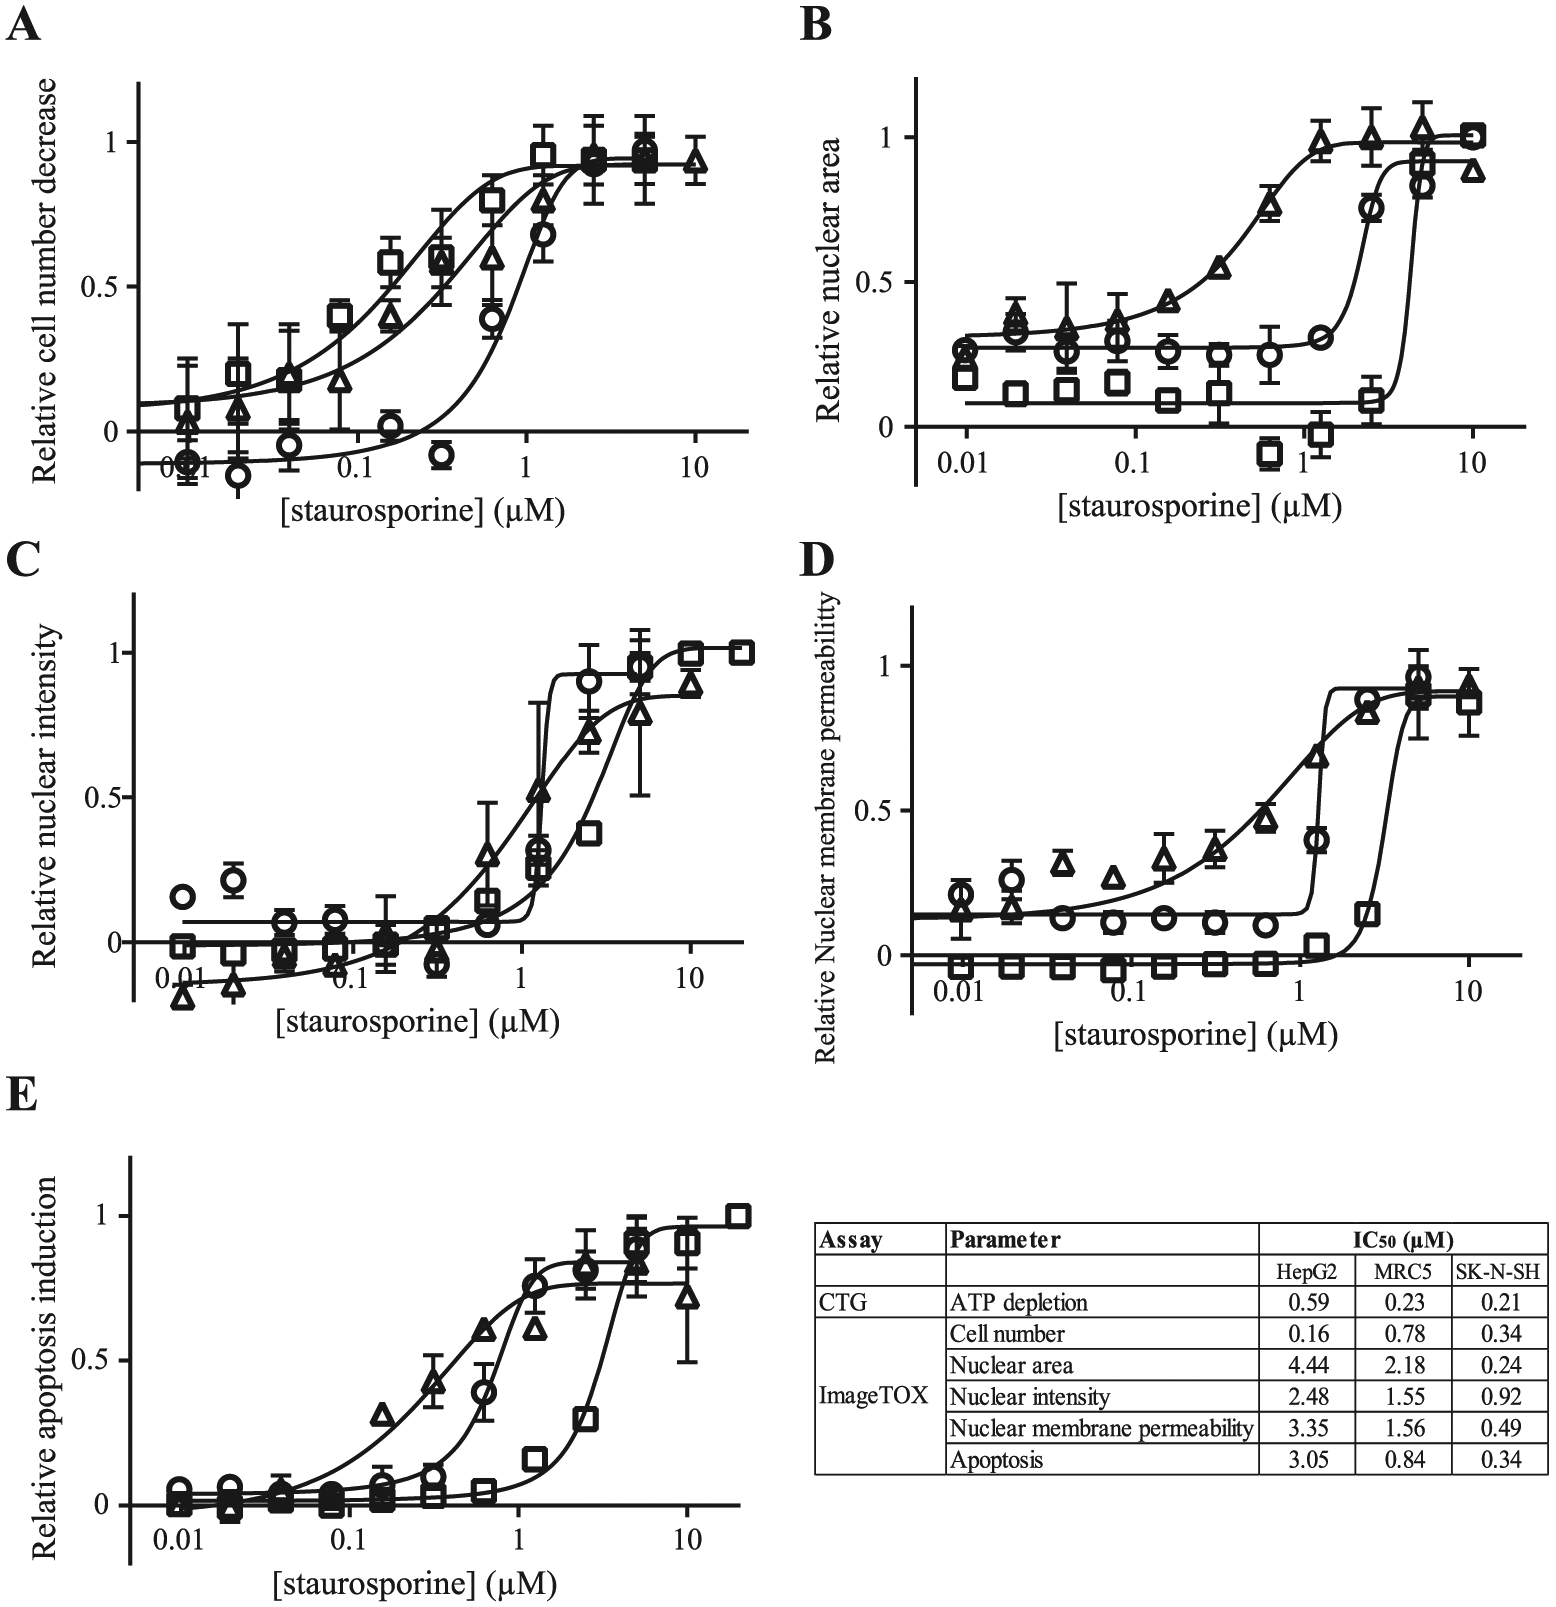
Validation of the ImageTOX assay. Concentration-response curves for staurosporine after a 48 h exposure in MRC5 cells (open circles), HepG2 cells (open squares), and SK-N-SH cells (open triangles) for the five parameters assessed: cell number (
Statistical Performance of Parameters Assessed. a
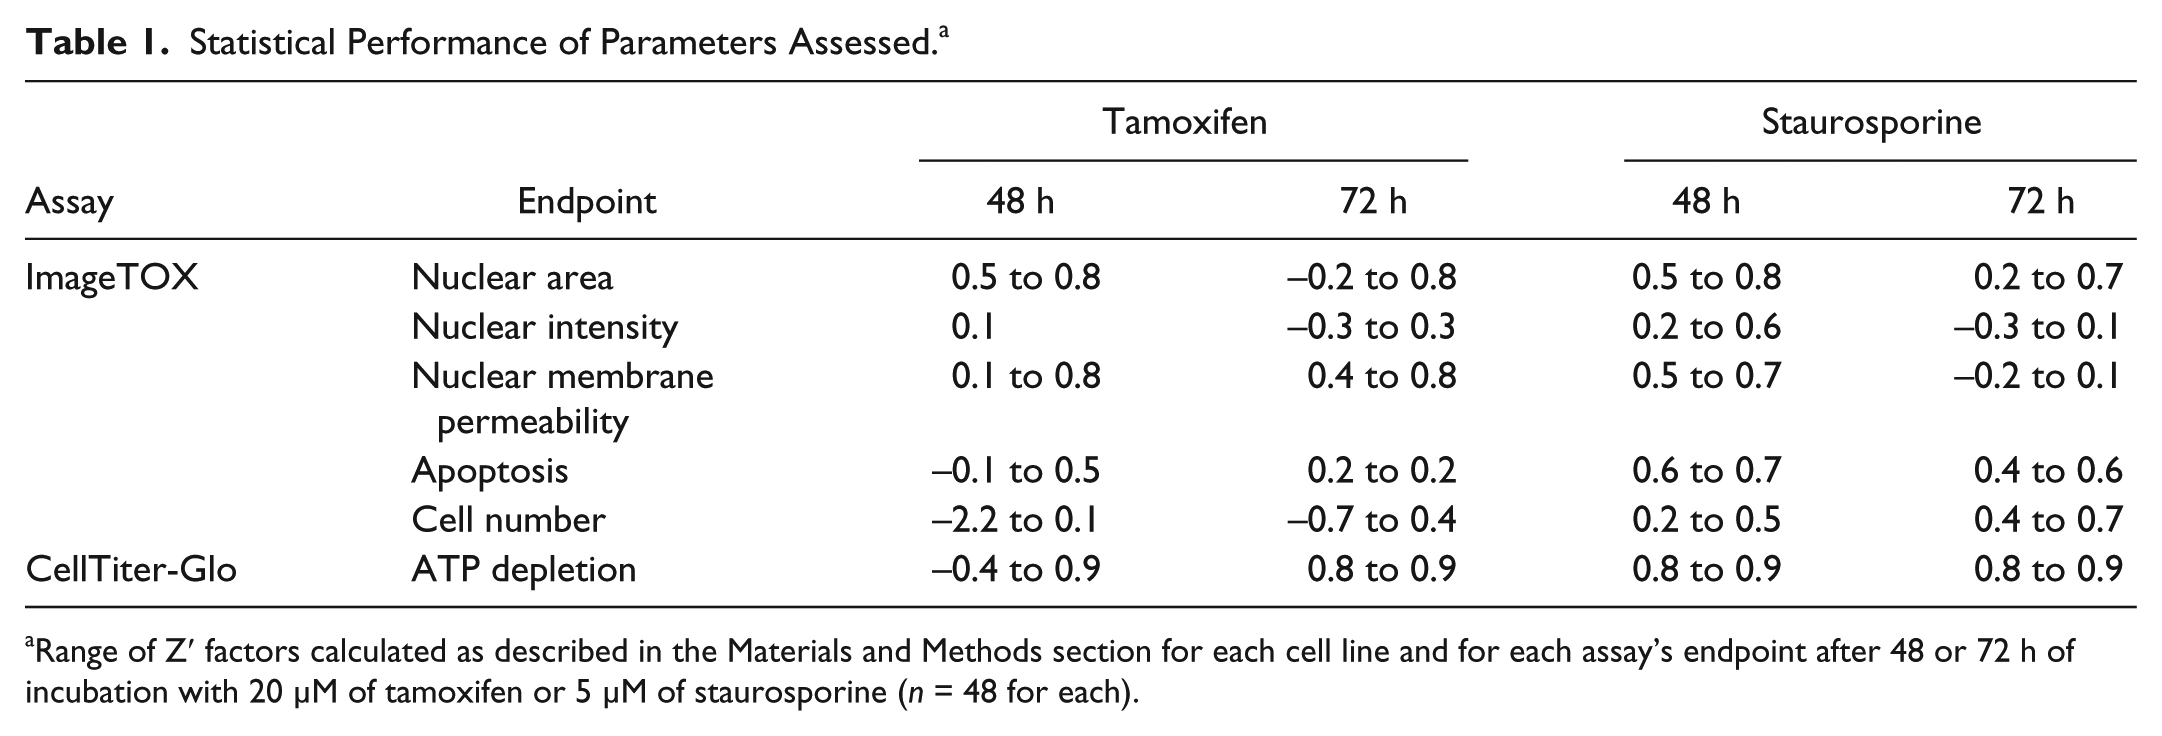
Range of Z′ factors calculated as described in the Materials and Methods section for each cell line and for each assay’s endpoint after 48 or 72 h of incubation with 20 µM of tamoxifen or 5 µM of staurosporine (n = 48 for each).
We then sought to investigate the applicability of the ImageTOX assay and assess the correlation between both assays with a reasonably large set of screening compounds.
Primary Screen
As a result of our first round of analyses, we observed that the ImageTOX assay could be simplified to increase the throughput by reducing the number of colors from three to two and the number of parameters assessed from five to four. Although in our hands, apoptosis measurements using pSIVA confirmed that our toxic hits induced apoptosis and yielded good Z′ values, this reagent was relatively expensive and overlapped with the green fluorescent protein channel. Removing pSIVA from the study allowed us to free a green fluorescent protein channel for potential use in assessing additional targeted phenotypic parameters and reduced the effort and the expense of using this reagent. We thus used a two-stain (Hoechst 33242 and SYTO 17) assay with four parameters assessed: cell number, nuclear area, nuclear intensity, and nuclear membrane permeability. As a proof-of-principle experiment, we decided to apply the ImageTOX and CTG to only one cell line. MRC5 were chosen because of their properties, which eased the imaging, having spaced monolayers with a good nuclear/cytoplasm ratio, but as shown in the assay validation, other cell lines could have been used.
To assess the reproducibility of the assay, four plates from LOPAC (1280 pharmacologically active compounds, Sigma) were tested in two independent experiments. We observed that most of the compounds populated along the diagonal line, which indicates that the hits are reproducible. The linear regression coefficient was 0.77 for cell number, 0.91 for nuclear area, 0.93 for nuclear intensity, 0.94 for nuclear membrane permeability, and 0.88 for CTG ( Suppl. Fig. S4A–E ).
We then screened in parallel 14,479 samples (12,668 unique compounds) at the concentration of 10 µM using CTG and ImageTOX assay with an incubation of 48 h. Positive (staurosporine at 5 µM) and negative (DMSO 0.2%) controls were used to normalize the data and determine a percentage of response for each parameter. The average Z′ factors were calculated for each endpoint and were, respectively, 0.78 for CTG, 0.53 for cell number, 0.65 for nuclear area, 0.65 for nuclear intensity, and 0.85 for nuclear membrane permeability. They were all above the 0.5 cutoff, confirming the ability of the assay to produce good quality data.
A relatively stringent 5 SD from the mean of the DMSO controls cutoff was used to identify a set of very toxic compounds to compare results between the assay methods and to minimize variations due to random pipetting and compounds of intermediate toxicity. Calculated cutoffs were, respectively, 30% normalized ATP depletion for CTG, 52% normalized decrease for cell number, 8% normalized increase for nuclear membrane permeability, and, respectively, 25% and 11% normalized change (increase and decrease) for nuclear area and intensity.
We observed extreme outliers while assessing the nuclear intensity and cell number parameters ( Fig. 3A, B ), and these outliers were found to be either problematic compounds, wells in which the cells were not seeded densely enough for statistically significant results, or wells with cells completely obliterated by the toxicity of the compound. For example, using a cutoff of normalized nuclei intensity >150%, we found 155 extreme outliers, and these were all highly fluorescent compounds ( Fig. 3D ). We also found 72 extreme outliers in the cell number metric. Twenty-two of these formed precipitates; these precipitates artificially increased the score for the number of cells (normalized cell number <–70%; Fig. 3C ). The remaining 50 contained less than 50 cells per well. Thirty-five of them were positive in the CTG assay and therefore contained potent cytotoxic compounds that caused the complete dissolution of all cellular matter. The remaining 15 were most likely not initially seeded wells. Thus, further visual examination of the extreme outliers was a practical approach to eliminating those compounds with undesirable properties. The results of each remaining compound screened in the ImageTOX and CTG assays are available as Supplementary Material S6 .
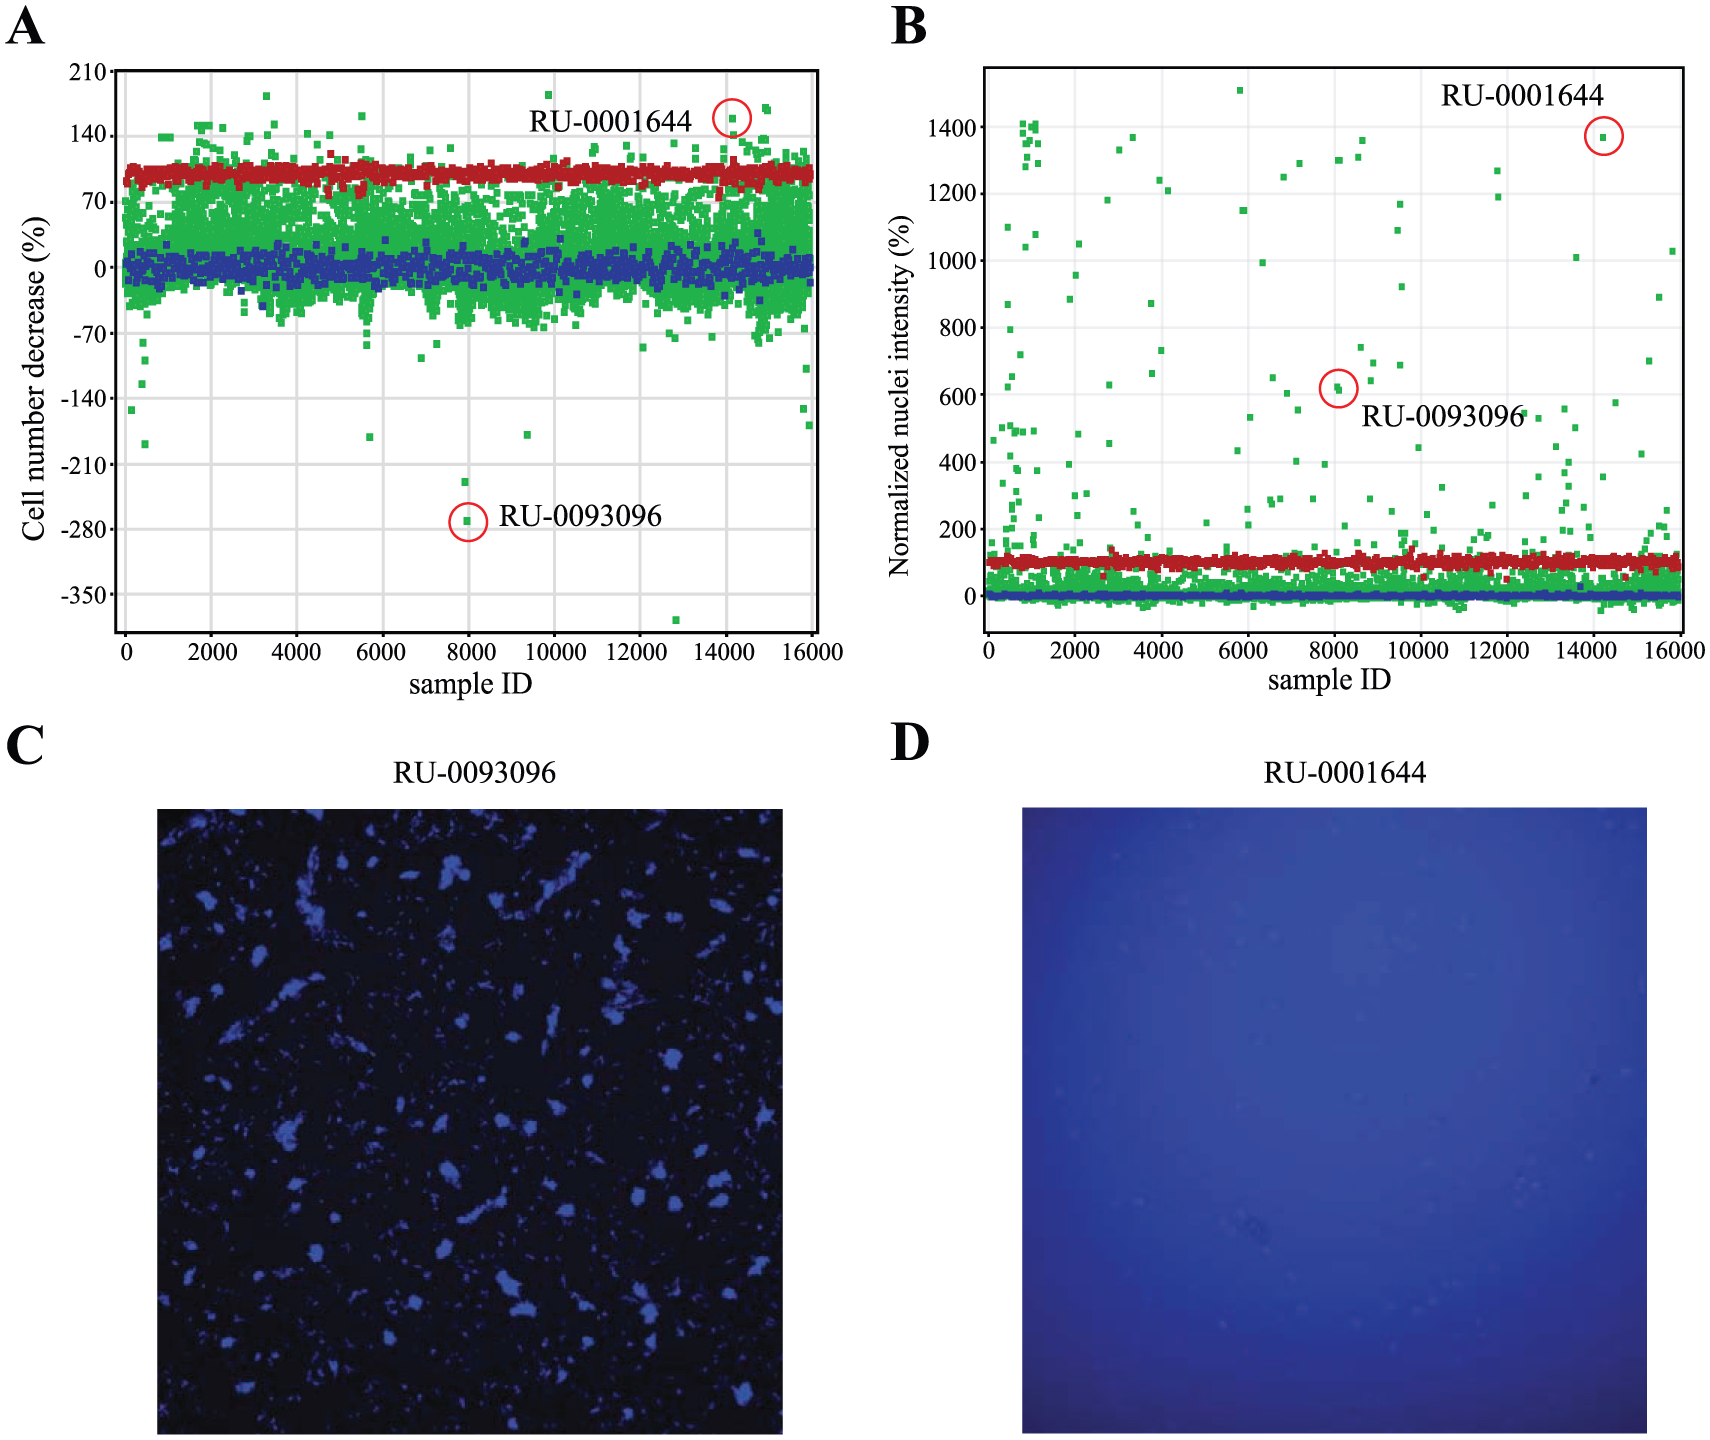
Compound artifacts identified in the ImageTOX assay. Extreme outliers in the cell number (
The screen revealed, respectively, 1287 hits for cell number (9.0%), 984 hits for nuclear area (6.9%), 1948 hits for nuclear intensity (13.7%), and 1685 hits for nuclear membrane permeability (11.8%). For comparison, the CTG assay scored 1668 toxic compounds (11.7%). If we treated each ImageTOX parameter individually, we observed that a majority of compounds agreed with the CTG assay. For example, of the 1668 positive CTG, 61% are positive for cell number, 43% for nuclear area, 68% for nuclear intensity, and 70% for nuclear membrane permeability. The nuclear membrane permeability was the parameter that correlated best with CTG.
Because the ImageTOX assay used four segmentation parameters and the CTG used only one parameter, direct numerical comparison between the two screening methods was complicated. Choosing hits required partitioning and scoring multiple parameters in the high-content assay. Also, in the ImageTOX assay, each parameter taken alone will not necessarily give information about the state of the other parameters. To simplify the high degree of information provided by ImageTOX assay, for the sake of assay comparison, we applied an ImageTOX score post hit selection ranging between 0 and 4 to each compound based on the number of parameters scored as positive.
Using this ImageTOX score, a total of 3070 compounds (21.5%) were affected in at least one parameter in the ImageTOX assay ( Table 2 ). As expected, a vast majority of CTG-positive compounds have also scored in the imaging assay. Of the 1668 positive CTG compounds, 1463 (88%) had a score of 1 or more in ImageTOX. The correlation between the two assays increased with the potency of the drugs, as 98% of the compounds with an ImageTOX score of 4 are also positive in the CTG assay. Only 205 positive CTG compounds showed an ImageTOX score of 0. One hundred fifty of these 205 positive compounds in CTG that did not score in the ImageTOX assay are close to the cutoff limit (normalized ATP depletion lower than 50%), indicating compounds of intermediate toxicity.
Distribution of the ImageTOX Hits Based on Their ImageTOX Score and the Correlation with the CellTiter-Glo (CTG)–Positive Compounds.
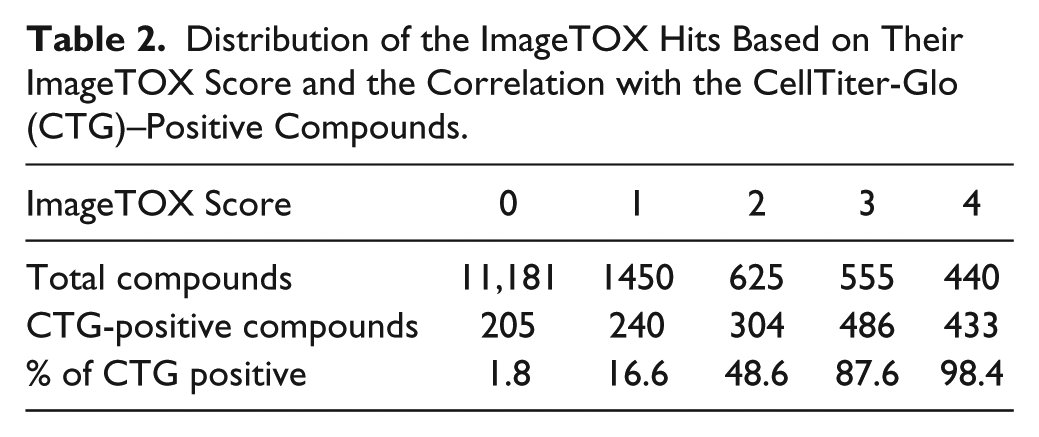
Strikingly, the ImageTOX assay was more sensitive in detecting compounds having adverse effects in cells as it revealed 1402 (9.9%) more compounds than CTG after 48 hours of drug exposure at 10 µM. As 67% of the compounds affected only one or two cell health parameters assessed, they are probably mildly toxic or start revealing their toxicity after a longer exposure time.
Concentration-Response Studies and Toxicity Kinetics of Hit Compounds
A group of 49 compounds showing a normalized ATP depletion level of more than 50% in CTG and an ImageTox score of at least 2 in the primary screen were retested in three cell lines at 10 µM at different time points in both assays. As shown in Figure 4A , in the three cell lines tested, more than 60% of compounds are already detected as toxic with an ImageTOX score of at least 1 after 2 hours of incubation, while only 25% are scored as positive in the CTG assay. After 24 h of incubation using SK-N-SH and MRC5, more than 90% of the compounds are positive for both assays. In HepG2 cells, the compounds needed to be incubated for 72 h to all score positive in CTG. The delay observed in HepG2 cells suggested they were more resistant to the toxic compounds than MRC5 or SK-N-SH, confirming the observation made during our assay development using staurosporine and tamoxifen. This is also in agreement with previously published studies showing that toxic compounds are generally toxic in a wide range of cell lines but might exhibit cell type–specific kinetic profiles.26,27
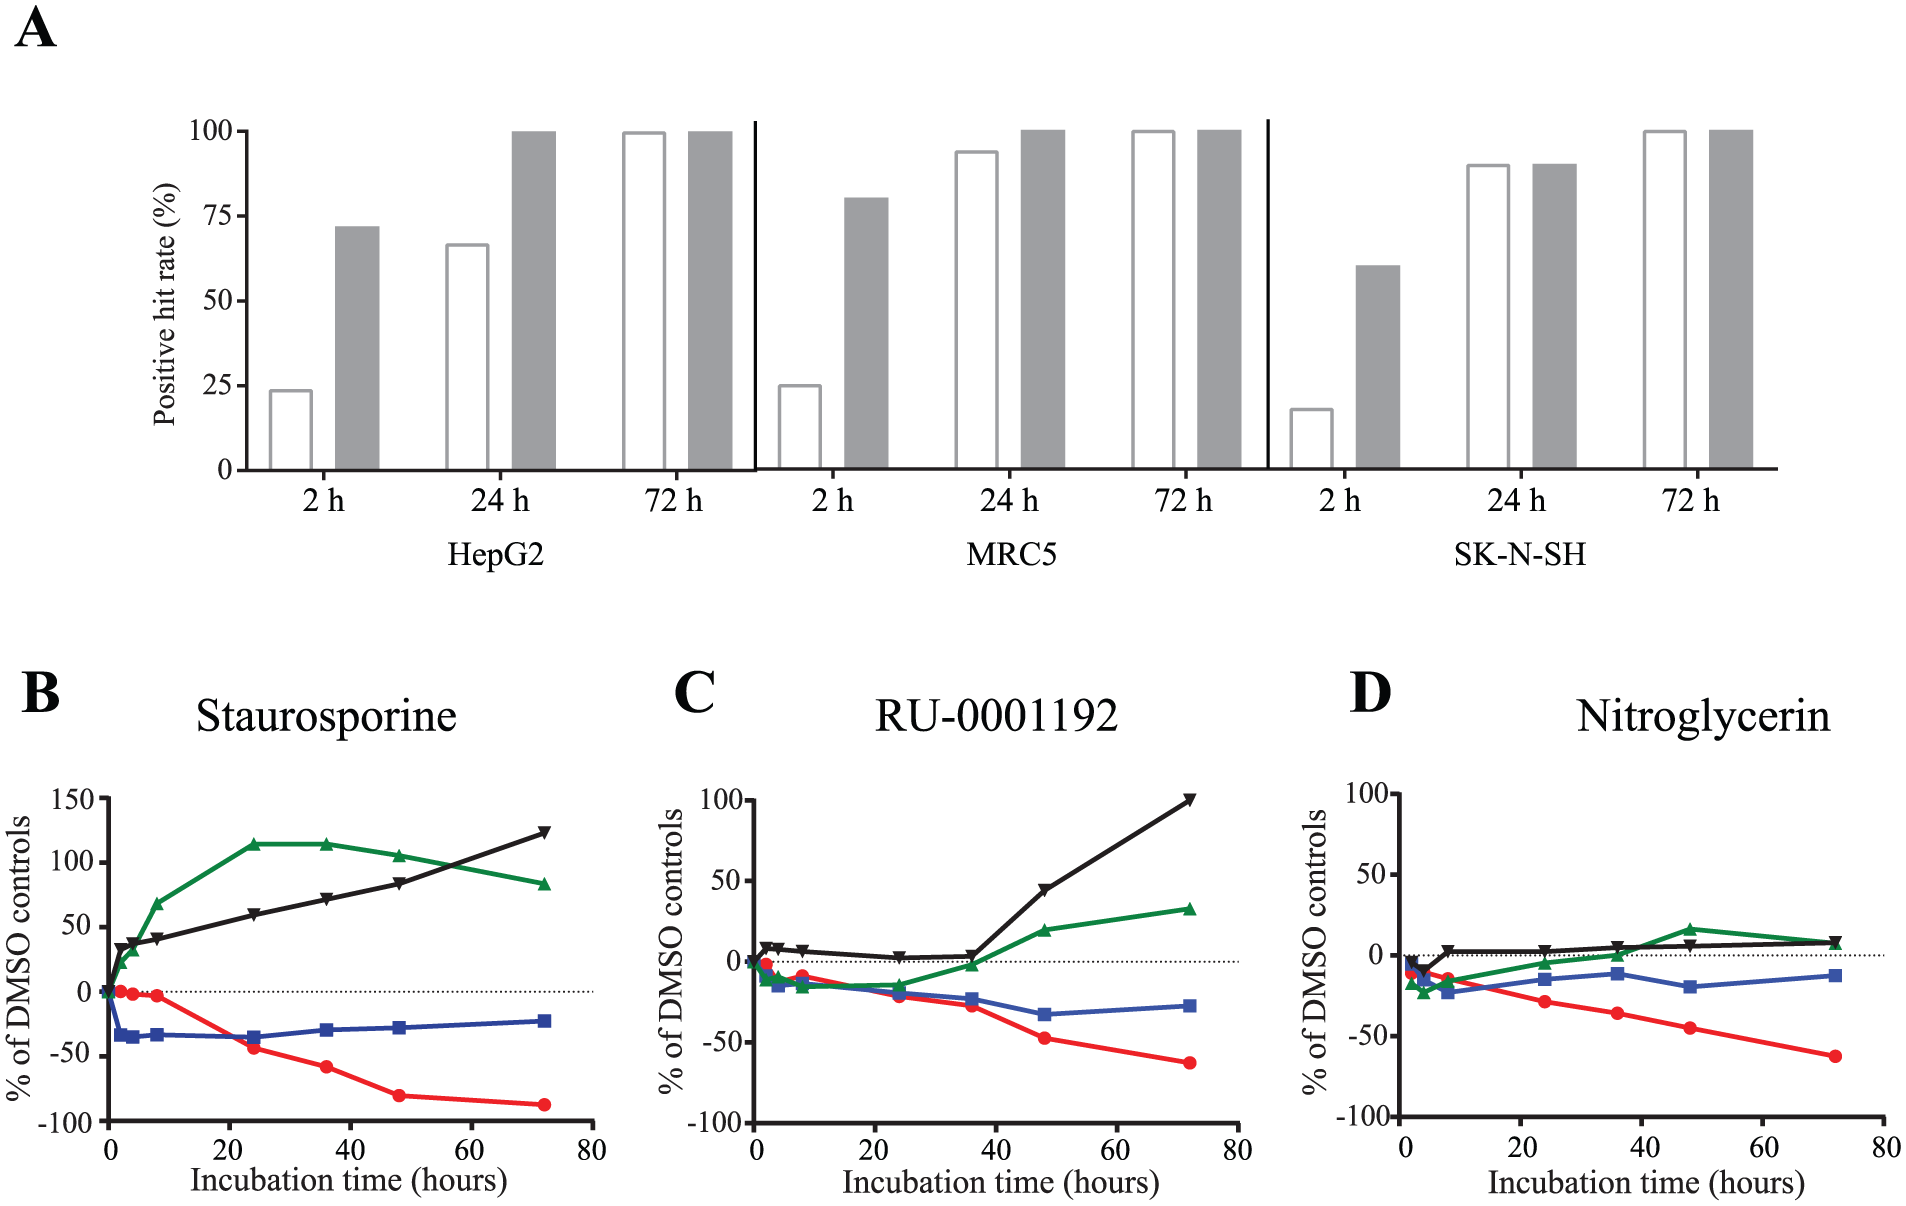
Effect of compound incubation time on the ImageTOX parameters and the CellTiter-Glo (CTG).
The compounds were also tested in concentration-response experiments to compare the IC50’s between both assays after 24, 48, and 72 h of incubation in MRC5. For all compounds tested, the ImageTOX assay was able to produce a dose-response curve for at least one of the parameters assessed. The IC50 values determined using the cell number parameter were in highest agreement with the CTG. For 26 compounds, IC50’s determined with cell number were three times lower than CTG, confirming the extreme sensitivity of this parameter. For only three compounds, the nuclear membrane permeability and the nuclear area and intensity parameters did not score for toxicity, indicating the possibility that these three were cytostatic compounds. We also confirmed that the ImageTOX detected the toxicity at an earlier time point. An incubation higher than 24 h only improved the IC50 of two compounds when assessing the cell count parameter and four compounds when assessing the nuclear membrane permeability parameter, while 14 compounds were found to be three times more potent after 72 h of incubation than 24 h of incubation using the CTG assay. Data are summarized in Supplementary Table S5 .
As the ImageTOX is a live multiparametric assay, toxic compounds can be profiled by analyzing each parameter independently over time on the same cells. Thus, we were interested to see if following each parameter in an extended time course experiment would reveal differences between how compounds manifest toxicity. Differences in kinetics were observed at lower time points. As an example, in MRC5 cells, both compounds, staurosporine ( Fig. 4B ) and RU-0001192 ( Fig. 4C ), showed the same level of toxicity for each parameter at 72 h but possessed a different kinetic profile. All parameters detected the toxicity before 24 h for staurosporine, while the toxicity of RU-0001192 was not detected before 48 h. Interestingly, some compounds such as nitroglycerin ( Fig. 4D ) did not show any effect on the nuclear morphology or the nuclear membrane permeability while the cell number and CTG were inhibited. CTG alone does not allow for the discrimination between antiproliferative and cytotoxic compounds because the level of ATP is dependent on both cell number and cell metabolism. Also, under condition of cell arrest, the amount of ATP in cells is increased and does not reflect anymore the amount of live cells. 28 The ImageTOX allowed for the distinction between compounds inhibiting cell division without impairing the cellular morphology.
In summary, the ImageTOX assay accurately identified compounds from a diverse library found to be toxic in an ATP depletion assay. Furthermore, it detected more compounds having an adverse effect on cell structure, and it detected those effects earlier than CTG. The assay could be performed in a time course manner on live cells to distinguish differences in the kinetic profile of toxic compounds. The ImageTox assay could distinguish between a cytotoxic or cytostatic effect and could identify artifacts caused by fluorescent compounds.
Discussion
Toxicity leads to the disruption of a variety of biological processes that can be evaluated using a high-content imaging platform. Here we have described the development of a novel assay, called ImageTOX, which surveys a number of elements of cell health simultaneously. The assay was simplified to a two-color, four-endpoint assay to simultaneously measure cell proliferation, nuclear area, nuclear intensity, and nuclear membrane permeability. The assay is very easy to conduct for any laboratory equipped with a high-content screening instrument and image segmentation software, because it requires only the addition of a solution mixture of two inexpensive Hoechst 33342 and SYTO 17 dyes to cells seeded in 384-well microplates without fixation and wash steps. In addition, we have reported here for the first time the use of SYTO 17 dye to assess the nuclear membrane permeability in a high-content assay. The SYTO 17 approach resulted in an extremely low coefficient of variation (less than 8% for both positive and negative controls), making it a very robust system for identifying weakly toxic compounds in a primary high-throughput screen. Known toxic controls (staurosporine and tamoxifen) were used to benchmark the technique.
Several studies report results of a high-content assay applied to a group of toxic compounds. Martin et al. screened a small library of 329 random drugs, but our study is the first to report a screen of a reasonably large library (12,668 samples) comparing in parallel a high-content assay and a conventional proliferation assay. 5 The ImageTOX identified a pool of 3070 potential toxic compounds at 10 µM at an incubation time of 48 h, where at least one of the cell health elements assessed was affected. Our comparative results suggested that the nuclear membrane permeability best correlated with the CTG readout, and this may be quite surprising given that cell proliferation is most commonly assumed to correlate with ATP production. However, it is possible that cells can divide for a few generations at the same time that their ATP anabolism is impeded by a toxin. This could lead to a reduced ATP readout that also starts to affect the nuclear integrity by interfering with energy-dependent channels, for example. Conversely, it is possible that a toxin could block a nuclear channel and affect metabolism. Our general impression is that any compound that perturbs one of the many cell survival processes will negatively affect all processes in time. The ImageTOX was more sensitive than CTG to adverse cell health effects, as it revealed 52.5% more toxic compounds. We believe that these compounds are truly disruptive to cell function, and they were negative in CTG because the ImageTOX shows abnormal morphology very early.
We identified 205 noncorrelating positive CTG compounds. One hundred fifty were intermediate in toxicity, giving response percentage numbers that were close to the cutoff for each parameter of both assays. It has been previously shown that this is quite a common explanation for discrepancy between screening approaches, which use cherry-pick scenarios. 29 The explanation for the remaining 55 CTG hits, which were not positive in ImageTOX, could be either that the CTG assay can produce false-positive hits when a compound is an inhibitor of the luciferase enzyme, or the compound has an inner filter effect, or the ATP content of the cell was affected by the compound without affecting either nuclear area, nuclear intensity, cell number, or nuclear membrane permeability. We believe that it is unlikely that all four parameters would be unaffected by a true ATP synthesis or proliferation inhibitor.
The ImageTOX assay was able to produce high-quality concentration-response curves for determining IC50’s and for ranking the potency of compounds. This ImageTOX score approach presents other significant advantages over CTG. As it allows live cell monitoring in a physiological microenvironment, kinetic measurements can be done on a single-cell population for detecting differences in mechanisms of action. Detection of differences in toxicity kinetics requires multiple early time points that cannot be done with single-endpoint assays such as CTG. Toxic compounds tested in the three cell lines were toxic in all of them, but the kinetics of toxicity were cell line dependent. MRC5 cells and SK-N-SH cells were more sensitive to toxic compounds versus HepG2 cells. The optimal incubation time is an important experimental condition to assess before using the ImageTOX assay in a cell line differing from those used in this study. A screen should be conducted at a time point that reveals the highest number of toxic compounds. In general, time points longer than 48 h should be avoided because the cells seem too damaged to produce good-quality data in the ImageTOX assay. The cells can be disintegrated or the membranes are so porous that the dyes are released in the media. We also showed that the ImageTOX assay was better than CTG at identifying cytotoxicity at earlier times. This is consistent with a previous report showing that measurement of ATP does not catch early toxic events because the concentration of ATP is relatively high until late in the life of the cells. 8
Even though the throughput of the CTG assay is higher than the throughput of the ImageTOX assay, which requires more acquisition and analysis time, the ImageTOX assay provides more information per sample and had the capacity to detect minor changes in cell health that the CTG was not able to detect. We expect that the use of this assay will be valuable for improving the early detection of toxic compounds in libraries of compounds and can be included in an image-based primary screening assay assessing any phenotypic readout using the green or far red spectra. We have made the comprehensive data available in the supplemental materials for those interested in using the data sets for machine-learning toxicity analysis.
Footnotes
Acknowledgements
We thank the High-Throughput Screening and Spectroscopy Resource Center at Rockefeller University for providing instrumentation, compound libraries, and the database. We also thank Carolina Adura for fruitful discussions and helpful comments during the editing of the manuscript. We also acknowledge Namita Trikannad for her technical support.
Data and Materials Available
Primary screen results are available as supplementary material
Supplementary material is available online with this article.
Declaration of Conflicting Interests
The authors declared no potential conflicts of interest with respect to the research, authorship, and/or publication of this article.
Funding
The authors disclosed receipt of the following financial support for the research, authorship, and/or publication of this article: The authors received financial support from the Rockefeller University through the High-Throughput and Spectroscopy Resource Center.
References
Supplementary Material
Please find the following supplemental material available below.
For Open Access articles published under a Creative Commons License, all supplemental material carries the same license as the article it is associated with.
For non-Open Access articles published, all supplemental material carries a non-exclusive license, and permission requests for re-use of supplemental material or any part of supplemental material shall be sent directly to the copyright owner as specified in the copyright notice associated with the article.