
Abstract
To better understand regional brain glycosphingolipid (GSL) accumulation in Gaucher disease (GD) and its relationship to neuropathology, a feasibility study using mass spectrometry and immunohistochemistry was conducted using brains derived from a GD mouse model (4L/PS/NA) homozygous for a mutant GCase (V394L [4L]) and expressing a prosaposin hypomorphic (PS-NA) transgene. Whole brains from GD and control animals were collected using one hemisphere for MALDI FTICR IMS analysis and the other for quantitation by LC-ESI-MS/MS. MALDI IMS detected several HexCers across the brains. Comparison with the brain hematoxylin and eosin (H&E) revealed differential signal distributions in the midbrain, brain stem, and CB of the GD brain versus the control. Quantitation of serial brain sections with LC-ESI-MS/MS supported the imaging results, finding the overall HexCer levels in the 4L/PS-NA brains to be four times higher than the control. LC-ESI-MS/MS also confirmed that the elevated hexosyl isomers were glucosylceramides rather than galactosylceramides. MALDI imaging also detected differential analyte distributions of lactosylceramide species and gangliosides in the 4L/PS-NA brain, which was validated by LC-ESI-MS/MS. Immunohistochemistry revealed regional inflammation, altered autophagy, and defective protein degradation correlating with regions of GSL accumulation, suggesting that specific GSLs may have distinct neuropathological effects.
Introduction
Gaucher disease (GD) is an autosomal recessive lysosomal storage disorder resulting from a mutation in GBA1, which encodes glucocerebrosidase (GCase, EC 3.1.2.45). GCase is the enzyme responsible for glucosylceramide (GluCer) degradation, a key step in glycosphingolipid (GSL) catabolism. 1 Accordingly, GD patients present with gross accumulations of GluCer in many organs, including the spleen, liver, lung, bone, and in some variants, the central nervous system (CNS). 2 Three phenotypes (1–3) of GD have been defined by the presence (types 2 and 3) or absence (type 1) of early-onset progressive CNS involvement.2–4 Type 2 GD presents in infancy, usually leading to death within 1–3 years of onset, while type 3 patients generally experience a later involvement of the CNS, often surviving for several decades. Although type 1 GD patients experience a highly variable visceral disease and typically remain free of CNS involvement, they have a much greater lifetime risk of developing Parkinson’s disease and Lewy body disease.5,6 Enzyme replacement therapy (ERT) has proven successful in treating the visceral manifestations of GD variants; however, it is unable to cross the blood–brain barrier, and therefore is ineffective at targeting CNS-involved GD.3,7,8 Alternatively, studies assessing substrate reduction therapy (SRT), which utilizes small brain-penetrant molecules to inhibit GluCer synthase, have been encouraging. For example, recent CNS-accessible SRT studies using GD and synucleinopathy mouse models showed an overall increase in the survival rate of affected mice by 30%, with a reduction in αSynuclein (αSyn) aggregates and memory deficit, due to SRT therapy, respectively.9–11 Interestingly, prolonged life span and neurobehavioral improvement in the successful cases proved dependent on the overall level of GluCer reduction. However, it remains unknown whether specific GluCer species play a role in this process and, further, impact brain neuropathology.12,13 To determine whether GSL species chain length influences disease, research is warranted. Additionally, research in this area could provide insight into other neurological diseases given the recent link between Parkinson’s disease and GBA1 mutations, a causative mechanism that is still under active investigation.14,15 To begin to characterize GSL accumulation and GD disease pathology, pilot studies using liquid chromatography–electrospray ionization–tandem mass spectrometry (LC-ESI-MS/MS), matrix-assisted laser desorption/ionization Fourier transform ion cyclotron resonance imaging mass spectrometry (MALDI FTICR IMS), and immunohistochemistry were applied to a GD mouse model. 16
LC-ESI-MS/MS is the gold standard for the identification of subspecies of GSLs 16 and has been used successfully to quantitate tissue GluCers in both GD and Parkinson’s disease.12,13 However, when used alone, LC-ESI-MS/MS offers little insight concerning the spatial localization of an analyte in relation to the tissue’s histopathology. MALDI IMS is a robust, label-free tool capable of producing two-dimensional (2D) or three-dimensional (3D) ion images indicative of a biomolecule’s distribution across a tissue.17–20 The incorporation of high-resolution instrumentation, such as the FTICR mass spectrometer, within MALDI IMS workflows has made the ability to differentiate previously hard-to-detect lipids, such as ceramides and GSLs, from their more abundant neighboring lipid species feasible.20,21 Here, GSL species were profiled quantitatively and spatially using a combination approach of MALDI FTICR IMS and LC-ESI-MS/MS. Immunohistochemistry was used to provide pathobiochemical insights into the correlation between GSL accumulation and spatial neuropathology. Although GSL species have been characterized previously in normal mouse brain tissues, this study represents the first MS-based imaging approach to identify brain GSL species in a GD mouse model.22,23
Materials and Methods
Materials
Rat anti-mouse CD68 monoclonal antibody (MCA 1957) was from AbD Serotec (Raleigh, NC). Biotinylated rabbit anti-rat immunoglobulin G (IgG) (H + L) (BA-4001) was from Vector Laboratories, Inc. (Burlingame, CA). DISCOVERY Antibody diluent (760-108) and DISCOVERY DAB Map Detection Kit (RUO) (760-124) were from Ventana Medical System (Tucson, AZ). Internal standards of GluCer, GalCer, LacCer, gangliosides GM1, and sulfatide for LC-ESI-MS/MS were from Avanti Polar Lipids, Inc. (Alabaster, AL). Sulfatides with C12:0, C16:0, and C24:0 were obtained from Mytreya LLC (Pleasant Gap, PA). Ganglioside GM2 was obtained from Sigma-Aldrich (St. Louis, MO), and ganglioside GM3 from AdipoGen (San Diego, CA). 2,5-Dihydroxybenzoic acid (DHB) and trifluoroacetic acid (TFA) were obtained from Sigma-Aldrich. High-performance liquid chromatography (HPLC)–grade methanol (MeOH), ethanol (EtOH), and water were obtained from Fisher Scientific (Waltham, MA). Indium tin oxide (ITO) slides were purchased from Bruker Daltonics (Billerica, MA) for MALDI IMS experiments. Additional GSL standards were purchased from Avanti Polar Lipids.
Animal Care and Brain Collection
4L/PS-NA mice were produced by cross-breeding the GCase point mutant (V394L) mice with prosaposin knockout (PS) and hypomorphic prosaposin mouse lines (i.e., PS with a low-expressing mouse prosaposin transgene [PS-NA]). The strain backgrounds of 4L/PS-NA were C57BL/6J/129SvEV and FVB. 24 Functionally normal, strain- and age-matched littermates that have endogenous wild-type prosaposin and the GCase point mutant V394L were used as controls. 24 The mice were maintained in microisolators in accordance with institutional guidelines under Institutional Animal Care and Use Committee (IACUC) protocol 2015-0050, approved by the Cincinnati Children’s Hospital Research Foundation. The mouse brains were collected at 18 weeks of age. The mice were subjected to CO2 narcosis and perfused with saline. The brains were split at the midline and cut into two hemispheres, with the right hemispheres used for MALDI FTICR IMS and the left hemispheres for LC-ESI-MS/MS analysis. For both experiments, the brains were sectioned sagittally.
MALDI FTICR IMS
The right brain hemisphere from 4L/PS-NA or control mice was collected for imaging, and the left hemispheres were collected and prepared for LC-MS/MS. The tissue was sectioned sagittally at 10 μm and thaw mounted onto an ITO (Bruker Daltonics) conductive slide. Slides were desiccated for 10 min prior to matrix application using an HTX TM sprayer (HTX Technologies, Chapel Hill, NC). Both control and GD brain were placed on the same slide and sprayed with DHB matrix (30 mg/mL) in 50% methanol and 0.1% TFA, with a velocity of 950 mm/min and a final density of 0.01684 mg/mm2. Following matrix application, slides were again desiccated for 20 min prior to analysis using a Solarix 7T FTICR mass spectrometer (Bruker Daltonics) and FlexControl. Spectra were acquired across both tissue sections (both tissues were acquired in one imaging run) operating in positive ion mode to detect lipid species of interest in the m/z 200–1200 range with a SmartBeam II laser operating at 1000 Hz, a laser spot size of 25 μm, and a lateral resolution of 100 μm, collecting 400 shots per pixel, with a resolution of ~70,000 at m/z 800. Example spectra from two regions of interest (ROIs), along with a list of achievable resolutions, are included in the supplementary data ( Suppl. Figs. S1 and S2 ). Data were reduced to a 1 ICR reduction noise threshold, and normalized using root-mean-square vector normalization. 25 Data were visualized using FlexImaging (Bruker Daltonics). All the GSLs identified in this study contain a dihydroxy group on the sphingosine backbone. The lipids were identified by accurate mass, cross-referenced to the Lipid Maps database, and confirmed with collision-induced dissociation (CID) where indicated (see Suppl. Figs. S5–S7 ).
Glycosphingolipids Analyses by LC-ESI-MS/MS
The left brain hemisphere was sliced sagittally and dissected by region, collecting the olfactory bulb (OB), cortex (CO), midbrain (MID), brain stem (BS), and cerebellum (CB). GSLs were extracted for LC-ESI-MS/MS quantitative analysis as described previously. 24 Quantitation of GSLs, including GluCer/GalCer, LacCer, sulfatide, and gangliosides, was carried out using a Waters (Milford, MA) Quattro Premier triple quadrupole mass spectrometer interfaced with the Acquity UPLC system. The triple quadrupole mass spectrometer was operated under unit resolution. Optimized parameters for GSLs were determined with individual standard compounds. Like MALDI IMS results, all the GSLs identified in this study contain a dihydroxy group on the sphingosine backbone. The isomeric analysis of GluCer and GalCer was achieved by resolving the two isomers on a silica column (Phenomenex 2.1*250 mm) running under the hydrophilic interaction liquid chromatography (HILC) mode. Five standards (C16, C18, C24:1 GluCer and C16, C24:1 GalCer) were used, and C12 GluCer and C12 GalCer were used separately as internal standards. Lactosylceramides (LacCers) and gangliosides were analyzed with an Acquity UPLC CSH C18 column (2.1 × 100 mm, 1.7 µm) (Waters). Standards of gangliosides GM1, GM2, and GM3 and C16 LacCer and C24 LacCer from commercial sources were used to construct calibration curves, and C12 LacCer was used as an internal standard. For quantification, the precursor and product ion pairs for multiple-reaction monitoring (MRM) were either selected by MS/MS spectra of standards or calculated theoretically if the standard for a given ceramide length was not readily available. Analysis of gangliosides was performed under negative mode, while LacCers were under positive mode. Composition of individual species in the standards was determined by the ratio of standard infusion ion intensity or by description from the supplier. Sulfatides were analyzed under negative ion mode by detection of their parent deprotonated ion and common product ion of m/z 97. C16 and C24 sulfatide standards were used to construct calibration curves, and C12 sulfatide was used as an internal standard. Quantification of GSL species with various fatty acid chain lengths was realized by using the curve of each GSL species with the closest number of chain length. GSL levels in the tissues were normalized to wet tissue weight.
Immunohistochemistry
The left brain hemisphere was sectioned sagittally and fixed in 4% paraformaldehyde, processed for frozen blocks, and sectioned. Immunohistochemistry studies with anti-CD68, anti-glial fibrillary acidic protein (GFAP), and anti-p62 staining were performed using the DISCOVERY XT Staining Module on a BenchMark XT Automated IHC/ISH slide staining system (Ventana Medical System) at the Pathology Research Core at the Cincinnati Children’s Hospital Medical Center. 26 Frozen tissue sections were incubated with each antibody diluted in DISCOVERY Antibody diluent, followed by biotinylated secondary antibody. Detection was performed using the Ventana IHC DAB Map Kit. Tissue sections were counterstained with hematoxylin and were analyzed by light microscopy. Images were acquired by digital scanning using AperioImageScope v2.
Results
Mapping and Quantitation of Glycosphingolipids by Brain Region
For GSL imaging analysis, the brains from GD (4L/PS-NA) and control mice were collected and analyzed following the workflow summarized in Figure 1A . 21 Briefly, brains from 4L/PS-NA and control mice were split sagittally into two (left and right) hemispheres. Right hemispheres were analyzed using MALDI FTICR IMS analysis by sectioning the brains and placing both the control and GD brains on the same slide ( Fig. 2A ). In an effort to collect more comparable data, imaging runs included both tissues. GSL lipid species were identified by mass and compared across conditions using relative ion intensities. An abundant brain lipid phosphatidylcholine (PC) 32:0 ( Fig. 2B ) was included to demonstrate consistent signal across the two different brains. However, differential distributions can be seen in the grey versus white matter, which is consistent with data shown previously. 23 Using this approach, many different hexosylceramides (HexCers) were detected ( Fig. 2C ). Of these, HexCer d18:1/18:0 + Na, HexCer d18:1/20:0 + Na, and HexCer d18:1/22:0 + Na exhibit a higher detectable signal intensity value in the MID versus the CB, OB, BS, and CO. LC-ESI-MS/MS analyses confirmed the imaging data, with HexCer d18:1/18:0 + Na and HexCer d18:1/20:0 + Na having a 2.4-fold increase, HexCer d18:1/24:0 + Na having a 1.3-fold increase, and HexCer d18:1/24:1 + Na having a 1.8-fold increase in the 4L/PS-NA brain versus control ( Fig. 2 ).
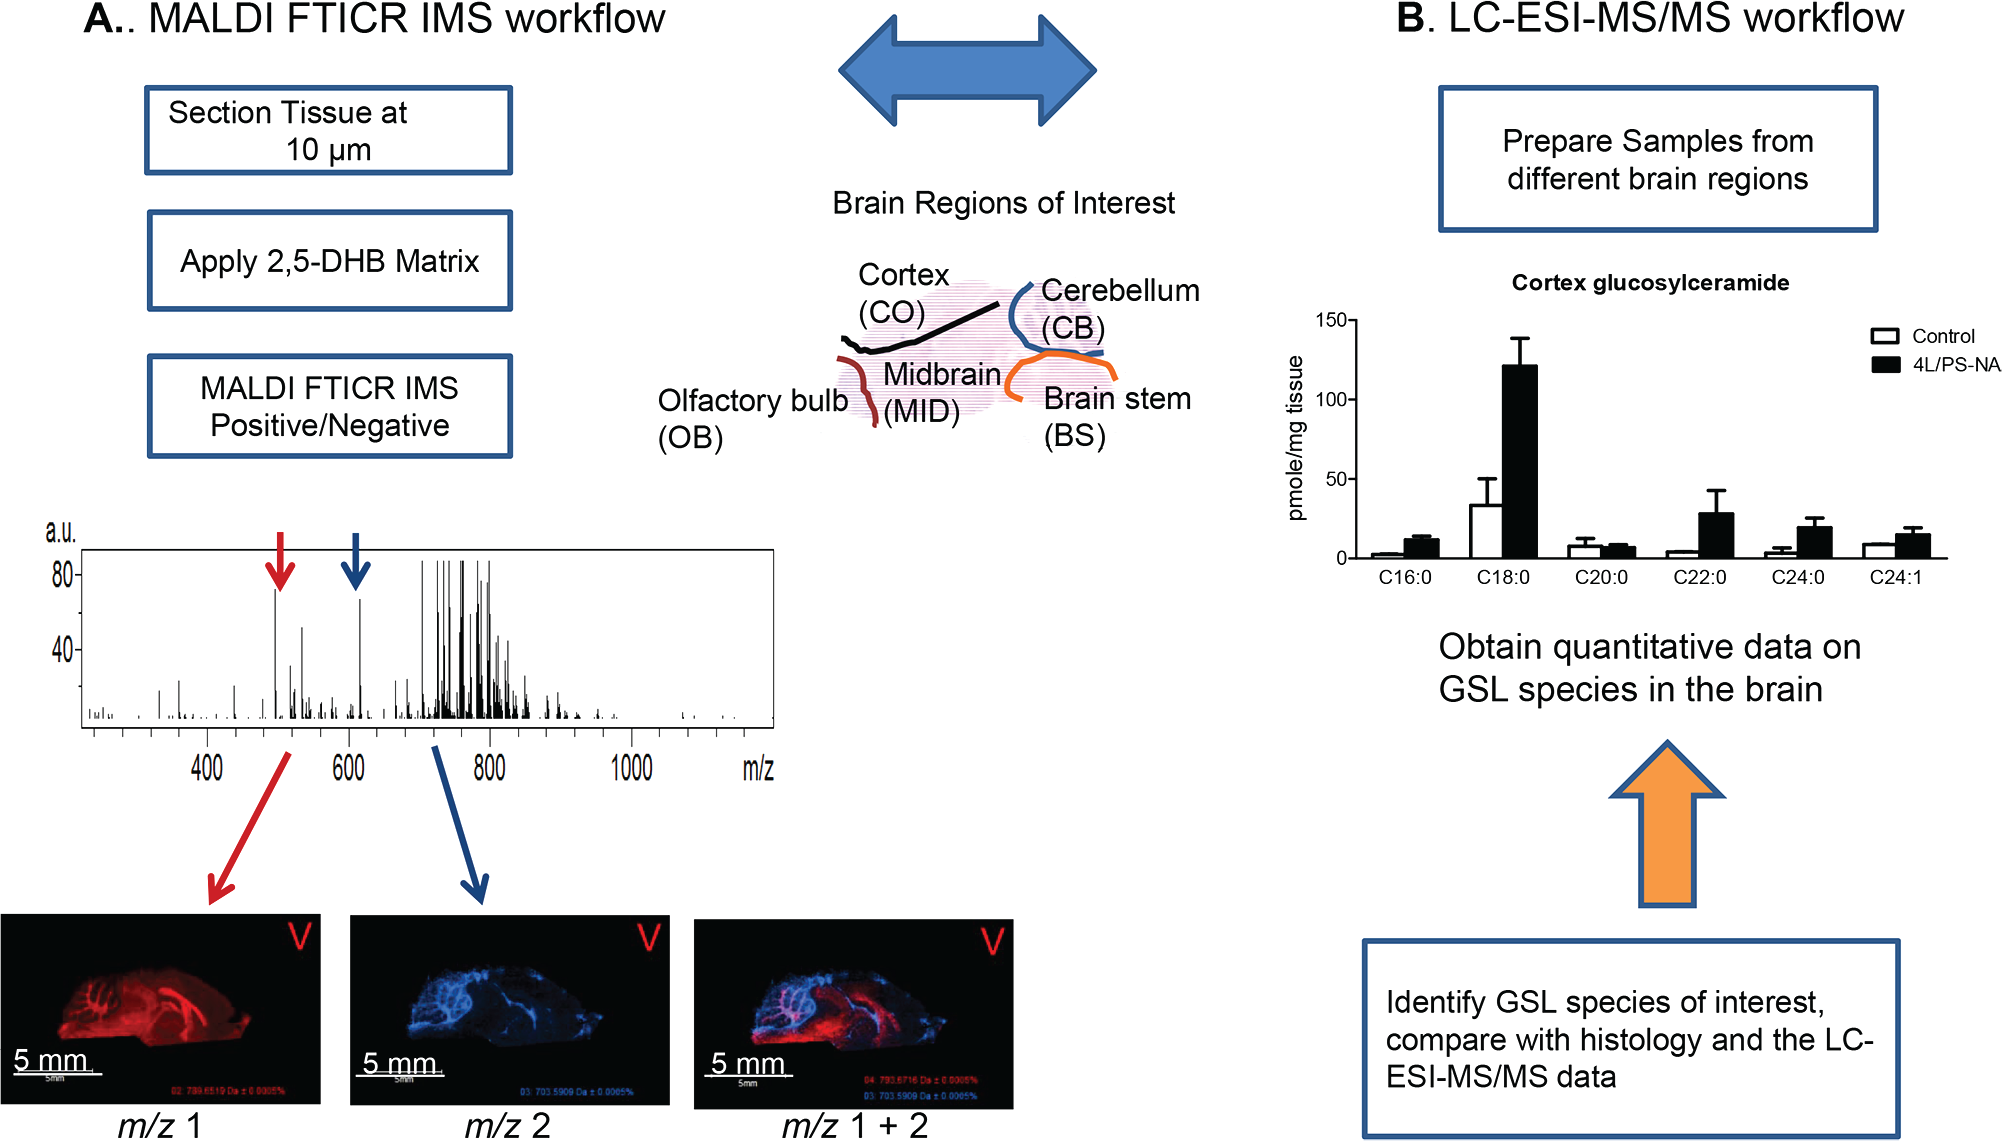
Overall workflow for GSL detection using MALDI FTICR IMS and LC-ESI-MS/MS in a GD mouse model. (
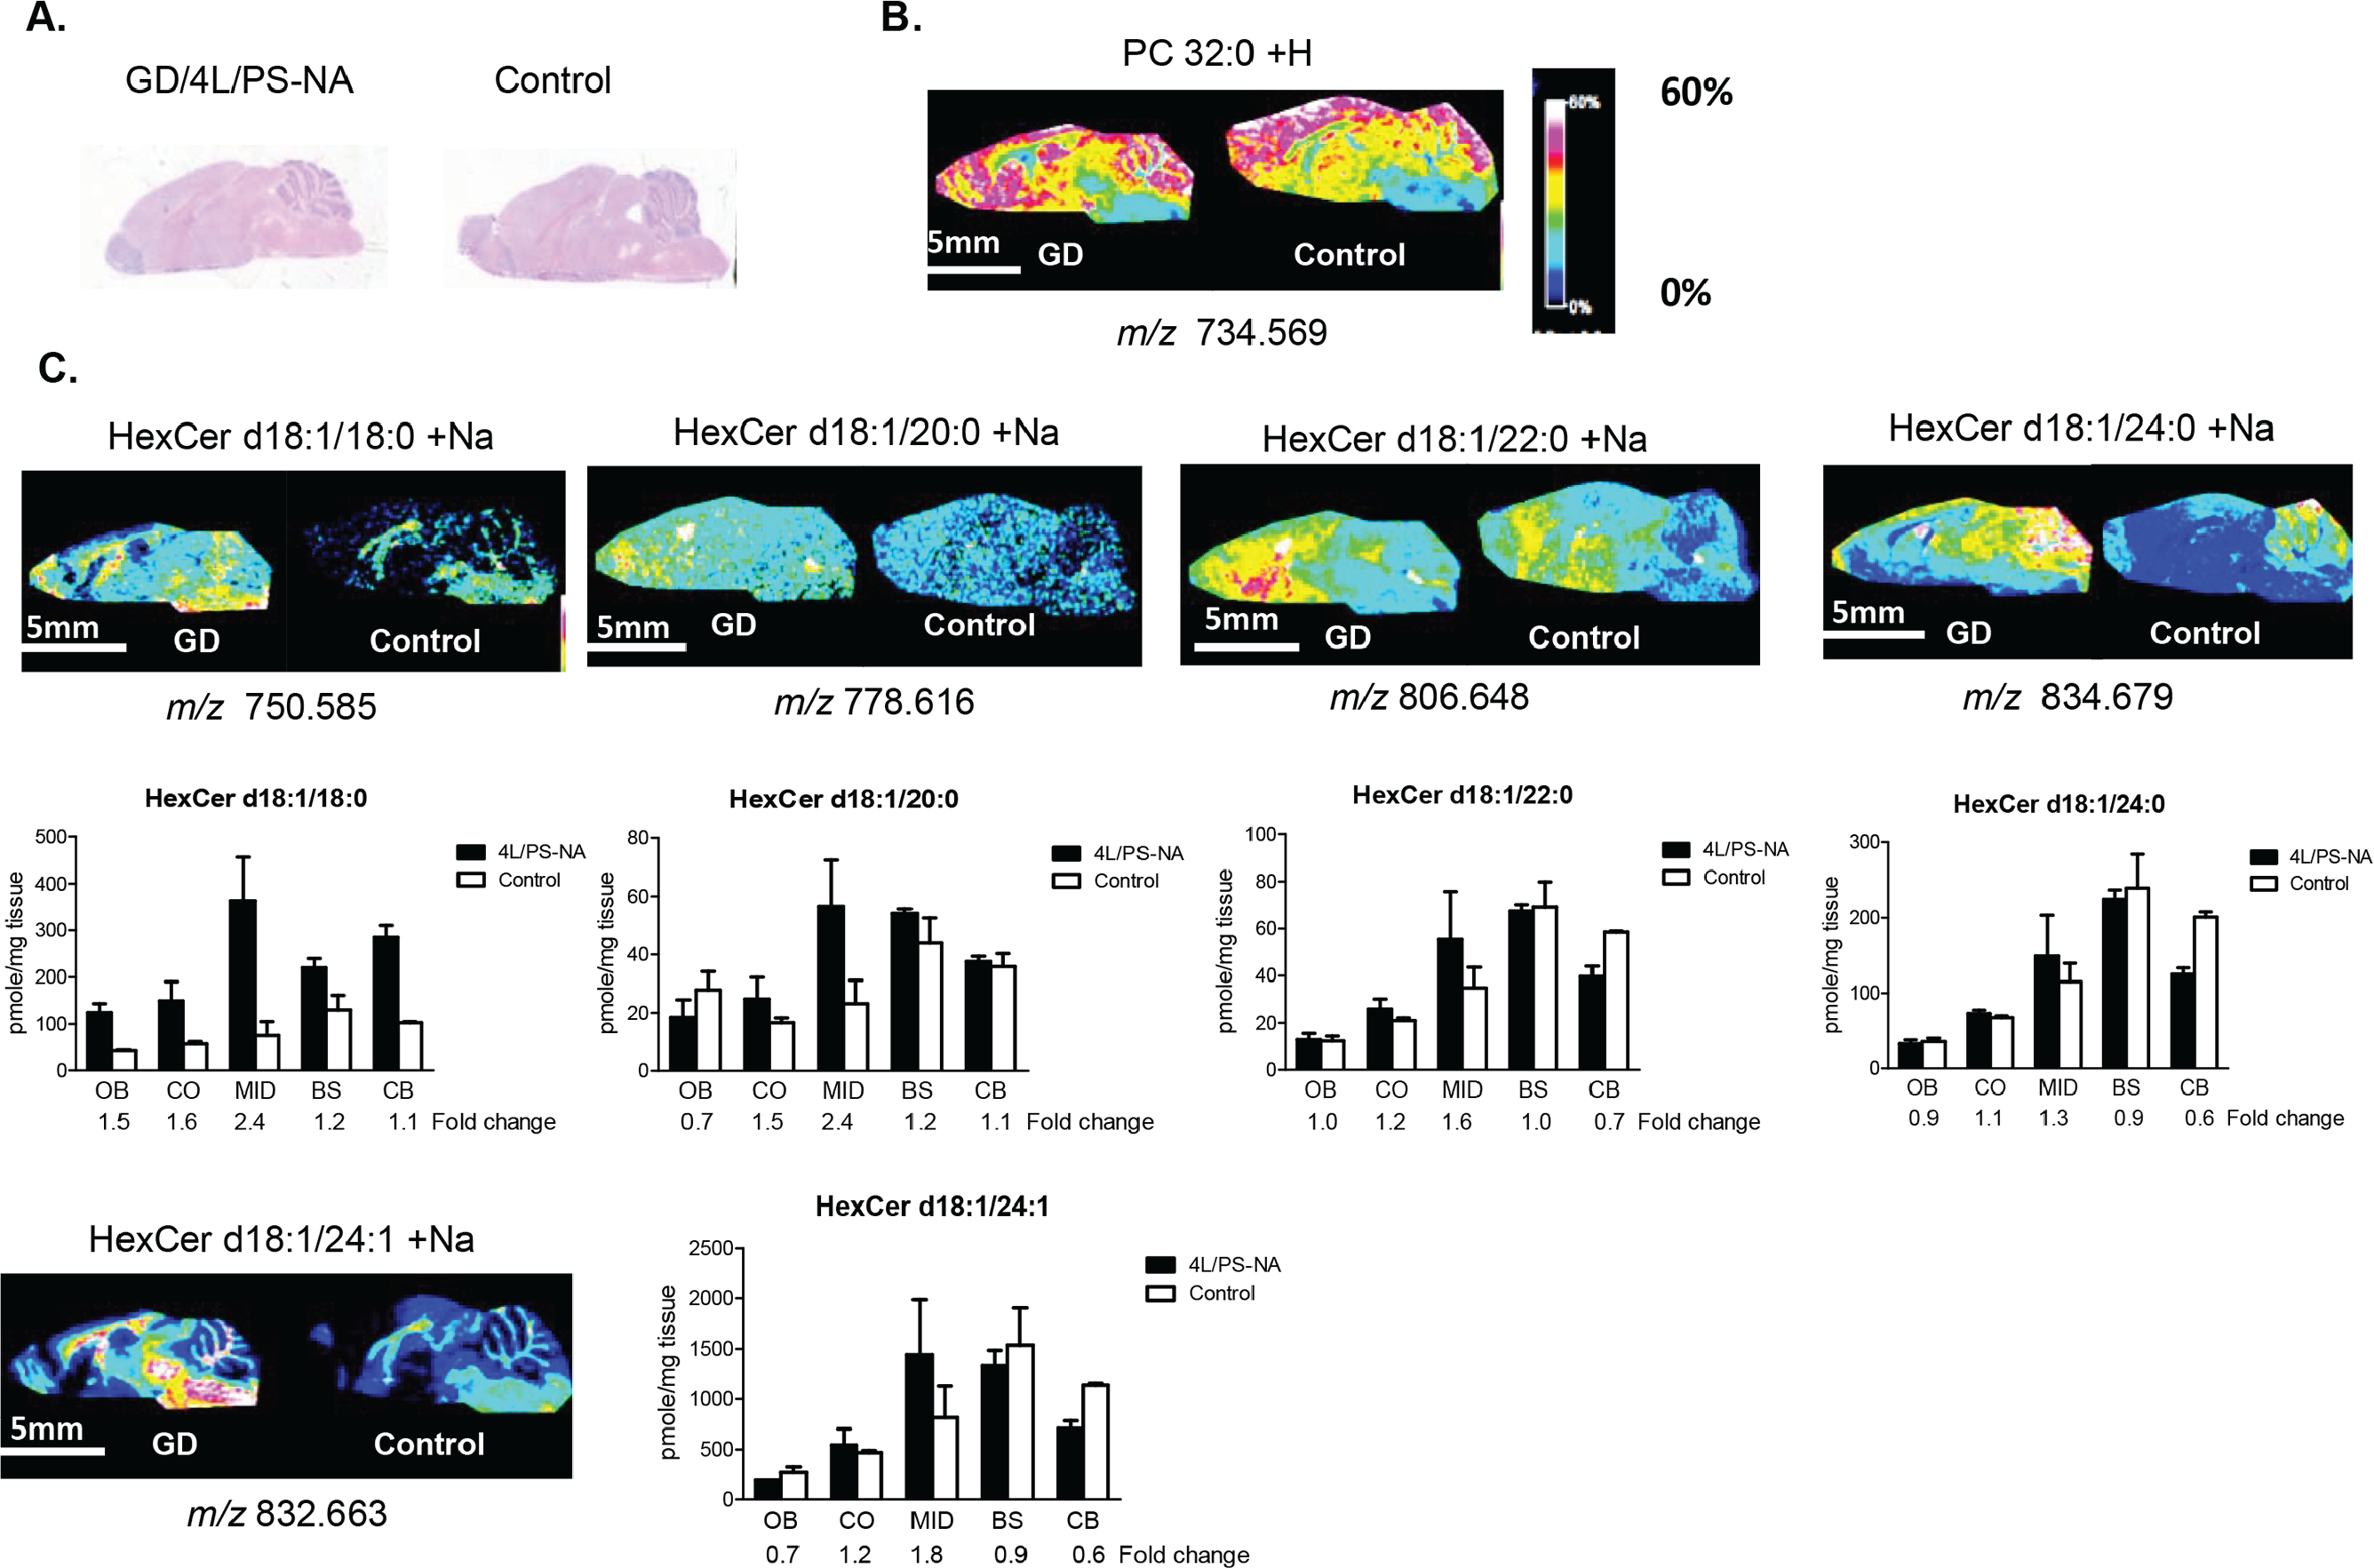
MALDI FTICR IMS and LC-ESI-MS/MS identify elevated HexCer species in a GD mouse brain. (
HexCers consists of GluCer and galactosylceramide (GalCer) isomers, of which MALDI IMS is unable to discern; therefore, a LC-ESI-MS/MS approach was employed. MS/MS data confirmed that the HexCer species in the 4L/PS-NA brains were GluCers rather than GalCers ( Fig. 3 ). Overall, the level of GluCer species detected in the 4L/PS-NA brain was 4.4- to 4.8-fold higher than the control, while the GalCer species levels remained similar or only slightly elevated ( Fig. 3 ). Of the detected GSLs, GluCer d18:1/18:0 is predominant (~100 pmol/mg) in the brain, followed by GluCer d18:1/20:0, GluCer d18:1/24:1 (~10 pmol/mg), and GluCer d18:1/22:0 and GluCer d18:1/24:0 (~2 pmol/mg). Compared with the control, 4L/PS-NA had a tremendously increased GluCer d18:1/18:0 in all brain regions ( Fig. 3 ), especially in MID, which correlates with enhanced HexCer d18:1/18:0 signals in those regions identified by MALDI FTICR IMS ( Fig. 2 ).
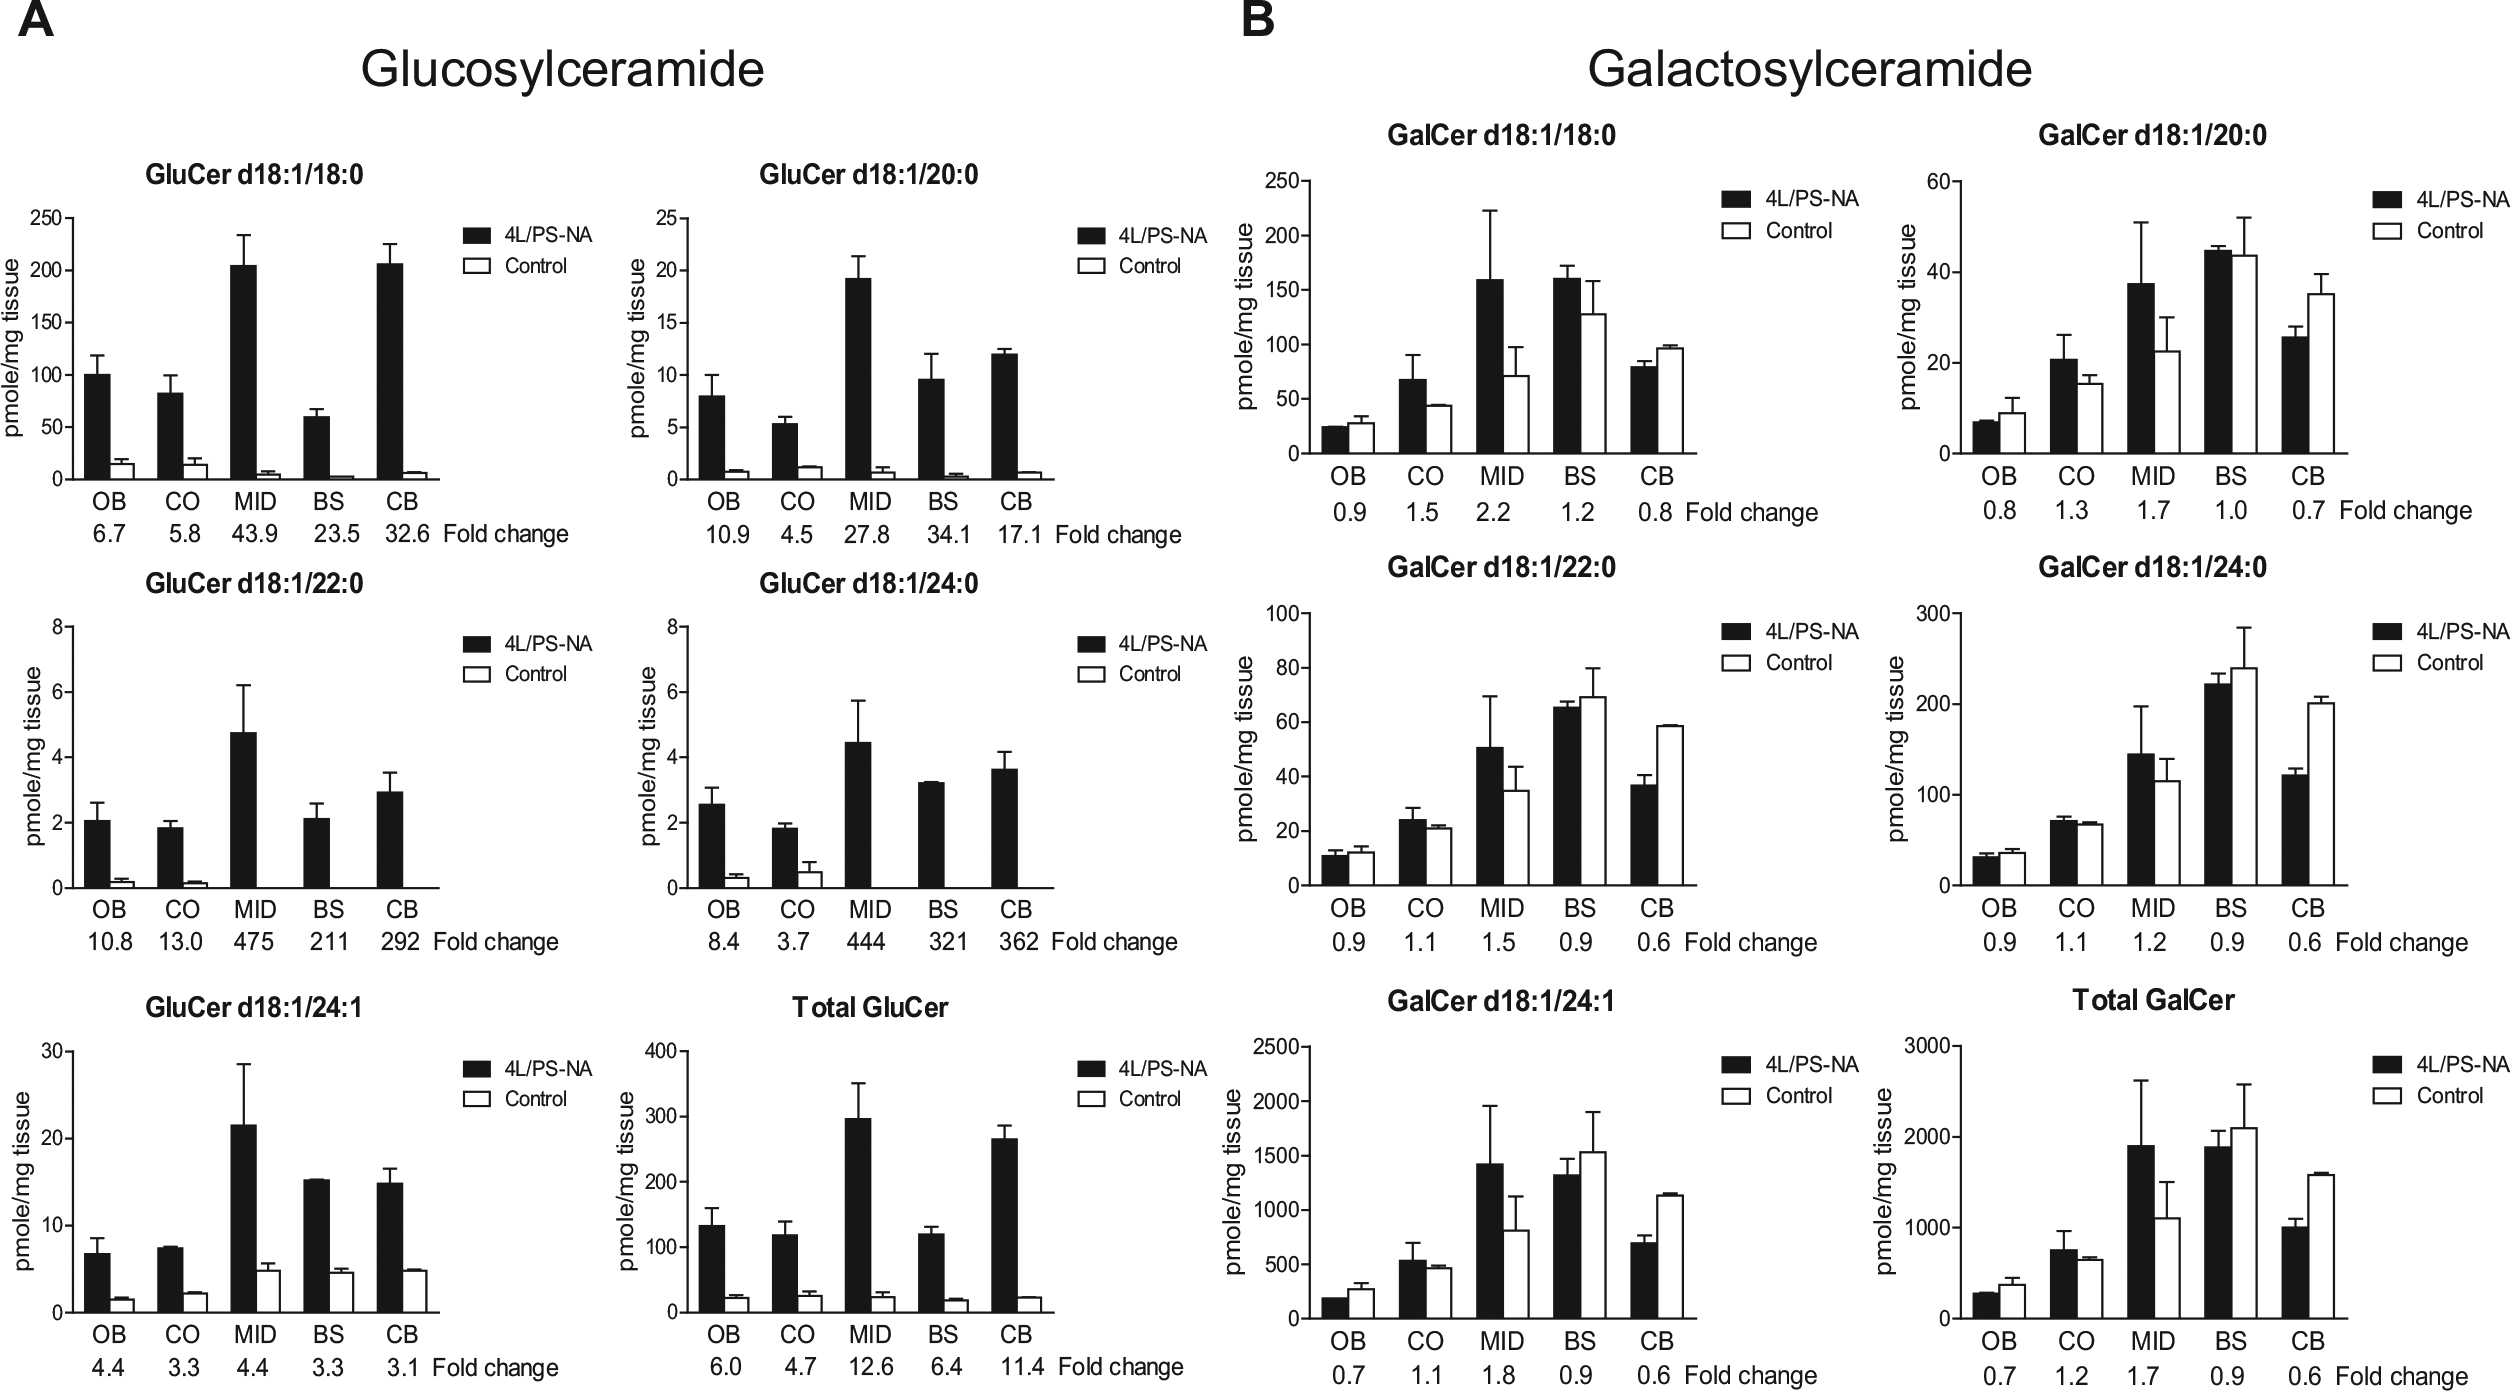
LC-ESI-MS/MS explicates that HexCer elevations are attributed to GluCers. (
Mapping and Quantitation of Complex GSLs by Brain Regions
The low expression of the prosaposin transgene in 4L/PS-NA mice results in lowered levels of saposins A–D, resulting in the accumulation of complex GSL species, such as LacCers, sulfatides, and gangliosides. 24 MALDI FTICR IMS revealed regional changes in GSL distributions, which were generally in agreement with those found by LC-ESI-MS/MS quantitative analysis. Increased LacCer levels in the 4L/PS-NA brains were evident by both methods ( Fig. 4 ). Interestingly, MALDI IMS identified LacCer d18:1/18:0 + K, the major species in the brain, with high signal intensity in the CB of 4L/PS-NA compared with the control ( Fig. 4B ), which was supported by LC-ESI-MS/MS quantitation ( Fig. 4C ). Additional species, including LacCer d18:1/20:0 + Na and LacCer d18:1/22:0 + Na, were also identified, with similar elevations in 4L/PS-NA CB by both approaches ( Fig. 4 ). Although the changes of LacCers in the MID and CO regions were not easily differentiated in the MALDI IMS, they were unambiguously determined by LC-ESI-MS/MS analysis and showed elevation in 4L/PS-NA brain versus control. This is an interesting finding given that LacCer has been linked to neuroinflammation 27 and potentiating mitochondrial dysfunction, 28 which are pathological features of GSL storage diseases, including GD.24,29 It is also possible that accumulated LacCer may also be a contributing factor to the loss of Purkinje cells in CB observed in 4L/PS-NA mice and GD type 3 patients.3,16
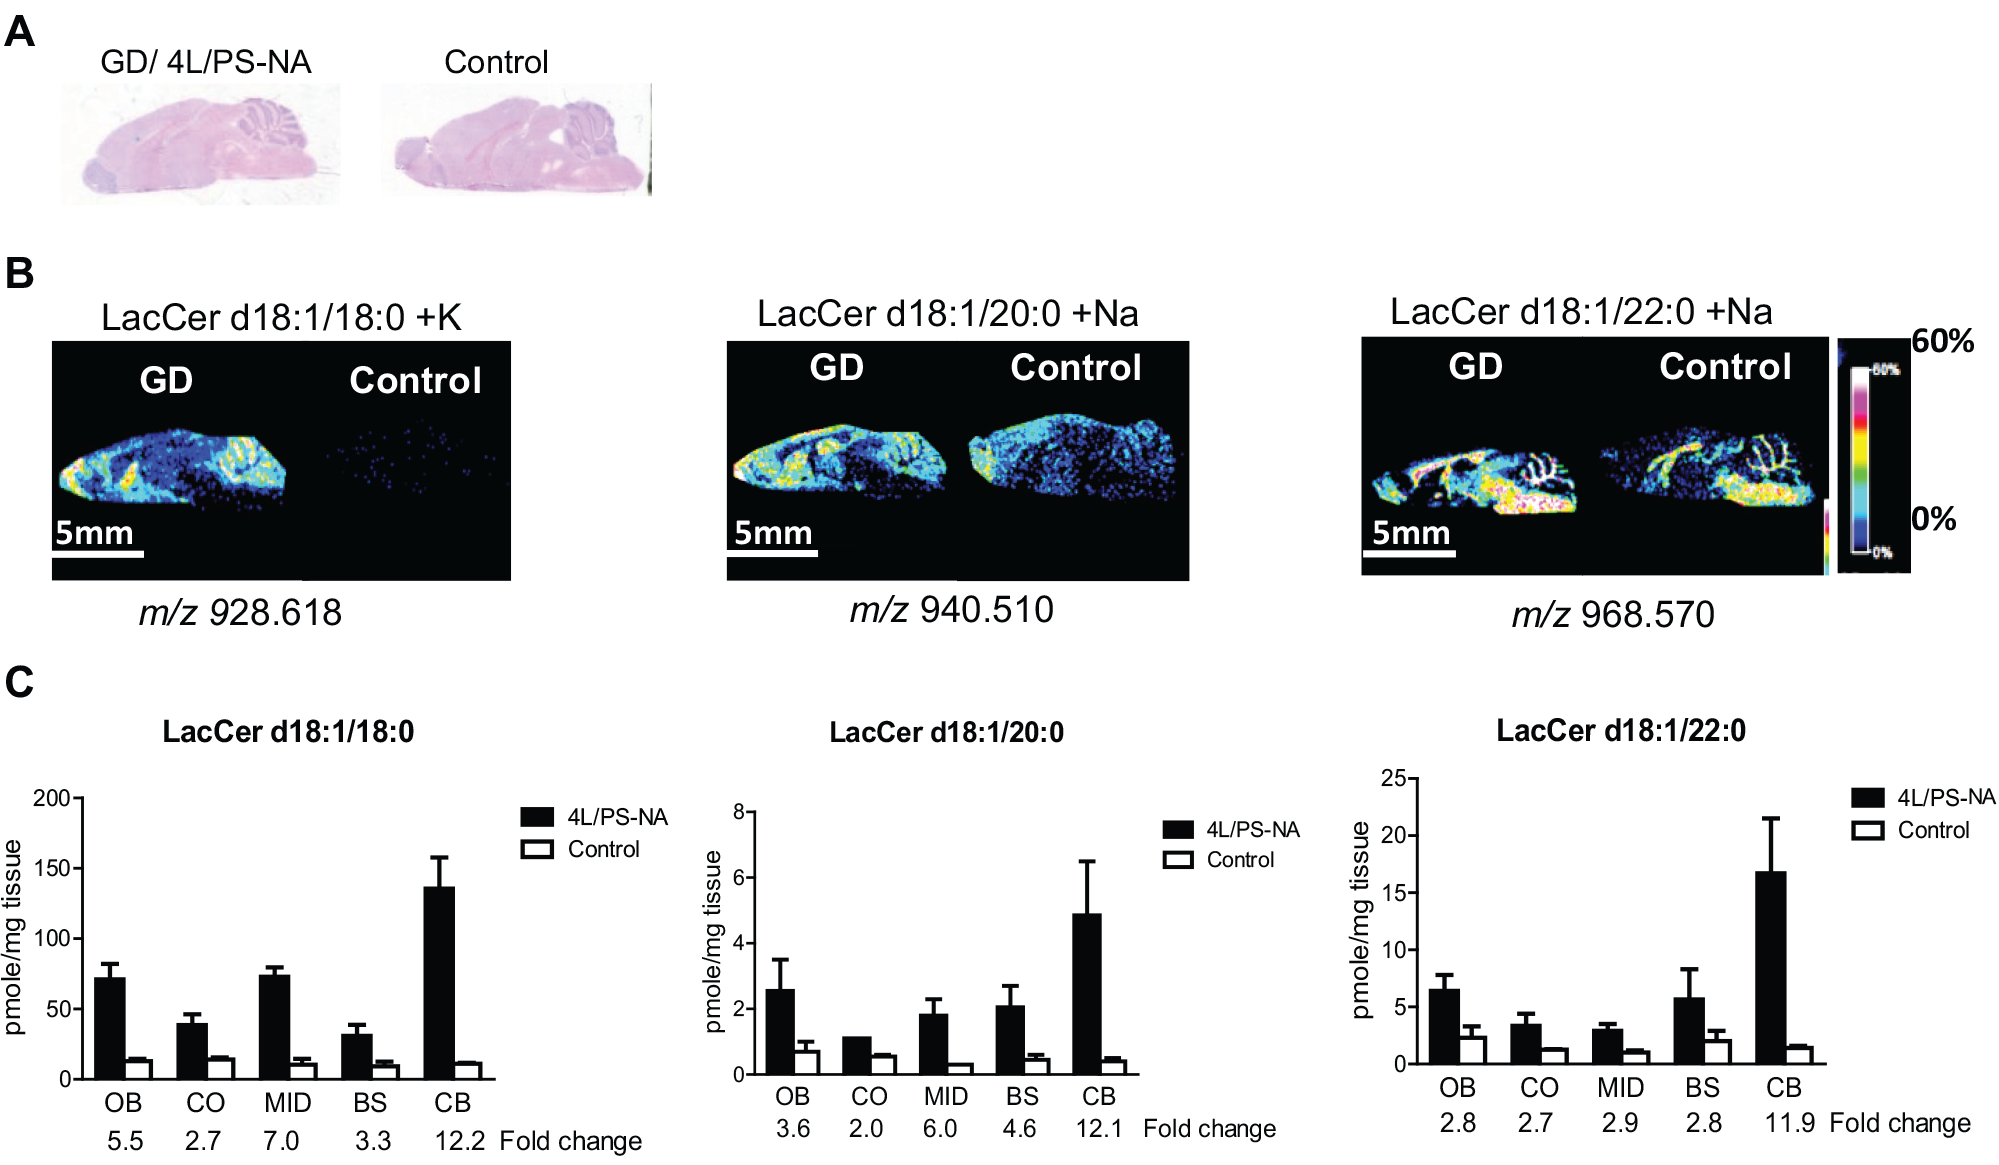
Spatial distribution of LacCer species using MALDI FTICR IMS and quantitation of LacCers by LC-ESI-MS/MS. (
Saposin B has an in vitro activation effect on sialidase for the degradation of ganglioside GM3. 30 Since the 4L/PS-NA mice have 45% lower levels of saposin B than the control mice, the effect of the sialidase on GM3 degradation, along with gangliosides GM1 and GM2, was assessed ( Suppl. Fig. S3 ). Among the detected gangliosides, the GM with a C18 fatty acyl chain length was the predominant species identified by LC-ESI-MS/MS. MALDI IMS data depict GM1 d18:1/18:0 distribution more in the OB than in other areas, whereas GM3 d18:1/16:0 and d18:1/18:0 accumulations were different across all four regions, which was consistent with LC-ESI-MS/MS results ( Suppl. Fig. S3 ). One of the potential issues for imaging gangliosides in tissue using MALDI MS is that sialic acid residues can be dissociated in the ionization process, 31 although this effect is less when using MALDI FTICR IMS. Discrepancies were observed in the identification and quantification of some of these complex GSLs. Saposin B also activates arylsulfatase A, the major enzyme responsible for the degradation of sulfatides. 30 Analyses of sulfatide levels by LC-ESI-MS/MS showed slight increases in the 4L/PS-NA brain and were more abundant in the MID and BS regions ( Suppl. Fig. S4 ). 32 MALDI FTICR IMS and LC-ESI-MS/MS also identified increased sulfatide d18:1/24:1 in the MID and BS regions of the 4L/PS-NA brain.
GD Mice Brain Pathology Associated with GSL Accumulation
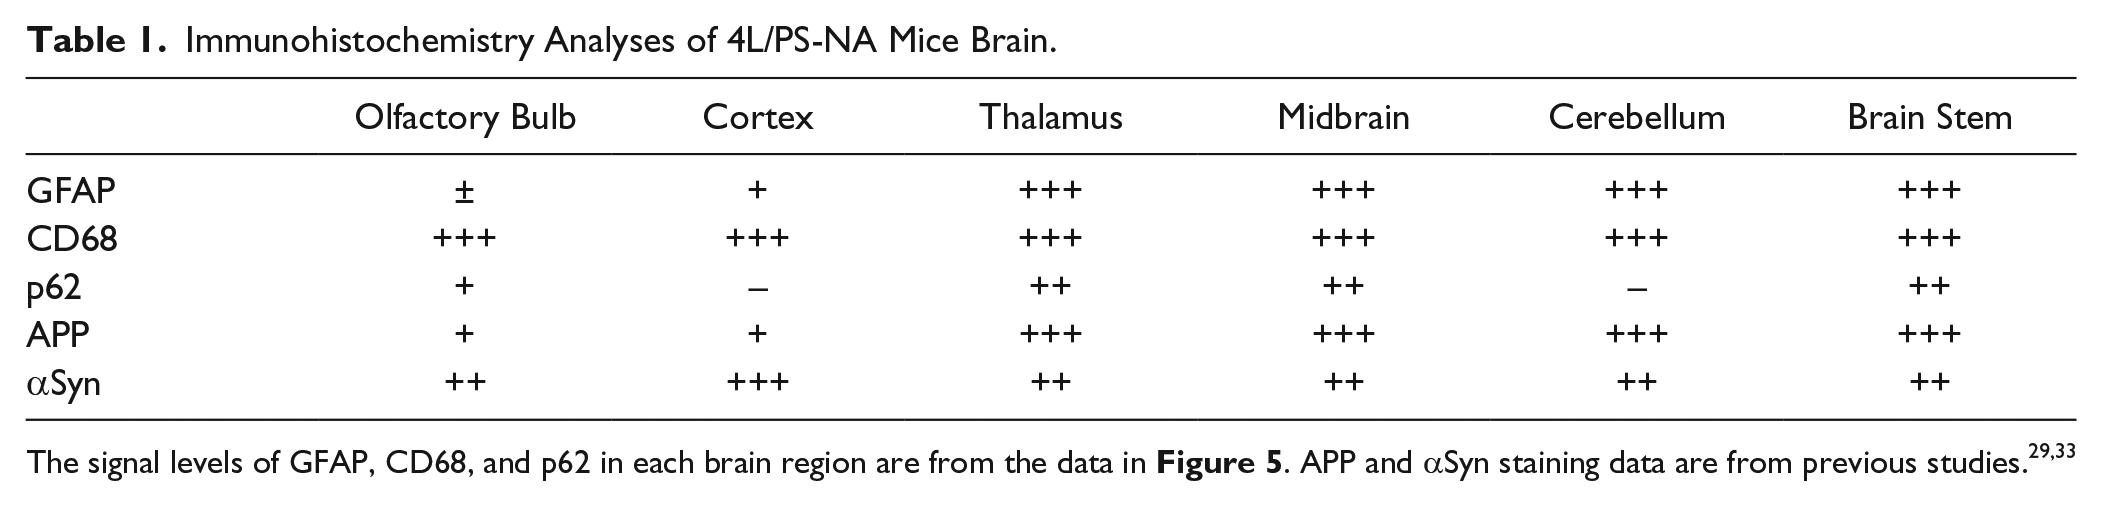
Brain pathology was assessed by immunohistochemistry using an anti-GFAP astrocyte marker, anti-CD68-activated microglial/macrophage marker, or p62 autophagy marker ( Fig. 5 ). Strong GFAP signals were detected predominantly in the thalamus within MID, BS, and CB regions of the 4L/PS-NA brain compared with the CO and OB of control mice and likely demonstrate astrogliosis indicative of inflammation ( Fig. 5B , C ). CD68-positive cells represent active microglials/macrophages, which were detected uniformly across the brain regions of 4L/PS-NA mice, signifying ubiquitous brain inflammation ( Fig. 5B , C ). p62 is an autophagosome marker, which, in comparison with the control mice, was elevated in the OB, MID, thalamus, and BS regions of the 4L/PS-NA mouse brains, suggesting enhanced autophagy occurring in these selected regions. Regional distributions of these pathological events are summarized in Table 1 . Enhanced amyloid precursor protein (APP), which is associated with Alzheimer’s disease, and αSyn accumulation, a pathological marker of Parkinson’s disease, are included and reflect data from 21-week-old 4L/PS-NA mice brains determined previously.29,33
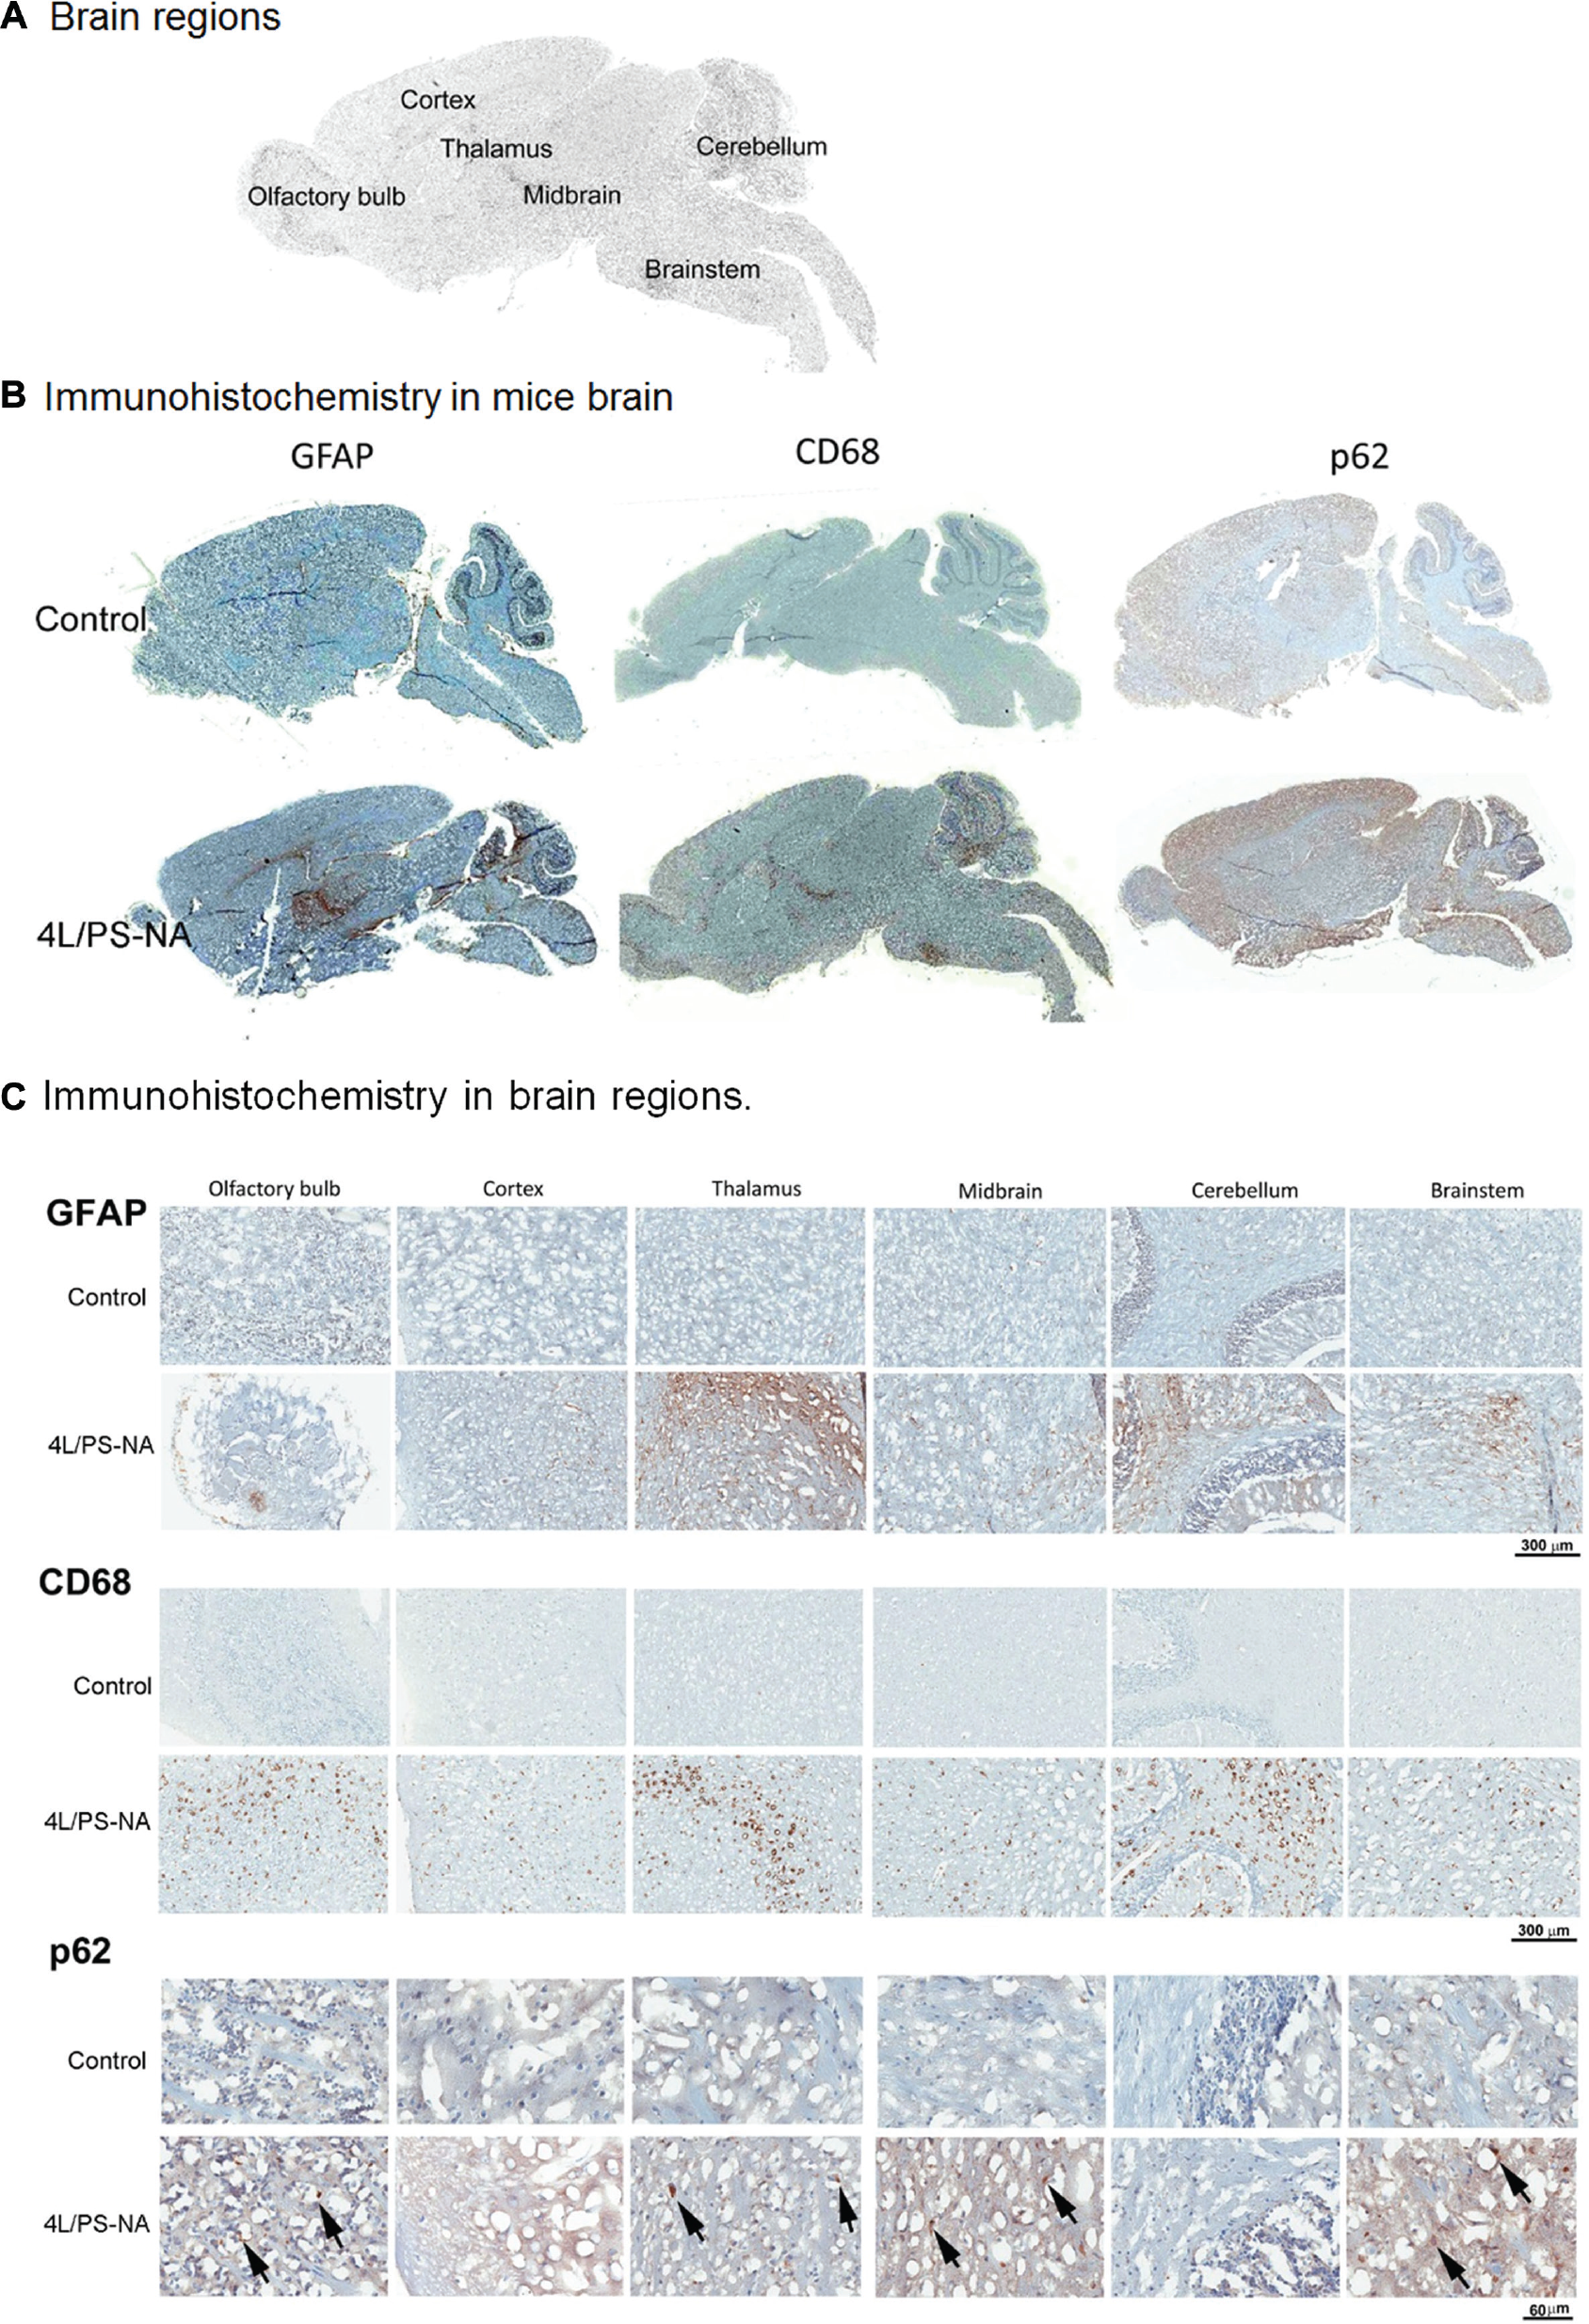
Brain pathology. (
Immunohistochemistry Analyses of 4L/PS-NA Mice Brain.
Discussion
HPLC MS/MS is the most widely used method for the quantification of GSL species in cells or tissues. Although this approach sufficiently quantifies the level of individual glycolipid species, without laborious tissue dissections, it is unable to offer localization information of an analyte of interest in relation to the tissue pathology. 16 MALDI IMS workflows provide analyte localization information and have been used previously to image GSL species in GD tissues; however, GD brains have never been assessed. 34 To gain spatial and quantitative information on GSL accumulation in CNS-involved GD brains, a feasibility study using both MALDI FTICR IMS and LC-ESI-MS/MS was utilized. Simultaneous analysis found the overall level of GluCer species to be almost four-fold higher in the brain of a mouse model of GD versus the control. Differential GluCer species distribution detected by MALDI FTICR IMS could then be correlated to brain disease pathology using immunohistochemistry. Several GluCer species had higher ion intensities in GD brains than in the control, which may be related to their precursors, ceramides that are produced by ceramide synthases (CerSs). 35 For example, six CerSs have been identified with different tissue expressions, which, except for CerS3, express in the CNS. 35 Each CerS has a preference for a defined fatty acid; for example, CerS1 synthesizes Cer d18:1/18:0. 36 CerS2 has specificity for Cer d18:1/22 and C24, and CerS2 mRNA expression is associated with white matter prevalent in BS and MID. 37 Our data for GluCer d18:1/18:0, GluCer d18:1/22, and C24 distribution in the 4L/PS-NA brain are consistent with the data for CerS1 and CerS2 mRNA distribution in the brain seen previously, suggesting that spatial changes in GluCer species in 4L/PS-NA brains may be associated with CerS1 and CerS2 expression and affect regional cellular functions underlying GD-associated brain disease.
Sulfatides, LacCers, and gangliosides were also assessed by both platforms. MALDI FTICR IMS identified differential signal intensities of these GSL species in the 4L/PS-NA brain, which was confirmed by LC-ESI-MS/MS. However, slight discrepancies were observed for gangliosides that might be due to the potential disassociation of sialic acid residues in the MALDI ionization process. 31 Elevation of the gangliosides has been reported previously in the liver and spleen of GD patients, and thus was not a surprising finding. However, immunohistochemistry revealed regional neuropathology (inflammation, autophagy, or defective protein degradation) in these regions, suggesting that the lipids potentiate distinct pathologies. 38 For example, whole-brain microglial activation determined by positive CD68 signals correlated predominantly with GluCer d18:1/18:0 accumulations across all brain regions. Since brain inflammation caused by lipid accumulation is universal in GSL storage diseases,39–41 it is likely that the accumulation of LacCers, gangoliosides, and sulfatides found in 4L/PS-NA brain leads to brain microglial activation. In the 4L/PS-NA brain, the thalamus and MID appear to be the most affected by defective protein degradation (APP and αSyn) and autophagy (p62). In addition to GluCer d18:1/18:0, long-chain GluCer species (d18:1/24:0) were distributed in this region as well, compared with other regions. It has recently been demonstrated that reduction of GCase substrate accumulation alleviates αSyn aggregation,11,15 and there is evidence that APP aggregation is associated with GluCer in 4L/PS-NA brains. 29 The cells in this region appear to be more vulnerable to the insults from those lipids, resulting in defective autophagosome and lysosomal functions of proper degradation of APP and αSyn. In addition, increased LacCers specifically in the CB ( Fig. 4 ) might have led to the degeneration of Purkinje cells observed in 4L/PS-NA mice. 24
Identification of accumulating GSL species with brain colocalization information as described herein is essential for understanding the pathological pathways of brain diseases. Using a combined LC-ESI-MS/MS and MALDI FTICR IMS approach helped us to define regional GSL species distribution in the context of brain pathology in a quick and robust manner, and has the potential to offer greater insight in future studies assessing a larger sample size. This type of workflow could be fortuitous in studies monitoring GSL species accumulation following the administration of GluCer synthase inhibitors or other molecules designed to knock down GSL synthesis. This could be particularly useful for neuropathic GD and other GSL storage diseases, such as metachromatic leukodystrophy affected by sulfatide storage, Sandhoff disease affected by GM2 accumulation,30,42 and Krabbe disease affected by GalCer accumulation. 43
Footnotes
Acknowledgements
The authors thank Venette Inskeep and Brian Quinn for technical assistance.
Supplementary material is available online with this article.
Declaration of Conflicting Interests
The authors declared no potential conflicts of interest with respect to the research, authorship, and/or publication of this article.
Funding
This work was supported by grants from the National Institutes of Health (R01 DK36729 to G.A.G. and R01 NS086134 in part to Y.S.) and a Cincinnati Children’s Hospital Medical Center RIP Award to Y.S. Partial support of these studies was from the South Carolina Centers of Economic Excellence SmartState Endowed Chair Program to R.R.D.
References
Supplementary Material
Please find the following supplemental material available below.
For Open Access articles published under a Creative Commons License, all supplemental material carries the same license as the article it is associated with.
For non-Open Access articles published, all supplemental material carries a non-exclusive license, and permission requests for re-use of supplemental material or any part of supplemental material shall be sent directly to the copyright owner as specified in the copyright notice associated with the article.