
Abstract
Tumor necrosis factor receptor 1 (TNFR1) is a transmembrane receptor that binds tumor necrosis factor or lymphotoxin-alpha and plays a critical role in regulating the inflammatory response. Upregulation of these ligands is associated with inflammatory and autoimmune diseases. Current treatments reduce symptoms by sequestering free ligands, but this can cause adverse side effects by unintentionally inhibiting ligand binding to off-target receptors. Hence, there is a need for new small molecules that specifically target the receptors, rather than the ligands. Here, we developed a TNFR1 FRET biosensor expressed in living cells to screen compounds from the NIH Clinical Collection. We used an innovative high-throughput fluorescence lifetime screening platform that has exquisite spatial and temporal resolution to identify two small-molecule compounds, zafirlukast and triclabendazole, that inhibit the TNFR1-induced IκBα degradation and NF-κB activation. Biochemical and computational docking methods were used to show that zafirlukast disrupts the interactions between TNFR1 pre-ligand assembly domain (PLAD), whereas triclabendazole acts allosterically. Importantly, neither compound inhibits ligand binding, proving for the first time that it is possible to inhibit receptor activation by targeting TNF receptor–receptor interactions. This strategy should be generally applicable to other members of the TNFR superfamily, as well as to oligomeric receptors in general.
Keywords
Introduction
Tumor necrosis factor receptor 1 (TNFR1) is a transmembrane receptor that regulates the inflammatory pathways. 1 Binding of tumor necrosis factor-alpha (TNF-α) or lymphotoxin-alpha (LT-α) to the extracellular domain (ECD) of TNFR1 leads to IκBα degradation and NF-κB activation. 2 Upregulation of these ligands has been associated with several inflammatory and autoimmune diseases, including rheumatoid arthritis (RA), juvenile RA, multiple sclerosis, Crohn’s disease, and inflammatory bowel disease. 3 Therapeutic targeting of TNFR1 signaling is a billion-dollar industry. Current treatments involve monoclonal antibodies (e.g., infliximab, golimumab, and adalimumab) that function by sequestering and blocking ligand binding. 4 Unfortunately, these anti-TNF drugs also inhibit ligand binding to related TNF receptors that are not involved in the disease condition. As such, current treatments can induce dangerous side effects, such as lupus-like disease and increased incidence of lymphoma.5,6 In order to overcome these limitations, there is a desperate need to develop new receptor-specific treatments that take advantage of recent breakthroughs regarding the structure and dynamics of the receptor itself.7,8
TNFR1 exists as ligand-independent, homophilic dimers that are stabilized by the extracellular pre-ligand assembly domain (PLAD).9,10 The PLAD is structurally distinct from the ligand-binding domain, and mutational analysis of the PLAD has shown the importance of receptor preassembly in signaling.10,11 As a consequence, competitively blocking pre-ligand receptor dimerization via the PLAD has been considered a potential therapeutic target. Suggestively, the isolated, soluble PLAD of TNFR1 was shown to inhibit TNF-α-induced inflammatory signaling in vitro and to ameliorate arthritis in a mouse model. 12 In that study, the PLAD molecule (which was glutathione S-transferase [GST] tagged) ablated ligand binding, making it impossible to determine whether the small protein was targeting its intended site and, in fact, disrupting the dimer. Therefore, there remains no direct or unambiguous evidence in the literature that inhibition of receptor–receptor interactions is a viable targeting strategy for TNFR inhibition.
In the current study, our goal was to establish a small-molecule approach that ablates receptor–receptor interactions, or alters receptor conformational dynamics, without interrupting ligand binding ( Fig. 1 ). We used an innovative time-resolved fluorescence resonance energy transfer (TR-FRET)–based strategy, which combines fluorescent biosensor engineering and fluorescence lifetime measurements in a high-throughput screening (HTS) platform to identify small-molecule inhibitors of TNFR1 signaling. The screen was enabled by the first truly high-throughput fluorescence lifetime plate reader, which increases the speed of lifetime detection by a factor of 105 and the precision of FRET-based screening by a factor of 30. 13 This extra precision, enabling reliable detection of protein structural changes of 1Å, is particularly powerful for the detection of allosteric regulation of receptors by small molecules. By using this strategy, we found two small-molecule compounds that inhibit TNFR1-induced IκBα degradation and NF-κB activation. As such, the results of our study should not only impact TNFR research, but also have a very broad impact on drug discovery efforts wherever protein–protein interactions are targeted.
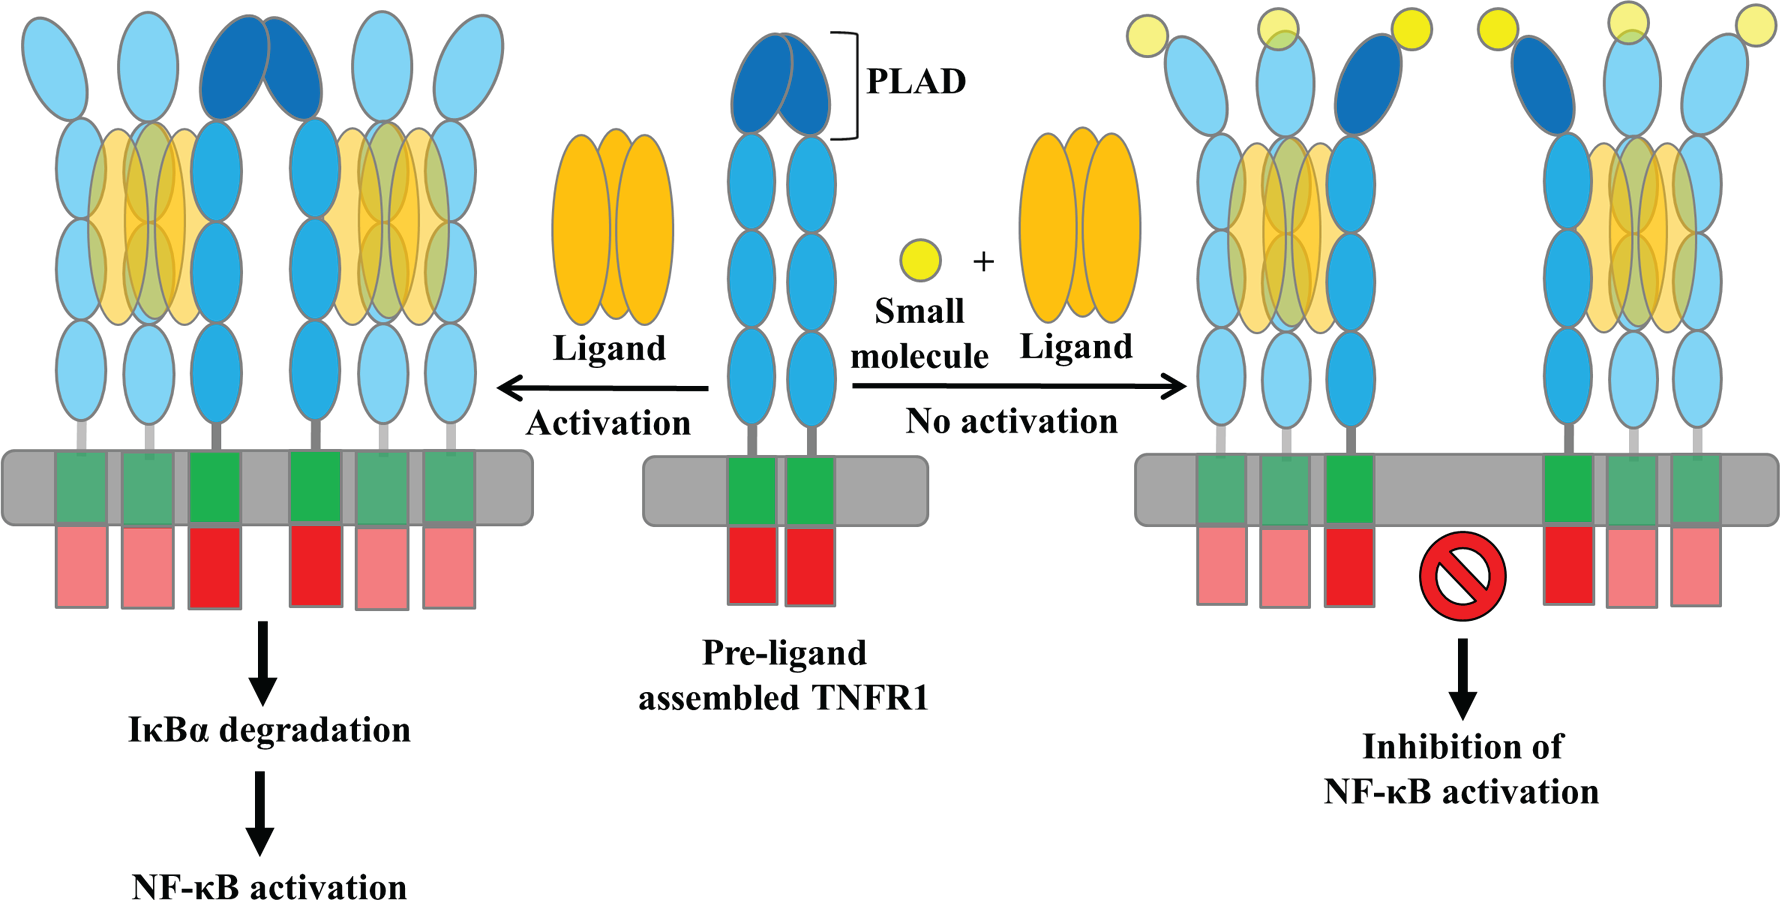
Inhibition of TNFR1 signaling by small molecules targeting receptor–receptor interactions. Small molecules could inhibit ligand-induced NF-κB activation by targeting TNFR1 PLAD and disrupting the receptor–receptor interactions without affecting ligand binding.
Materials and Methods
Molecular Biology
To generate TNFR1ΔCD-GFP and TNFR1ΔCD-RFP, cDNAs encoding truncated TNFR1ΔCD (amino acids 1–242) were fused to the N-terminus of the EGFP and TagRFP vectors using standard cloning techniques. For photobleaching FRET assays, TNFR1ΔCD was inserted at the N-terminus of the pEYFP-N1 and pECFP-N1 vectors. All mutations were introduced by Quikchange mutagenesis (Agilent Technologies, Santa Clara, CA) and sequenced for confirmation. All vectors contain the monomeric mutation A206K to the fluorescent proteins, preventing constitutive fluorophore clustering. 14
Cell Culture and Generation of Stable Cell Lines
Human embryonic kidney cells 293 (HEK293, American Type Culture Collection [ATCC], Manassas, VA) were cultured in phenol red–free Dulbecco’s modified Eagle’s medium (DMEM) (Gibco, Waltham, MA) supplemented with 2 mM
Flow Cytometry
Homogeneous expression of the TNFR1ΔCD-FRET pair stable cells was determined by flow cytometry performed with FACSAria II (BD Biosciences, San Jose, CA) with a green fluorescent protein (GFP) laser (488 nm) at 250 V and a red fluorescent protein (RFP) laser (561 nm) at 500 V. HEK293 cells stably expressing the TNFR1ΔCD-FRET pair were harvested from a six-well plate by detaching cells with TrypLE (Invitrogen) and washing three times with phosphate-buffered solution (PBS, Thermo Fisher Scientific) by centrifugation at 300g. Next, cells were passed through a polystyrene round-bottom tube with a cell-strainer cap (BD Falcon). Data were analyzed by single-cell analysis software (FlowJo, LLC).
Fluorescence Microscopy
Localization of the TNFR1ΔCD-FRET pair on plasma membranes of stable cells was determined by confocal fluorescence microscopy (ATCC). Images were taken in glass-bottom chambered coverslips (Matek Corporation, Ashland, MA) using an Olympus IX2 inverted confocal fluorescence microscope equipped with a FluoView FV1000 laser scanning confocal head and 60× (1.42NA) oil immersion objective lenses. Excitation was accomplished with laser illumination at 488 nm for GFP and 561 nm for RFP.
Preparation of Cells for FRET Measurements and Specificity of TNFR1 Biosensor
TNFR1ΔCD-FRET pair stable cells were cultured in a 225 cm2 flask (Corning, Corning, NY). On the day of measurement, cells were harvested by incubating with TrypLE (Invitrogen) for 5 min, washed three times with PBS by centrifugation at 300g, filtered using 70 µm of cell strainers (BD Falcon), and resuspended in PBS at a concentration of 1 million cells/mL using an automated cell counter (Countess, Invitrogen). For lifetime measurements, cells were dispensed (50 μL/well) into a 384-well plate (PN 781209, Greiner Bio-One, Monroe, NC) by a Multidrop Combi Reagent Dispenser (Thermo Fisher Scientific). Binding specificity of the TNFR1ΔCD-FRET pair was tested by transiently transfecting (Lipofectamine 3000, Invitrogen) stable cells with full-length unlabeled death receptor 5 (DR5) (440 amino acids) and full-length unlabeled TNFR1 (455 amino acids). Two days after transfection, cells were harvested and prepared as above for fluorescence lifetime measurements. For comparison between the control and the treated samples, an unpaired t test was used to validate statistical differences.
Fluorescence Data Acquisition
Fluorescence lifetime measurements were carried out by a prototype fluorescence lifetime plate reader (Fluorescence Innovations, Inc., Minneapolis, MN).13,15–17 GFP fluorescence was excited with a 473 nm microchip laser from Concepts Research Corporation (Belgium, WI), and emission was filtered with 488 nm long pass and 517/20 nm band pass filters (Semrock, Rochester, NY).13,18 This instrument enables high-throughput fluorescence lifetime detection at high precision by utilizing a unique direct-waveform recording technology. 19 The performance of this fluorescence lifetime plate reader has been previously demonstrated with FRET-based HTS that targets SERCA and the ryanodine receptor.13,15–17
Pilot Screening with NIH Clinical Collection Library
The NIH Clinical Collection (NCC) library containing 446 compounds was purchased from Evotec (Hamburg, Germany), formatted into 96-well mother plates using an FX liquid dispenser, and subsequently formatted across two 384-well plates at 50 nL (10 µM final concentration/well) using an Echo liquid dispenser. DMSO (matching %v/v) was loaded as in-plate no-compound controls, as well as in columns 1, 2, 23, and 24 (negative controls). The 384-well flat, black-bottom polypropylene plates (PN 781209, Greiner Bio-One) were selected as the assay plates for their low autofluorescence and low interwell cross talk. The plates were sealed and stored at −20 °C until use.
Three days prior to screening, stable TNFR1ΔCD-GFP (donor only control) or TNFR1-GFP/RFP (TNFR1ΔCD-FRET pair) cells were expanded in five 225 cm2 flasks (Corning). On each day of screening, the compound plates were equilibrated to room temperature (25 °C). The cells were harvested from the 225 cm2 flasks by incubating with TrypLE (Invitrogen) for 5 min, washed three times in PBS by centrifugation at 300g and filtered using 70 µm cell strainers (BD Falcon). Cell viability was assessed using trypan blue assay with viability above 95% and diluted to 1 million cells/mL using an automated cell counter (Countess, Invitrogen). Expression of TNFR1ΔCD-GFP and TNFR1-GFP/RFP (TNFR1ΔCD-FRET pair) in stable cells was confirmed by flow cytometry to be above 95% prior to each screen. After resuspension and dilution in PBS, the stable cells were constantly and gently stirred using a magnetic stir bar at room temperature, keeping the cells in suspension and evenly distributed to avoid clumping. During screening, cells (50 μL/well) were dispensed by a Multidrop Combi Reagent Dispenser (Thermo Fisher Scientific) into the 384-well assay plates containing the compounds and allowed to incubate at room temperature for 20 min before readings were taken by the fluorescence lifetime plate reader (Fluorescence Innovations).
HTS Data Analysis
TR fluorescence waveforms for each well were fitted to single-exponential decays using least-squares minimization global analysis software (Fluorescence Innovations) to give donor lifetime (τ D ) and donor–acceptor lifetime (τ DA ). FRET efficiency (E) was then calculated based on eq 1:
Assay quality was determined with NCC hits as positive controls and DMSO as negative controls and calculated based on eq 2: 20
where σ p and σ n are the standard deviations (SDs) and µ p and µ n are the means of the positive and negative controls, respectively.
FRET data from four independent NCC screens were collected and averaged. Fluorescent compounds were flagged as potential false positives due to interference from compound fluorescence by the spectral recording method based on the assessment of the similarity index of each well from the pilot NCC screens. 16 A t test was performed on the data, and the left and right 5% tails were classified as outliers and removed. After removal of fluorescent compounds, a histogram of the average FRET distribution from all compounds in the screens was plotted and fitted to a Gaussian curve to obtain a mean and SD. A hit was defined as a compound that changed the average FRET efficiency by more than four times the standard deviation (4SD) relative to the mean.
FRET Dose–Response Assay
The hit compounds, triclabendazole (PubChem CID: 50248) and zafirlukast (PubChem CID: 5717), were purchased (AK Scientific, Inc., Palo Alto, CA). These drug compounds were dissolved in DMSO to make 10 mM stock solution and diluted into 50× concentrations, which were then subsequently serially diluted in 96-well mother plates. Hits were screened at nine different concentrations (0.1–200 μM). Compounds (1 μL) were transferred from the mother plates into assay plates using a Mosquito HV liquid handler (TTP Labtech Ltd., Hertfordshire, UK). The same procedure of cell culture and dispensing as for the pilot screening was applied in the FRET dose–response assays.
IκBα Degradation Assay
HEK293 cells were cultured in a 150 cm2 flask (Corning) for 3 days and dispensed into two six-well plates at 1.5 million cells/well and incubated overnight before treating with drugs. The next day, cells were treated with DMSO (negative control) and respective doses of drug compounds (0.1–200 µM) for 2 h, followed by 30 min of LT-α (100 ng/mL) or TNF-α (1 ng/mL) (210-TA-005, R&D Systems, Minneapolis, MN) treatment at 37 °C. Cells were lysed for 30 min on ice with radioimmunoprecipitation assay (RIPA) lysis buffer (Pierce RIPA buffer, Thermo Fisher Scientific) containing 1% protease inhibitor (Clontech, Mountain View, CA) and centrifuged at 15,000g at 4 °C for 30 min. The total protein concentration of lysates was determined by bicinchoninic acid (BCA) assay (Pierce), and equal amounts of total protein (60 μg) were mixed with 4× Bio-Rad sample buffer and boiled for 3–5 min, and loaded on 4%–15% Tris-glycine sodium dodecyl sulfate–polyacrylamide gel electrophoresis (SDS-PAGE) gels (Bio-Rad, Hercules, CA). Proteins were transferred to polyvinylidene fluoride (PVDF) membrane (Immobilon-FL, EMD Millipore, Billerica, MA) and probed using antibodies against IκBα (44D4, Cell Signaling Technology, Danvers, MA) and β-actin (ab8227, Abcam, Cambridge, MA). Blots were quantified on the Odyssey scanner, and densitometric analysis was carried by the Image Studio (LI-COR Biosciences, Lincoln, NE).
NF-κB Luciferase Reporter Gene Assay
HEK293 cells were transfected with the NF-κB–luciferase reporter genes in a 100 mm plate with Lipofectamine 3000 (Invitrogen). On the following day, cells were lifted with TrypLE and resuspended in phenol red–free DMEM (Gibco). These cells were dispensed in 96-well (30,000 cells/well) white, solid-bottom plates (Greiner Bio-One North America) and incubated with drugs (0.1–200 µM) or DMSO (negative control) in the presence (100 ng/mL) and absence of LT-α for 18 h at 37 °C. After incubation, 50 µL of Dual-Glo Luciferase Reagent (Promega, Madison, WI) was added and incubated at room temperature for 15 min, and firefly luminescence was measured using a Cytation 3 Cell Imaging Multi-Mode Reader luminometer (BioTek, Winooski, VT). Next, 50 µL of Dual-Glo Stop & Glo Reagent (Promega) was added and incubated at room temperature for 15 min, and Renilla luminescence was measured using a luminometer.
Overexpression and Purification of Recombinant Proteins
The N-terminal FLAG-tagged LT-α and FLAG-tagged TNFR1 PLAD (residues 30–82) were overexpressed using the pT7-FLAG-1-inducible expression system in Escherichia coli and purified by an anti-FLAG affinity column (M2 anti-FLAG affinity agarose resin, Sigma-Aldrich, St. Louis, MO). The purity of the proteins was assessed by 4%–15% SDS-PAGE gels (Bio-Rad) under reducing conditions, followed by Coomassie staining. Protein concentrations were measured using the BCA assay (Thermo Fisher Scientific).
Coimmunoprecipitation
Anti-FLAG magnetic beads were mixed with soluble FLAG-tagged LT-α and incubated for 2–4 h at 4 °C. The unbound FLAG-tagged LT-α were then removed by washing the beads with wash buffer (150 mM NaCl, 50 mM Tris, 10% glycerol, pH 7.5). HEK293 and transiently transfected cells were washed three times with ice-cold PBS before lysis with immunoprecipitation (IP) buffer (20 mM Tris-HCl, 1 mM EDTA, 100 mM NaCl, pH 7.5, and 0.5% NP-40) containing a complete protease inhibitor cocktail (Roche, Basel, Switzerland). Subsequently, cells were sonicated for 30 s, incubated for 15 min on ice, and centrifuged at 16,000g for 30 min at 4 °C. Next, the supernatant was transferred to a tube containing magnetic beads coated with anti-FLAG antibody bound to FLAG-tagged LT-α. The tube was rotated for 4 h at 4 °C, followed by three washes with IP buffer. Immunoprecipitate samples and whole-cell lysates were resolved using 4%–15% SDS-PAGE gels and subjected to Western blotting using FLAG (2044S, Cell Signaling Technology) and TNFR1 (Ab19139, Abcam) antibodies.
Analytical SEC and Native Characterization of Proteins
Analytical size-exclusion chromatography (SEC) was used to detect the oligomeric states of soluble PLAD. SEC experiments were performed using the BioLogic DuoFlow Chromatography System (Bio-Rad) with a Superose-12 10/300 GL column (GE Life Sciences, Pittsburgh, PA) with detection at 280 nm and a 0.5 mL/min flow rate. The SEC column was calibrated with a protein standard mix (69385, Sigma-Aldrich). Purified soluble PLAD and LT-α were accessed by native-PAGE gels (Bio-Rad) in the absence and presence of DMSO and hit compounds (200 µM) under nonreducing conditions, followed by Coomassie staining.
Photobleaching FRET Assay
HEK293 cells were transiently transfected using the calcium phosphate method with 0.5 μg of pECFP-TNFR1ΔCD and 1.5 μg of pEYFP-TNFR1ΔCD in a 12-well plate. The following day, cells were lifted with TrypLE, resuspended in phenol red–free DMEM, and plated on poly-
Molecular Dynamics and Computational Docking
For analysis of the TNFR1 dimer interface residues, visual molecular dynamics (VMD) was used. For computational docking, the structure preparation of TNFR1 monomers, dimers, and NCC compounds was done in MOE 2015.1001 (Chemical Computing Group, Inc., Montreal, Quebec).
TNFR1 monomer: The protein structure of TNFR1 was downloaded from the Protein Data Bank (PDB: 1NCF). 9 The water molecules and chain B were removed before chain A was prepared using the Structure Preparation application of MOE.
TNFR1 dimer: The same procedure was followed to prepare the dimer, except that only the water molecules were removed.
NCC compounds: The 446 compounds from the NCC were downloaded (Evotec), and the compounds were prepared by the Database Wash program in MOE. Subsequently, the compounds were subjected to energy minimization using the Energy Minimize application of MOE with an MMFF94s force field until the gradient of 0.05 rms kcal/(mol.Å2) was met.
The molecular docking simulation was done using the Dock application of MOE.
Docking on chain A: The PLAD residues (i.e., residues 12–53 in 1NCF) were specified as the docking site. NCC compounds were docked individually into the PLAD region of 1NCF chain A using the rigid receptor protocol of MOE Dock.22,23 Initially, 10,000 poses were generated by the Triangle Matcher method and scored by London dG. The top 1000 docked poses from the initial scoring moved on to the next refinement stage, where poses were scored and ranked using GBVI/WSA, 22 a force field–based scoring function that estimates the free energy of binding of the ligand from a given pose. It should be noted that lower or more negative scores indicate more favorable poses. Only the top 100 poses were considered in the subsequent statistical analysis.
Docking on dimer: The same docking procedure was followed except
1. The prepared TNFR1 dimer was used.
2. The PLAD residues on both chains were specified as the docking site.
For statistical analysis, a MATLAB (MathWorks, Inc., Natick, MA) script was written to calculate the Boltzmann-weighted scores by multiplying the probability of contacting a given residue by the mean Boltzmann-weighted predicted free energy for each pose contacting that residue:
Results
TNFR1ΔCD FRET Biosensor and Fluorescence Lifetime Technology as HTS Platform
To develop a HTS platform that can detect small-molecule modulation of TNFR1 receptor–receptor interactions, we engineered a TNFR1ΔCD FRET biosensor expressed in living cells. We used HEK293 cells stably expressing TNFR1ΔCD fused to GFP or RFP (TNFR1ΔCD-FRET pair) ( Fig. 2A ) to identify small molecules that inhibit the endogenous TNFR1-TNFR1 interaction. Homogeneity of the TNFR1ΔCD-FRET pair on the plasma membrane was determined by flow cytometry and confocal microscopy. Flow cytometry analysis showed extremely low background with a 97% induction of TNFR1ΔCD-FRET pair, which suggested that most of the stable cells were capable of being used in HTS to identify compounds that modulate TNFR1 interactions ( Fig. 2B ). Confocal images showed that the receptors were evenly distributed on the cell membrane ( Fig. 2C ). We then tested the functionality of the TNFR1ΔCD-FRET pair by measuring FRET efficiency. Lifetime measurements showed a substantial decrease in the donor fluorescence lifetime in the presence of the acceptor compared with the donor only, which indicated efficient FRET ( Fig. 2D ), and recapitulates the known ligand-independent association of TNFR1 receptors. 9 As there is no known positive control that targets TNFR1 receptor–receptor interactions, we transfected the stable cells with either unlabeled-TNFR1 or DR5 (negative control) to confirm that the measured FRET was specific to TNFR1-TNFR1 interactions and could be modulated. DR5 caused no significant FRET change, but TNFR1 showed a significant decrease in FRET, indicating that TNFR1 interactions were specific and not affected by other superfamily members ( Fig. 2E ). This established the lifetime-based FRET detection with TNFR1ΔCD-FRET pair stable cells as a powerful platform for the identification of compounds that modulate TNFR1 receptor–receptor interactions.
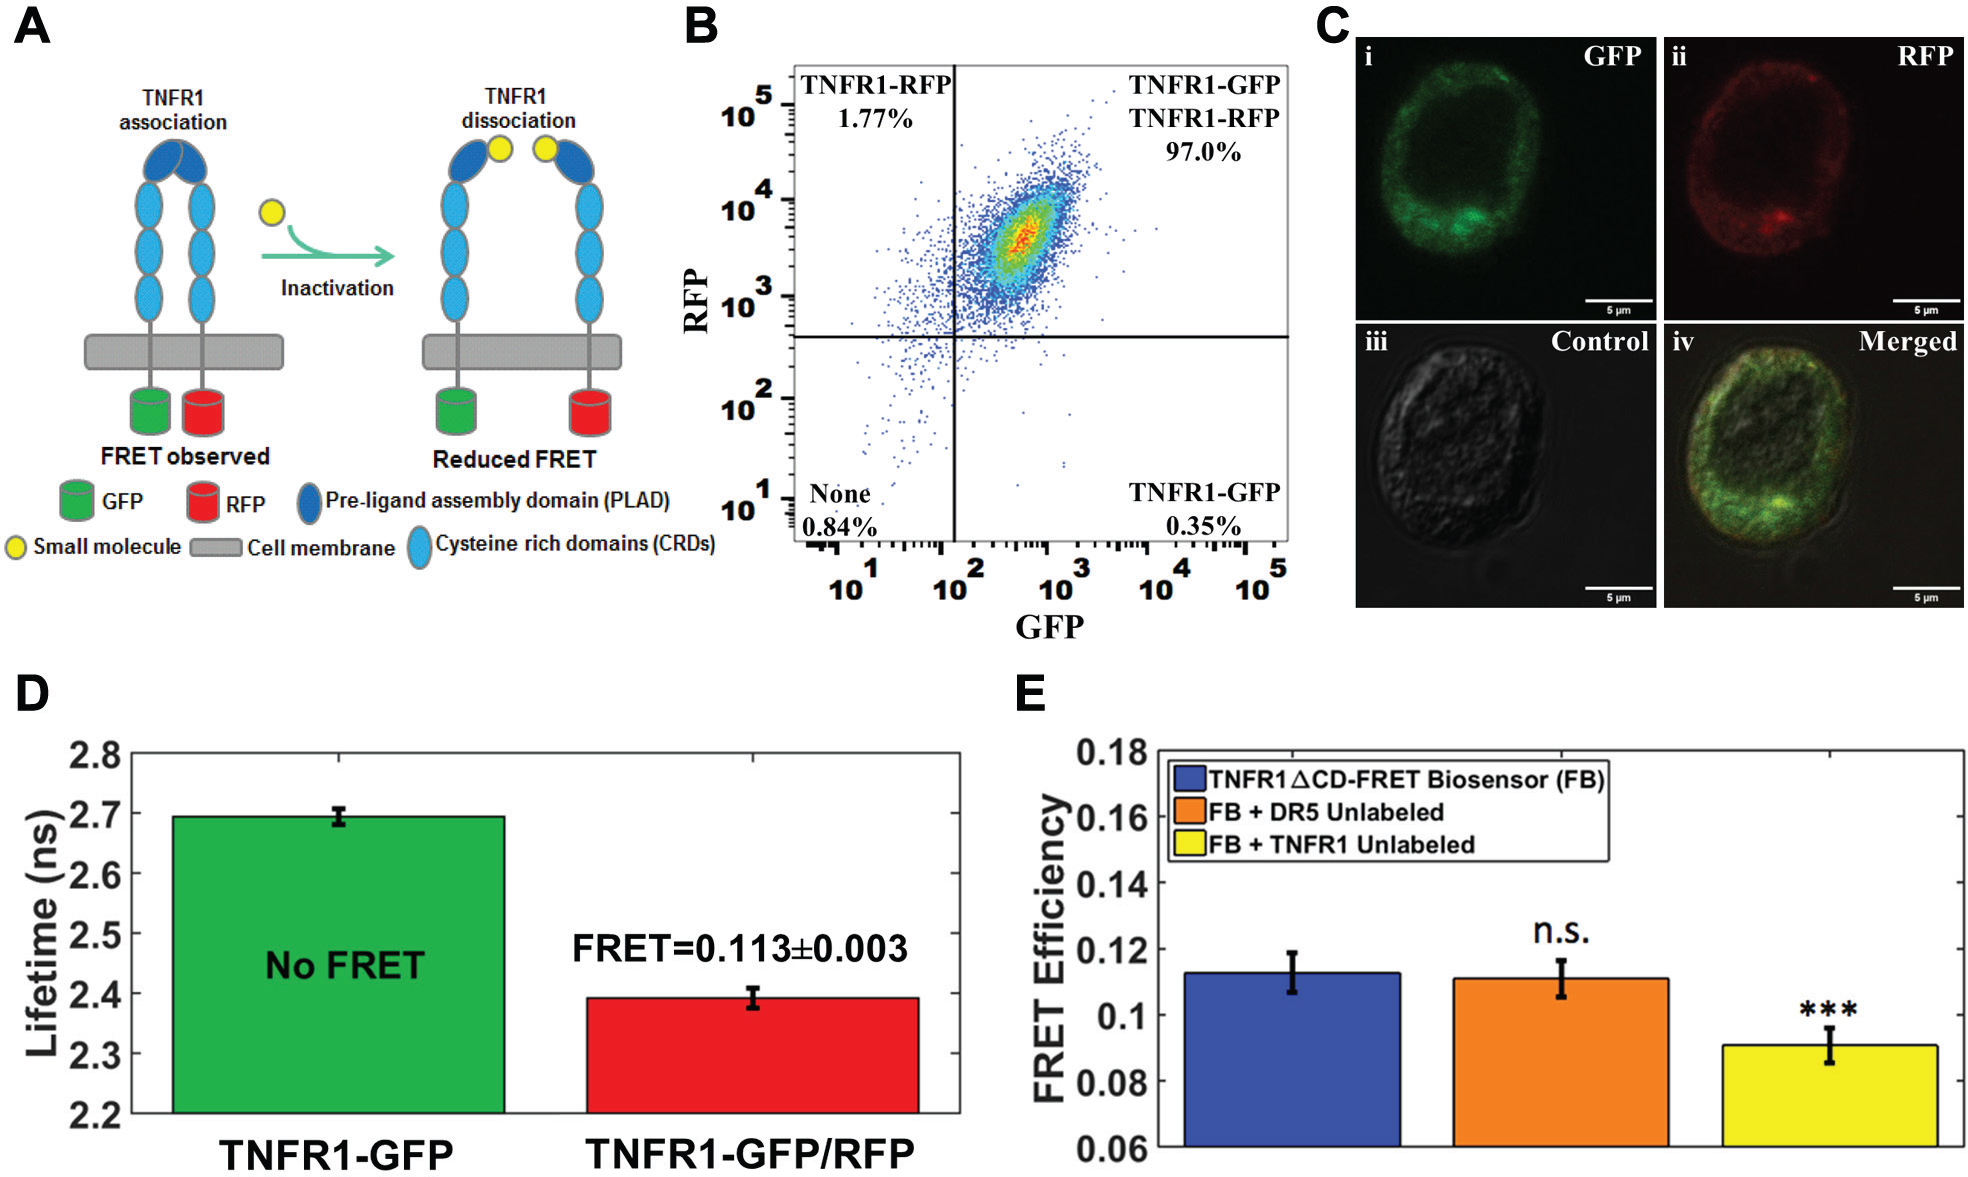
TNFR1ΔCD FRET biosensor and fluorescence lifetime technology as HTS platform. (
High-Throughput Screening of NCC Library to Identify Compounds That Modulate TNFR1 Receptor–Receptor Interactions
Using the TNFR1ΔCD-FRET pair stable cells, we performed HTS of the NCC (446 bioactive compounds) to identify compounds that disrupt endogenous TNFR1 receptor–receptor interactions. The NCC library is a collection of small molecules that have been previously tested in clinical trials, and therefore have known safety profiles. These compounds can provide excellent starting points for medicinal chemistry optimization, and may even be appropriate for direct human use in new disease areas. After an initial quality control check of the stable cell lines expressing the TNFR1 biosensor on each day of screening (signal level and coefficient of variance), the cells were dispensed into the drug plates and incubated with the compounds or DMSO control wells. A single-exponential fit was used to obtain the lifetime from the cell line expressing TNFR1ΔCD-FRET pair (τDA) and from the TNFR1ΔCD-GFP donor-only control cell line (τD) to determine FRET efficiency (eq 1). The fluorescence lifetime measurement is prone to interference from fluorescent compounds, so a stringent fluorescent compound filter was used to flag 26 compounds as potential false positives due to interference from compound fluorescence. 16 This filter did not change significantly the mean or SD of the histogram ( Fig. 3A , B ). FRET efficiencies from all compounds that passed the fluorescent compound filter were averaged from four independent NCC screens. A histogram of the average FRET distribution from these compounds was plotted and fitted to a Gaussian curve to obtain a mean and SD ( Fig. 3A , B ). Two hits from the library, zafirlukast (PubChem CID: 5717) and triclabendazole (PubChem CID: 50248), were identified to decrease the average FRET by more than 4SD greater than the mean of the control cells ( Fig. 3A ). In addition, each NCC screen was analyzed independently, with two to eight hits being identified. Zafirlukast and triclabendazole were discovered to be reproducible hits in three or more of the four screens ( Fig. 3C ). Both compounds decreased FRET efficiency in a dose-dependent manner ( Fig. 3D ), with half-maximal effects at relative EC50 values of 15 μM (triclabendazole) and 18 μM (zafirlukast). To calculate Z′ (eq 2) for this assay, these two hits with maximum changes of FRET of 0.038 (triclabendazole) and 0.055 (zafirlukast) were used as positive controls, and DMSO was used as the negative control. Using the latter value from zafirlukast in the Z′ calculation (eq 2), we obtain a value of Z′ = 0.521 ± 0.014, which indicates excellent assay quality. 20 This value of Z′ is likely to increase, indicating even better assay quality, once a larger library is screened, since better positive controls are likely to be discovered, increasing the signal window, (µ p – µ n ) in eq 2. 20
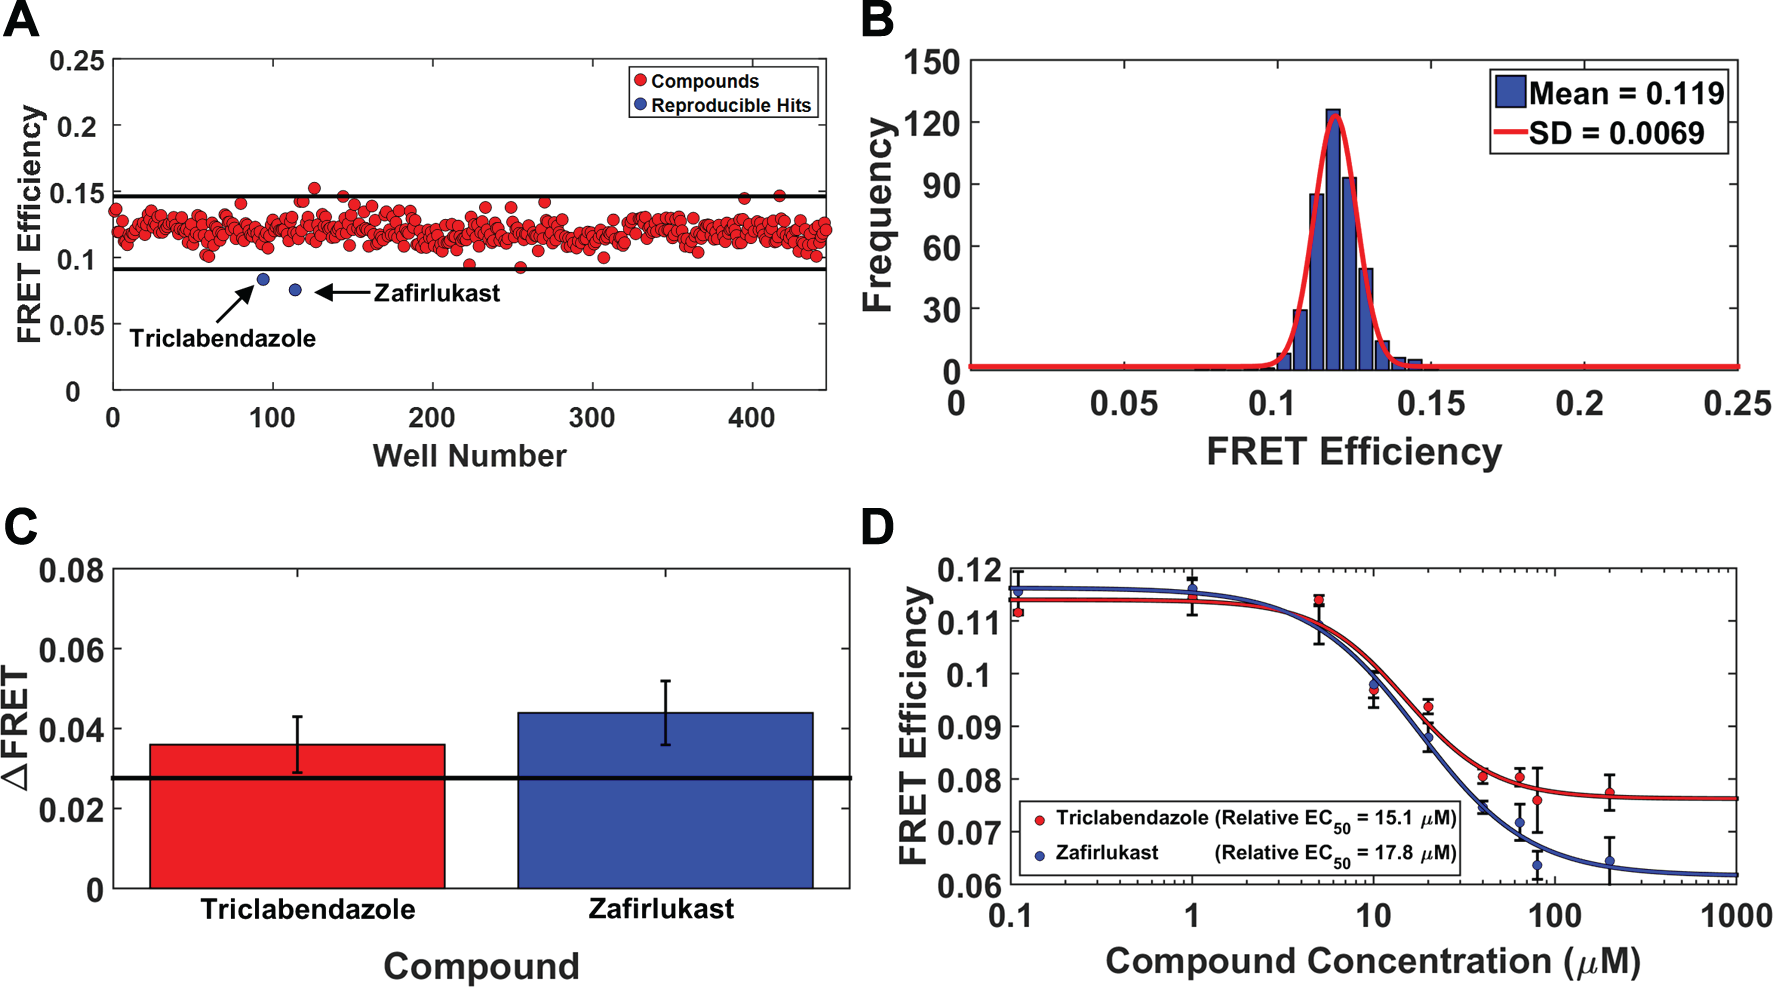
TR-FRET-based HTS of NCC library for compounds that inhibit TNFR1 receptor–receptor interactions. (
Remarkably, both of these compounds—which were blindly identified in our screen—have been shown to play a role in NF-κB inhibition through the TNFR1-induced pathway, 24 but no molecular mechanisms to explain their impacts have been explored. Zafirlukast is an FDA-approved inflammatory mediator that has been used for the treatment of asthma in adults. 25 In addition, zafirlukast is effective as an anti-inflammatory agent in the treatment of adults with cystic fibrosis 26 —a disease in which TNF-α has been implicated 27 —as well as in patients with autoimmune chronic urticaria. 28 On the other hand, triclabendazole is a member of the benzimidazole family of anthelmintics that displays high efficacy against helminthiasis in both immature and adult live flukes, especially related to hermaphroditic trematondes known as Clonorchis sinensis. 29 C. sinensis can cause an inflammatory response that induces the likelihood of forming cholangiocarcinoma. 30
Cell-Based Assays to Determine the Biological Activity and Efficacy of Hit Compounds
The effect of triclabendazole and zafirlukast on ligand-induced IκBα degradation and NF-κB activation was determined by immunoblotting and cell-based assays. Potency measurements showed an absolute inhibitory concentration (absolute IC50) of 67 μM (triclabendazole) and 114 μM (zafirlukast) for inhibiting LT-α-mediated IκBα degradation in HEK293 cells ( Fig. 4A , B ). Similarly, both compounds inhibited LT-α-mediated NF-κB activation in a dose-dependent manner, with an absolute IC50 of 55 μM (triclabendazole) and 50 μM (zafirlukast) ( Fig. 4C ). The partial inhibition by zafirlukast could be due to NF-κB activation being further downstream in the signaling pathway, as well as influence from biological cross talk. 31 Similar results were observed from an IκBα degradation assay with TNF-α-treated cells ( Fig. 4D ), indicating that triclabendazole and zafirlukast are inhibiting TNFR1 function. For the functional assays, we calculated Z′ (eq 2) by using the maximum inhibition of the two hits as positive controls and DMSO as a negative control in each assay. The Z′ values obtained were more than 0.5 for both hits in each assay.
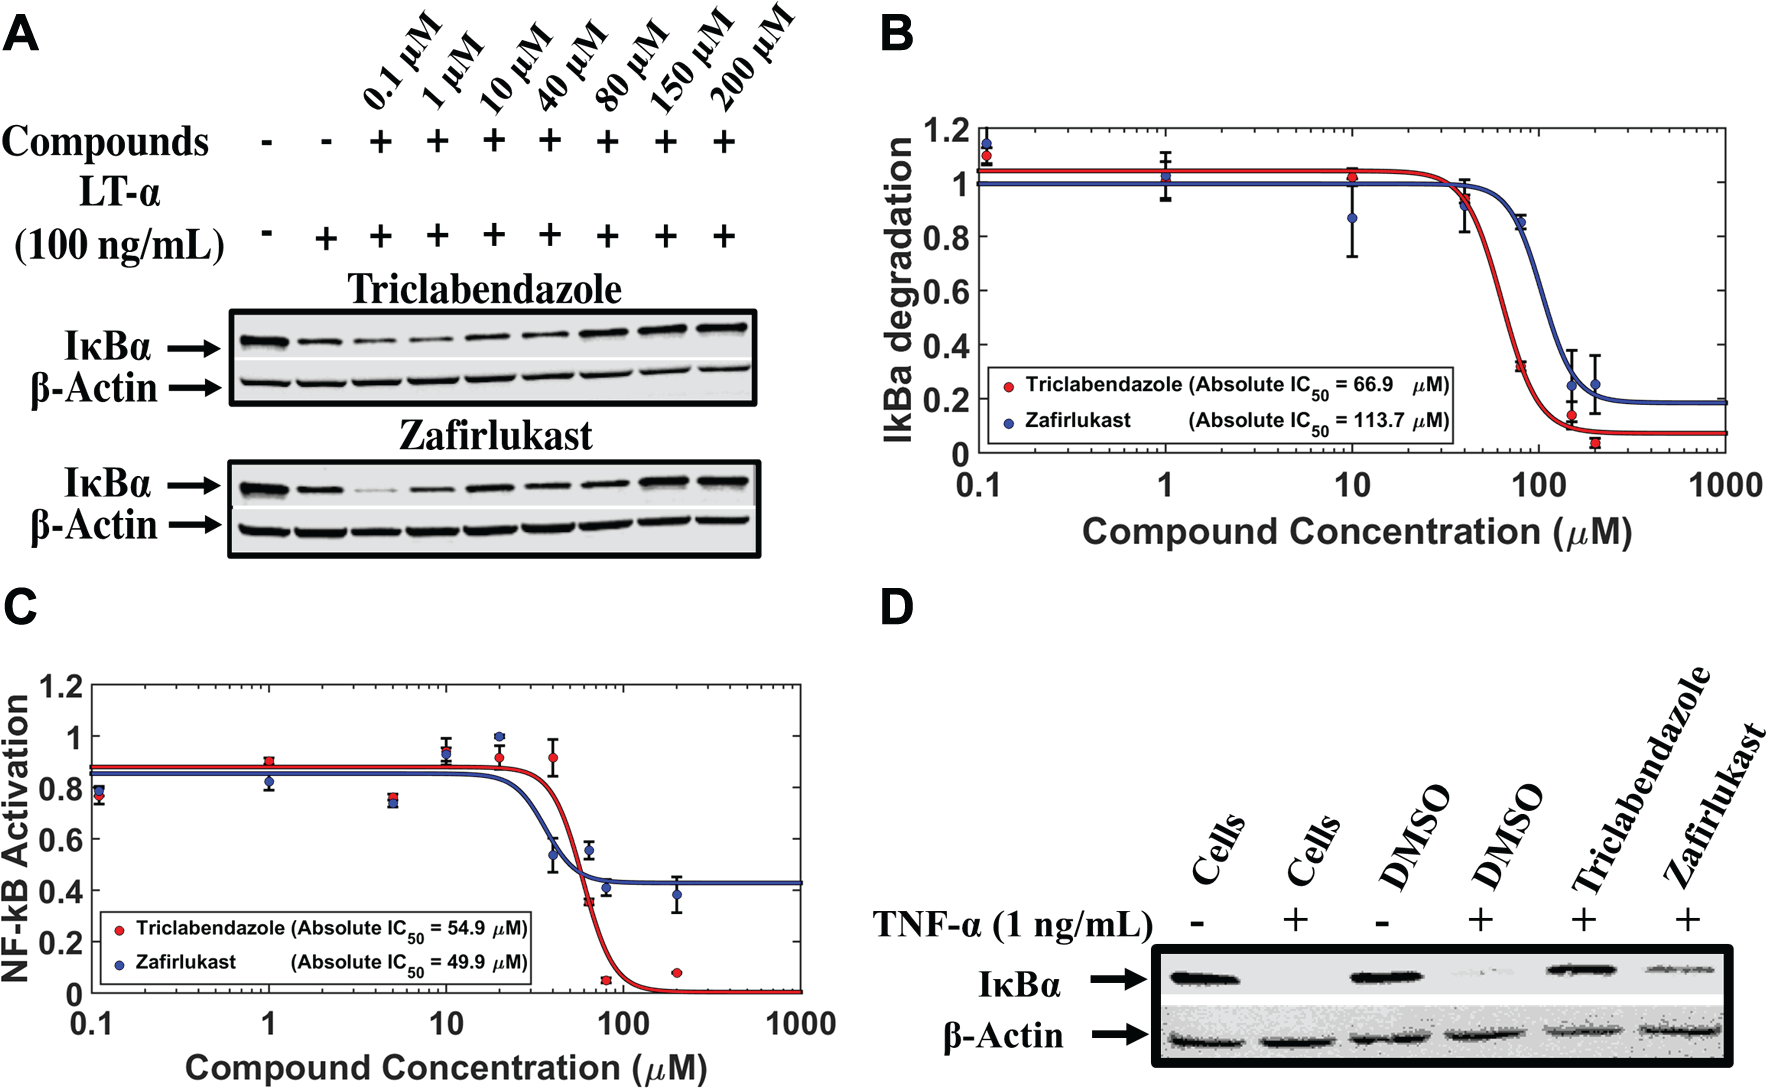
Hit compounds inhibit ligand-induced IκBα degradation and NF-κB activation in HEK293 cells. (
Mode of Inhibition of TNFR1 Signaling by Zafirlukast and Triclabendazole
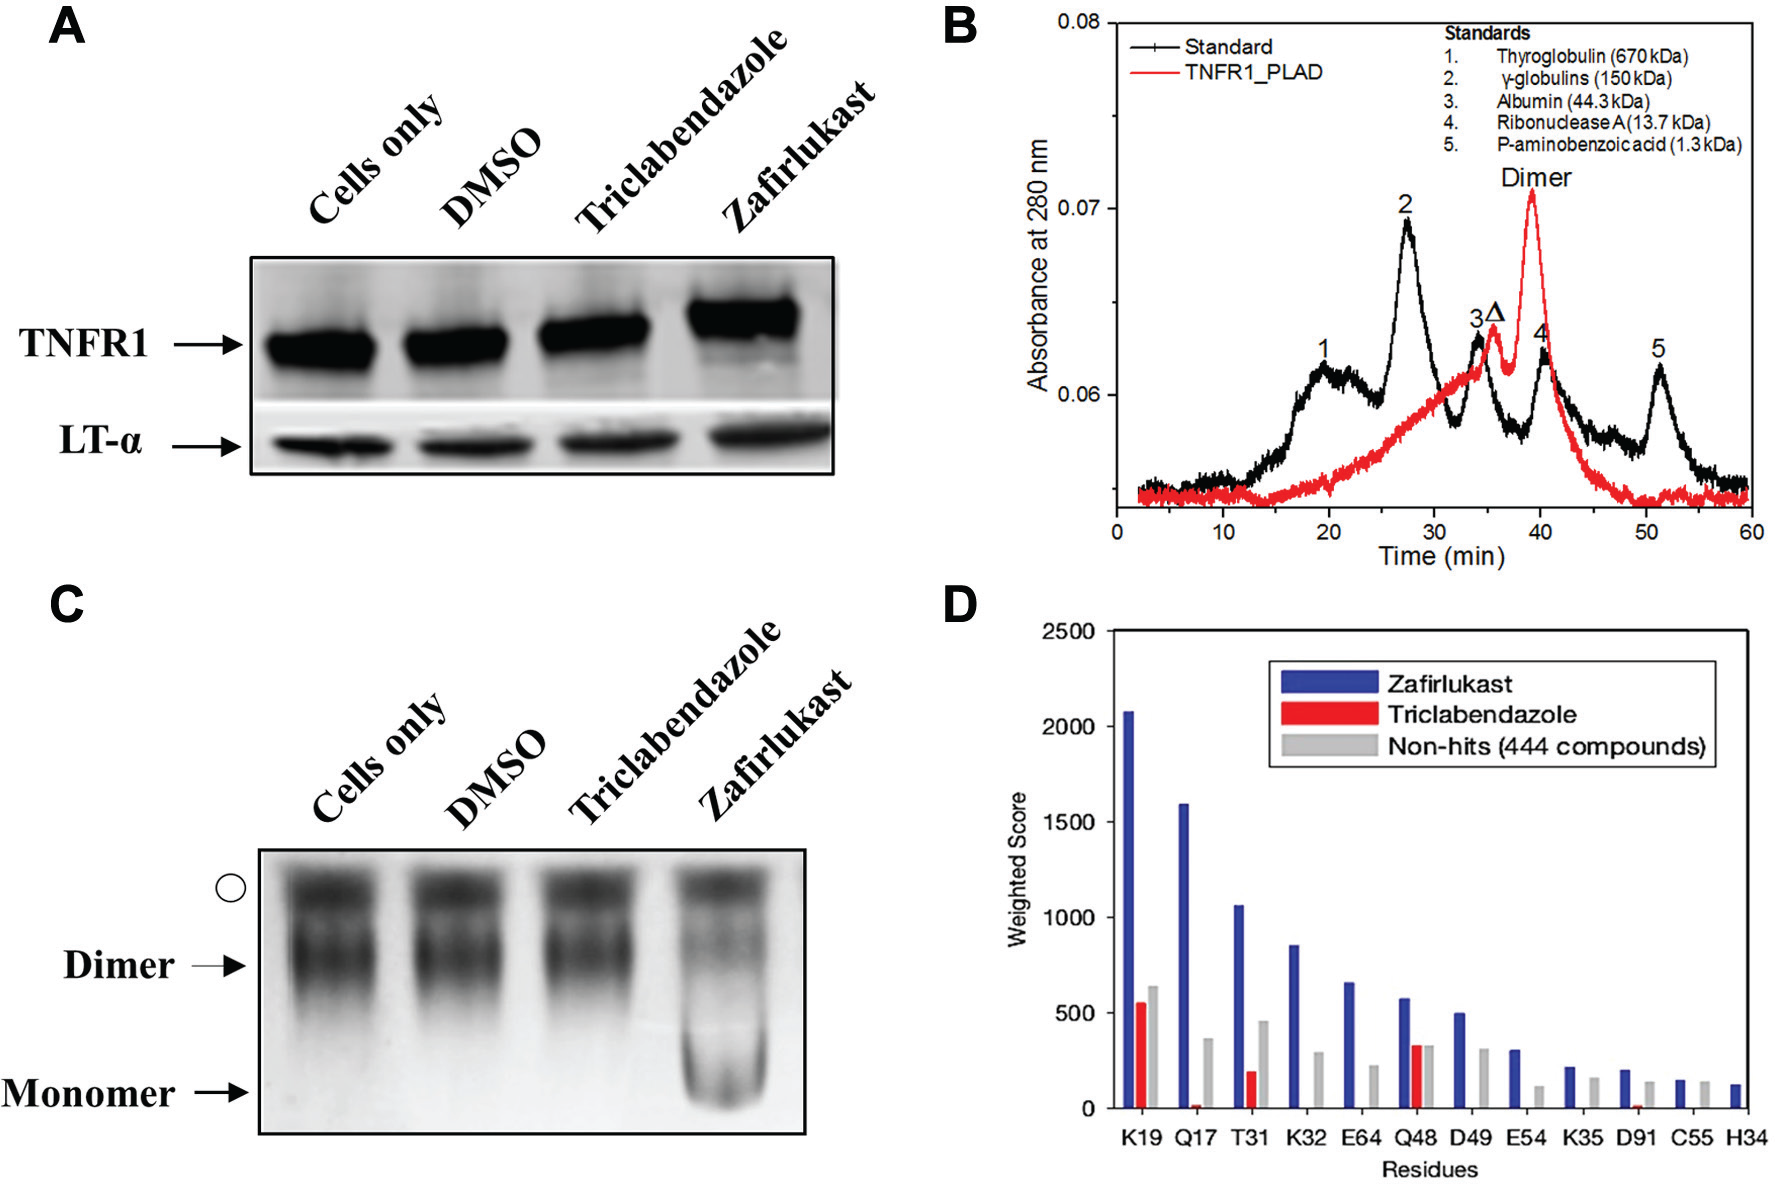
Fundamental to our stated goal, we then determined whether the inhibitory effects of these drugs are due to perturbations in ligand–receptor and/or receptor–receptor interactions. We monitored ligand–receptor binding in the presence and absence of drugs using coimmunoprecipitation. Western blot results illustrated that neither drug inhibited ligand–receptor binding ( Fig. 5A ). In addition, we confirmed that the drugs had no effect on ligand–ligand interactions ( Suppl. Fig. S1A ). We then tested the effect of drugs on fluorophores with cells expressing GFP–linker–RFP (linker contains 32 amino acids). FRET measurements showed no change in the FRET efficiency in the presence and absence of drug compounds ( Suppl. Fig. S1B ), which confirmed that the small molecules were not acting through disrupting interactions between the cytosolic fluorophores. Thus, by elimination, the two compounds were causing a change in FRET through interactions with either the ECD or transmembrane (TM) domain.
Mode of inhibition of TNFR1 signaling by zafirlukast and triclabendazole. (
In order to investigate the hypothesis that these compounds are acting directly on PLAD-PLAD assembly, or through another indirect or allosteric mechanism, we tested their effects on soluble FLAG-tagged PLAD. SEC showed that soluble PLAD existed as a dimer in the native condition ( Fig. 5B ). Next, we tested the effect of zafirlukast and triclabendazole on the dimerization of PLAD. We treated soluble PLAD with zafirlukast or triclabendazole and compared it with the untreated protein on a native gel. These results clearly showed that zafirlukast disrupted the dimerization of PLAD ( Fig. 5C ). However, triclabendazole did not disrupt the isolated PLAD-PLAD dimer, which implied that it might be binding to the conformationally active regions of the receptor that are important for its function.
Virtual Screening by Computational Docking of the NCC Library to Both Monomeric and Dimeric TNFR1 PLAD
To further explore the relative potency of zafirlukast in disrupting PLAD-PLAD interactions, we carried out a virtual screen by computational docking of the NCC library to both monomeric and dimeric PLAD (PDB: 1NCF). 9 Zafirlukast ranked sixth among 446 compounds ( Suppl. Fig. S2A,B ). Importantly, zafirlukast scored substantially better than triclabendazole. This was especially so when considering interactions with key residues at the dimer interface ( Fig. 5D and Suppl. Fig. S2C,D ), including those previously identified (e.g., K19, K32, and Q48). 10 We then experimentally tested the impact of mutating a subset of interfacial residues (Q17, K19, H34, and Q48) that potentially stabilize the receptor chains. The photobleaching FRET assay showed that K19, H34, and Q48 were crucial for stabilizing the affinity of receptor monomers ( Suppl. Fig. S3A,B ), but individually do not eliminate ligand binding ( Suppl. Fig. S3C ). Thus, the most likely mode of binding for zafirlukast is at the PLAD interface, although it remains possible that the binding is elsewhere within the PLAD and that the impact on dimerization is noncompetitive or allosteric. Triclabendazole, which is a more potent compound than zafirlukast ( Fig. 4 ), does not biochemically disrupt the isolated PLAD-PLAD dimer. Structural analysis of the two compounds has shown that zafirlukast is a more polar molecule than triclabendazole. Under physiological conditions, zafirlukast has a charge of –1, with two hydrogen bond donors and six hydrogen bond acceptors, suggesting that it should interact with charged and polar amino acid residues at the dimer interface ( Fig. 5D ). On the other hand, triclabendazole is less polar with no charge and has only one hydrogen bond donor and three hydrogen bond acceptors, suggesting that triclabendazole should not bind to the polar dimer interface but rather to a less polar region. In addition, we have recently shown that the other regions of TNFR1, including the cysteine-rich domain that connects to the TM domain (CRD4), and the TM domain itself, are conformationally active. 7 Triclabendazole’s relative potency, which bears future investigation, is therefore consistent with the notion that noncompetitive inhibitors that alter conformationally active regions of proteins should be more potent. 32
Discussion
New receptor-specific approaches are needed to treat diseases associated with overactivation of TNFR1, as conventional therapeutics of anti-TNF cause dangerous side effects due to off-target inhibition of related TNF receptors.5,6 Here, we sought to inhibit TNFR1 signaling by altering the oligomeric assembly of the receptors without disrupting ligand binding. Our results suggest two distinct modes of action in targeting receptor assembly. The first mode, which we anticipated in our experimental design ( Fig. 1 ), was to competitively target PLAD-PLAD interactions and, in so doing, disrupt oligomerization of endogenous TNFR1. We proved the viability of this approach in targeting TNFR1 with zafirlukast. The second mode, which emerged as something of a surprise, is to target the receptor with small molecules that act noncompetitively: triclabendazole does not compete with ligand or with PLAD-PLAD assembly.
One obvious limitation of these two small molecules isolated from the relatively small NCC library is the micromolar concentrations needed for inhibition. Moving forward in optimizing the small-molecule approach, it is provocative that triclabendazole is a slightly more potent compound than zafirlukast ( Fig. 4 ). In general, small-molecule inhibitors that do not directly compete with protein–protein interactions may be the most effective for the simple fact that they are unencumbered by competition.32–34 In the specific case of triclabendazole, we can safely assume that the binding of the small molecule was to either the ECD or TM domain of TNFR1, because the intracellular domains in our FRET constructs were replaced with fluorescent tags, which were shown to have no interaction with the small-molecule compounds ( Suppl. Fig. S1B ). Therefore, triclabendazole may act allosterically to disrupt receptor oligomerization, or based on more recent discussions of small-molecule strategies for targeting receptor–receptor interactions,32,34 it may bind to conformationally active sites of the receptor and disrupt the propagation of the downstream signaling. In this vein, recent work has fundamentally altered the view of TNFR activation. Older models involved ligand-induced receptor oligomerization absent any backbone conformational changes in the participating monomers. However, it is now believed that preassembled oligomers serve as conformational switching stations that are activated when ligand binds.7,21,35–37 In the context of this new dynamic model of activation, then, it is intriguing to think that small molecules that perturb TNFR dynamics, rather than preventing oligomerization, could be the most effective.
Regardless of the specific mechanism, our novel therapeutic strategy using small molecules that target receptor–receptor interactions holds great promise for ongoing efforts to develop more effective anti-TNFR drugs. The TNFR1ΔCD-FRET pair (TNFR1 biosensor) can be improved by increasing the FRET efficiency through optimization of the donor and acceptor ratio and using other fluorescent proteins that have increased brightness, photostability, and ability to detect larger distances of separation between their fluorophores. In addition, the stable cells expressing the TNFR1 biosensor will be further used in large-scale screening to identify potent compounds that reduce FRET to a greater extent. Increasing the dynamic range of the biosensor, as well as identifying compounds that are more potent, will result in a higher Z′ value and enhance the assay quality. This strategy, using our TR-FRET-based HTS approach, should be generally applicable to other drug discovery efforts targeting receptor–receptor interactions.
Footnotes
Acknowledgements
We thank Ji Li and Samantha Yuen from the Thomas group, and Gregory D. Gillispie and Kurt C. Peterson from Fluorescence Innovations, Inc., for technical discussions. Fluorescence microscopy was performed at the UMN Imaging Center, flow cytometry at the UMN Lillehei Heart Institute, compound dispensing at the UMN Institute of Therapeutic Drug Discovery and Development, and spectroscopy at the UMN Biophysical Technology Center. This work was carried out in part using computing resources at the University of Minnesota Supercomputing Institute.
Supplementary material is available online with this article.
Declaration of Conflicting Interests
The authors declared no potential conflicts of interest with respect to the research, authorship, and/or publication of this article.
Funding
The authors disclosed receipt of the following financial support for the research, authorship, and/or publication of this article: This work was supported by U.S. National Institutes of Health (NIH) grants to J.N.S. (R01 GM107175) and D.D.T. (R42 DA037622, subcontract from grant to Fluorescence Innovations, Gillispie PI).
References
Supplementary Material
Please find the following supplemental material available below.
For Open Access articles published under a Creative Commons License, all supplemental material carries the same license as the article it is associated with.
For non-Open Access articles published, all supplemental material carries a non-exclusive license, and permission requests for re-use of supplemental material or any part of supplemental material shall be sent directly to the copyright owner as specified in the copyright notice associated with the article.