The arginyl-glycinyl-aspartic acid (RGD) integrin subfamily contains five members that partner with the αv subunit: αvβ1, αvβ3, αvβ5, αvβ6, and αvβ8. Within the αv integrins, the epithelially restricted αvβ6 has been identified as playing a key role in the activation of transforming growth factor β that is hypothesized to be pivotal in the development of idiopathic pulmonary fibrosis (IPF). As part of a drug discovery program to identify a selective αvβ6 RGD mimetic for IPF, cell adhesion and radioligand binding assays were investigated to screen compounds to determine affinity and αv integrin selectivity. In this study, a pan-αv radioligand was characterized against all the αv integrins and used to determine accurate selectivity profiles for literature and novel RGD ligands, as well as enable an early readout on αvβ6 dissociation kinetics. It has been shown that while cell adhesion offers a high throughput and reliable format for ranking compounds, there are downsides to this format when comparing selectivity across αv integrins. By accurately defining the relationship between these assay formats, a medicinal chemistry effort has identified novel, high-affinity, and selective αvβ6 RGD mimetics with slow dissociation kinetics, with the potential to be developed into clinical candidates for IPF.
The alpha-v subset of the arginyl-glycinyl-aspartic acid (RGD) integrin family has been targeted over the past three to four decades for a number of diseases that have included fibrosis and cancer.1–4 This subset of integrins, consisting of alpha-v beta-1 (αvβ1), alpha-v beta-3 (αvβ3), alpha-v beta-5 (αvβ5), alpha-v beta-6 (αvβ6), and alpha-v beta-8 (αvβ8), have been shown to interact with a range of endogenous ligands that play key roles in cell adhesion and activation of intracellular signaling pathways, enabling communication between the extra- and intracellular environments.4 Over the past 10 years, there has been a significant body of literature implicating αvβ6 as a key player in idiopathic pulmonary fibrosis (IPF) and its role in activation of transforming growth factor β1 (TGFβ1).5–7 As such, a drug discovery program to identify small-molecule αvβ6 inhibitors was initiated that identified early hits by cross-screening analogues from a focused screening set available within the GlaxoSmithKline (GSK) corporate collection.
Once a small-molecule drug target has been selected, the initial focus is upon generation of novel chemical entities that investigate the unexplored chemical space for the interaction with the biological target. The source of these new chemical templates can be generated from a number of different methods that can include high-throughput screening (HTS) of millions of small-molecule libraries or focused screening sets containing chemical starting points, redesigning existing templates from the scientific literature, and/or modeling from an endogenous ligand (if a structure for this is available). Regardless of the source of the small molecule, biological assays are required to test the activity as well as characterize and define the desired properties of a potential drug candidate. There exists a fine balance between the throughput of an individual or panel of assays and their limitations in terms of physiological relevance and interassay comparisons. In the case of αvβ6 as a potential therapeutic target for IPF, in addition to the desired properties for a small molecule (low molecular weight, CLogP and hydrogen bond donors/acceptors) to give it the best chance of progression as a drug,8 there is the selectivity over the other RGD integrins, specifically the αv integrins due to the shared αv subunit. This is due to the potential liabilities associated with engagement of the non-αvβ6 αv integrins due to their involvement in angiogenesis/vascular permeability (αvβ3/59,10) and autoimmunity (αvβ811).
Historically, the determination of the ability of an integrin to compete with an endogenous ligand has been measured in either a cell adhesion assay12,13 or competitive binding enzyme-linked immunosorbent assay (ELISA).14 The IC50 values generated via these techniques measure the ability of the integrin ligand to inhibit the binding of an endogenous peptide ligand to the integrin that is either recombinantly expressed in a cell line (cell adhesion) or a soluble integrin protein preparation (ELISA). Although efficient in being able to differentiate the rank order of IC50 values of a set of ligands against a particular integrin and also being high throughput (allowing hundreds of compounds to be screened every week in a full concentration-response curve [CRC] format), one of the limitations of both these assay types is that a true affinity (KI) value cannot be calculated. To measure a true affinity or KI of a ligand, the Cheng-Prusoff equation15 is required that allows the binding affinity (KD) and the amount of competing ligand to be taken into consideration. This equation corrects for these parameters and allows a true affinity estimate for a ligand in the absence of a competing ligand. In the assay system mentioned above, the parameters required for the Cheng-Prussoff can either not be determined or are a crude estimate. In addition, these assay types do not allow a full characterization of the type of binding of the ligands in terms of being competitive and reversible (or not), and the kinetics of the ligand-integrin interaction cannot be ascertained.
As alternatives to the classical methods of determining integrin ligand affinity, a number of options include both new technologies (surface plasmon resonance [SPR],16 fluorescence polarization [FP] binding17) and more established methodology (radioligand binding18). Again there are advantages and disadvantages with all of these: SPR allows the determination of kon and koff of unlabeled ligands, but analysis of small molecules is challenging due to the small changes in the resonance observed with low molecular weight ligands; FP binding assays are high throughput but suffer the same limitations as those described for the cell adhesion and ELISA formats; radioligand binding assays allow accurate binding characterization, including kinetics, but are low throughput, higher cost, and not as safe relative to nonradioactive alternatives. However, despite its limitations, the radioligand binding assay still remains one of the most informative methods for characterizing the interactions between a ligand and its protein/receptor binding partner. Interestingly, the method has only recently been used in characterization of the binding of ligands with the αvβ6 integrin19,20 and has only been used sparingly in the integrin field.21,22
Therefore, studies were completed to aid in the identification and profiling of high-affinity and αvβ6 selective small-molecule RGD mimetics by validation of the most appropriate test systems to investigate these characteristics within the constraints of throughput. In addition, to determine the dissociation profiles of small-molecule RGD mimetics from the αvβ6 integrin, the design and implementation of a novel radioligand integrin binding assay are described. This has allowed the opportunity to compare the kinetics of potential drug candidates at a much earlier stage of the optimization process and thus increase the chance of discovery and development of a drug with a long duration of action. This would only allow molecules with the most desirable profiles, in terms of affinity, selectivity, and kinetics, to be taken forward for further analysis and aid in the characterization and development of a novel αvβ6 small-molecule RGD mimetic inhibitor as a potential therapeutic agent for IPF.
Materials and Methods
Materials
All the small-molecule RGD mimetics used in this study were synthesized by the Fibrosis and Lung Injury Discovery Performance Unit Medicinal Chemistry group at GSK Medicines Research Centre (Stevenage, UK). Full-length LAPβ1 (fLAP1) was purchased from Sigma-Aldrich (Gillingham, UK). Truncated LAPβ1 (tLAP1—GRRGDLATIHG), truncated LAPβ3 (tLAP3— HGRGDLGALKK), and the αvβ6 selective peptide NAVPNLRGDLQVLAQKVART (A20FMDV2 derived from the foot-and-mouth disease virus23) were synthesized by Cambridge Research Biochemicals (Cleveland, UK) (
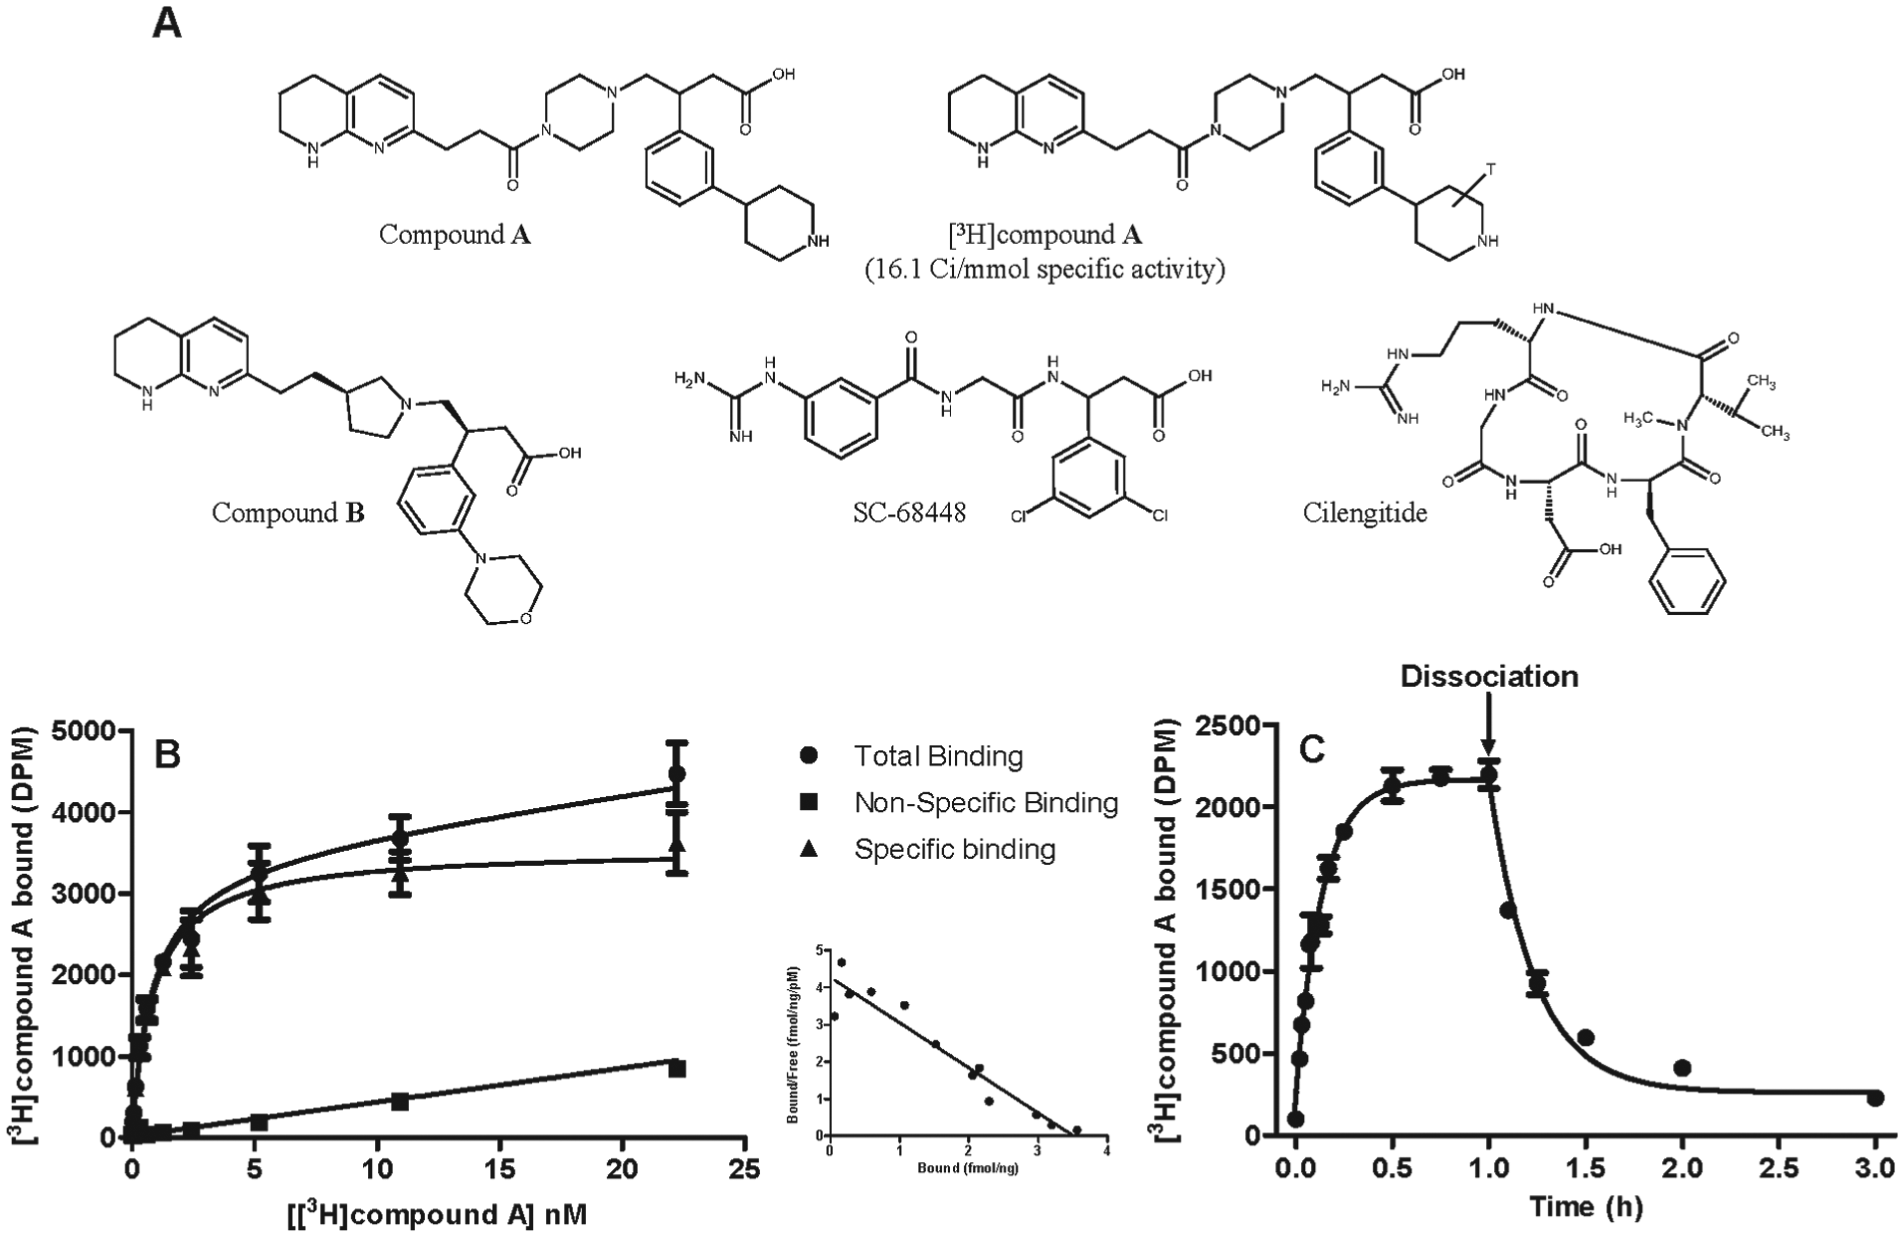
Fig. 1A
). Compound A (pan-αv small-molecule RGD mimetic) was radiolabeled with [3H] via catalytic reduction by RC TRITEC Ltd. (Teufen, Switzerland) and had a specific activity of 16.1 Ci/mmol (
Fig. 1A
). All other chemicals and reagents were purchased from Sigma-Aldrich unless otherwise stated. All ligands tested in cell assays and radioligand binding assays were completed in a final DMSO concentration of 0.1% and 1%, respectively, unless otherwise stated.
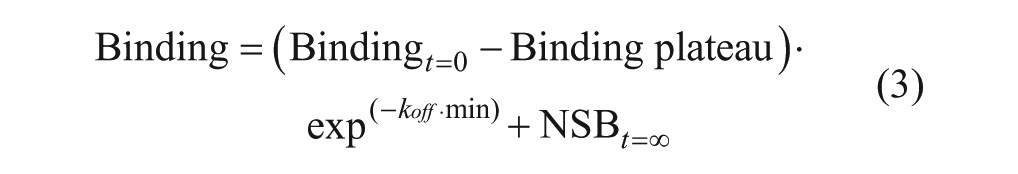
The chemical structures of the arginyl-glycinyl-aspartic acid (RGD) mimetics used in this study (A) and the human αvβ6 integrin saturation (B), association, and dissociation binding (C) generated for [3H]compound A. For saturation studies, specific binding of [3H]compound A was measured by incubation of increasing concentrations of radioligand with the human αvβ6 integrin in the presence of either vehicle (1% DMSO) or 10 µM SC-68448. For association studies, specific binding of [3H]compound A was measured by incubation of radioligand (~ KD and 5 × KD [not shown]) with the human αvβ6 integrin over time in the presence of either vehicle (1% DMSO) or 10 µM SC-68448. For dissociation studies, soluble human αvβ6 integrin protein was preincubated for 1 h with a fixed concentration of radioligand (~ KD) before dissociation was initiated by addition of 10 µM SC-68448. Plates were then filtered after a 24-h incubation for saturation or the time points indicated for association and dissociation studies, and the amount of radioligand bound to αvβ6 was measured by liquid scintillation spectroscopy. Specific binding was measured by subtracting the nonspecific binding (10 µM SC-68448) from the total radioligand binding in the presence of vehicle (1% DMSO) for saturation and association binding studies. Specific saturation binding data were fitted to a one affinity site model with Hill slope (see Data Analysis section). Association and dissociation were fitted to a one-phase association or dissociation model, respectively. Data shown are the mean ± SD of duplicate points and are representative of at least four individual experiments with similar results. Inset A: Scatchard transformation28 of specific binding with the straight-line fit constrained to the mean Bmax and KD values from nonlinear regression using the one affinity site model with Hill slope (where x = 0, y = Bmax/KD and y = 0, x = KD).
Cell Lines and Recombinant Soluble Integrin Proteins
Purified soluble protein preparations (recombinantly derived from Chinese hamster ovary cells) for the human (αvβ1, αvβ3, αvβ5, αvβ6, and αvβ8) integrin proteins profiled were all purchased from R&D Systems (Minneapolis, MN). The myelogenous leukemia K562 cell line24 stably expressing the αvβ3, αvβ5, αvβ6, or αvβ8 integrin (K562-αvβ3, K562-αvβ5, K562-αvβ6, and K562-αvβ8, respectively) was generated as previously described.13 The human lung carcinoma epithelial cell line A54925 was purchased from ATCC (Manassas, VA) and used for αvβ1 cell adhesion.
αv Integrin Cell Adhesion
GST-LAP1 protein, corresponding to the RGD integrin-binding domain of LAP1 (amino acids 242–252—GRRGDLATIHG), or vitronectin (purified from pooled human plasma) was generated as previously described.13,26 Vitronectin (αvβ5) or GST-LAP1 (αvβ1, αvβ3, αvβ6, and αvβ8) was coated onto 96-well MaxiSorp flat-bottom plates (Thermo Fisher Scientific, Waltham, MA) at 2.5 µg/mL or 10 µg/mL, respectively, and incubated for 2 h at 37 °C. Plates were then blocked with 3% w/v bovine serum albumin (BSA) in phosphate-buffered saline (PBS) for 1 h (2× PBS washes before and after blocking). Test compounds were added and incubated for 30 min at 37 °C with cells (A549 [αvβ1], K562-αvβ3, K562-αvβ5, K562-αvβ6, or K562-αvβ8 cells) in Hank’s balanced salt solution containing 25 mM HEPES and 10 mM MgCl2, as well as 5 µM 2′,7′-bis-(2-carboxyethyl)-5-(and-6)-carboxyfluorescein, acetoxymethyl ester (BCECF-AM). Plates were then washed (2× PBS washes) and 0.5% Triton X-100 detection solution added for a 5-min incubation at ambient temperature (20–22 °C) prior to fluorescence measured using an EnVision multilabel plate reader (PerkinElmer LAS UK Ltd., Beaconsfield, UK).
General Radioligand Binding Protocols
All radioligand binding experiments were performed in 96-well (2 mL deep-well) plates at 37 °C in binding buffer (25 mM HEPES, 100 mM NaCl, 2 mM MgCl2, and 1 mM 3-[(3-cholamidopropyl)dimethylammonio]-1-propanesulfonate [CHAPS] at pH 7.4 [NaOH]). Radioligand binding studies completed with recombinant soluble integrin proteins were in a total volume of 0.5 mL ([3H]compound A) consisting of 50 µL/well of either unlabeled compound at varying concentrations or vehicle (1% DMSO), 50 µL radioligand ([3H]compound A), and 0.4 mL/well purified integrin. [3H]compound A was tested against the following human integrins with the final assay concentration (FAC) of protein shown in parentheses: αvβ1 (1.5 nM), αvβ3 (0.1 nM), αvβ5 (1 nM), αvβ6 (0.075 nM and 0.3 nM for a low- and high-protein assay format, respectively), and αvβ8 (2 nM). Nonspecific binding (NSB) was determined with 10 µM SC-68448 (pan-αv small-molecule RGD mimetic27) (
Fig. 1
). Plates were incubated with gentle agitation for the time periods indicated and binding terminated by rapid vacuum filtration through a 48-well Brandel harvester (Brandel, Gaithersburg, MD) onto GF/B filter papers presoaked in 0.3% v/v polyethylenimine. Samples were washed rapidly three times with ice-cold dH2O and filters transferred into liquid scintillation (LS) vials containing 4 mL LS fluid (Ultima-Flo M; PerkinElmer LAS UK Ltd.). The amount of radioligand bound to integrin protein was measured by LS spectroscopy using a TriCarb 2900 TR LS counter (PerkinElmer LAS UK Ltd.). Incubation times in competition binding assays varied depending on the equilibration times required for the range of compound affinities being measured against each individual integrin.
Radioligand Characterization
Association, dissociation, and saturation binding studies were performed with [3H]compound A to determine radioligand binding kinetics at the αvβ6 integrin (association rate constant [kon], dissociation rate constant [koff] and equilibrium dissociation constant [KD] were calculated as described under Data Analysis section). For association binding, αvβ6 integrin was incubated with varying concentrations of [3H]compound A (~1 to 5 nM) for varying times up to 4 h prior to filtration. For dissociation binding, αvβ6 integrin was preincubated for 1 h with a fixed concentration of [3H]compound A (~1 to 2 nM) before dissociation was initiated by the addition of an excess of SC-68448 (10 µM) and then incubation for varying times up to 3 h prior to filtration. For saturation binding, αvβ6 integrin was incubated with increasing concentrations of [3H]compound A (~0.01 to 44 nM) for 6 h prior to filtration. Saturation binding was also completed for [3H]compound A (~0.07 to 138 nM) against the αvβ1, αvβ3, αvβ5, and αvβ8 integrins following either a 2-h (αvβ5 and αvβ8) or 6-h (αvβ1 and αvβ3) incubation.
Determination of αvβ6 Integrin Ligand Affinity, Selectivity, and Dissociation Rate
To determine the affinity and selectivity of integrin ligands, competition binding displacement studies were completed where integrin protein was incubated with a fixed concentration of [3H]compound A (~1 to 10 nM dependent on integrin) and single or increasing concentrations of unlabeled test ligand (small-molecule RGD mimetics and peptides) for 2 h (αvβ5 and αvβ8), 6 h (αvβ1, αvβ3, αvβ6 [high protein assay]), or 24 h (αvβ6 [low protein assay]) prior to filtration. To determine the receptor dissociation rates of unlabeled integrin ligands, 2 × KI concentrations of unlabeled test ligands were incubated with αvβ6 protein for 1 h prior to addition of excess [3H]compound A (50 × KD = ~50 nM) and then incubated at 37 °C for varying times up to 48 h prior to filtration.
Data Analysis
Analysis of all experiments was completed using Prism 5.0 (GraphPad Software, San Diego, CA). Specific binding data from association binding experiments were fitted to a one-phase association model (equation 1, where Binding is the level of binding observed in test well and kob is the observed rate constant in inverse units of time [min–1]).
To calculate the association rate constant kon (in units of inverse molar inverse time [M–1 · min–1]) from Kob, equation 2 was used (where koff is the dissociation rate constant in inverse units of time [min–1]).
Dissociation binding data for [3H]compound A (experiments individually fitted) and unlabeled integrin ligands (experiments globally fitted) were fitted to a one-phase dissociation model (equation 3, where koff is the dissociation rate constant in inverse units of time [min–1] and NSB t=∞ is nonspecific binding determined at infinite time).
From equation 3, koff values were subsequently used to calculate dissociation t1/2 values using the equation t1/2 = 0.693/koff. Specific binding data from saturation experiments were fitted to a one affinity site model with Hill slope (equation 4, where nH = Hill slope coefficient) to determine KD values. For visualization only, specific binding data from saturation experiments were also analyzed via Scatchard transformation.28
All CRCs and competition binding displacement curves were fitted using nonlinear regression analysis (four-parameter logistic equation with variable slope29) with IC50 values calculated from the fits. IC50 values generated from competition binding curves against [3H]compound A (where [3H]compound A saturation binding curve nH = 1) were converted to equilibrium dissociation constant (KI) values using the Cheng-Prusoff equation15 (equation 5, where L* is the radioligand concentration).
All statistical analyses were completed using Prism 5.0 (GraphPad Software), and differences of p < 0.05 were considered statistically significant. Statistical significance between two data sets was tested using a Student unpaired t test. One-way analysis of variance (ANOVA) was used for comparison of more than two data sets and, where significance was observed, an appropriate post-test completed. For determination of statistical difference between a single data set and a hypothetical value, a one-sample t test was carried out. Unless otherwise indicated, data shown graphically and in the text are either mean ± standard deviation (SD) or, where three or more data points/individual experiments have been completed, mean ± standard error of the mean (SEM).
Results
Characterization of [3H]compound A αvβ6 Integrin Binding
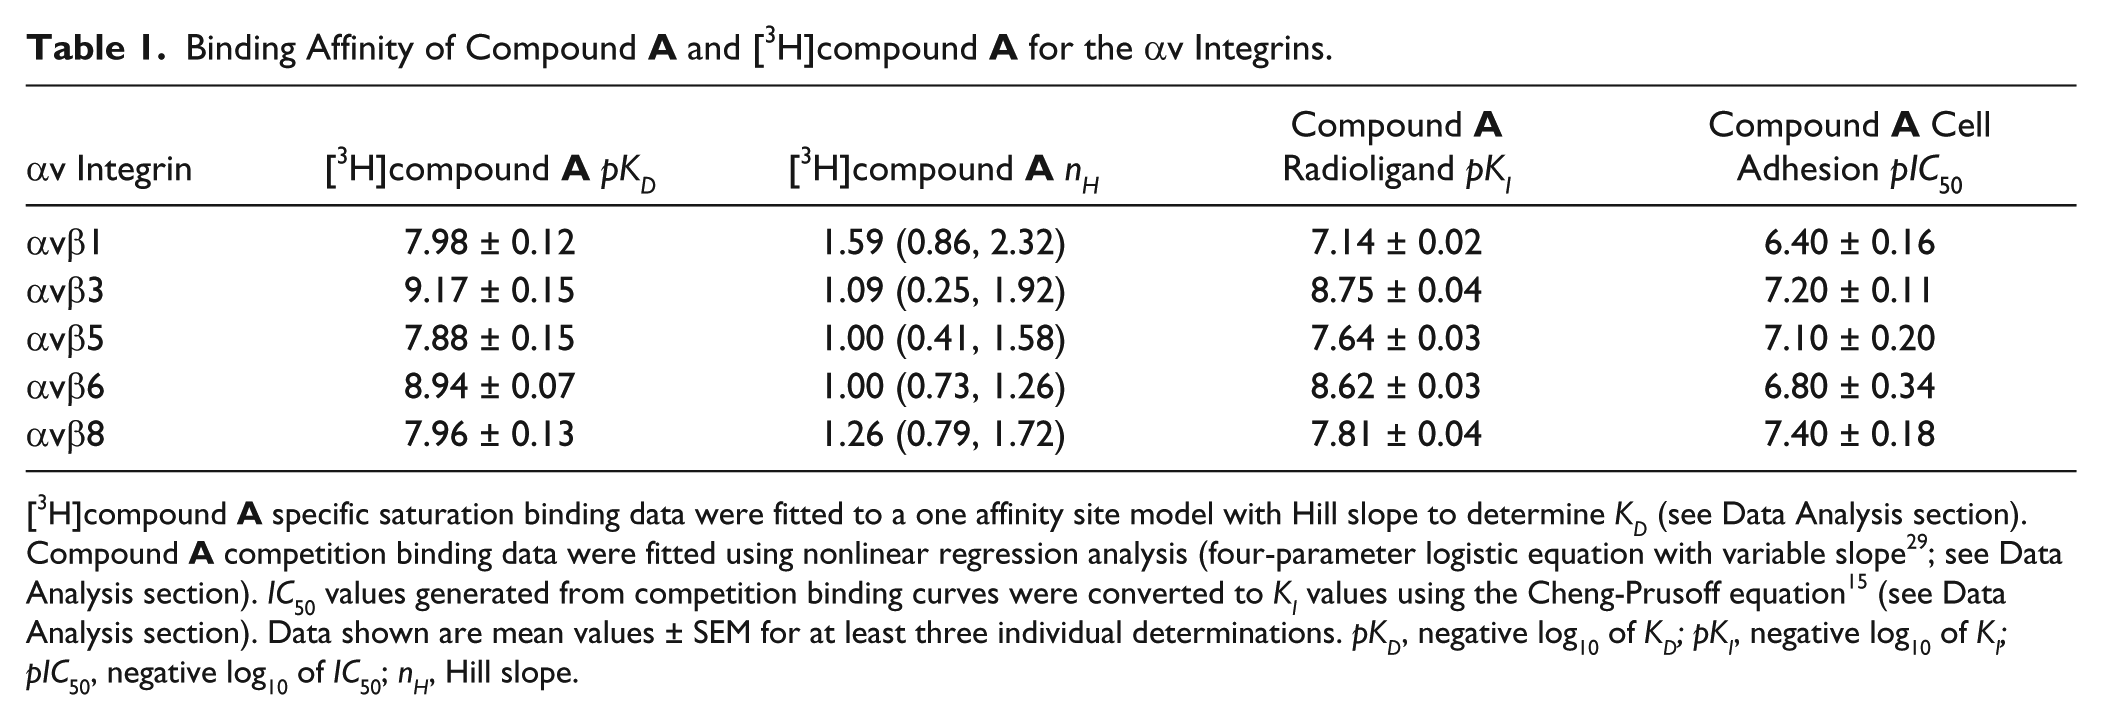
[3H]compound A saturation binding studies were carried out with the αvβ6 integrin to characterize the mode of binding and determine its affinity for the RGD binding site. Specific binding data from saturation experiments with [3H]compound A were fitted to a one affinity site model (with Hill slope [nH]), and analysis resulted in the pKD and nH values shown in
Table 1
. The binding to αvβ6 was saturable and high affinity (
Fig. 1B
) with the nH not significantly different from unity (one-sample t test completed on log10nH vs. 0, p > 0.05), suggesting the binding of [3H]compound A to αvβ6 followed the law of mass action at a single site. Saturation binding studies with [3H]compound A against αvβ1, αvβ3, αvβ5, and αvβ8 were also completed (
Table 1
). Saturable binding of [3H]compound A with these integrins was also observed with nH values not significantly different from unity (one-sample t test completed on log10nH vs. 0, p > 0.05), again suggesting the binding of [3H]compound A to these integrins also followed the law of mass action at a single site. The affinity of [3H]compound A for αvβ3 and αvβ6 was comparable, as was its affinity for αvβ1, αvβ5, and αvβ8. [3H]compound A exhibited an ~9- to 20-fold higher affinity for αvβ3 and αvβ6 compared with αvβ1, αvβ5, and αvβ8 (
Table 1
).
Binding Affinity of Compound A and [3H]compound A for the αv Integrins.
αv Integrin
[3H]compound ApKD
[3H]compound AnH
Compound A Radioligand pKI
Compound A Cell Adhesion pIC50
αvβ1
7.98 ± 0.12
1.59 (0.86, 2.32)
7.14 ± 0.02
6.40 ± 0.16
αvβ3
9.17 ± 0.15
1.09 (0.25, 1.92)
8.75 ± 0.04
7.20 ± 0.11
αvβ5
7.88 ± 0.15
1.00 (0.41, 1.58)
7.64 ± 0.03
7.10 ± 0.20
αvβ6
8.94 ± 0.07
1.00 (0.73, 1.26)
8.62 ± 0.03
6.80 ± 0.34
αvβ8
7.96 ± 0.13
1.26 (0.79, 1.72)
7.81 ± 0.04
7.40 ± 0.18
[3H]compound A specific saturation binding data were fitted to a one affinity site model with Hill slope to determine KD (see Data Analysis section). Compound A competition binding data were fitted using nonlinear regression analysis (four-parameter logistic equation with variable slope29; see Data Analysis section). IC50 values generated from competition binding curves were converted to KI values using the Cheng-Prusoff equation15 (see Data Analysis section). Data shown are mean values ± SEM for at least three individual determinations. pKD, negative log10 of KD; pKI, negative log10 of KI; pIC50, negative log10 of IC50; nH, Hill slope.
In kinetic binding studies, the association of [3H]compound A to the αvβ6 integrin was measured at ~KD and 5 × KD concentrations of radioligand. Global fitting of the association kinetic model to specific association binding data resulted in a kon value of 9.7 ± 1.1 × 10⁷ M–1 · min–1 for [3H]compound A (mean ± SEM, n = 4). In addition to determining an accurate kon value for [3H]compound A, the time it took to reach a plateau at these concentrations of radioligand was required to determine the optimum radioligand/integrin preincubation period in dissociation binding studies. For [3H]compound A, the plateau (i.e., when equilibrium or steady state) was achieved in 45 min when using a KD concentration of radioligand (
Fig. 1C
). Therefore, the preincubation time used in dissociation studies was 1 h to ensure that equilibrium binding with the αvβ6 integrin had been achieved in the system at radioligand concentrations > KD. To measure a dissociation t1/2 value for [3H]compound A, dissociation was initiated via the addition of 10 µM SC-68448. A single-phase dissociation of [3H]compound A binding from the αvβ6 integrin was observed with complete dissociation achieved between 2 and 3 h (
Fig. 1C
). A t1/2 value for [3H]compound A of 15.9 ± 5.0 min (mean ± SEM, n = 6) was observed.
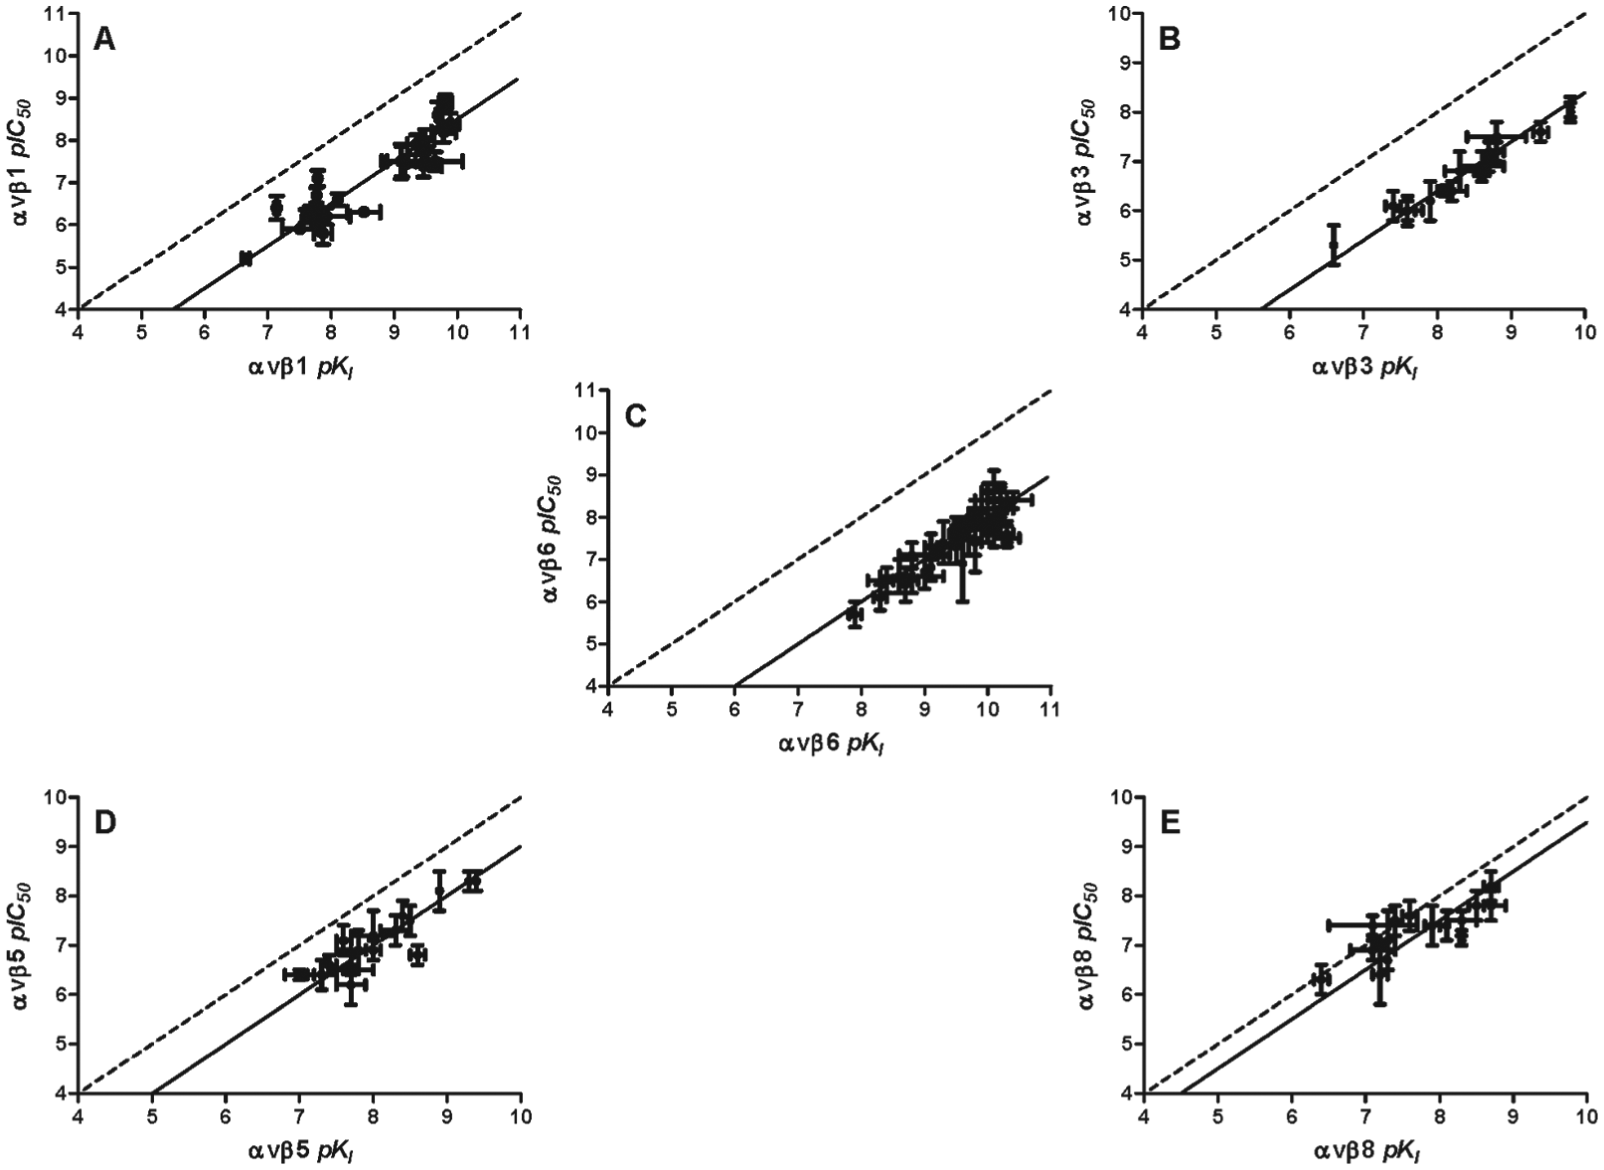
Comparison of Cell Adhesion and Radioligand Binding Assays for Profiling Integrin Small-Molecule RGD Mimetics
To compare the rank order of activity of a range of novel small-molecule RGD mimetics between cell adhesion and radioligand binding assays for the αvβ1, αvβ3, αvβ5, αvβ6, and αvβ8 integrins, pIC50 values generated in cell adhesion (as an empirical measure of competitor potency) were correlated with pKI values (true affinity measure) (
Fig. 2
). In addition, the average fold shift between pIC50 and pKI values within each integrin comparison was also calculated (fold shift = pKI – pIC50). The average fold shifts observed for αvβ1, αvβ3, αvβ5, αvβ6, and αvβ8 were 1.5 (0.7 to 2.2), 1.6 (1.3 to 1.8), 1.0 (0.5 to 1.8), 2.0 (1.4 to 2.8), and 0.5 (–0.3 to 1.2), respectively (mean with minimum and maximum values shown in parentheses, n = 16–47). The straight lines that corresponded to the average fold shifts for each integrin are shown as the solid lines on the individual correlations in
Figure 2
. The largest average fold shift difference was shown with αvβ6 followed by αvβ3, αvβ1, αvβ5, and αvβ8. αvβ8 displayed the closest agreement between cell adhesion and radioligand binding, and this was the only integrin that had any values on or to the left of the x = y line (shown as dotted line
Fig. 2E
). A similar trend was observed for αvβ6 when comparing [3H]compound ApKD in saturation binding studies, or the pKI generated using the unlabeled form in competition binding studies (compound A vs [3H]compound A) against the αvβ6 cell adhesion assay (
Table 1
).
Correlation of pIC50 and pKI values generated with arginyl-glycinyl-aspartic acid (RGD) ligands from cell adhesion or radioligand competition binding (against [3H]compound A) studies, respectively, with the αvβ1 (A), αvβ3 (B), αvβ6 (C), αvβ5 (D), or αvβ8 (E) integrin. Full concentration response curves in cell adhesion assays were generated by incubating RGD ligands at a range of concentrations with A549 cells (αvβ1) or K562 cells recombinantly expressing the αvβ3, αvβ5, αvβ6, or αvβ8 integrin in plates coated with endogenous integrin ligand. Plates were incubated for 30 min prior to removal of nonadherent cell populations, and the remaining adherent cells were then quantified by fluorescence using 2′,7′-bis-(2-carboxyethyl)-5-(and-6)-carboxyfluorescein, acetoxymethyl ester (BCECF-AM). Full competition binding curves were generated by incubating small-molecule RGD ligands at a range of concentrations with the αvβ1, αvβ3, αvβ5, αvβ6, or αvβ8 soluble integrin protein and [3H]compound A. Plates were then filtered after a 2-h (αvβ5 and αvβ8) or 6-h (αvβ1, αvβ3, and αvβ6) incubation, and the amount of radioligand bound to integrin was measured by liquid scintillation spectroscopy. Cell adhesion concentration response curves and competition binding data were fitted using nonlinear regression analysis (four-parameter logistic equation with variable slope29) to generate IC50 values. KI values were calculated from IC50 values (see Data Analysis section), and the pKI values generated for each unlabeled integrin ligand against [3H]compound A were correlated for each integrin with the corresponding pIC50 value generated from cell adhesion (dotted line shows the straight line x = y, solid line shows the average fold-shift of pIC50 to pKI for each integrin). pIC50 and pKI shown are the mean ± SD of at least two individual experiments carried out in singlicate.
Effect of αvβ6 Protein Concentration on Affinity Estimates
To investigate the sensitivity of the [3H]compound A competition binding experiments completed with 0.3 nM αvβ6 integrin (defined as a high-protein assay format), small-molecule RGD mimetics were investigated with a lower concentration of αvβ6 integrin protein (0.075 nM—defined as a low-protein assay format). SC-68448 (low affinity, control ligand) was compared with compound B (high affinity, novel ligand). No significant change in affinity was observed for SC-68448 (SC-68448 pKI 8.56 ± 0.05 high vs. 8.72 ± 0.06 low protein; Student t test, p > 0.05, mean ± SEM, n = 5–38), while compound B shifted significantly between the high- and low-protein formats (compound BpKI 10.2 ± 0.02 high vs. 10.6 ± 0.04 low protein; Student t test, p < 0.05, mean ± SEM, n = 5–9).
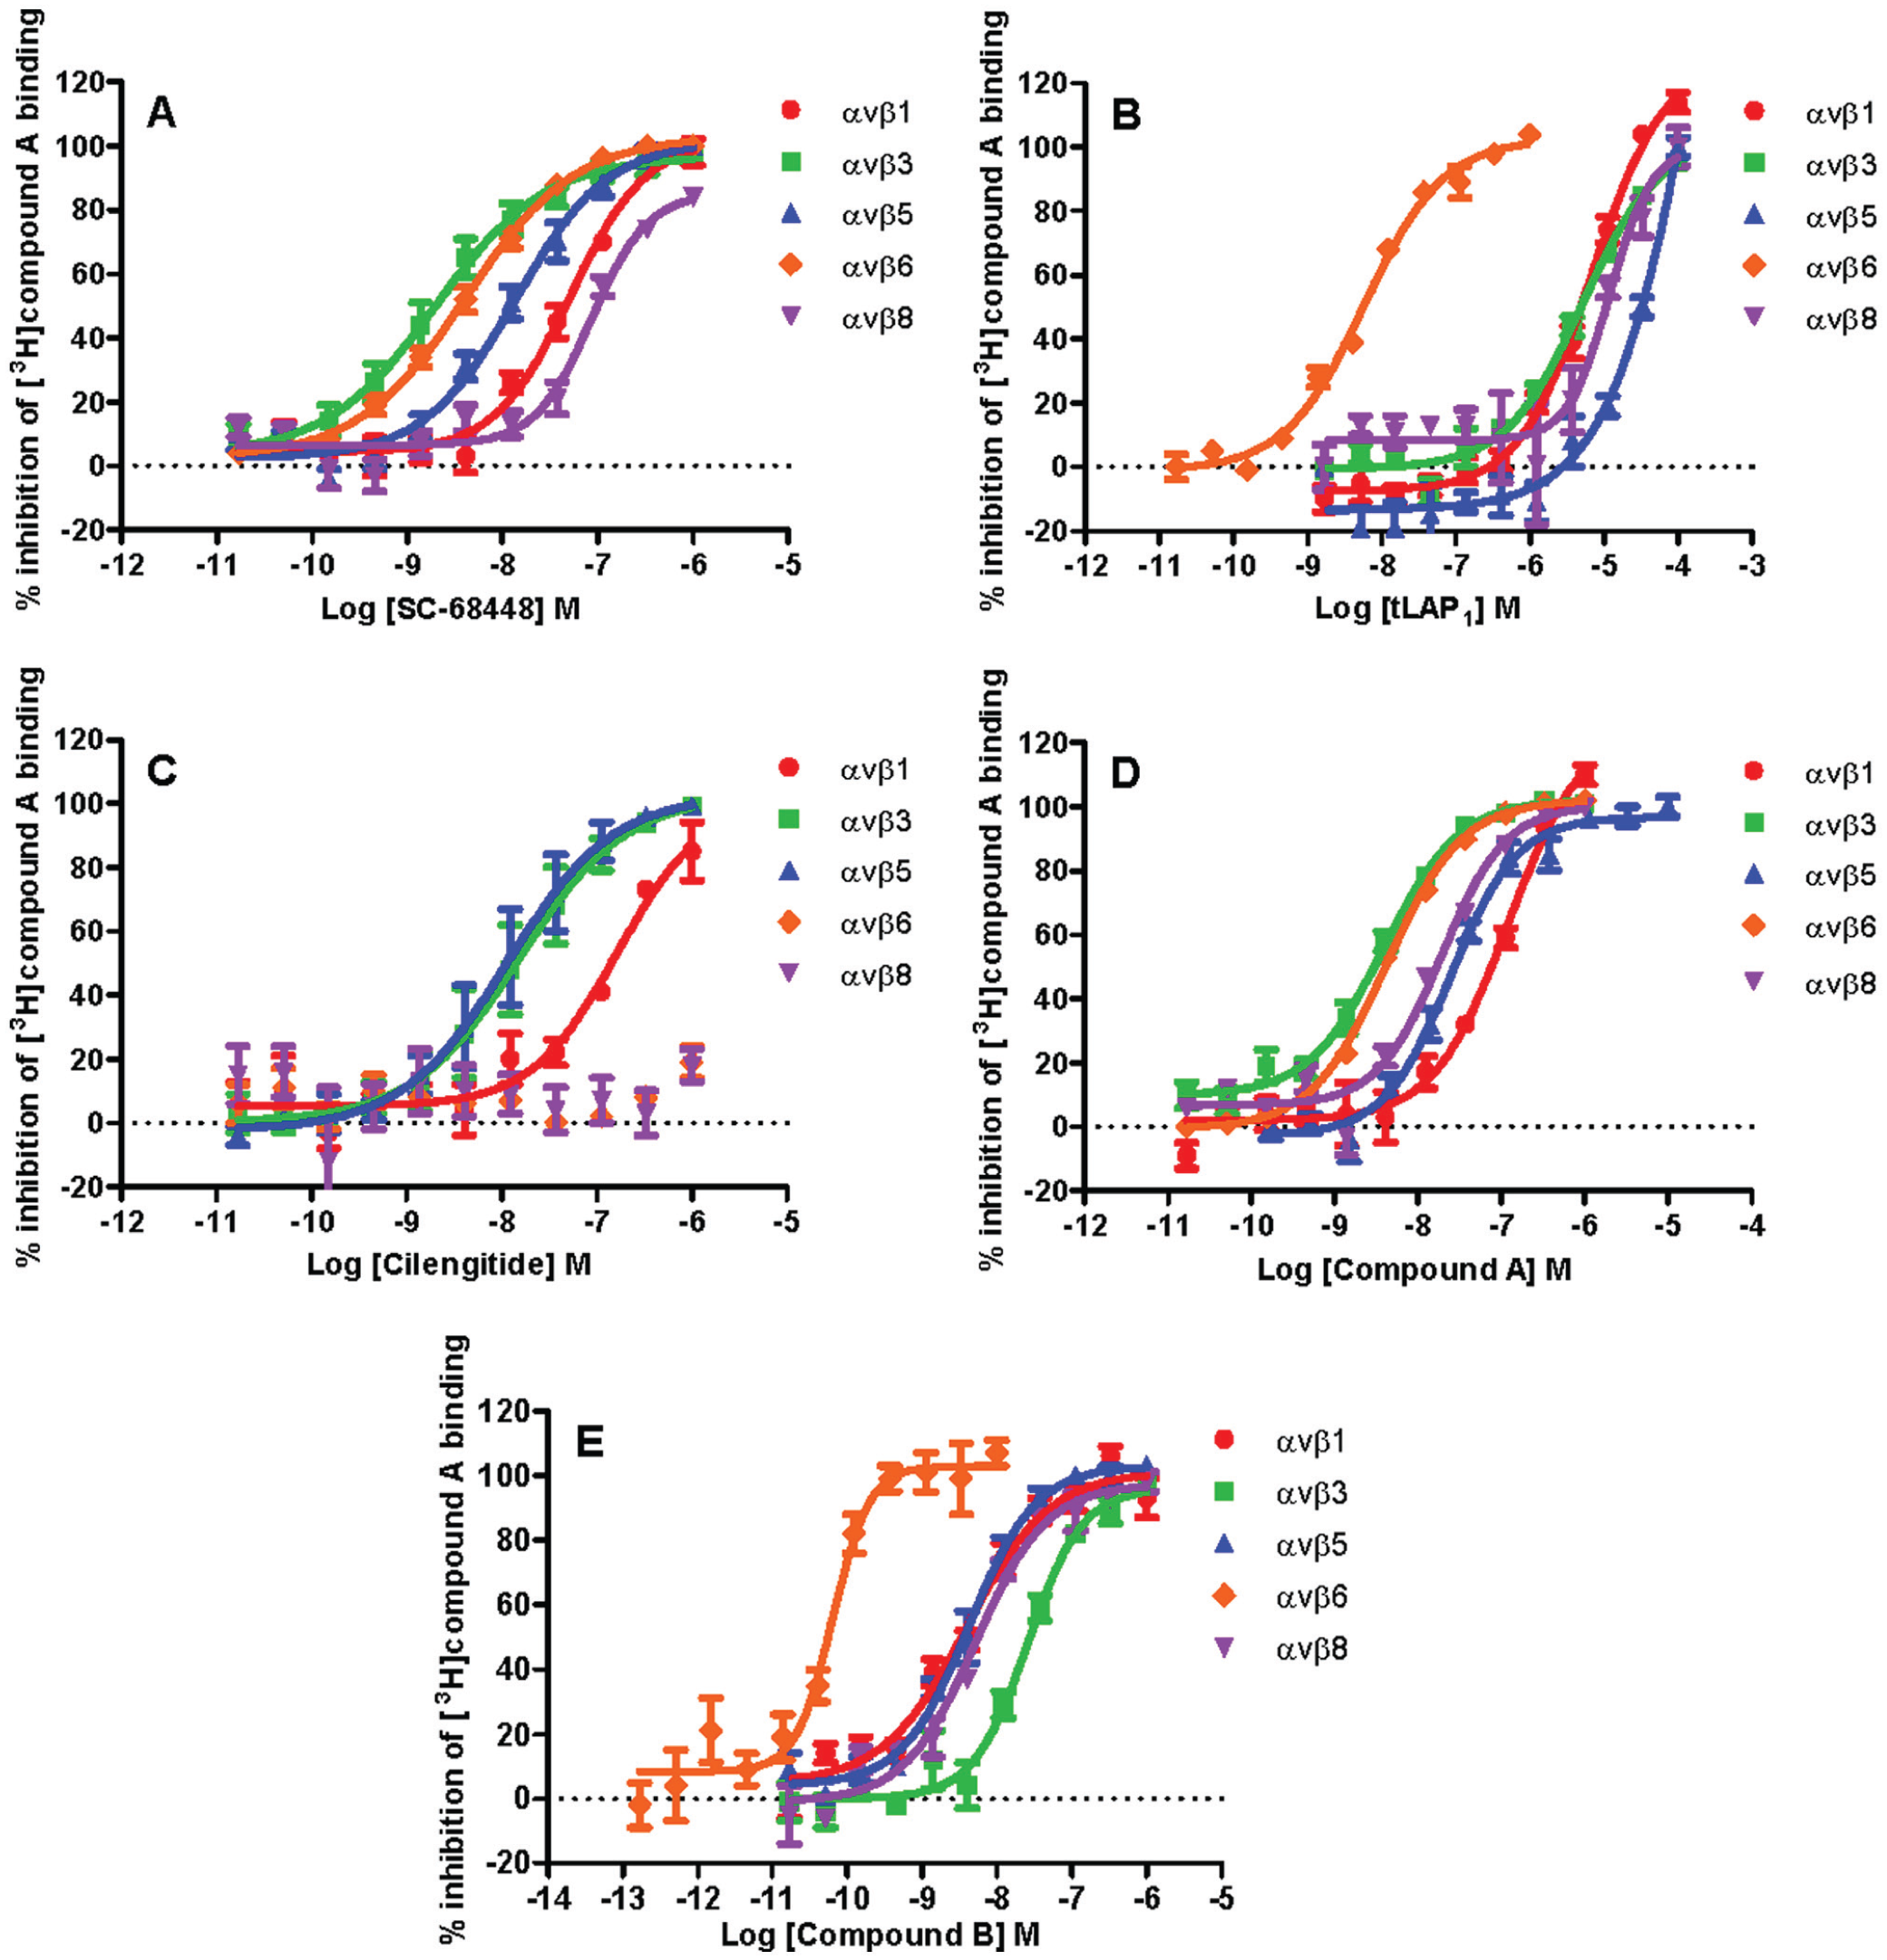
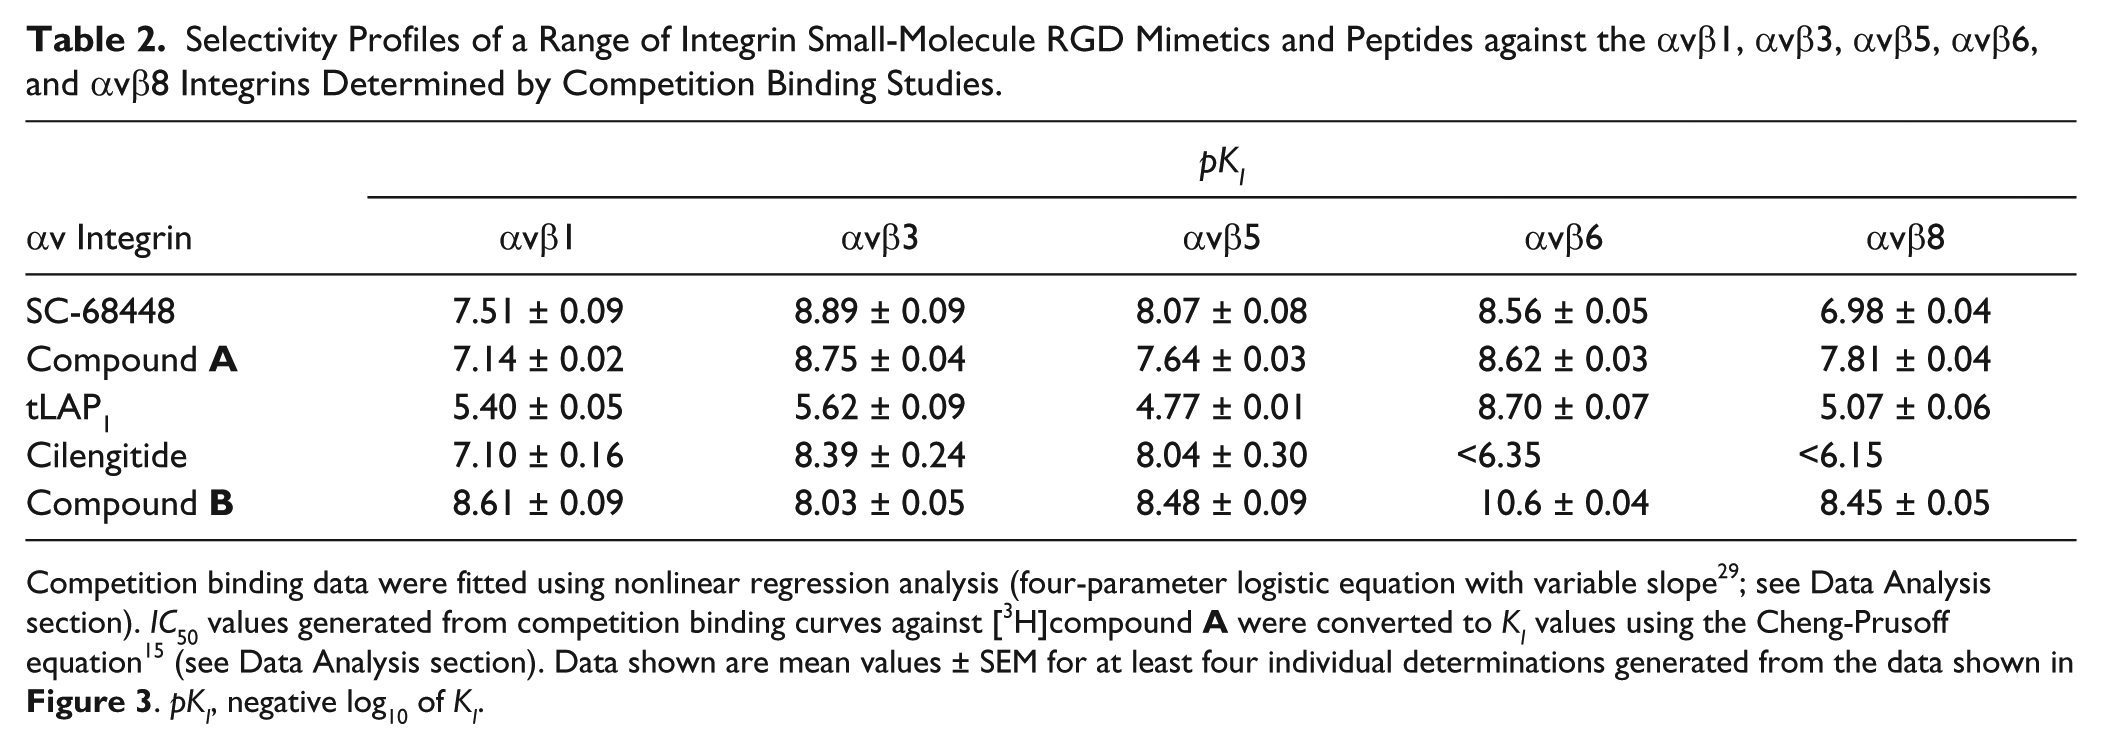
Selectivity of Small-Molecule RGD Mimetics and Peptides for the αvβ1, αvβ3, αvβ5, αvβ6, and αvβ8 Integrins
To determine the selectivity prolife of a range of integrin ligands, competition binding curves were completed with [3H]compound A against αvβ1, αvβ3, αvβ5, αvβ6, and αvβ8 (
Fig. 3
). The control small-molecule RGD mimetics SC-68448 and compound A were shown to be the least selective ligands (
Fig. 3
and
Table 2
). The ligand with the greatest selectivity was the tLAP1 peptide for the αvβ6 integrin, with a minimum of ~3000-fold selectivity observed over αvβ1, αvβ3, αvβ5, and αvβ8. tLAP1pKI values generated for αvβ1, αvβ3, αvβ5, and αvβ8 were comparable (
Table 2
). Cilengitide was selective for the αvβ1, αvβ3, and αvβ5 integrins compared with αvβ6 and αvβ8 (up to 1 µM). Cilengitide demonstrated a comparable affinity for αvβ3 and αvβ5 with αvβ1 affinity ~9-fold and 19-fold less than αvβ5 and αvβ3, respectively. The novel small-molecule RGD mimetic compound B exhibited selectivity for αvβ6 over the other integrins tested by at least 93-fold.
The selectivity profiles of arginyl-glycinyl-aspartic acid (RGD) ligands for the αvβ1, αvβ3, αvβ5, αvβ6, and αvβ8 integrins determined by competition binding studies. Full competition binding curves were generated by incubating unlabeled integrin ligand at a range of concentrations with the αvβ1, αvβ3, αvβ5, αvβ6, or αvβ8 soluble integrin protein and [3H]compound A. Plates were then filtered after a 2-h (αvβ5 and αvβ8) or 6-h (αvβ1, αvβ3, and αvβ6) incubation, and the amount of radioligand bound to integrin was measured by liquid scintillation spectroscopy. Total and nonspecific binding values were measured in the presence of vehicle (1% DMSO) and 10 µM SC-68448, respectively, and were used to calculate the percent inhibition of radioligand bound to each integrin tested. Competition binding data were fitted using nonlinear regression analysis (four-parameter logistic equation with variable slope29). Competition binding curves are shown for SC-68448 (A), tLAP1 (B), cilengitide (C), compound A (D), and compound B (E) against αvβ1, αvβ3, αvβ5, αvβ6, and αvβ8. Competition binding displacement curve data are the mean ± SEM of at least four individual experiments carried out in singlicate and were used to generate the pKI values shown in
Table 2
.
Selectivity Profiles of a Range of Integrin Small-Molecule RGD Mimetics and Peptides against the αvβ1, αvβ3, αvβ5, αvβ6, and αvβ8 Integrins Determined by Competition Binding Studies.
pKI
αv Integrin
αvβ1
αvβ3
αvβ5
αvβ6
αvβ8
SC-68448
7.51 ± 0.09
8.89 ± 0.09
8.07 ± 0.08
8.56 ± 0.05
6.98 ± 0.04
Compound A
7.14 ± 0.02
8.75 ± 0.04
7.64 ± 0.03
8.62 ± 0.03
7.81 ± 0.04
tLAP1
5.40 ± 0.05
5.62 ± 0.09
4.77 ± 0.01
8.70 ± 0.07
5.07 ± 0.06
Cilengitide
7.10 ± 0.16
8.39 ± 0.24
8.04 ± 0.30
<6.35
<6.15
Compound B
8.61 ± 0.09
8.03 ± 0.05
8.48 ± 0.09
10.6 ± 0.04
8.45 ± 0.05
Competition binding data were fitted using nonlinear regression analysis (four-parameter logistic equation with variable slope29; see Data Analysis section). IC50 values generated from competition binding curves against [3H]compound A were converted to KI values using the Cheng-Prusoff equation15 (see Data Analysis section). Data shown are mean values ± SEM for at least four individual determinations generated from the data shown in
Figure 3
. pKI, negative log10 of KI.
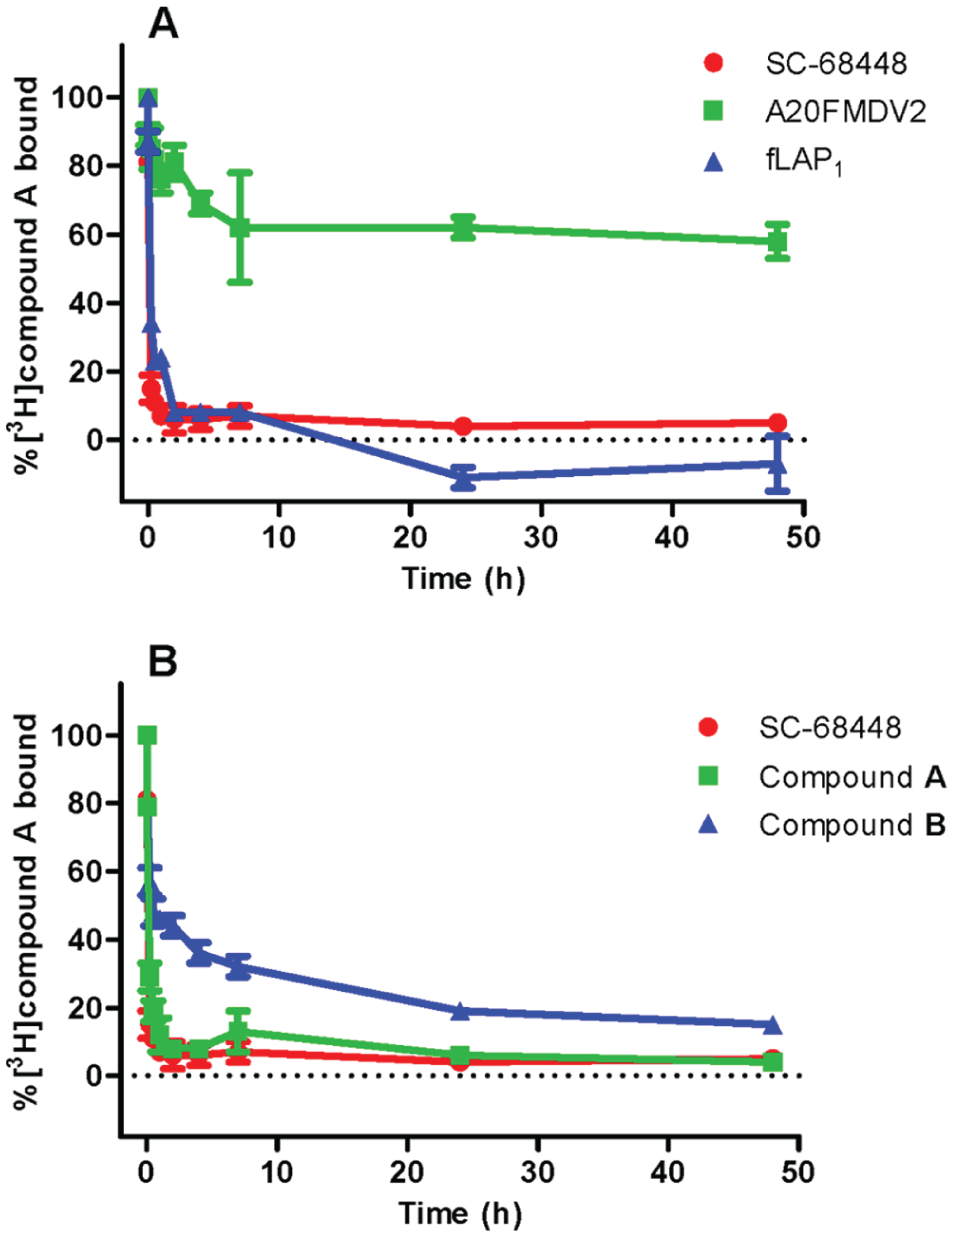
Dissociation Binding Kinetics of Unlabeled Ligands from the αvβ6 Integrin
To allow the ranking of unlabeled ligands in terms of rate of dissociation from the αvβ6 integrin, a novel methodology was developed where the association of [3H]compound A was used as a surrogate for the dissociation of an unlabeled ligand from a preformed unlabeled ligand/integrin complex. Using this method, the dissociation profiles observed for compound A (fast and full dissociation) and A20FMDV2 (slow and partial dissociation) closely matched those observed for the radiolabeled forms of these ligands19 (
Fig. 1C
). SC-68448, compound A, and fLAP1 all had similar fast dissociation profiles (t1/2 values of 5.1, 9.3, and 14.2 min, respectively) while the profile of compound B was much slower (t1/2 value of 121.3 min) in comparison (
Fig. 4
).
Dissociation binding kinetics of unlabeled small-molecule arginyl-glycinyl-aspartic acid (RGD) mimetics and peptides from human αvβ6 integrin. Dissociation of unlabeled ligands from the soluble αvβ6 integrin protein was initiated (following a 1-h preincubation with integrin) by addition of 50 × KD (~50 nM) [3H]compound A. Plates were then filtered after the time indicated, and the amount of radioligand bound to αvβ6 was measured by liquid scintillation spectroscopy. Total and nonspecific binding values were measured at each time point in the presence of vehicle (1% DMSO) and 10 µM SC-68448, respectively, and were used to calculate the percent inhibition of radioligand bound to the αvβ6 integrin. Data shown are the mean ± SEM of at least four individual experiments carried out in quadruplicate.
Discussion
Compound A is a small-molecule compound that was discovered as part of a drug discovery structure-activity relationship (SAR) screening campaign to identify αvβ6 integrin RGD mimetics. Screening data on compound A completed in cell adhesion assays had shown it to be a pan-αv molecule that inhibited the binding of αvβ1, αvβ3, αvβ5, αvβ6, and αvβ8 with comparable IC50 values (all comparisons made between IC50 values at these integrins resulted in 1.0- to 2.5-fold differences). As a result of this, compound A was chosen to be radiolabeled with [3H] to allow an in-depth characterization of the binding profile of a small-molecule RGD mimetic with αvβ6 and other RGD-directed integrins. Data presented in this study have shown that [3H]compound A binds to the αvβ6 RGD binding site with high affinity, which has been confirmed by the lack of binding to αvβ6 in the presence of high concentrations of RGD peptides (tLAP1 and A20FMDV2). The mode of binding of [3H]compound A with the αvβ6 RGD binding site has been shown to be a simple, competitive, and reversible interaction. Association with the αvβ6 RGD binding site is relatively fast in terms of an association rate constant for a ligand-protein/receptor interaction. Following a preincubation with integrin, to allow the radioligand-integrin complex to form, the radioligand can be fully competed off the integrin by a small-molecule RGD mimetic (SC-68448). In addition, it has been shown that [3H]compound A binds with high affinity to the αvβ3 integrin and with moderate affinity to αvβ1, αvβ5, and αvβ8. The interesting observation from the binding studies is that the selectivity profile for compound A is much different compared with that defined in the cell adhesion studies. In cell adhesion, compound A has a comparable potency between integrins, whereas in binding studies with [3H]compound A, there is a clear difference between αvβ3 and αvβ6 compared with αvβ5 and αvβ8. This highlights the pitfalls of using a panel of cell adhesion assays to define accurate selectivity profiles of unlabeled integrin ligands.
The use of radioligand binding assays to determine affinity with soluble protein preparations for the integrins αvβ1, αvβ3, αvβ5, αvβ6, and αvβ8 has allowed accurate KI values to be calculated by incorporating the KD and the concentration of radioligand ([3H]compound A) present in each competition binding assay, allowing the use of the Cheng-Prusoff equation.15 The comparison of a radioligand binding assay with a cell adhesion assay format for αvβ1, αvβ3, αvβ5, αvβ6, and αvβ8 integrins has not only allowed a direct ligand-integrin affinity to be measured in a simple system redundant of the full cell architecture but, more important, has also allowed a direct comparison between integrins to estimate accurate selectivity profiles of ligands. The shifts observed to higher affinity measurements from cell adhesion to radioligand binding assay are unlikely to be solely due to the Cheng-Prusoff correction, as the radioligand format uses a soluble integrin receptor compared with a whole cell in cell adhesion studies. Consequently, the more complex cell system could result in a lower empirical measure of competitor potency as a result of increased nonspecific binding of unlabeled ligands to cellular proteins or loss of ligand due to cellular uptake mechanisms. As the background cell line (K562) used as the expression system for the integrins is kept constant (except for αvβ1), it could be hypothesized that these mechanisms would be comparable and affect each individual integrin cell adhesion assay to the same degree in terms of reducing the pIC50 value observed. As the fold shifts between cell adhesion and radioligand binding are different between integrins, this suggests that the difference is likely to be due to the type of endogenous ligand used and/or its affinity for the individual integrins. If αvβ1, αvβ3, αvβ5, αvβ6, and αvβ8 all had the same affinity for an endogenous ligand that could be used in all cell adhesion assays at the same concentration, comparisons between integrins from cell adhesion assays could be used to determine an accurate selectivity profile for a ligand. However, this is not the case in the panel of cell adhesion assays shown here where either the affinity of endogenous ligand varies (αvβ1, αvβ3, αvβ6, and αvβ8 with tLAP1) or a different endogenous ligand is used (vitronectin is used for αvβ5 due to the lower affinity LAP1 displays for this integrin). SC-68448 is a small-molecule RGD mimetic that was developed to interact with the αvβ3 integrin as a potential inhibitor of tumor angiogenesis and growth.27 The only data available for this molecule show it profiled against the αvβ3 and αIIbβ3 RGD integrins, where the chemistry efforts were focused on enhancing potency at αvβ3 and selectivity over αIIbβ3 alone.27 However, in this study, SC-68448 has been shown to have pan-activity across αvβ1, αvβ3, αvβ5, αvβ6, and αvβ8, and as far as the authors are aware, this is the first time this has been demonstrated for this molecule. As such, it has been proven to be a useful tool for the investigation of the pharmacology of αv integrins in this study, as well as highlighting its potential for future use.
As part of a medicinal chemistry lead optimization campaign to identify novel, high-affinity, and selective αvβ6 small-molecule RGD mimetics, compound B was selected as being one of the early optimal chemical entities identified. In radioligand binding assays, compound B demonstrated a very high affinity (low pM) and selectivity for the αvβ6 integrin (minimum profile >93-fold selective over αvβ1, αvβ3, αvβ5, and αvβ8), as well as a slow dissociation profile. To generate these data, a number of different experimental designs were investigated to enable optimal profiling of the characteristics of compound B. From the correlation of cell adhesion pIC50 and radioligand binding pKI values, there appeared to be an upper limit of detection in both assays (~8.5 pIC50 and ~10.5 pKI) at which compound B was either close to or at in both formats. In enzymology, a tight binding limit can be observed when the concentration of an enzyme inhibitor required to cause inhibition is close to the concentration of the enzyme in the system.30 To investigate if a similar tight binding limit was being observed with the αvβ6 integrin in radioligand competition binding experiments, the concentration of integrin was lowered to observe if a shift in affinity occurred. To control this experiment, a low-affinity control (SC-68448) was included, and when the concentration of soluble αvβ6 protein was lowered from 0.3 to 0.075 nM (4-fold lower), no change in the affinity was observed. This would be expected for a low-affinity compound that was not at the tight binding limit. However, for compound B, a shift was observed that was shown to be significant.
When the law of mass action is applied to an interaction between a ligand and its protein/receptor binding partner, it has been shown that the ligand’s affinity (KD or KI) is a combination of the ligand’s kinetic constants (koff and kon).18 At steady state, the KD (or KI in an unlabeled ligands case) is defined by the ratio of the koff and kon and generally for membrane-based protein targets is a measure of the likelihood of the ligand-receptor complex to dissociate. Therefore, a high-affinity ligand would be predicted to have a lower koff value and a slower dissociation from the protein/receptor. To test this theory for the αvβ6 integrin and also endeavor to obtain an early estimate of unlabeled ligand dissociation kinetics, a novel radioligand binding assay format was developed. Unlabeled ligands were allowed to form a complex with the αvβ6 integrin for 1 h prior to being competed off the integrin with an excess (50 × KD) of radioligand ([3H]compound A), using the association of the radioligand to measure the dissociation of the unlabeled ligand. Using this method, low-affinity ligands for αvβ6 were shown to dissociate quickly (SC-68448, fLAP1, compound A) and a high-affinity ligand slowly (compound B). This assay format was validated by having compound A and A20FMDV2 characterized as controls. Identical dissociation profiles were observed via this method for compound A and A20FMDV2 compared with the classical methods used for the radiolabeled forms of these ligands.19 The highest affinity ligand compound B was shown to have the slowest dissociation profile from the αvβ6 integrin, and full dissociation was not observed up to 48 h.
When endeavoring to demonstrate an accurate selectivity between integrins, it is imperative to ensure the same divalent metal cations are used between assays and that the cation used is physiologically relevant. The level of binding and affinity observed for a ligand at an αv integrin will depend upon the cation present,20,31 and some nonphysiological cations like Mn2+ will activate the integrin into a high-affinity state, resulting in an overestimate of RGD-ligand affinity. There are examples where nonphysiological cations have been used when comparing selectivity between the αv integrins.32,33 This is acceptable when looking to test a worst-case scenario in terms of lack of binding to an integrin. However, this can be misleading when affinity is demonstrated and then compared between integrins in the presence of high concentrations of nonphysiologically relevant cations (e.g., Mn2+). It is further exacerbated if the extent of the effect of the cation is potentially ligand and/or integrin specific.19,20
In conclusion, as the radioligand binding assays used in this study use the same radioligand, whose affinity and concentration present in the system are precisely known, this technique offers the most accurate method for determining an affinity measurement for integrin ligands at a specific integrin, as well as providing the most accurate selectivity profile. Although the radioligand format is not amenable to the high throughput required for SAR screening, these radioligand binding studies have enabled the relative fold shifts between pIC50 values generated in cell adhesion (as an empirical measure of competitor potency) with pKI values (affinity measure) to be determined. Therefore, in SAR analysis using the high-throughput cell adhesion assays, these fold shifts can now be incorporated to predict an estimated affinity and also selectivity profile for larger sets of novel chemical templates. These have been used to drive lead optimization and deliver selective, high-affinity αvβ6 small-molecule RGD mimetics, with slow dissociation kinetics20 to enable duration of action, as potential therapeutics in IPF and other fibrotic diseases.
Footnotes
Acknowledgements
We thank the Fibrosis and Lung Injury DPU Medicinal Chemistry team and Mr. Nick Shipley at GlaxoSmithKline for compound synthesis and the generation of [3H]compound B. All authors are currently full-time employees of GlaxoSmithKline.
Declaration of Conflicting Interests
The authors declared no potential conflicts of interest with respect to the research, authorship, and/or publication of this article.
Funding
The authors received no financial support for the research, authorship, and/or publication of this article.
References
1.
GoodwinA.JenkinsG.Role of Integrin-Mediated TGFβ Activation in the Pathogenesis of Pulmonary Fibrosis. Biochem. Soc. Trans. 2009, 37, 849–854.
2.
BandyopadhyayA.RaghavanS.Defining the Role of Integrin αvβ6 in Cancer. Curr. Drug Targets2009, 10, 654–652.
SheppardD.The Role of Integrins in Pulmonary Fibrosis. Eur. Respir. Rev. 2008, 17, 157–162.
6.
HoranG. S.WoodS.OnaV.. Partial Inhibition of Integrin Prevents Pulmonary Fibrosis without Exacerbating Inflammation. Am. J. Respir. Crit. Care Med. 2008, 177, 56–65.
7.
TatlerA. L.JenkinsG.TGFβ Activation and Lung Fibrosis. Proc. Am. Thorac. Soc. 2012, 9, 130–136.
8.
WaltersW. P.Going Further Than Lipinski’s Rule in Drug Design. Expert Opin. Drug Discov. 2012, 7, 99–107.
9.
FriedlanderM.BrooksP. C.ShafferR. W.. Definition of Two Angiogenic Pathways by Distinct αv Integrins. Science1995, 270, 1500–1502.
10.
EliceiriB. P.ChereshD. A.The Role of αv Integrins during Angiogenesis. Mol. Med. 1998, 4, 741–750.
11.
TravisM. A.ReizisB.MeltonA. C.. Loss of Integrin αvβ8 on Dendritic Cells Causes Autoimmunity and Colitis in Mice. Nature2007, 449, 361–365.
12.
BarryS. T.LudbrookS. B.MurrisonE.. A Regulated Interaction between α5β1 Integrin and Osteopontin. Biochem. Biophys. Res. Commun. 2000, 267, 764–769.
13.
LudbrookS. B.BarryS. T.DelvesC. J.. The Integrin αvβ3 Is a Receptor for the Latency-Associated Peptides of Transforming Growth Factors β1 and β3. Biochem. J. 2003, 369, 311–318.
14.
HausnerS. H.DiCaraD.MarikJ.. Use of a Peptide Derived from Foot-and-Mouth Disease Virus for the Noninvasive Imaging of Human Cancer: Generation and Evaluation of 4-[18F]Fluorobenzoyl A20FMDV2 for In Vivo Imaging of αvβ6 Integrin Expression with Positron Emission Tomography. Cancer Res. 2007, 67, 7833–7840.
15.
ChengY.PrusoffW. H.Relationship between the Inhibition Constant (KI) and the Concentration of Inhibitor Which Causes 50 Per Cent Inhibition (I50) of an Enzymatic Reaction. Biochem. Pharmacol. 1973, 22, 3099–3108.
16.
LiuY.PanY.XuY.Binding Investigation of Integrin αvβ3 with Its Inhibitors by SPR Technology and Molecular Docking Simulation. J. Biomol. Screen. 2010, 15, 131–137.
17.
CopelandR. A.PomplianoD. L.MeekT. D.Drug-Target Residence Time and Its Implication for Lead Optimization. Nat. Rev. Drug Discov. 2006, 5, 730–739.
18.
HulmeE. C.TrevethickM. A.Ligand Binding Assays at Equilibrium: Validation and Interpretation. Br. J. Pharmacol. 2010, 161, 1219–1237.
19.
SlackR. J.HafejiM.RogersR.. Pharmacological Characterization of the αvβ6 Integrin Binding and Internalization Kinetics of the Foot-and-Mouth Disease Virus Derived Peptide A20FMDV2. Pharmacology2016, 97, 114–125.
20.
HallE. R.BibbyL. I.SlackR. J.Characterisation of a Novel, High Affinity and Selective αvβ6 Integrin RGD-Mimetic Radioligand. Biochem. Pharmacol. 2016, 117, 88–96.
21.
WongA.HwangS. M.McDevittP.. Studies on αvβ3/Ligand Interactions Using a [3H]SK&F-107260 Binding Assay. Mol. Pharmacol. 1996, 50, 529–537.
22.
EggerL. A.CaoJ.McCallumC.. A Small Molecule α4β1/α4β7 Antagonist Differentiates between the Low-Affinity States of α4β1 and α4β7: Characterization of Divalent Cation Dependence. J. Pharmacol. Exp. Ther. 2003, 306, 903–913.
23.
LoganD.Abu-GhazalehR.BlakemoreW.. Structure of a Major Immunogenic Site on Foot-and-Mouth Disease Virus. Nature1993, 362, 566–568.
24.
LozzioC. B.LozzioB. B.Human Chronic Myelogenous Leukemia Cell-Line with Positive Philadelphia Chromosome. Blood1975, 45, 321–334.
25.
LieberM.SmithB.SzakalA.. A Continuous Tumor-Cell Line from a Human Lung Carcinoma with Properties of Type II Alveolar Epithelial Cells. Int. J. Cancer1976, 17, 62–70.
26.
YatohgoT.IzumiM.KashiwagiH.. Novel Purification of Vitronectin from Human Plasma by Heparin Affinity Chromatography. Cell Struct. Funct. 1998, 13, 281–292.
27.
CarronC. P.MeyerD. M.PeggJ. A.. A Peptidomimetic Antagonist of the Integrin αvβ3 Inhibits Leydig Cell Tumor Growth and the Development of Hypercalcemia of Malignancy. Cancer Res. 1998, 58, 1930–1935.
28.
ScatchardG.The Attractions of Proteins for Small Molecules and Ions. Ann. N. Y. Acad. Sci. 1949, 51, 660–672.
29.
HillA. V.The Mode of Action of Nicotine and Curari, Determined by the Form of the Contraction Curve and the Method of Temperature Coefficients. J. Physiol. 1909, 39, 361–373.
PlowE. F.HaasT. A.ZhangL.. Ligand Binding to Integrins. J. Biol. Chem. 2000, 275, 21785–21788.
32.
ReedN. I.JoH.ChenC.. The αvβ1 Integrin Plays a Critical In Vivo Role in Tissue Fibrosis. Sci. Transl. Med. 2015, 7, 1–8.
33.
KappT. G.RechenmacherF.NeubauerS.. A Comprehensive Evaluation of the Activity and Selectivity Profile of Ligands for RGD-Binding Integrins. Sci. Rep. 2017, 7, 39805.