
Abstract
Primary hyperoxaluria is the underlying cause of oxalosis and is a life-threatening autosomal recessive disease, for which treatment may require dialysis or dual liver-kidney transplantation. The most common primary hyperoxaluria type 1 (PH1) is caused by genetic mutations of a liver-specific enzyme alanine:glyoxylate aminotransferase (AGT), which results in the misrouting of AGT from the peroxisomes to the mitochondria. Pharmacoperones are small molecules with the ability to modify misfolded proteins and route them correctly within the cells, which may present an effective strategy to treat AGT misrouting in PH1 disorders. We miniaturized a cell-based high-content assay into 1536-well plate format and screened ~4200 pharmacologically relevant compounds including Food and Drug Administration, European Union, and Japanese-approved drugs. This assay employs CHO cells stably expressing AGT-170, a mutant that predominantly resides in the mitochondria, where we monitor for its relocation to the peroxisomes through automated image acquisition and analysis. The miniaturized 1536-well assay yielded a Z′ averaging 0.70 ± 0.07. Three drugs were identified as potential pharmacoperones from this pilot screen, demonstrating the applicability of this assay for large-scale high-throughput screening.
Introduction
Primary hyperoxaluria (PH) is a rare autosomal recessive hereditary disorder for which patients cannot efficiently metabolize glyoxylate in liver, leading to the accumulation of calcium oxalate stones in the kidney and urinary tract.1,2 About 80% of PH presents as PH1, which is caused by the deficiency of a liver-specific enzyme alanine:glyoxylate aminotransferase (AGT).2–4 AGT is a vitamin B6–dependent enzyme that resides in the peroxisome and catalyzes the transamination of glyoxylate to glycine. 5 AGT contains a C-terminal peroxisomal targeting sequence, but mutations generate a strong N-terminal mitochondrial targeting sequence that directs AGT to mitochondria.6–8 Mutations in the AGT gene have been demonstrated to cause protein misfolding and misrouting of AGT from peroxisome to the mitochondria.9–11 Although mistargeted AGT remains catalytically active in the mitochondria, the enzyme must be in the peroxisome to detoxify glyoxylate and prevent oxalate accumulation. 9 This is because most of its substrate (i.e., glyoxylate) is synthesized in the peroxisomes. Deficiency of AGT in the peroxisomes prevents metabolizing glyoxylate to glycine, which enables glyoxylate to diffuse into the cytosol, where it is oxidized to the metabolic end product oxalate, a reaction catalyzed by lactate dehydrogenase. 1 Ultimately, PH1 results in chronic kidney failure and systemic oxalosis, which requires expensive, intrusive, and risky procedures, such as dialysis and liver-kidney transplantation. 12 Thus, the development of more effective and affordable therapies for patients suffering from PH1 is important.
Cell-permeable small-molecule pharmacoperones, which may serve as molecular scaffolding, are able to bind selectively to biosynthetic intermediates or conformational defective proteins to correct the folding and allow the rerouting to their site of action in the cell. G protein–coupled receptors have been exploited in this sense using high-throughput screening (HTS) to discover pharmacoperones, with promising lead scaffolds identified for the vasopressin 2 receptor and the gonadotropin-releasing hormone receptor.13–17 Therefore, it is not inconceivable that the therapeutic rescue of misfolded/mistrafficked AGT mutant by pharmacoperones is possibly a potentially safer strategy for PH1 treatment. Further, as with other pharmacoperones targets, 18 it is also conceivable that a single drug would be effective on multiple AGXT mutants.
In this study, we used a CHO cell model previously established in another lab. In one cell line, glycolate oxidase (GO) and AGT-mi, defined as normal human AGT encoded by the “minor” AGXT allele, containing P11L/I340M mutations, was expressed. In a separate cell line, AGT-170, defined as human mutant AGT on the background of the minor allele, containing P11L/G170R/I340M mutations, was stably expressed. 9 Note that CHO cells do not normally express GO or AGT. Multiple former studies proved that human hepatocyte glycoxylate metabolic pathways have been successfully reconstructed in this GO and AGT double-transformed CHO cell model.7,9,19 AGT-mi is mainly present in peroxisome, whereas AGT-170 is mainly located in mitochondria, with a minority in peroxisome. 9 In the GO/AGT-170 double-transformed CHO cell model, glycolate is converted into glyoxylate by peroxisomal GO. In the absence of functional AGT in peroxisome, glyoxylate is transported to the cytosol, and native lactate dehydrogenase from CHO cells converts glyoxylate to oxalate, leading to the manifestations of PH1. We previously developed a low-throughput phenotypic microscopy-based 384-well assay that detects the colocalization of AGT with the peroxisomes in this pathophysiologically relevant GO/AGT-170 CHO cell model. To reduce costs and increase throughput, we further miniaturized this high-content assay in 1536-well plate format and demonstrated its robustness and ability to identify pharmacoperones that can rescue AGT-170 misrouting. We confirmed its HTS readiness to screen larger libraries in a fully automated manner through a pilot screen of ~4200 drugs. The end result was the identification of three initial hits that were expanded to include other relevant analogs. These were shown to reproduce activity, which drove us to further characterize one drug, monensin, by Western blot analysis. Taken together, this has bolstered our confidence for future high-content assay screening to discover therapeutic pharmacoperones for PH1-related oxalosis.
Materials and Methods
Cell Culture
The CHO-GO (glycolate oxidase) cell lines stably expressing the AGT-mi or AGT-170 variants were described elsewhere.7,9,19 Cells were routinely cultured in Ham’s F12 medium (Thermo Fisher Scientific, part No. 11765-062) supplemented with 10% fetal bovine serum (Hyclone, part No. SH3054103), 100 U/mL penicillin, 100/mL streptomycin, and 0.25/mL amphotericin B (antibiotic-antimycotic mix, Thermo Fisher Scientific, part No. 15240062), as well as 400/mL zeocin (Thermo Fisher Scientific, part No. R25005) and 800/mL G418 (Thermo Fisher Scientific, part No. 10131027) for selection.
Compound Library
A set of ~4200 compounds including ~3000 Food and Drug Administration (FDA), European Union (EU), and Japanese-approved drugs from our library was used for the pilot screen. The remainder of the compounds comprised the NCI-114 collection and LOPAC1280 collection from Sigma Aldrich (St. Louis, MO). Compounds were plated as 1 mM solutions in DMSO. The final nominal compound concentration in the assay was ~10 µM, and the final DMSO concentration was 0.75%.
Optimized 1536-Well Plate Assay Protocol
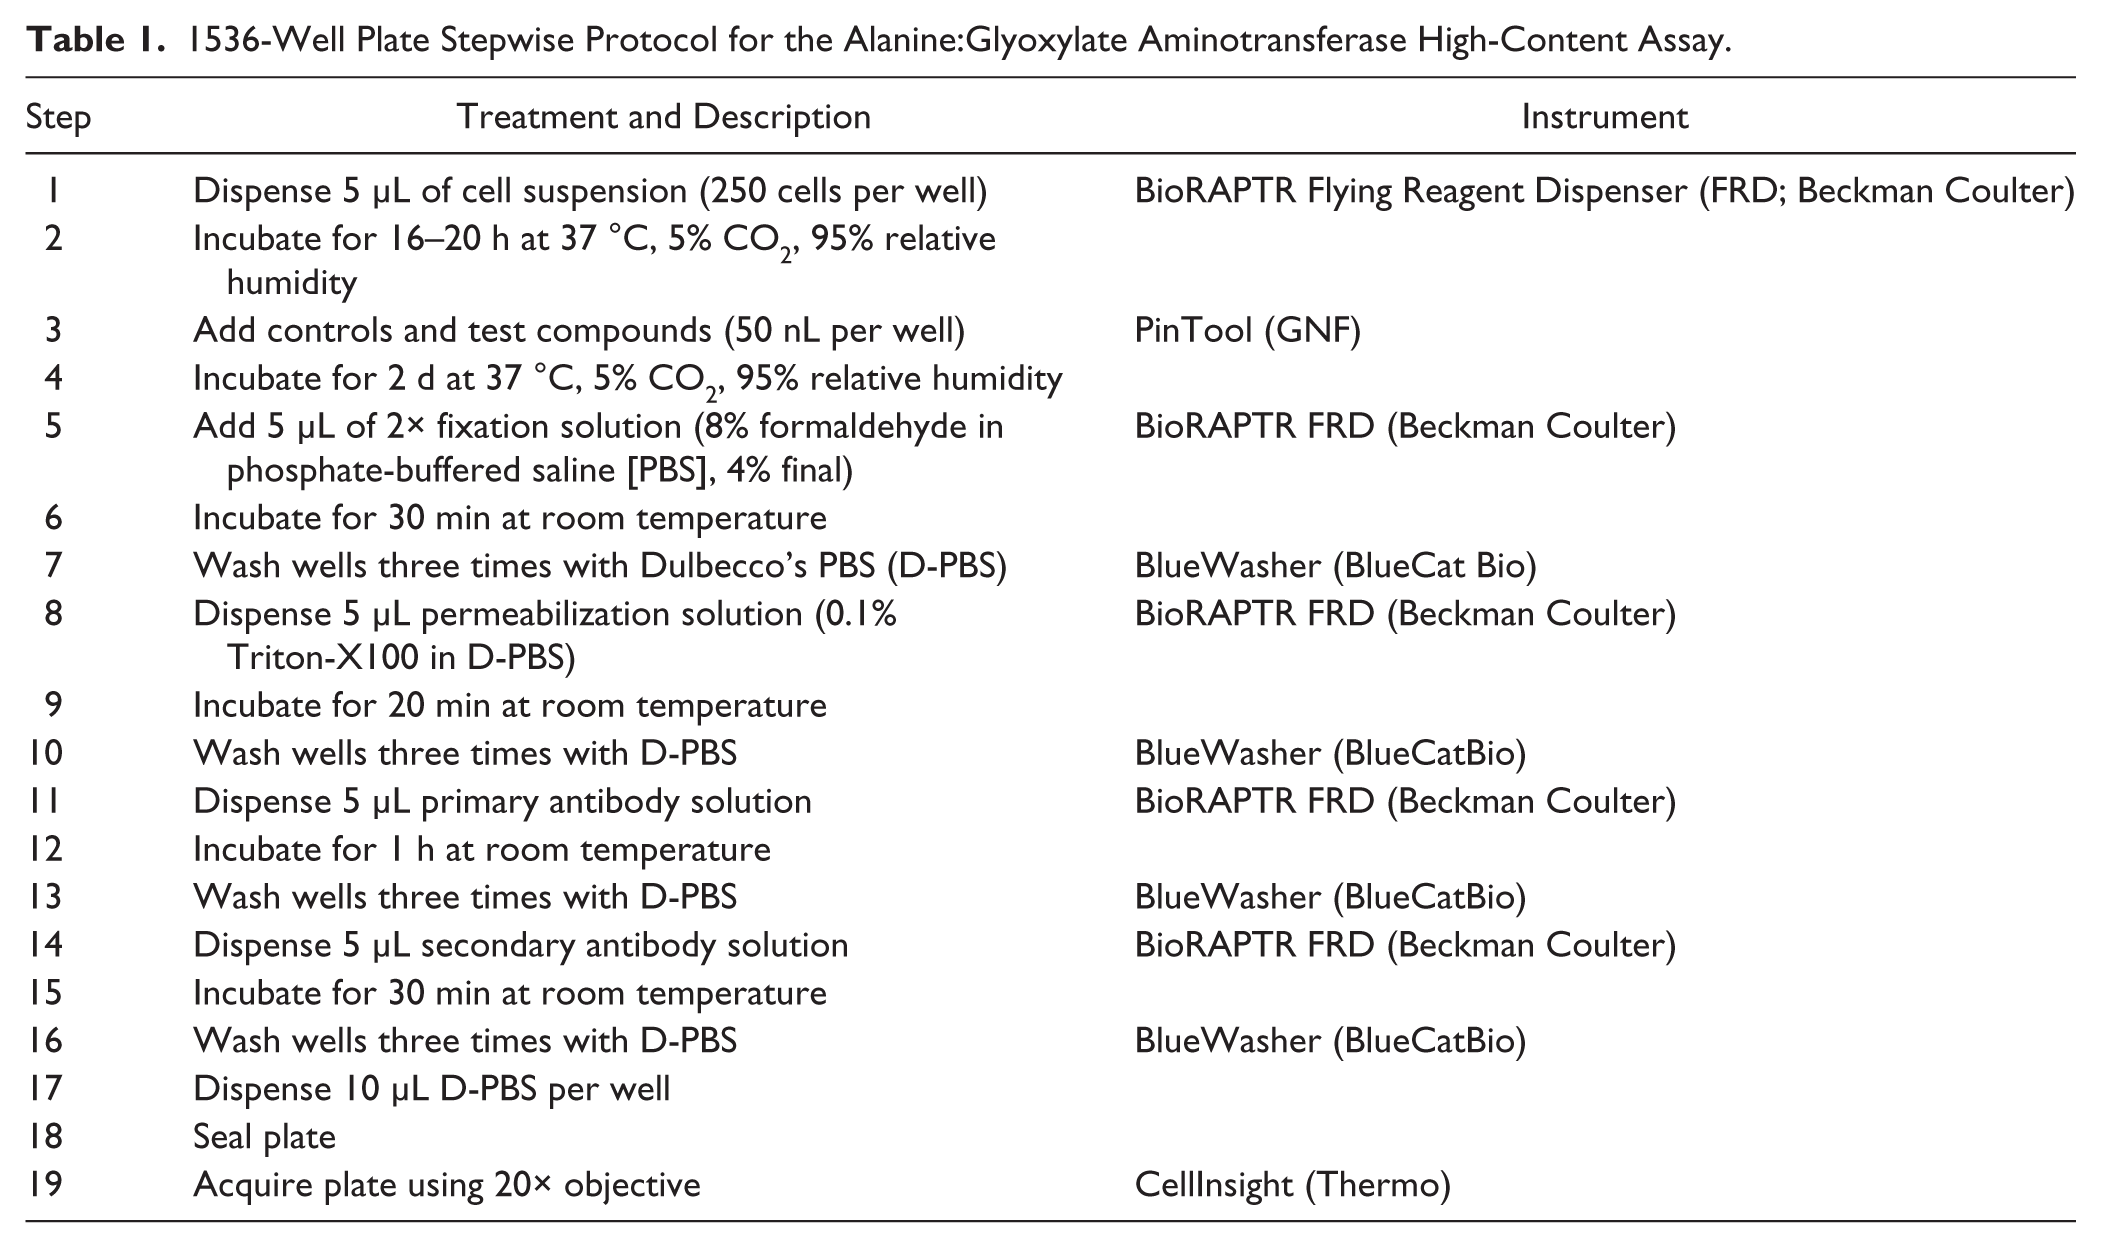
A detailed stepwise protocol is presented in Table 1 . Briefly, 5 µL of CHO-GO cells stably expressing AGT-170 (and AGT-mi that serve as a positive control) were seeded in black, square IQ 1536-well plates (Aurora Inc., part No. 00019326) at 250 cells per well using a Flying Reagent Dispenser (Beckman Coulter). After an overnight incubation at 37 °C, 95% relative humidity (RH), and 5% CO2, cells were treated with 50 nL test compounds or DMSO using a pintool transfer unit (Kalypsys/GNF). Plates were incubated for 2 d at 37 °C, 95% RH, and 5% CO2 and immunostained, and images were acquired on a high-content reader as described below.
1536-Well Plate Stepwise Protocol for the Alanine:Glyoxylate Aminotransferase High-Content Assay.
Immunostaining, Image Acquisition and Analysis
The BlueWasher (BlueCatBio), which employs centrifugation instead of aspiration for noncontact and contamination-free removal of liquids, was implemented for all wash steps. Otherwise, the staining method was exactly the same as described previously, adjusting volumes for the 1536-well format, as shown in Table 1 . 20
The CellInsight high-content reader (Thermo Fisher Scientific, Pittsburgh, PA) was configured to handle the 1536-well plates, which were imaged using a 20× objective collecting five fields of view per well. A detailed and illustrated description of the image acquisition and analysis is presented in Figure 1 . The primary camera focus was done by nuclear identification aided by Hoechst using the 386 nm channel at 9.8 ms exposure time (blue, channel 1). Punctae labeled with the anti-PMP70 antibody, which labels peroxisomes, and the anti-AGT antibody were identified by acquiring the green (channel 2: 485 nm, 36.6 ms exposure) and red (channel 3: 549 nm, 89.5 ms exposure) channels, respectively. Further analysis involved nuclei detection using the Isodata threshold method, which provides the value used in the valid object count analysis. Next, a cytoplasmic region of interest was created around each nucleus by implementing a ring with a distance of one pixel from the nucleus and a width of eight pixels. Both peroxisomes and AGT proteins were identified as punctae, referred to here as target I and II, in the cytoplasmic region of interest using the Isodata threshold with value equal to 0. Similar to the 384-well detection, colocalization of the two populations of punctae was determined using the Cellomics’ Colocalization BioApplication; the output feature is called %HIGH_ROI_A_ColocCoefAreaTarget_II, which describes the percentage of cells in the acquired fields of view whose area colocalization coefficient value is above the “LevelHigh” threshold. This feature of area colocalization coefficient provides information on the contribution of target II’s area to the colocalized pixels of the two targets within ROI_A, which is calculated using the following equation:
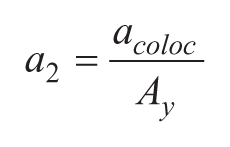
where a2 is the contribution from target II, acoloc is the colocalized pixels of target I and target II, and Ay is the total area of target II.
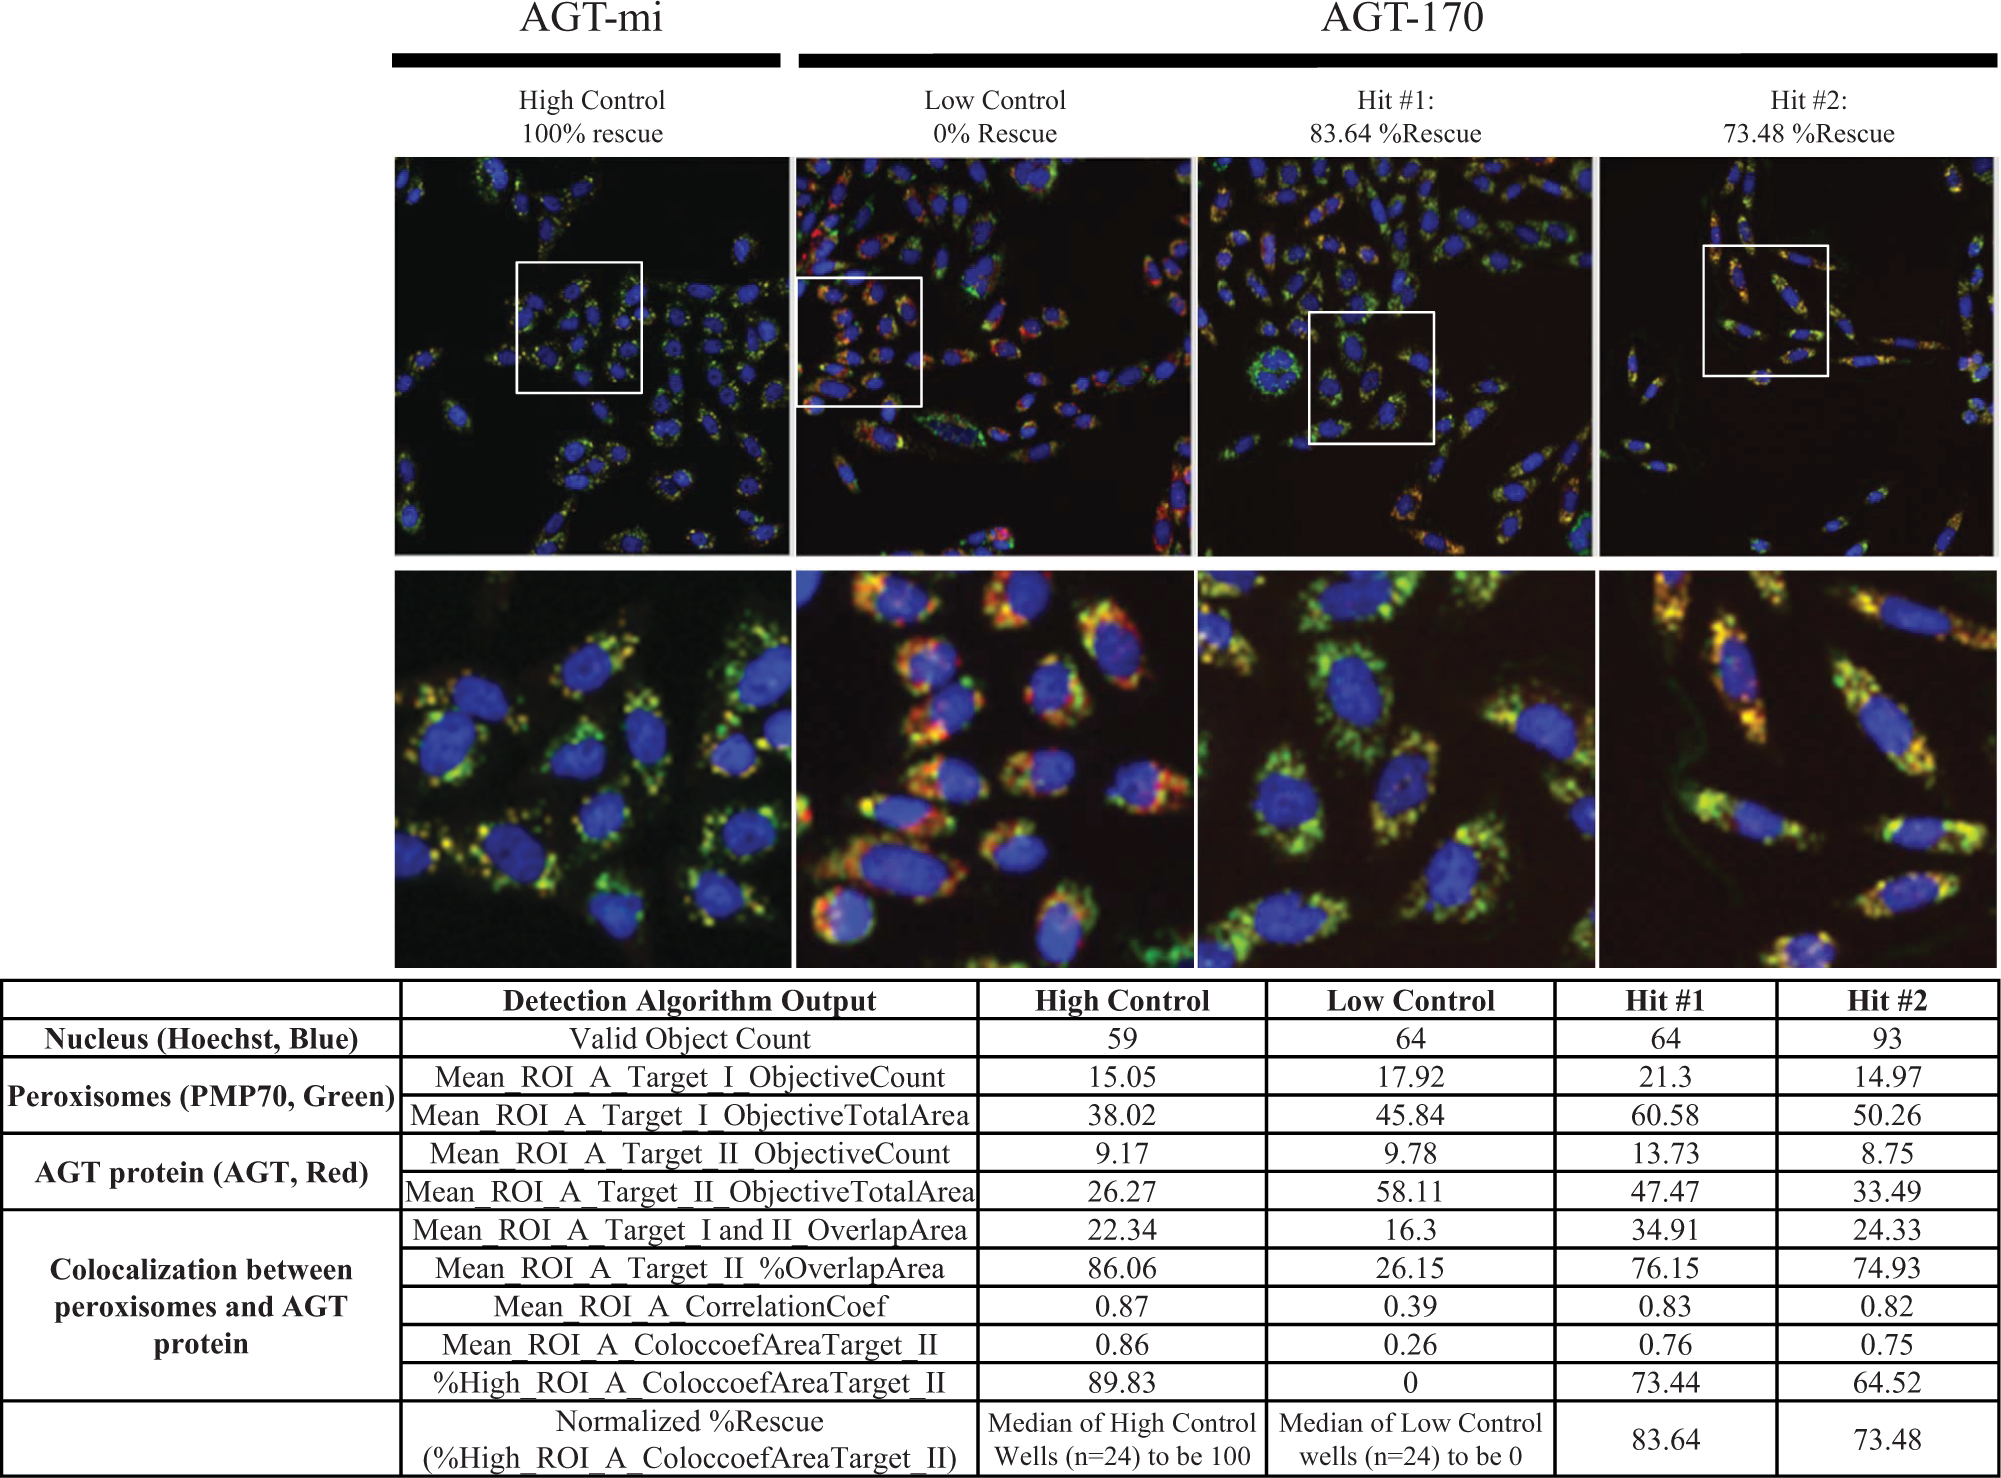
Automated image acquisition and analysis to evaluate the differential colocalization of AGT-mi and AGT-170 within the peroxisomes on the CellInsight high-content reader using a 20× objective. Three channels were used for this application: Hoechst-stained nuclei in blue, anti-PMP/AF488-labeled peroxisomes in green, and anti-AGT/AF546 immunostaining of AGT in ted. Depicted are the red, green, and blue (RGB) composite images of CHO-K1 cells stably expressing the AGT-mi treated with DMSO as high control (100% rescue) or AGT-170 treated with DMSO as low control (0% rescue) and two of the top hits identified from the pilot screen. The white boxes in the RGB composite images represent the area shown in the expanded view just below. Important outputs from the detection algorithm associated with the three channels are listed below the RGB images. The overlap between the immunostaining of the peroxisomes and AGT was calculated and reported as %HIGH_ROI_A_ColocCoefAreaTarget_II, which describes the percentage of cells in the well whose area colocalization coefficient value is above the “LevelHigh” threshold. The top two hits achieved 83.64% and 73.48% activity in rescuing mistargeted AGT-170 to the peroxisome when tested at 10 µM. Note that the value of each algorithm for high control or low control represents that specific well, whereas the %Rescue of hit compounds is normalized based on all the high-control wells and low-control wells (n = 24 for each control group).
Data Management and HTS Data Analysis
Images and data were automatically spooled to the STORE database (Thermo/Cellomics) hosted on Scripps’s HTS server. The well features generated by the detection algorithm, including the %HIGH_ROI_A_ColocCoefAreaTarget_II, were exported and processed as described before. 20 Reader files were then uploaded into Scripps’ Drug Discovery database (Symyx Assay Explorer). Plate Z-factor and Z′-factor were automatically calculated as previously described.21,22 Assay results were normalized on a per-plate basis using the following equation:
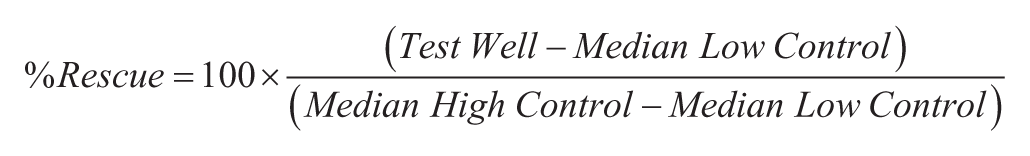
where High Control represents the well containing AGT-mi cells treated with DMSO (n = 24 per plate) and Low Control represents the well containing AGT-170 cells also treated with DMSO (n = 24 per plate).
Immunoblotting
The CHO-GO cells expressing either AGT-mi or AGT-170 were treated with 0.5 µM monensin, a concentration found sufficiently below its cytotoxicity level to the cells, or DMSO after they reached 50% confluence in Hyperflask (Corning, Inc., part No. 10020), and were further harvested for cell lysate, mitochondria, and peroxisome fractions after 2-d incubation at 37 °C, 5% CO2, and 95% RH. Commercial kits were used to isolate the organelle fractions (Thermo Fisher Scientific No. 89874 for mitochondria and Sigma Aldrich No. PEROX1 for peroxisome). The total protein concentrations of sonicated fractions were determined using Pierce BCA Protein Assay Kit (Thermo Fisher Scientific, part No. 23225), and each sample was quantified a minimum of three times to ensure accuracy of the concentration measurements. For each fraction, 0.3 µg of protein was loaded per lane on NuPage Mini gel 10% Bis-Tris protein gels (Thermo Fisher Scientific, part No. NP0301BOX), and the gel was run using the Invitrogen X Cell Surelock-Mini Cell system. Following transfer to iBlot nitrocellulose Transfer Stack (Thermo Fisher Scientific, part No. IB3010), the membrane was blocked with 5% bovine serum albumin in TBST and then incubated, separately, with three different primary antibodies in separate trays (guinea pig anti-AGT A1 antibody, obtained from Chris Danpure’s Laboratory, University College of London, 1:10,000; rabbit anti-PMP70 antibody: Abcam No. ab3421, 1:2000; mouse anti-HSP70 antibody: Thermo Fisher Scientific No. MA3-028, 1:2000). The membrane was washed with PBST five times for 5 min each before the incubation of secondary antibody (Thermo Fisher Scientific: goat anti-guinea pig/HRP: No. A18775, 1:2000; goat anti-rabbit/HRP: No. 32440, 1:100; goat anti-mouse/HRP: No. 31432, 1:3000). After the thorough wash, the signal was detected using Pierce ECL detection substrate (Fisher Scientific, part No. PI32106) and autoradiography.
Results and Discussion
Assay Miniaturization to the 1536-Well Plate Format
In the previously published 384-well format AGT assay, 500 cells in 25 µL were seeded into each well and incubated for 3 d after compound treatment. Here, in the 1536-well assay, in which 5 µL per well of cells was plated, evaporation-related edge effect becomes a potential issue. To avoid such issues in 1536-well format and to conform to previously published methods, 7 we reduced the incubation time from 3 d to 2 d and found the optimal cell number for seeding was 250 cells per well for the 2-d incubation. For the 1536-well image acquisition, five fields of view per well were acquired, yielding an average of ~80 cells detected per field at 2 d postseeding. As summarized in Table 1 , there are seven dispensing steps plus four washing steps (three washes per step) in this immunostaining-based assay. Knowing that plate washing might greatly affect the assay performance, we incorporated the BlueWasher that uses gentle centrifugation instead of aspiration to reduce residual volumes to near zero as well as to prevent carry-over contamination between wells for all wash steps.
Detection Algorithm Optimization
The Thermo Colocalization BioApplication computes and reports several output features, such as colocalization coefficient, intensity, and area-based colocalization measurement. These features are reported for each selected well. In addition, many other well features are derived from the algorithm when applied to cellular images, such as mean, standard deviation (SD), coefficient of variation (CV), %High, and %Low. One important feature named valid object count, which detects the valid primary objects in a field (i.e., the cell number per field of view quantified by nuclear identification in this application), is a quick indicator of cell seeding and health and can also be used to observe preliminarily a compound’s cytotoxicity on the cells, as shown in Supplemental Figure S1 .
The goal of this assay was to find an effective pharmacoperone that redirects AGT-170 to peroxisome. To do this, we exploited the ability to simultaneously detect the colocalization between AGT and PMP-70 labeled in the peroxisome, which then can be considered a direct measurement of AGT trafficking. Six colocalization-related measurements were compared in terms of assay quality ( Fig. 2A ). A Z′ statistic was required to be greater than 0.5 in order for a plate to be considered of sufficient quality and to pass for further compound activity analysis. The Z′ was calculated using AGT-mi cells as the high control (viewed as 100% overlap or rescue) and AGT-170 cells as the low control (viewed as 0% overlap or rescue). For example, using a plate treated only with DMSO in the sample field, Z is calculated using the high control versus the sample field (n = 1280 wells), which, when optimal, is nearly identical to Z′. In addition, the sample field is expected to be very tight and also aligned with the low control, which requires the mean of the sample field to be close to 0 after data normalization and the SD of the sample field to be as small as possible. Therefore, a low hit cutoff calculated using the mean + 3SD rule is preferred. As shown, based on the above analysis, %High_ROI_A_ColocCoefAreaTarget_II was identified as the optimal detection feature.
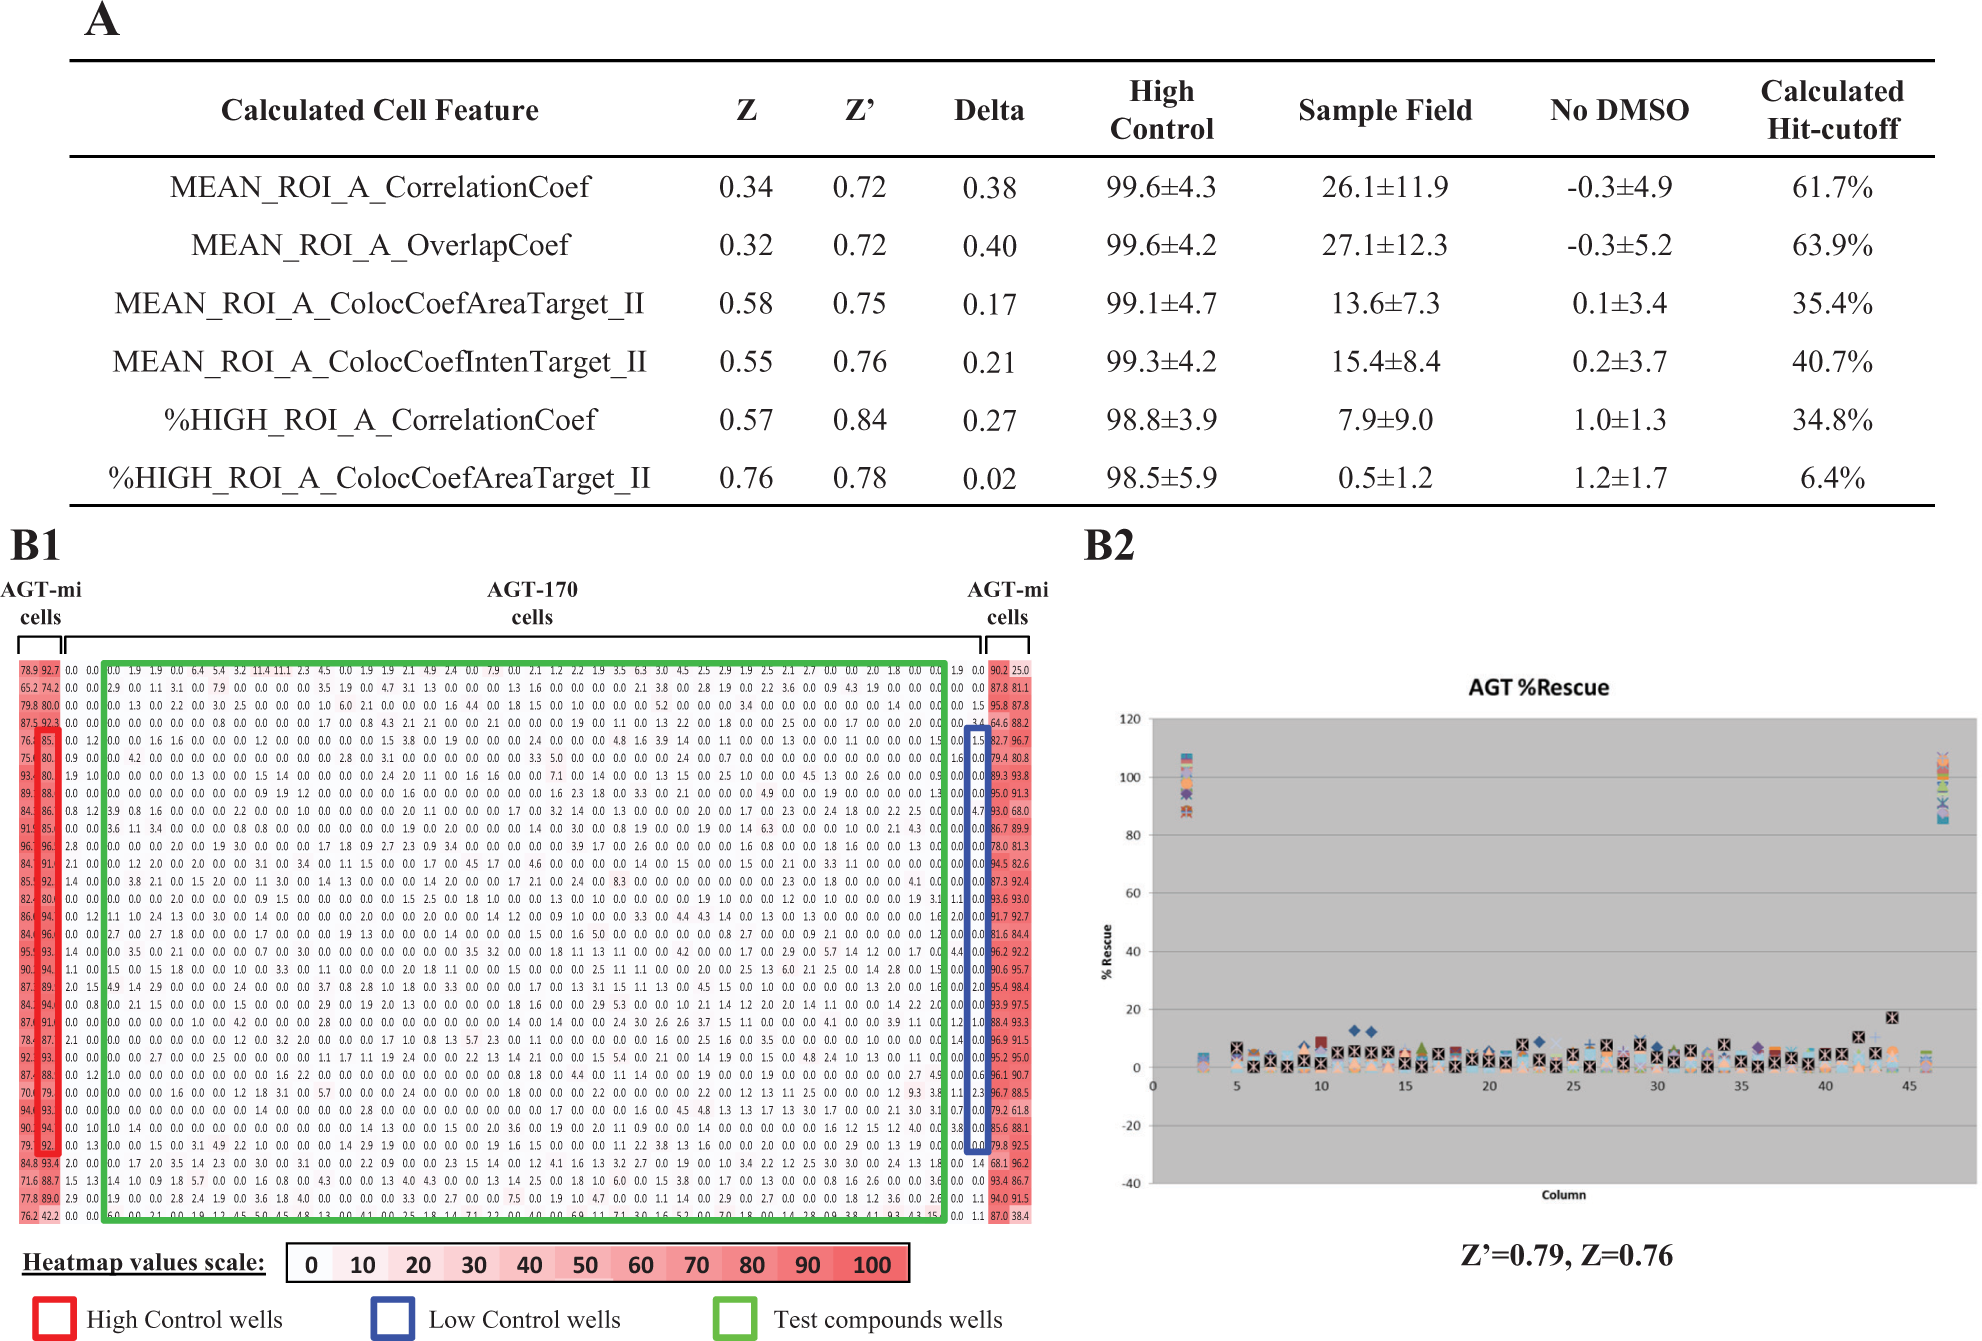
Detection algorithm optimization in a 1536-well assay. (
The optimized assay protocol and detection algorithm was used for the rest of this study. The plate map and scatter plot of a DMSO-treated plate is shown as an example in Figure 2B . This plate did not show any edge effect, positional effects, or outliers in the sample filed. A tight scatter plot of sample field and excellent Z′ of 0.79 and Z of 0.76 demonstrated the robustness of the miniaturized assay and readiness for pilot screening. Compared with the previously reported 384-well AGT assay, our 1536-well format reduces the reagent cost by approximately fivefold while increasing throughput by about fourfold without sacrifice to data quality.
Screening of the Approved Drug Collection
To evaluate the suitability of this 1536-well AGT assay to discover potential pharmacoperones that can rescue AGT-170 misrouting, a pilot screen of ~4200 compounds including ~3000 FDA-, EU-, and Japanese-approved drugs; the NCI -114 collection; and LOPAC1280 collection was performed. The final nominal tested compound concentration was 10 µM, and the final DMSO concentration was 0.75%. Previously, the LOPAC library of 1280 compounds was screened using the 384-well assay. 20 To validate the 1536-well assay and evaluate the correlation between 384-well format and 1536-well format, the LOPAC set was also included in this screen. A total of nine 1536-well assay plates were assessed in this screen, which consisted of triplicate screening at a single concentration for the LOPAC and single-well, single-concentration screening for three approved drug plates. The NCI 114 oncology drugs were tested in 10-point threefold dose-response format. With an average Z′ of 0.70 ± 0.07, this pilot screen achieved satisfactory assay statistics, which warranted further analysis. The scatterplot of the normalized result in the pilot screen is shown in Figure 3 . The standard cutoff calculated based on the average + 3SD of all samples tested, which was found to be at 9.4%, had identified 58 compounds, many of which were very close to the noise of the assay. To address the compounds with the most activity, we set the hit cutoff to 35% activity. This identified the three most active compounds from this pilot screen. Red, green, and blue composite images (RGB) of CHO-K1 cells expressing AGT-170 treated with the top two hits are presented in Figure 1 . These hits demonstrated 83.6% and 73.5% rescue activity, respectively. Interestingly, both hit 1 (SR-05000013702) and hit 2 (SR-05000002136) are monensin derivatives that differ in only one side chain of the tetrahydropyran ring (the chemical structures of those two hits are depicted in Fig. 4 ), which suggests good fidelity for this assay.
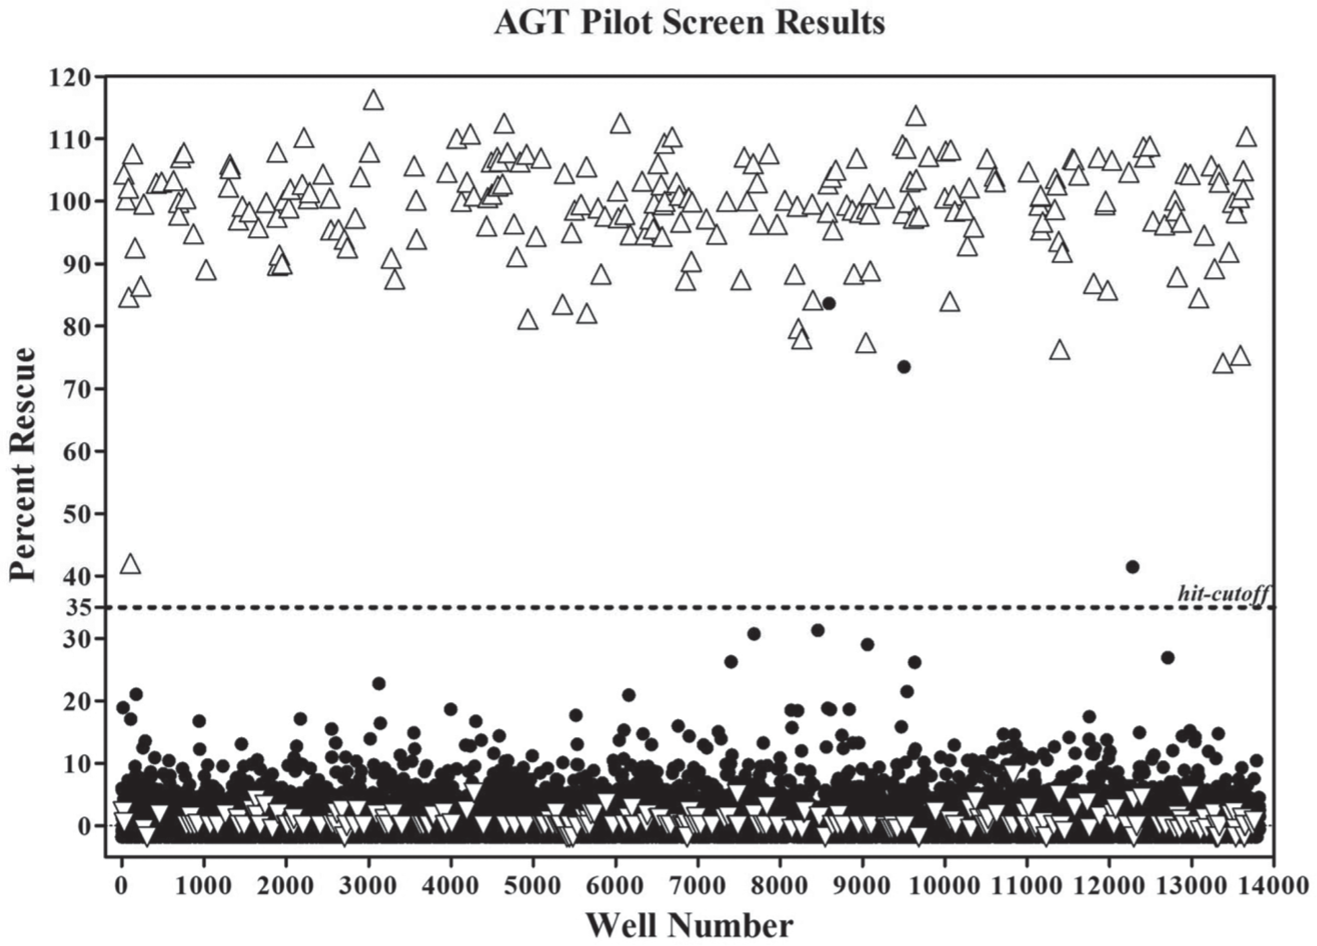
Alanine:glyoxylate aminotransferase 1536-well assay pilot screen results. Nine plates were run in the pilot screen, with the Z′ averaging 0.70 ± 0.07 and Z averaging 0.67 ± 0.06. Scatter plot of the normalized results of the pilot screen showing the percentage rescue calculated for the high and low control wells (△ and ▽, respectively) as well as for the sample wells (●). The hit cutoff of 35% rescue is represented by the dotted line on the graph.
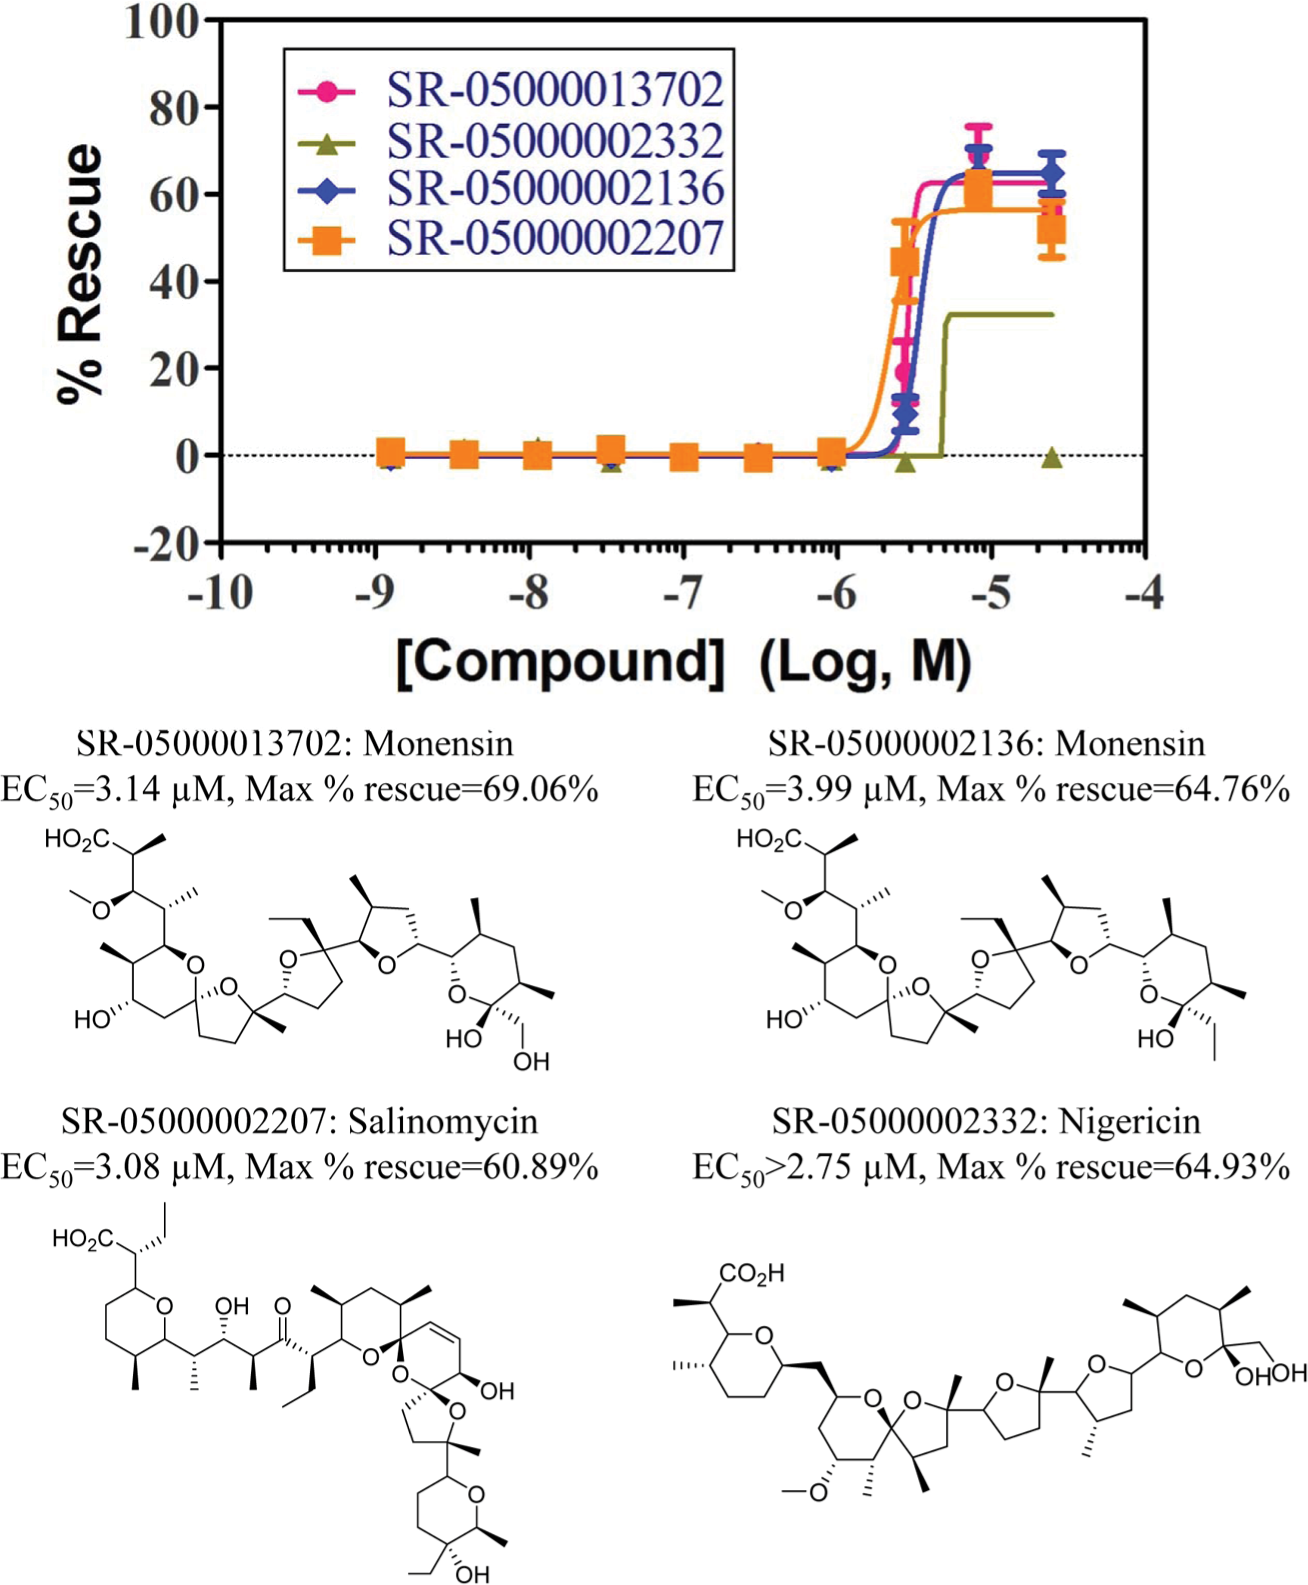
Concentration-response curves and chemical structures of four active compounds: monensin (SR-05000002136 and SR-050000013702), nigericin (SR-05000002332), and salinomycin (SR-05000002207). Each curve was plotted using the mean of five replicates at each concentration. Error bars are included.
As an ionophore, monensin is able to form lipophilic complexes with monovalent cations easily crossing the cellular membranes and subcellular membranes. Recognized as an inhibitor of intracellular protein transport, it has been used in flow cytometry by blocking the intracellular transport of cytokines to Golgi and causing accumulation of cytokines in the endoplasmic reticulum (ER) to enhance the detection of cytokine-producing cells. In addition, monensin was reported to be involved in a variety of intracellular transport process.23–27 The trafficking-related effects of monensin may ultimately be linked to the morphologic change of membranous organelles induced by monensin, such as swelling of Golgi, increased size of lysosome, and condensed mitochondria matrices.28–31 Monensin’s effects on mitochondria might explain our observation of AGT rerouting from mitochondria to peroxisome. Another marginal hit, fendiline, is a calcium channel blocker, which was reported to have the ability to redistribute K-RAS from the plasma membrane to the ER, Golgi, and cytosol. 32 Notably, after the completion of our pilot screen, reports on the activity of pyridoxine on subcellular localization were published by Oppici et al. 33 Looking back retrospectively, we had tested and found the activity of pyridoxine to be 6.8% when tested at 9.9 µM, which would be just below our standard hit cutoff but certainly above the baseline activity. This is reasonably concordant with the Oppici finding that pyridoxine yields a significant yet only partial redirecting of AGT to the peroxisomes.
Titration Assays
To further validate the activity of the three original hits identified from pilot screen, we not only cherry-picked them from our own stocks but also obtained fresh powder to determine their EC50. Meanwhile, we expanded our list of monensin analogs found in other parts of the 650,000 compound Scripps Drug Discovery Library showing >70% similarity in structure by Tanimoto score, compounds with similar mechanism of action as monensin, and known mitochondria and peroxisome “perturbators.” The compound list including associated information and their activity has been summarized in Supplemental Table S1 . We confirmed the activities of the two forms of monensin, as both the cherry-picked stock and fresh powder had EC50s of ~3.6 µM. The marginal hit fendiline presented only slight activity in the titration assay, with a maximum percentage rescue of 13.8%. Two ionophores, nigericin and salinomycin, that were included based on their similarity to monensin exhibited comparable activity to monensin. Concentration-response curves of those four active compounds along with their structures are shown in Figure 4 . Monensin (SR-05000002136 and SR-050000013702) demonstrated the desired rescue activity with an EC50 of 3.99 µM and 3.14 µM, respectively. Salinomycin (SR-05000002207) presented similar rescue activity as monensin (EC50 = 3.08 µM). Nigericin (SR-05000002332) achieved 65.4% rescue at 8.3 µM but lost activity at 25 µM. The confirmation that monensin and its close analogs are able to consistently redirect mistargeted AGT to its correct location in our assay provides confidence that this assay should prove useful to discover potential PH1 disorder–specific pharmacoperones.
Notably, none of the other tested compounds (n = 42) were found active, including brefeldin A. Similar to monensin, brefeldin A is also known to be involved in intracellular transport of cytokine and cholesterol. 23 De Sousa et al. 28 observed different effects for brefeldin A and monensin on the organelle structure of mouse embryo, which may connect to their different activities in rescuing of mistargeted AGT. Dequalinium chloride (DECA), previously reported to be a potent blocker of AGT-170 translocation into mitochondria by Miyata et al., 7 was found inactive in our assay. Both of these studies used CHO-K1 cells but slightly different models. In the study by Miyata et al., 7 AGT-170 was transiently transfected in CHO-K1 cells, where protein synthesis and DECA action would be expected to occur simultaneously; in our study, AGT-170 was stably expressed with glycolate oxidase in CHO-K1 cells. In the stable expression system, which presumably more closely mimics physiologic conditions, it is possible that AGT protein is already mistargeted at the time of treatment with DECA. Moreover, as the half-life of AGT-170 is quite long (46 ± 6 h), 33 it is very likely that there is a higher level of AGT-170 accumulating in stably transfected cells. Thus, we may reasonably assume that the AGT-170 already synthesized and mistargeted to mitochondria exists in an amount and/or location such that it might not be able to be redirected to peroxisome by molecules such as DECA and that, as reported previously, it correctly relocates only newly synthesized AGT-170. Therefore, it is possible that the real rescue effects of pharmacoperones reported in this study might be masked or underestimated because of the high level of AGT-170 already present in mitochondria before drug treatment.
Effects of Monensin on Subcellular Distribution of AGT-170 Analyzed by Western Blot
To further confirm monensin’s activity in rerouting AGT-170 from mitochondria to peroxisome, we performed subcellular fractionation of CHO-GO cells expressing either AGT-mi or AGT-170 after treatment with 0.5 µM monensin and DMSO, respectively, and determined the subcellular distribution of AGT by sodium dodecyl sulfate polyacrylamide gel electrophoresis and immunoblotting ( Suppl. Fig. S2 ). The choice to proceed with a 0.5 µM concentration of monensin was predicated based on trying a higher concentration at 10 µM, only to find the cells were nontolerant, such that we aimed 10-fold below the level of perceived cytotoxicity. In the case of adding 10 µM monensin, cells lifted off specific to the area of addition, similar to that shown in the images of Supplemental Figure S1 . Several literature reports studied the oligomeric structures of full-length and truncated AGT or AGT mutations by immunoblotting of whole-cell lysate,6,19 but no report was found using Western blotting to detect subcellular distribution of AGT. Only similar immunofluorescence microscopy-based methods as implemented in this study were used for AGT subcellular analysis.7,9 This may be due to the fact that it is quite challenging to isolate the organelles from the AGT-containing CHO-GO cells and then to detect the change in AGT level caused by a drug, such as monensin, in mitochondria and peroxisome. However, we found that the anti-AGT antibodies recognized a major band of approximately the expected size of the AGT monomer, which is 43 KD, in both the mitochondria and peroxisome samples. The anti-mtHSP70 recognized a mitochondria marker mtHSP70 that is approximately 75 KD. The anti-PMP70 identified the peroxisome marker PMP70 that is approximately 70 KD.
Our hypothesis was that we would observe a relocation of AGT from mitochondria to the peroxisomes, which would be demonstrated in the Western blots by a signature consistent with that of protein relocation between these two organelles. Compared with the DMSO group, we did observe that monensin treatment did decrease the AGT level of AGT-170 in mitochondria. In peroxisome samples, we did not detect the expected change of AGT-170, with comparable signals being found in the DMSO and monensin group. We believe this may be because the densities of mitochondria and peroxisome are very close, and as such, we had difficulty completely separating them even with multiple attempts at a well-established density gradient preparation procedure. To that end, we did see peroxisome protein detected in the mitochondria fragment when using anti-PMP70. Each Western blot analysis was done a minimum of two separate times. We also acknowledge that 0.5 µM monensin may not have been sufficient to completely restore the AGT relocalization, but as noted earlier, we were limited by the tolerance of the cells to this drug. As a result, the conclusion from this study regarding the direct ability of monensin to correct moderately or completely AGT routing in mutant cells is not conclusive, but indications are that a partial correction may have occurred. Future efforts will include optimizing current methods to improve the purity of cell fractionation or develop a more sensitive method that monitors only the change of newly synthesized AGT in order to confirm the result discovered in HTS.
To conclude, in the present study, we demonstrated a novel, cost-effective, and ultra-high-throughput compatible high-content assay to discover pharmacoperones that can rescue mistargeted AGT involved in PH1. The miniaturized 1536-well protocol yielded satisfactory assay statistics and demonstrated its compatibility with HTS requirements during a pilot screen. From the pilot screen, we have identified three ionophores that appear to block mitochondria import and reroute AGT back to peroxisome. Because the mistargeted AGT remains catalytically active, the ability of monensin to redirect mistrafficked AGT to its proper location of action may possibly allow for the restoration of AGT’s physiological function. Although the AGT protein rerouting was not completely confirmed using Western blot analysis, there is some evidence that at least partial relocation has occurred. Furthermore, these findings indicate that this approach is likely to identify valuable pharmacoperones from large chemical libraries. Future efforts will be focused on the validation of hit activity both in vitro and in vivo and also to screen larger chemical libraries using this 1536 high-content assay.
Footnotes
Acknowledgements
We thank Pierre Baillargeon and Lina Deluca at Scripps for their help with compound management and Thomas Kirk for his help using the BlueWasher.
Declaration of Conflicting Interests
The authors declared no potential conflicts of interest with respect to the research, authorship, and/or publication of this article.
Funding
The authors disclosed receipt of the following financial support for the research, authorship, and/or publication of this article: The work was supported by both Scripps S/S LEAD ID Core account and also the Oxalosis & Hyperoxaluria Foundation (PMC).
Supplementary material is available online with this article.
References
Supplementary Material
Please find the following supplemental material available below.
For Open Access articles published under a Creative Commons License, all supplemental material carries the same license as the article it is associated with.
For non-Open Access articles published, all supplemental material carries a non-exclusive license, and permission requests for re-use of supplemental material or any part of supplemental material shall be sent directly to the copyright owner as specified in the copyright notice associated with the article.