
Abstract
Evaluation of drug cytotoxicity traditionally relies on use of cell monolayers, which are easily miniaturized to the 1536-well plate format. Three-dimensional (3D) cell culture models have recently gained popularity thanks to their ability to better mimic the complexity of in vivo systems. Despite growing interest in these more physiologically relevant and highly predictive cell-based models for compound profiling and drug discovery, 3D assays are currently performed in a medium- to low-throughput format, either in 96-well or 384-well plates. Here, we describe the design and implementation of a novel high-throughput screening (HTS)–compatible 1536-well plate assay that enables the parallel formation, size monitoring and viability assessment of 3D spheroids in a highly consistent manner. Custom-made plates featuring an ultra-low-attachment surface and round-bottom wells were evaluated for their compatibility with HTS requirements through a luminescence-based cytotoxicity pilot screen of ~3300 drugs from approved drug and National Cancer Institute (NCI) collections. As anticipated, results from this screen were significantly different from a parallel screen performed on cell monolayers. With the ability to achieve an average Z′ factor greater than 0.5, this automation-friendly assay can be implemented to either profile lead compounds in a more economical plate format or to interrogate large compound libraries by ultra-HTS (uHTS).
Introduction
Most cell-based assays are currently performed on two-dimensional (2D) cell monolayers despite mounting evidence that these models fail to adequately recapitulate the complexity of the cellular processes occurring in tissues.1,2 Three-dimensional (3D) cell models have been described as more physiologically relevant for a variety of applications, especially with regard to cancer research and viability/cytotoxicity assessment.3,4 Numerous methods have been described to produce spheroids, including in-suspension cell aggregation, 5 micropatterned surfaces, 6 microfluidic devices, 7 hanging drops, 8 magnetic levitation 9 and 3D bioprinting, 10 polymeric aqueous two-phase systems (ATPSs), 11 the use of hydrogels, 12 and the use of agarose and Matrigel to form nests or domes in which the spheroids will form and grow.13,14 Drug discovery or compound assessment by ultra-high-throughput screening (uHTS) relies on high-density microtiter plates in the 1536-well plate format that can be manipulated in a homogeneous manner.15,16 None of the previously enumerated spheroid generation methods have been successfully applied to the 1536-well plate format. Here, we describe the design and preliminary evaluation of an SBS-compatible 1536-well plate that allowed us to reliably form and grow 3D spheroids that are consistent in size, viability, and location, all upon a single addition step. This plate can be imaged to monitor spheroid growth over time and was implemented to develop a 3D cytotoxicity assay in a homogeneous format. Pilot screens of ~3500 approved drugs and National Cancer Institute (NCI) collections in single dose and serial dilution analysis were completed as proof of concept.
Material and Methods
Compound Sourcing and Drug Libraries
Scripps’ approved drug library (currently n = 3246 compounds) is a collection of small molecules that have been assigned USAN, USP INN, BAN, and/or JAN designations and are included in the USP Dictionary (U.S. Pharmacopeia). The authorized list of established names for drugs in the United States is listed in the Index Nominum and/or the International Drug Directory. These drugs have been sourced through multiple vendors and listings available through the NCGC Pharmaceutical Collection (NPC) informatics browser (https://tripod.nih.gov/npc/#WhatIs). The NCI oncology drug set contains the most current Food and Drug Administration (FDA)–approved anticancer drugs (n = 114) intended to enable cancer research, drug discovery, and combination drug studies. These small molecules are distributed by NCI’s Developmental Therapeutics Program (https://dtp.cancer.gov/organization/dscb/obtaining/available_plates.htm). The reference control panobinostat and test compounds doxorubicin, nocodazole, valinomycin, staurosporine, and tirapazamine were acquired through Sigma-Aldrich (St. Louis, MO).
Cell Lines
HT-29 human colon cancer cells were purchased through ATCC (cat. no. HTB-38) and grown according to the manufacturer’s suggested protocol. Cells were cultured in T175 flasks and kept in an incubator set at 37 °C, 95% relative humidity (RH), and 5% CO2. Cells were harvested with TrypLE (Life Technologies, Carlsbad, CA) during cell passaging and/or for cell suspension preparation.
A 1536-Well 3D Spheroid Plate Design
The 1536-well microplates were molded to meet the accepted standards ANSI/SLAS 1-2004 through ANSI/SLAS 4-2004, using general-purpose polystyrene. The well-bottom geometry was thermoformed from optically clear, polyethylene terephthalate (PET) film. The PET was cut to size and applied to the bottom of the 1536-well molded microplate and ultra-low-attachment (ULA) reagent cross-linked to the surface. The 1536-well spheroid plates were packaged and then gamma irradiated.
A 1536-Well Plate 3D Spheroid Cytotoxicity Assay
A detailed stepwise protocol is presented Table 1 . Briefly, 2500 HT-29 cells were dispensed in each well of the custom-designed 1536-well spheroid plates (Corning, Tewksbury, MA) in a final volume of 5 μL using a flying reagent dispenser (FRD; Beckman Coulter, Brea, CA). After 48 h incubation at 37 °C, 95% RH, and 5% CO2, plates were imaged using Scripps’ high-resolution image acquisition and processing instrument (HIAPI) instrument 17 as a quality control measure to ensure proper spheroid formation prior to assaying test drugs. Each well was then treated with 50 nL of test compounds or DMSO using a PinTool transfer unit (Kalypsys/GNF, GNF Systems, San Diego, CA), and plates were returned to the incubator for an additional 48 h. Plates were then removed and equilibrated at room temperature for 15 min. Five microliters per well of CellTiter-Glo 3D (CTG3D, Promega Corp., Madison, WI) was added to each well by the FRD, and luminescence was measured on PerkinElmer’s (Waltham, MA) ViewLux microplate imager 1 h postaddition.
Stepwise Protocol for the 1536-Well Plate 3D Spheroid Cytotoxicity Assay.
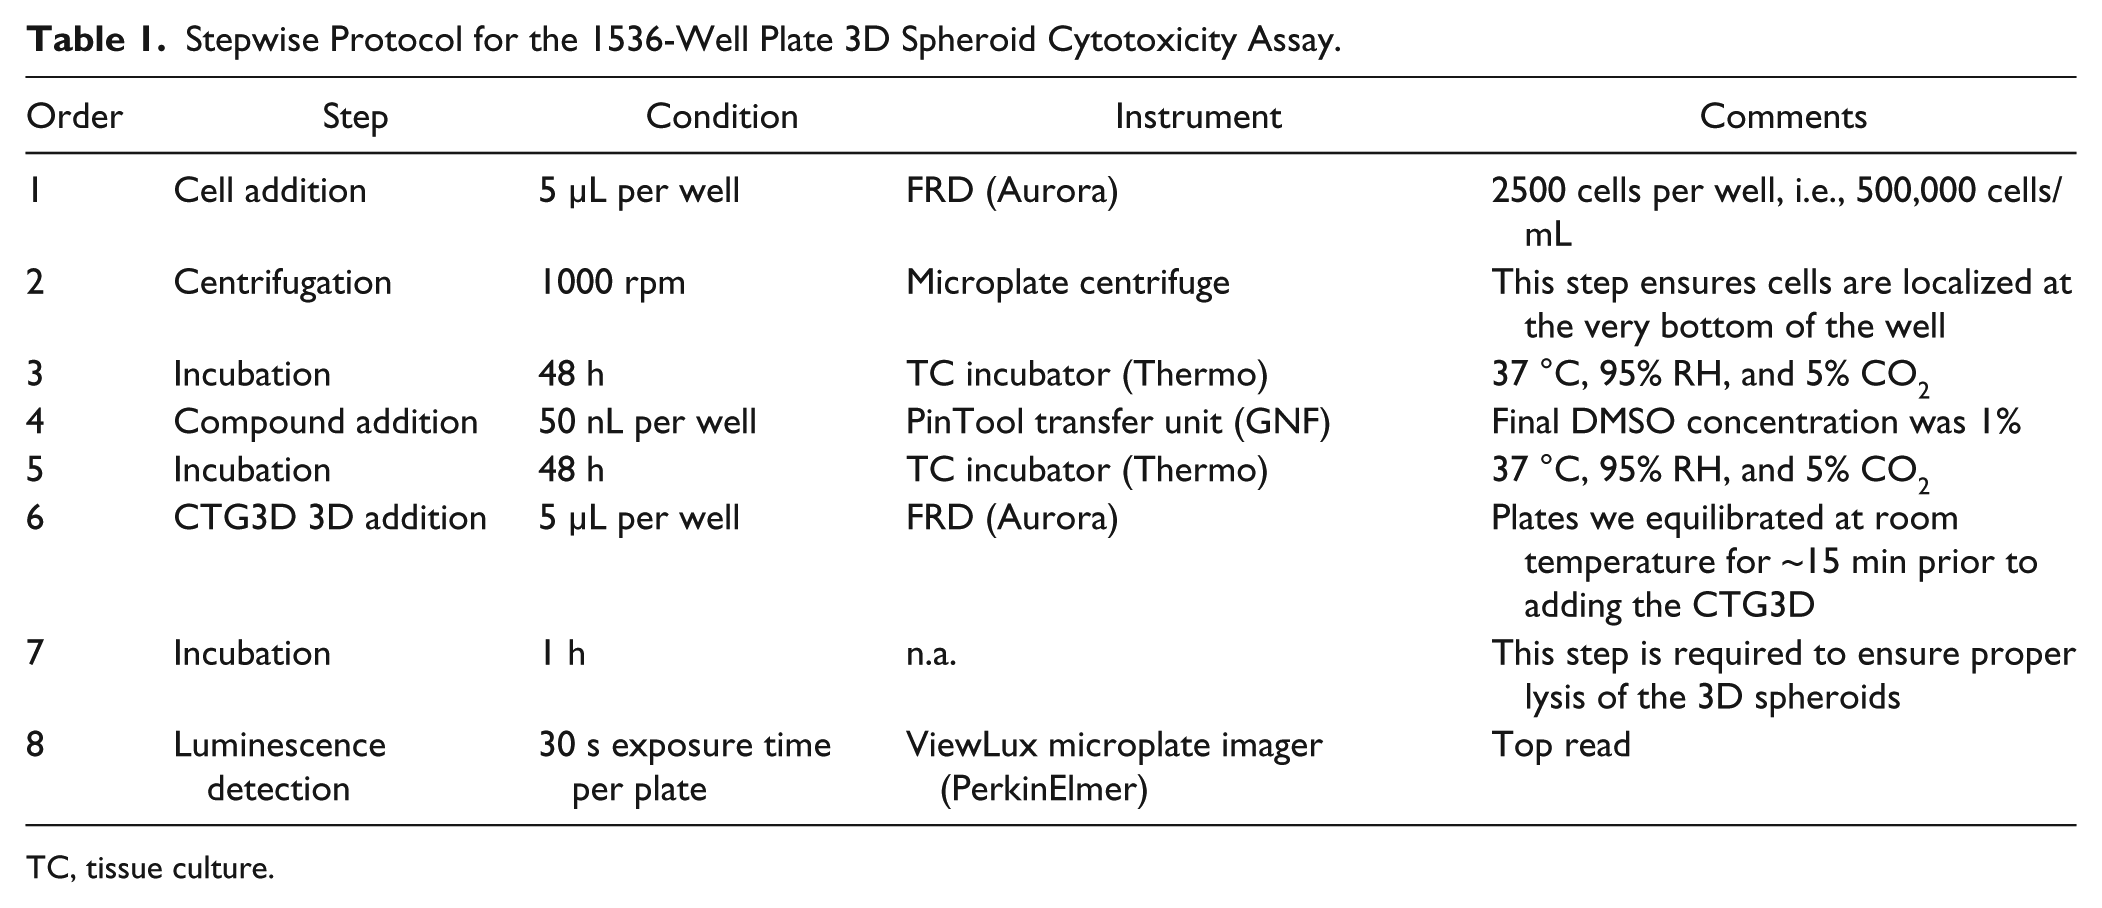
TC, tissue culture.
A 1536-Well Plate Cytotoxicity Assay on 2D Cell Monolayers
The cytotoxicity assay on HT-29 cell monolayers was similar to the protocol described in the previous section, with the exception of these four differences: (1) cells were plated in white, solid-bottom, TC-treated, polystyrene 1536-well plates (Corning part no. 7298); (2) 125 cells per well were seeded into each well of a 1536-well plate; (3) standard CTG was used in place of the 3D version; and (4) plates were acquired on the ViewLux 15 min after CTG addition.
Pilot Screen of the FDA library
For the pilot screen, DMSO and control drug concentration–response curve (CRC) plates were implemented at the beginning of the experiment that were followed by the drug library and NCI library plates. Additional DMSO and CRC plates were also tested at the end of the batch to monitor for any compound carryover from the PinTool transfer unit and for potential shift in pharmacology, that is, the control compound CC50 values, respectively. Upon plate-based data acquisition using the ViewLux microplate imager, exported data files were uploaded to Scripps’ institutional database (Symyx Assay Explorer), where plate statistics (Z, Z′, S/B) were automatically calculated. Compound heredity was automatically retrieved from Scripps’ compound management database (Plate Manager, MDL), and percent cytotoxicity was calculated for each compound using the following equation:
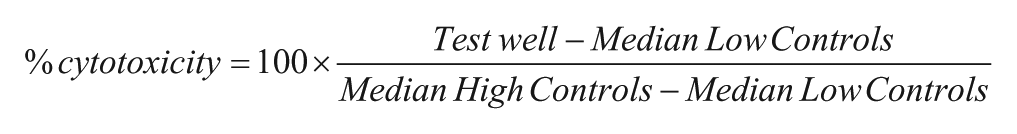
where High and Low Control wells represent wells treated with 100 μM panobinostat and DMSO, respectively.
Drugs showing normalized percent cytotoxicity values higher than the average plus three standard deviations of the percent cytotoxicity of all test compounds were designated as hits.
Titration Assay
Compounds to be titrated were first prepared as 2.5 mM DMSO solutions and serially diluted (1 into 3) in DMSO over 10 points using the Beckman Coulter Biomek NXP in the 384-well plate format. These dilutions were then transferred to a 1536-well source plate that accommodates up to four different 384-well plates combined into a single 1536-well plate. These transfers where done using the same instrument, generating a final volume of 7 μL per well. Titration plates were then assayed in triplicate in the 3D spheroid cytotoxicity assay described above. A four-parameter curve-fitting algorithm was used to determine the CC50 value of each individual drug based on the average normalized percent cytotoxicity measured for all 10 concentrations of the serial dilution (Assay Explorer, Symyx).
Z-Stack Analysis
Z-stack analysis was done by first staining spheroids with Hoechst at a 1:1000 dilution for 1 h, and then transferring the individual spheroid to a flat-bottom clear-bottom 384-well plate which helped facilitate imaging. Images were obtained at 10 µm increments on the GE InCell6000 instrument using a 10× objective with an aperture of 0.59 AU. Then using free software provided by ImageJ (made available by the National Institutes of Health [NIH]), stacking of the images was done, followed by application of maximum intensity projection along the Z axis. Each plane is shown as a separate color.
Graphs
All scatter-plots and graphs included in this article have been made with GraphPad Prism (GraphPad Software, La Jolla, CA).
Results
Custom 1536-Well Plate Design
In order to increase throughput and decrease costs and waste stream, all HTS assays that come to the Scripps Research Institute Molecular Screening Center (SRIMSC) are miniaturized and optimized to 1536-well plate format and can be deployed on a fully automated robotic platform that has been designed and configured for this specific plate density.18,19 A large variety of microtiter plates that enable the formation and growth of spheroids are now commercially available; however, most of them are in the 96- and 384-well plate format. At the time of our evaluation, higher-plate-density formats were not being manufactured. Critically, the size of spheroids, ranging from 200 to 600 μm in size, is indeed compatible with the smaller wells of a 1536-well plate. The use of agarose to form U-shaped nests at the bottom of the wells13,14 was originally considered but subsequently abandoned, as it required (1) an extensive plate preparation step and (2) the adaptation of the dispensing instrumentation in order to allow temperature control of the melted solution of agarose. Similarly, the option to exploit the high-surface-tension characteristic of the small wells of 1536 plates (liquids dispensed into the wells of a 1536-well plate are indeed not displaced when the plate is gently flipped upside down) was also considered an “in-well” inverted hanging drop protocol. This option was also abandoned due to robotic arm constraints and because lids, plate carousels, and auxiliary hotels are all incompatible with the plates being in an inverted position.
Previous collaborations with Corning Inc. resulted in the successful use of their 384-well plate format, which led to the collaborative effort to design 3D spheroid plates in the miniaturized 1536-well plate format. The following specifications were delineated and used as a guide for the development of the new 3D spheroid plate: (1) widespread compatibility with 1536-well plate-friendly instrumentation, (2) ability to form individual 3D spheroids in each well, (3) reduced or no satellite formations, (4) well-to-well consistency in terms of 3D size and viability, (5) ability to monitor spheroid formation and growth over time and at any time, (6) ability to grow spheroids for multiple days in culture, (7) single-step addition for cell seeding and spheroid formation, (8) robotic compatibility – no complex motions (such as flipping plates), and (9) spheroids had to be centrally located within each well in order to facilitate imaging and quality control/visual inspection. The resulting design is depicted in Figure 1 ; the engineering team at Corning Inc. designed a solution similar to the existing 384-well spheroid plates that addressed all requirement specifications and minimized potential manufacturing hurdles.
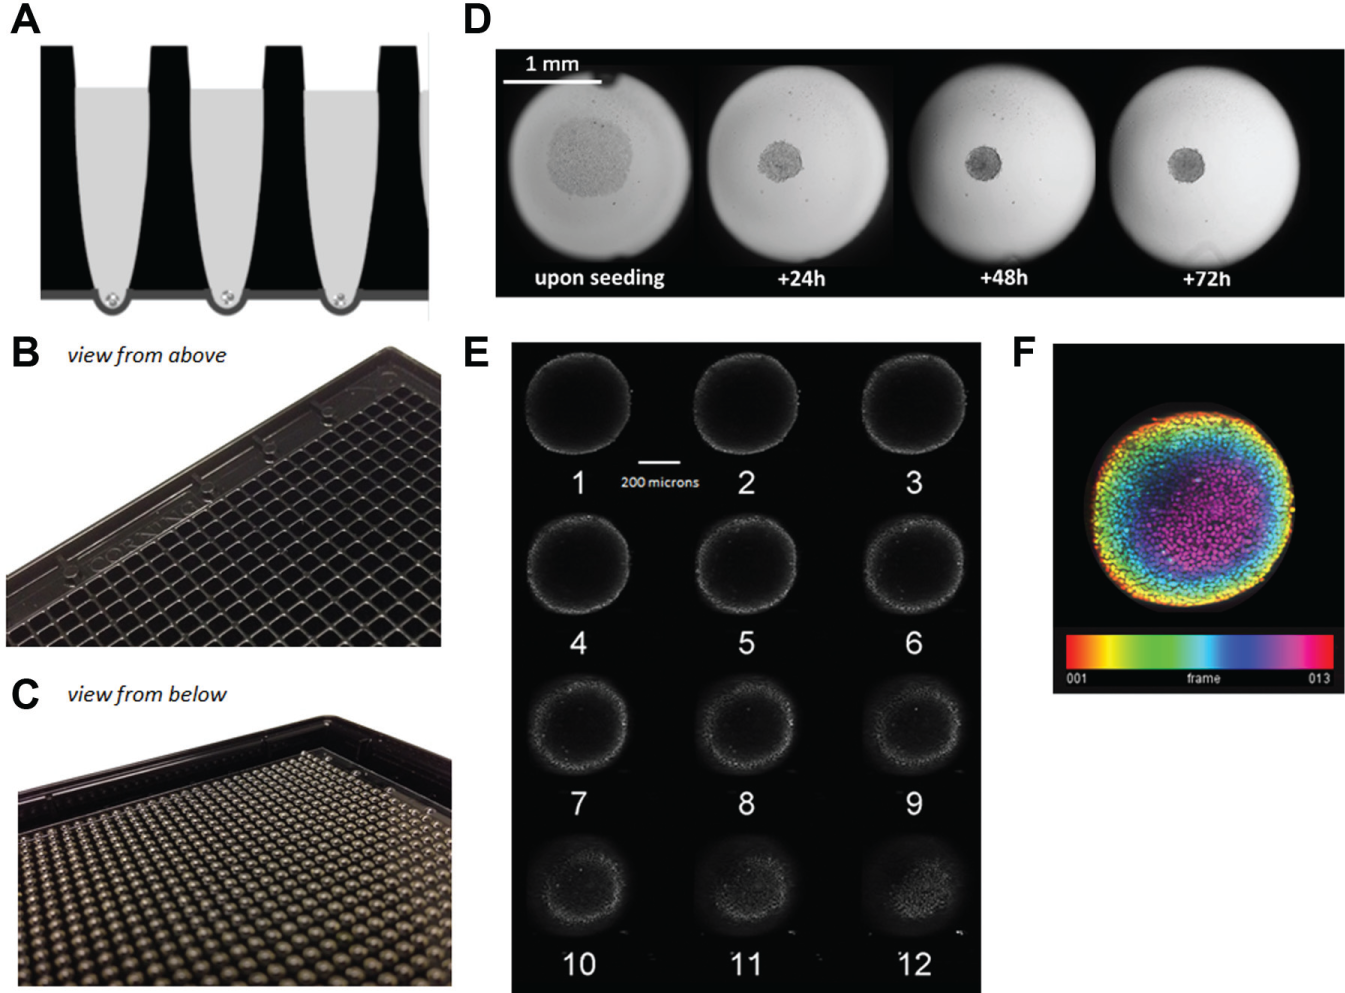
Design of the new 1536-well 3D spheroid plates. (
Monitoring Spheroid Formation by Imaging
Spheroid formation and growth was monitored via imaging using either the Thermo/Cellomics CellInsight or Scripps’ HIAPI. 17 The former is a microscopy-based instrument that employs regular 5×–20× objectives, whereas the latter is a telecentric lens–based whole-plate imager. Figure 2A shows replicate wells (n = 20) of spheroids formed by seeding HT-29 cells at various densities analyzed with the CellInsight. Replicate wells demonstrated a consistent spheroid size for each cell density. Figure 2B provides evidence that spheroid growth in the 1536-well plates can be monitored using the CellInsight over time, with good reproducibility in terms of replicate wells, linearity, and continuous expansion over time, which is consistent with cell seeding density. Figure 2C , D provides a qualitative appreciation of the limited well-to-well variability in terms of spheroid size and location as captured with the HIAPI whole-plate imager.
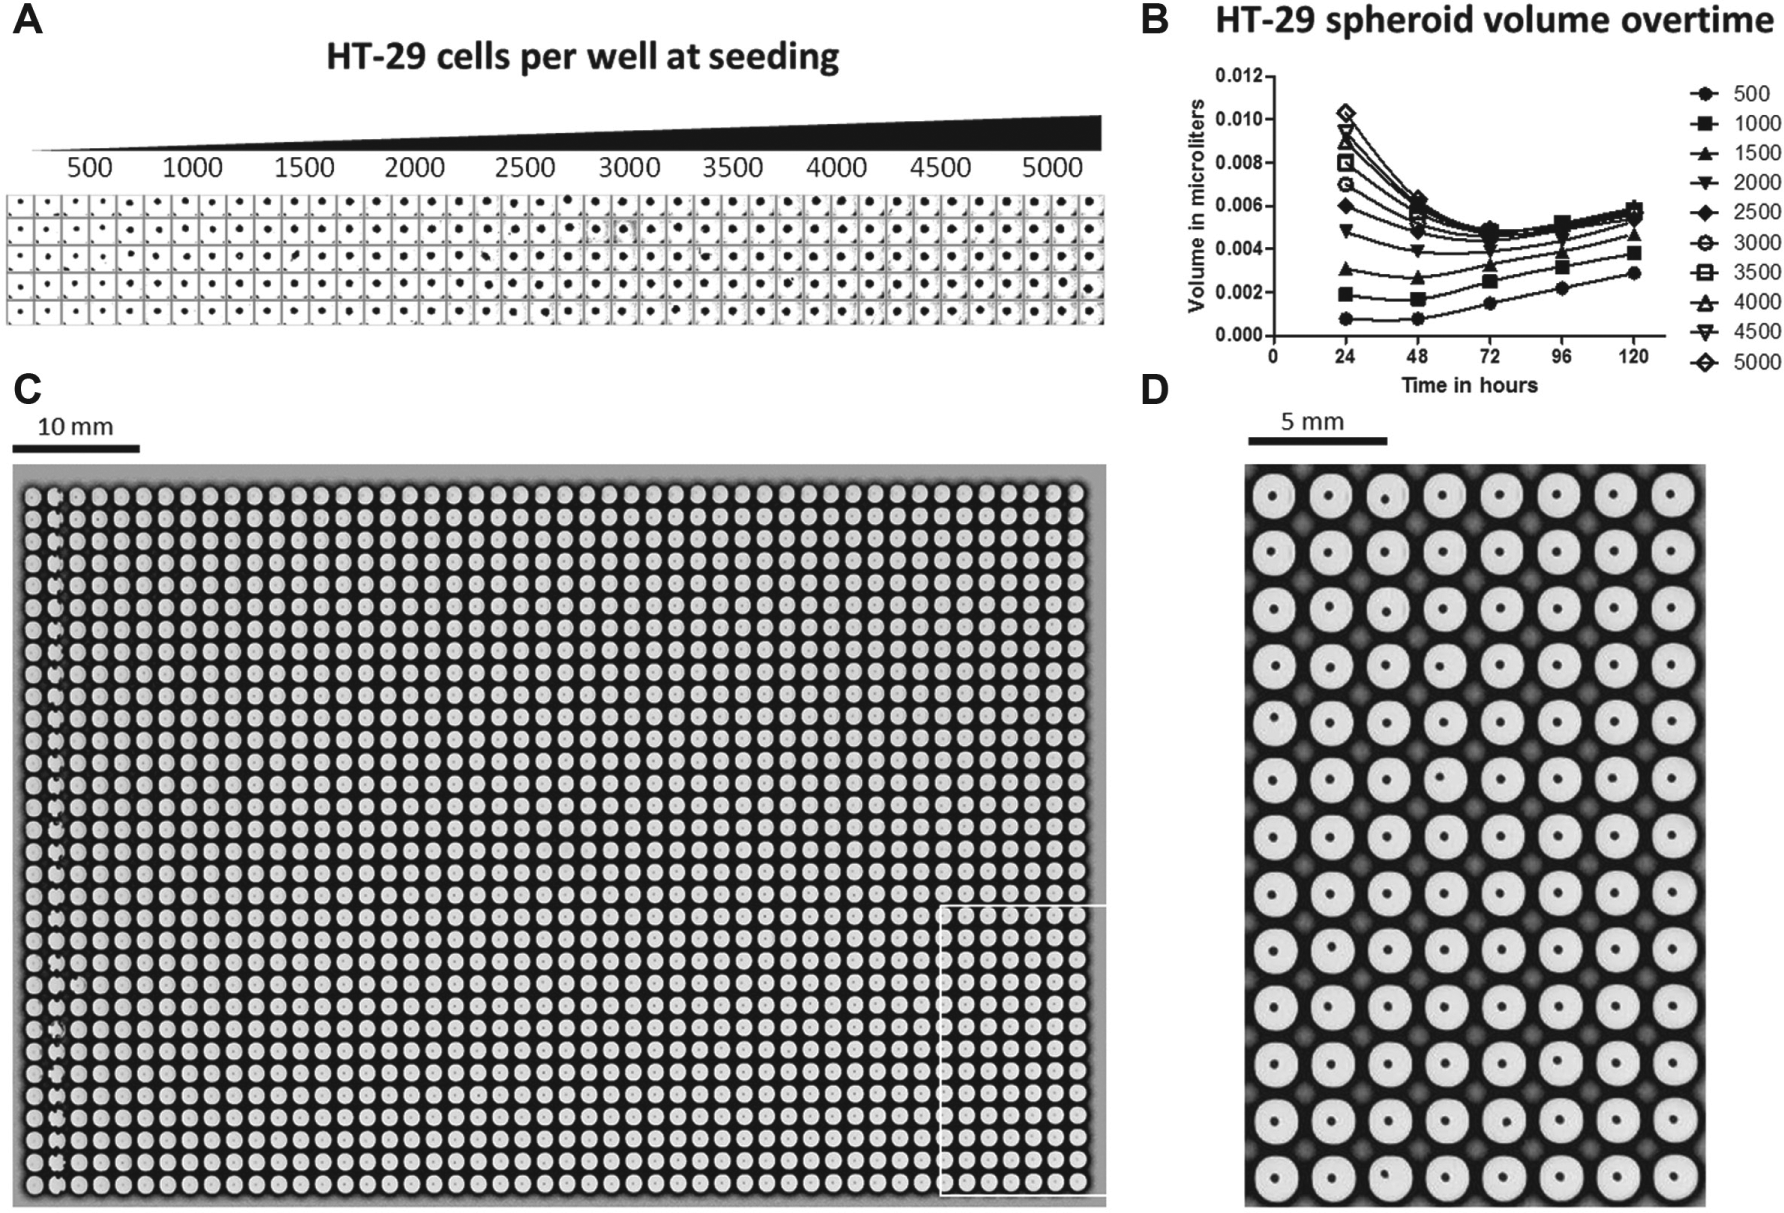
Imaging spheroid formation to determine well-to-well consistency. (
Viability Determination
Various methods exist to monitor cell viability and cytotoxic events in microtiter plates. 20 One of the most popular methods to evaluate cell viability by HTS is based on the indirect measurement of ATP levels by luminescence via luciferase activity.21,22 Whereas different commercially available solutions exist for 2D monolayer cell preparations, limited reagents are available for 3D spheroids. We recently identified CTG3D (Promega Corp.) as a viability measurement reagent specifically designed for 3D spheroids; it relies on an enhanced lysis buffer that releases ATP from spheroids in an efficient manner compared with the non-3D lytic reagents. To help understand how long we should incubate the plates after substrate addition prior to reading, we first investigated the optimal lysis time by reading the luminescence levels every 5 min over 500 min upon addition of CTG3D on spheroids incubated for 72 h prepared by seeding 2500 HT-29 cells per well. Luminescence levels quickly increased to reach a maximum around t = 50 min, before gradually decaying to <⅓ of the highest signal over the next ~7 h ( Fig. 3A ). The coefficient of variation (CV) calculated over 24 replicate wells quickly decreased during the first 60 min of incubation and reached ~6%, and appeared steady for the next 2 h before slowly increasing again; the percent CV (%CV) at 8 h post-CTG3D addition was still <10%. Taken together, these results suggested that the optimal reading time upon addition of the CTG3D was between 1 and 3 h; we used 1 h incubation time for the rest of our experiments. This is quite different from regular CTG (Promega Corp.), which typically requires ~10 min, postaddition, to reach maximum signal. Panobinostat, a hydroxamic acid that acts as a nonselective histone deacetylase inhibitor, 23 was identified among a small set of other cytotoxic compounds as the only drug able to provide a full cytotoxic effect with luminescent signal comparable to the no-cell control wells, as observed in the dose–response curve when titrated as a 10-point, 1:3 serial dilution starting at 100 μM ( Fig. 3B ). Panobinostat’s CC50 was calculated at ~500 nM and was used as a positive control for the rest of our experiments. Subsequent luminescence-based detection of ATP content showed that measured luminescence levels were directly proportional to the deduced spheroid volume, suggesting that the CTG3D is a good indicator of the number of live cells in a given spheroid ( Fig. 3C ).
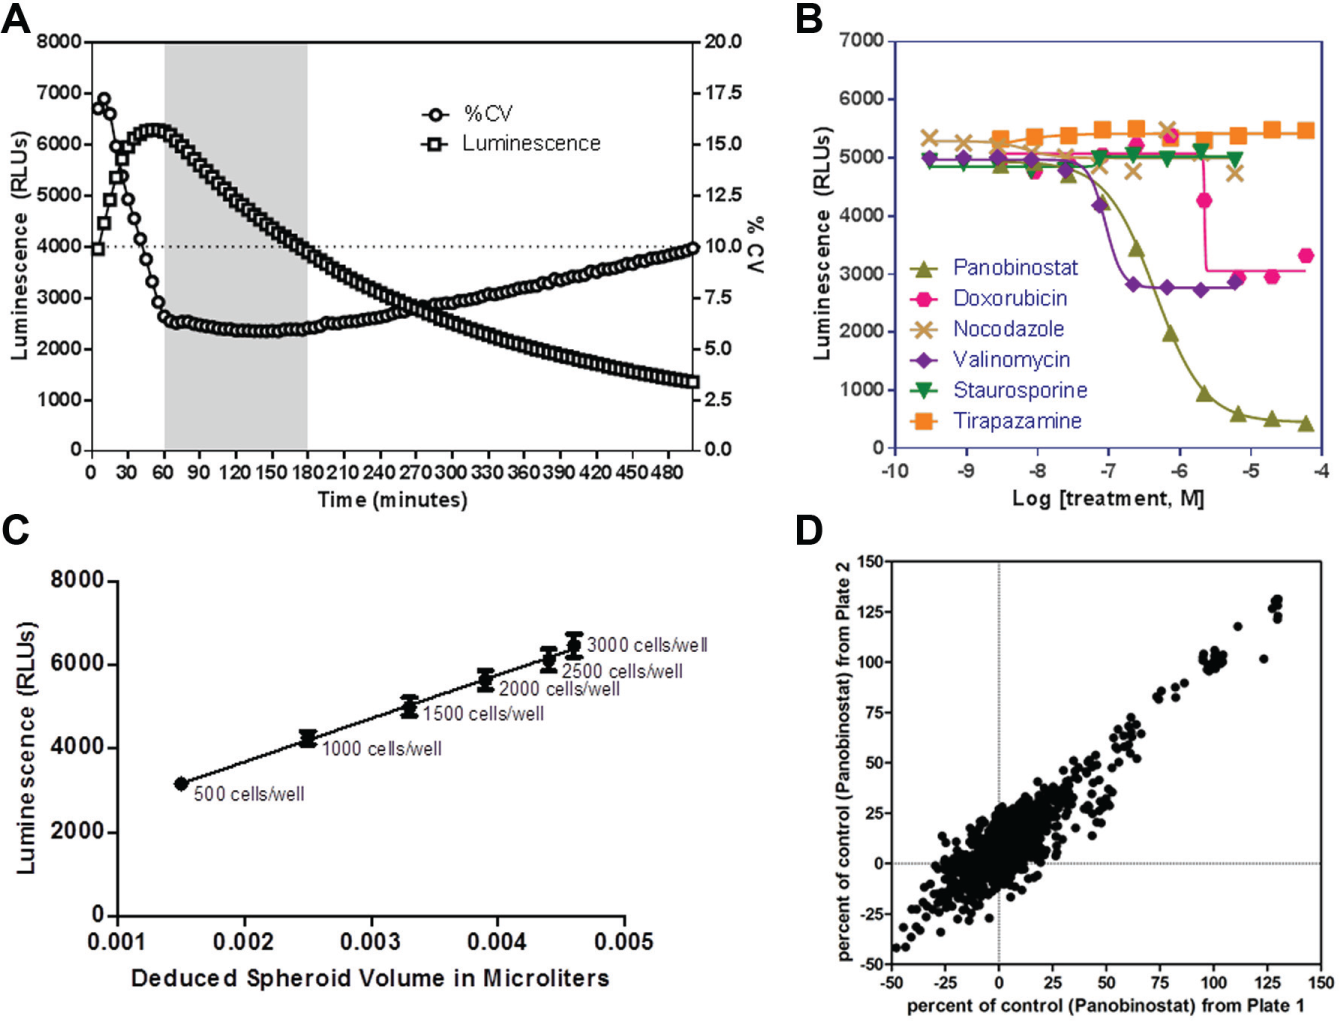
3D spheroid cytotoxicity assay characterization. (
A 1536-Well Plate Format 3D Spheroid Cytotoxicity Assay
Table 1 describes the stepwise protocol that was followed to perform the 3D spheroid assay in the custom-designed 1536-well plates. A cell suspension containing 500,000 cells/mL of HT-29 cells was dispensed in each well of a 1536-well plate, which were immediately centrifuged to initiate spheroid formation. Test compounds were added 48 h after cell seeding, and viability was measured 48 h posttreatment by dispensing an equal volume of CTG3D. A compound plate containing panobinostat at various concentrations was used to treat duplicate 3D spheroid plates; the resulting correlation is shown Figure 3D . With a Pearson r of 0.94 and an R2 of 0.89, these results are indicative of an excellent plate-to-plate repeatability.
High concentrations of panobinostat were used as positive controls on each test plate, whereas DMSO only was used as a negative control; the calculated Z′ between these two well populations was 0.72, and the sample-to-background (S/B) ratio was 6.12 ( Fig. 4 ). Z′ greater than 0.5 is indicative of compliancy with HTS requirements. 24 In addition, the %CV of the sample field was <10%. The Z′ of the 2D version of this assay was very similar (Z = 0.76), and the S/B ratio ~5-fold higher at 24.99.
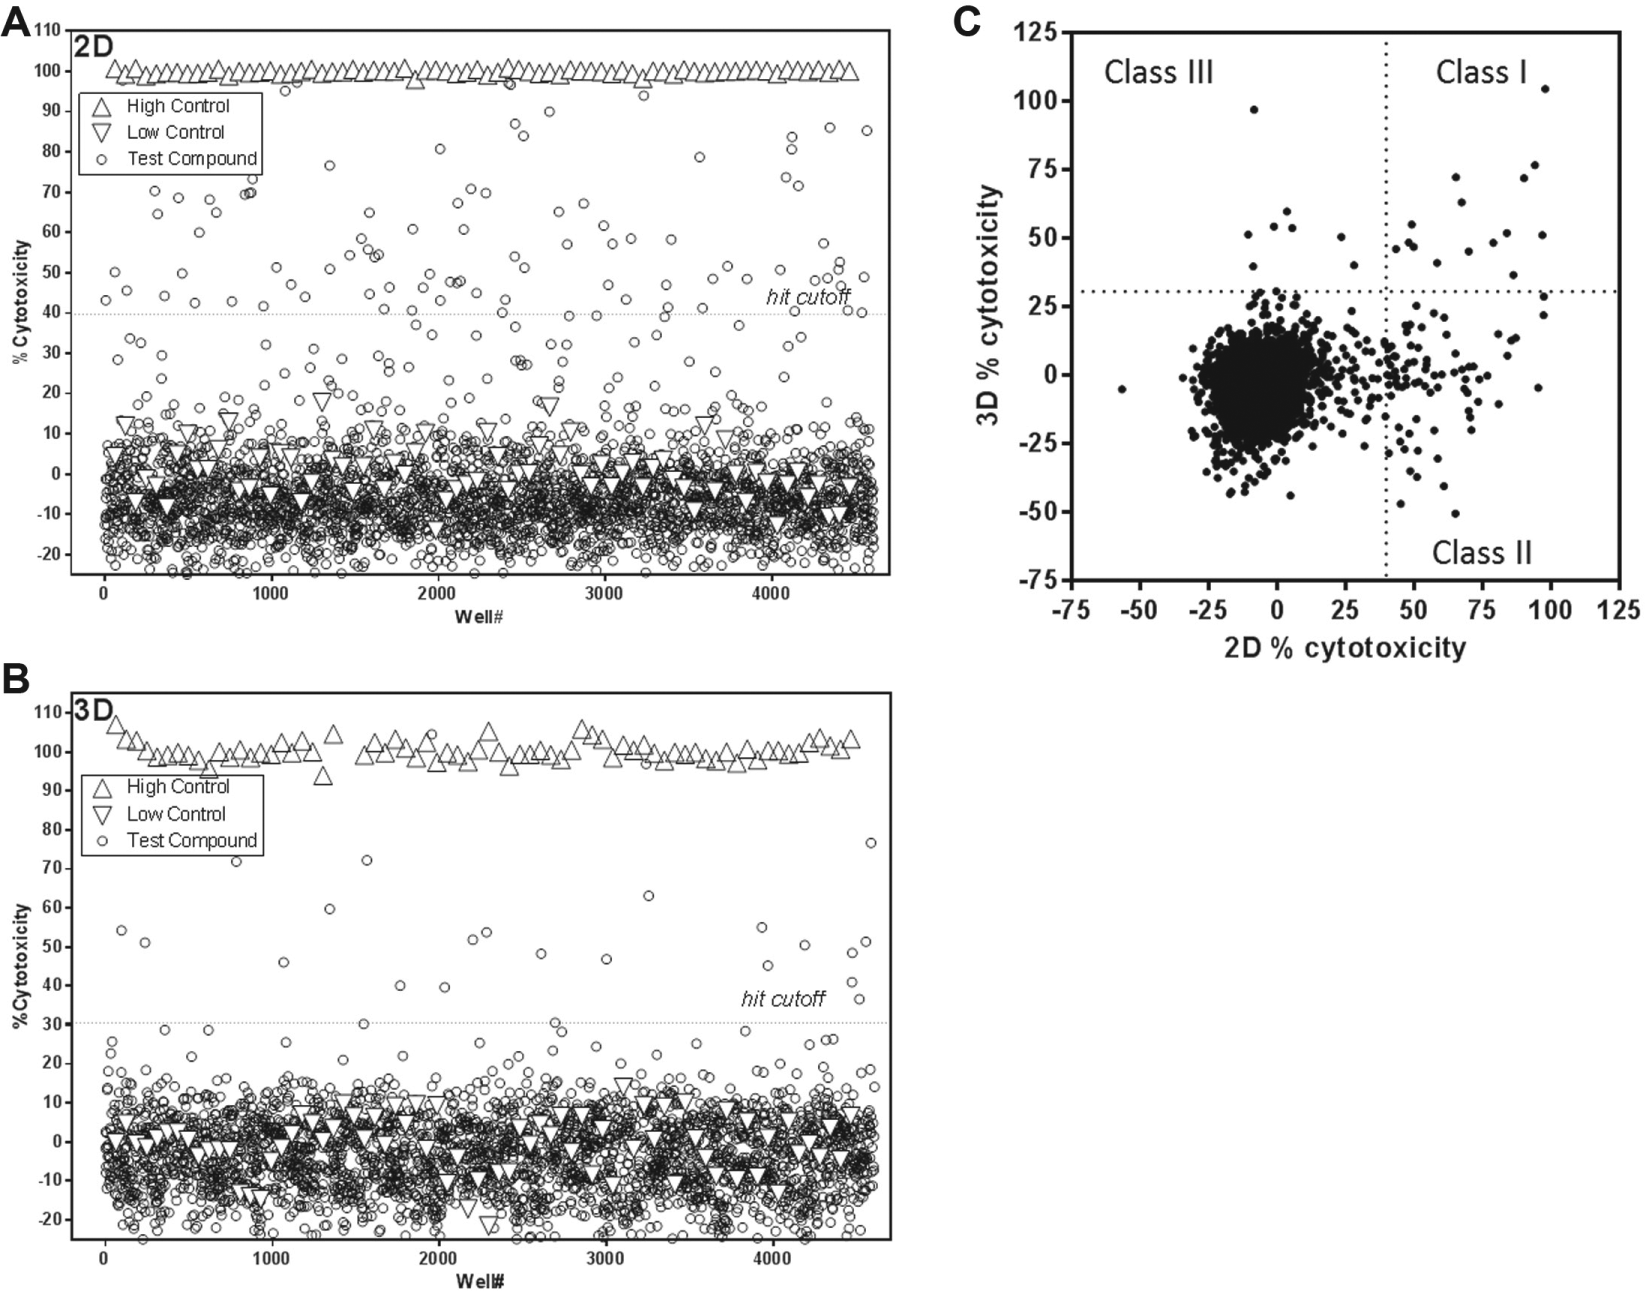
The 1536-well spheroid cytotoxicity pilot screen results. Scatter-plot of the pilot 1536-well format cytotoxicity screens of the FDA library on 2D (
Pilot Screens of the FDA and NCI Drug Collections
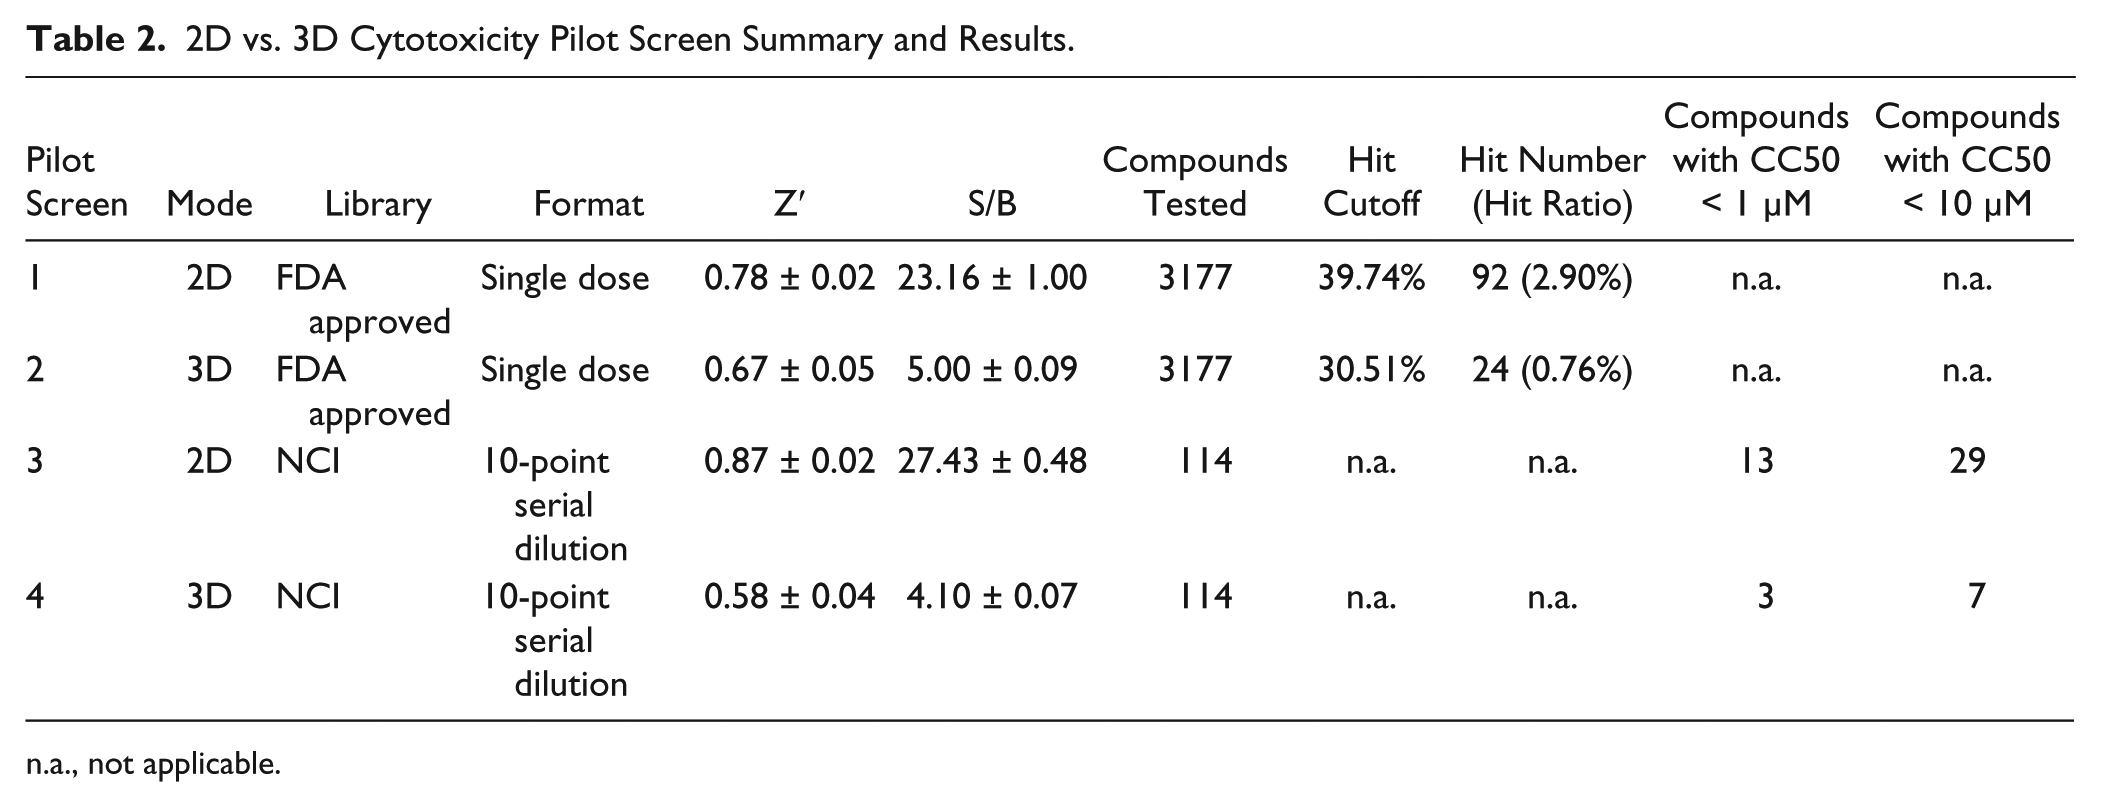
The validated 3D cytotoxicity assay described in the previous section was then employed to assess the cytotoxic potential of ~3300 compounds, either approved drugs (n = 3177) or part of the NCI (n = 114) collection. The approved drug collection was first assessed as a single dose, whereas the NCI collection was assessed as 10-point, 1:3 serial dilutions. The same compounds were also tested in parallel in the 2D version of the assay in order to investigate the potential correlation, or lack thereof, of the 2D vs. 3D cytotoxicity assays. Results of the different pilot screens are summarized in Table 2 . All pilot screens exhibited Z′ > 0.5 and steady S/B ratios. A plot comparing the percent cytotoxicity measured in the 2D vs. 3D assays (x and y axes, respectively) is presented in Figure 4C and shows a weak correlation (Pearson’s r = 0.23, R2 = 0.05). Four separate classes of compounds were established based on whether they were hits in one assay, the other, both, or none; 15 compounds were indeed identified as being active in both the 2D and 3D versions of the cytotoxicity assay, whereas the majority (77 compounds, i.e., 76%) were selectively cytotoxic to cells in their 2D configuration only. Only nine compounds showed a cytotoxicity effect that was selective for the 3D assay. Similarly, 66% of titrated compounds from the NCI collection that were active in at least one assay were biased toward 2D-specific cytotoxicity (24 out of 38 compounds). A total of six NCI library compounds displayed similar activities in the 2D and 3D versions of the assay, and only one compound was 3D biased.
2D vs. 3D Cytotoxicity Pilot Screen Summary and Results.
n.a., not applicable.
Discussion
This article describes the implementation and validation of a new 1536-well plate specifically designed to easily form and grow 3D spheroids in a consistent manner. This technology, combined with the infrastructure at the SRIMSC, enabled the development of a simple, automation-friendly and homogeneous assay to evaluate compound cytotoxicity on spheroids. Pilot screens of ~3300 compounds tested in either single dose or dose–response yielded satisfactory Z′ values and good overall assay statistics, indicative of the compatibility of this newly designed assay with uHTS requirements.
Despite a successful outcome, several challenges were faced and needed to be addressed. First, evaporation, a well-described and easily manageable issue in the 1536-well plate format, was exacerbated in the original assay design using standard lids. This was caused both by the extended period of time (4 days total) for which spheroids were kept in plate culture and by the lack of proper seal formed with either the original plastic lids (Corning) or the heavy metal lids (GNF Systems) incorporating a gasket that are usually sufficient for regular 1536-well plates. Wells located at the edges of the plate were dramatically impacted, as observed by microscopy or viability assessment, especially in the four corners, where close to 0% viability was observed. The MicroClime environmental lids (Labcyte Inc., Sunnyvale, CA), preloaded with Dulbecco’s phosphate-buffered saline (PBS) spiked with antibiotics and antimycotics, prevented evaporation by creating a saturated microclimate, providing a viable alternative, with the only caveat that theses lids are not fully compatible with Scripps’ robotic platform and generally are not reusable. The SRIMSC is currently designing an alternative lid mechanism to ameliorate this issue.
Another challenge encountered during the first evaluation of the newly designed 3D spheroid plates was due to the unevenness of the plate’s bottom resulting from the presence of multiple “nests” designed to facilitate spheroid formation and growth. The PinTool transfer unit developed by GNF Systems indeed detects plates through a vacuum-based sensing mechanism that requires the bottom of the assay plate to form an airtight vacuum. In the absence of proper plate detection, the PinTool transfer unit cannot proceed with compound dispense. This problem was easily addressed by implementing a regular flat-bottom 1536-well plate as a spacer and stacking or positioning the spheroid plate directly on top of the spacer. Upon teaching the new plate position, the PinTool unit was able to precisely and accurately dispense 50 nL of test compounds in each well.
Finally, because the bottom of the plate is recessed by ~5 mm compared with the base of the plate, the Thermo CellInsight high-content reader was incapable of properly focusing. The solution was an intermediate ring from Zeiss part no. M27-M27 H “5” used as a spacer to bring the focal plane of the 5× objective slightly higher without affecting the image-based autofocus function of the instrument.
Despite these challenges, the implementation of the newly designed 3D spheroid plates described here, in the context of 1536-well drug screens, was surprisingly straightforward. The new plates met all the specification requirements listed for successful use in the context of these tests and for use in uHTS. Over the course of our effort, the newly designed plates were confirmed to be either directly compatible with or easily adaptable to a wide variety of instruments commonly used to handle 1536-well plates. As far as liquid handling and dispensers are concerned, we successfully used the plates on GNF System’s PinTool unit, on EDC’s ATS acoustic dispenser, and on the BioRAPTR (Beckman Coulter) and its earlier version from Aurora (Vancouver, BC), the FRD. In addition, the 3D spheroid 1536-well plates were also successfully imaged on PerkinElmer’s ViewLux multimodal plate reader, on the Thermo/Cellomics CellInsight high-content reader using the aforementioned collar/spacer, and on Scripps’ HIAPI imager.
Upon testing these newly designed plates for this effort, their main benefits appear to be (1) the simplicity of their use; (2) the absence of the requirement for an aspiration step during the entire spheroid formation and testing process; (3) the uniformity and reproducibility of spheroid formation, both from across the plate and from plate to plate; (4) the ability to visualize the spheroids; and (5) their compatibility with widespread 1536-well plate compatible instrumentation.
It is notable that the HT-29 cell line incorporated for this work is probably the most well-known and robust spheroid-forming cell line we have tested to date. It is a common cell line to assess for 3D spheroid formation, as described in other literature, 25 which was the purpose of our choice to use it as part of this study. These cells appear to readily form spheroids in 1536-well plates and appear to tolerate the media and conditions tested, evidenced by the linearity of growth demonstrated in terms of volume and luminescence output (see Fig. 2B , C ). The absolute degree to which this cell line will form spheres and for how long remains to be determined, but the spheres appear to be stable and reproducible for use in uHTS efforts out to 96 h and possibly 120 h. The observed decrease in volume of the spheroids following initial seeding is likely due to the fact that the cells are mostly in 2D for the first 48 h. As the HT-29 cells form aggregates, the spheroids become more ordered and compact, which is subsequently followed by a steady increase in volume over the next 96 h. Notably, seeding density must play a role in this, as the volumetric data converge at the later times points of incubation, as shown in Figure 2B . Some of the extended incubation and media limitations can be likely mitigated with a feeding step involving fresh media addition, if desired. As evidence of actual 3D structures of the HT-29 being formed, Z-stack analysis of spheroids was done 96 h after seeding cells. By compiling multiple images taken at 10 µm increments using a confocal microscope fitted with a 10× objective, and applying a heat map based on segmentation, we are able to demonstrate 3D structures ( Fig. 1E , F ). Practically speaking, we do not consider the HT-29 spheroids as a direct comparison to solid tumors, but like others, we intend to use them as a bridge between 2D systems and tumors, bringing us one step closer to direct testing of patient-derived biopsies. 26 How other cell lines perform in the new plates remains to be determined, but it is clear that if cells will easily aggregate into 3D structures, then they will likely be successful in doing so in these plates. Finally, for the cell lines that are not easily coaxed into spheroid formation, there are alternatives, such as the N3D Biosciences Inc. and Greiner Bio-One’s technology (https://www.gbo.com/en_US/news-events/press-releases/news/news-detail/news/detail/News/greiner-bio-one-sponsors-collaboration-involving-emerging-molecular-analysis-technologies-for-cancer-research.html) using gold-laden nanoshuttle particles to label cells and literally pull the cells together for a defined period of time with a magnetic driver. This technology currently exists in 384-well format and is also being developed in 1536-well formats, with future publications comparing the result from both technologies forthcoming.
The cytotoxicity assay described herein allowed us to assay an average of 10 plates/h, approximating a throughput of ~15,000 wells/h, which is well within the ultra-high-throughput paradigm of 100,000 test compounds per day. As a result, the protocol we developed can easily be scaled for primary screens in order to interrogate large collections of compounds. This work constitutes a good example of a successful collaborative endeavor bringing together a nonprofit academic institution with an industrial partner, to generate new tools and consumables that will allow the scientific community to assess critical cellular parameters in a more physiologically relevant context.
Footnotes
Acknowledgements
We thank Pierre Baillargeon and Lina DeLuca (Lead Identification, Scripps Florida) for compound management.
Declaration of Conflicting Interests
The authors declared no potential conflicts of interest with respect to the research, authorship, and/or publication of this article.
Funding
The authors disclosed receipt of the following financial support for the research, authorship, and/or publication of this article: This work was supported by a Scripps special funding proposal.