
Abstract
Our aim was to investigate differences in gene expression in bladder tissues between cystitis glandularis (CG) patients and healthy controls. Subsequent RNA was isolated from urinary bladder samples from CG patients and healthy controls, followed by RNA sequencing analysis. There were 4263 differentially expressed genes in urinary bladder between CG patients and controls, and 8 genes were verified with real-time PCR, Western blot, and enzyme-linked immunosorbent assay (ELISA) analysis. Gene set enrichment analysis (GSEA) revealed that 25 signaling pathways were upregulated in CG patients, and 17 signaling pathways were found upregulated in healthy controls. The mRNA expression levels of the indicated genes, including CCND1, CCNA1, EGFR, AR, CX3CL1, CXCL6, and CXCL1, were significantly increased in urinary bladder from CG and bladder cancer (BC) patients compared with healthy controls, while TP53 was decreased. CX3CL1, CXCL6, and CXCL1 concentrations in peripheral blood from CG and BC patients were significantly increased compared with healthy controls. The protein expression levels of CCND1, EGFR, and AR were significantly increased in urinary bladder from CG and BC patients compared with healthy controls. In conclusion, the gene expression profile of CG patients has established a foundation to study the gene mechanism of CG and BC progression.
Introduction
Cystitis glandularis (CG) is a benign proliferative disorder that occurs in epithelial nests (on Brunn’s nests), in which the nest has undergone eosinophilic liquefaction. 1 Although the cause of CG is debatable, it is generally agreed that in the presence of chronic inflammation, the bladder mucosa becomes hyperproliferative. A previous study found that CG could be induced by upper urinary tract obstruction and accompanied with upper urinary tract obstruction. 2 CG may be a precursor of adenocarcinoma; although the condition masquerading as a bladder tumor is rare, it is reputed to have a low but definite chance of bladder cancer (BC) to develop. 3 For this reason, this finding can be a cause for concern.
Gene expression is a key determinant of cell phenotype. A comprehensive list of genes, gene transcription, and their structure and abundance is beneficial to better understand how gene expression affects phenotypic performance. Microarray technology has become the main method of gene expression research because it can simultaneously detect thousands of transcripts 4 and permit the development of the classification and prediction of cancer outcomes5,6 and identification of molecular makers and pathways dysregulated in diseases, including Alzheimer’s disease, 7 immune thrombocytopenia, 8 and diabetic kidney disease. 9 Although microarrays were widely used, the clinical application was restricted because of the limitations, such as the dependence of existing gene models and the risk of cross-hybridization to probes with similar sequences. 10
Nowadays, RNA sequencing analysis provides digital readouts for mapping and quantifying transcriptomes, and it is a relatively new method for analyzing gene expression. Compared with microarrays, the recent emergence of RNA sequencing technology provides unprecedented analysis of gene expression, including the analysis of unbiased whole-transcriptome, sense and antisense transcription, the characterization of the new class of RNA, and the identification of new mRNA splice variants.11–13 In addition, RNA sequencing offers a greater dynamic range and a more precise and sensitive method to map and quantify RNA transcripts than microarray measurements.4,14
Several studies suggested that the expression of hTERT, p53, PCNA, Cox-2, and UCA1 in tissue will be increased in the process where CG evolves to BC.3,15,16 The identification of many consistent changes of potential importance in BC and CG development, including amplification of EGFR, CCND1, AR, and TP53, was also reported in previous studies.17,18 However, it is clear that many of the genes involved have still not been identified. In the present study, we first analyzed the gene expression landscape of CG by identifying expressed transcripts and quantifying their expression levels by RNA sequencing analysis. Second, we examined the biological signaling pathways associated with CG progress by Gene Set Enrichment Analysis (GSEA) analysis. Lastly, we validated the gene expression levels in CG and BC by real-time PCR, ELISA, and Western blot analysis.
Materials and Methods
Study Subjects
The urinary bladders of three patients with CG (three females, mean age 38.3 ± 4.9 years) and three healthy individuals (three females, mean age 39.6 ± 3.5 years) from Ruijin Hospital Luwan Branch affiliated with the Shanghai Jiaotong University Medical School were randomly selected in our study for RNA sequencing and gene set enrichment analysis (GSEA) analysis. Another 70 urinary bladder and peripheral blood samples from healthy controls (n = 15) and CG (n = 25) and BC (n = 30) patients were recruited for identifying candidate genes by using real-time PCR and enzyme-linked immunosorbent assay (ELISA) analysis, respectively, including 38 females and 32 males, ages 22–69 years (median 44.7 years), and the same healthy controls and CG patients were recruited for Western blot analysis. The BC patients included in our study were developed from the CG. All individuals involved in this study gave informed consent. The study was approved by the regional ethics committee in Ruijin Hospital Luwan Branch affiliated with the Shanghai Jiaotong University Medical School.
RNA Sequencing and Bioinformatics Analysis
RNA sequencing was performed as previously described. 4 Data were normalized by log2, and gene expression changes were considered. Changes in gene expression with a p value of <0.05 and fold change of ≥1.5 were considered statistically significant. GSEA was performed to identify signaling enriched between CG patients and healthy controls. The gene sets showing p < 0.05 were considered enriched between CG patients and healthy controls.
Real-Time PCR
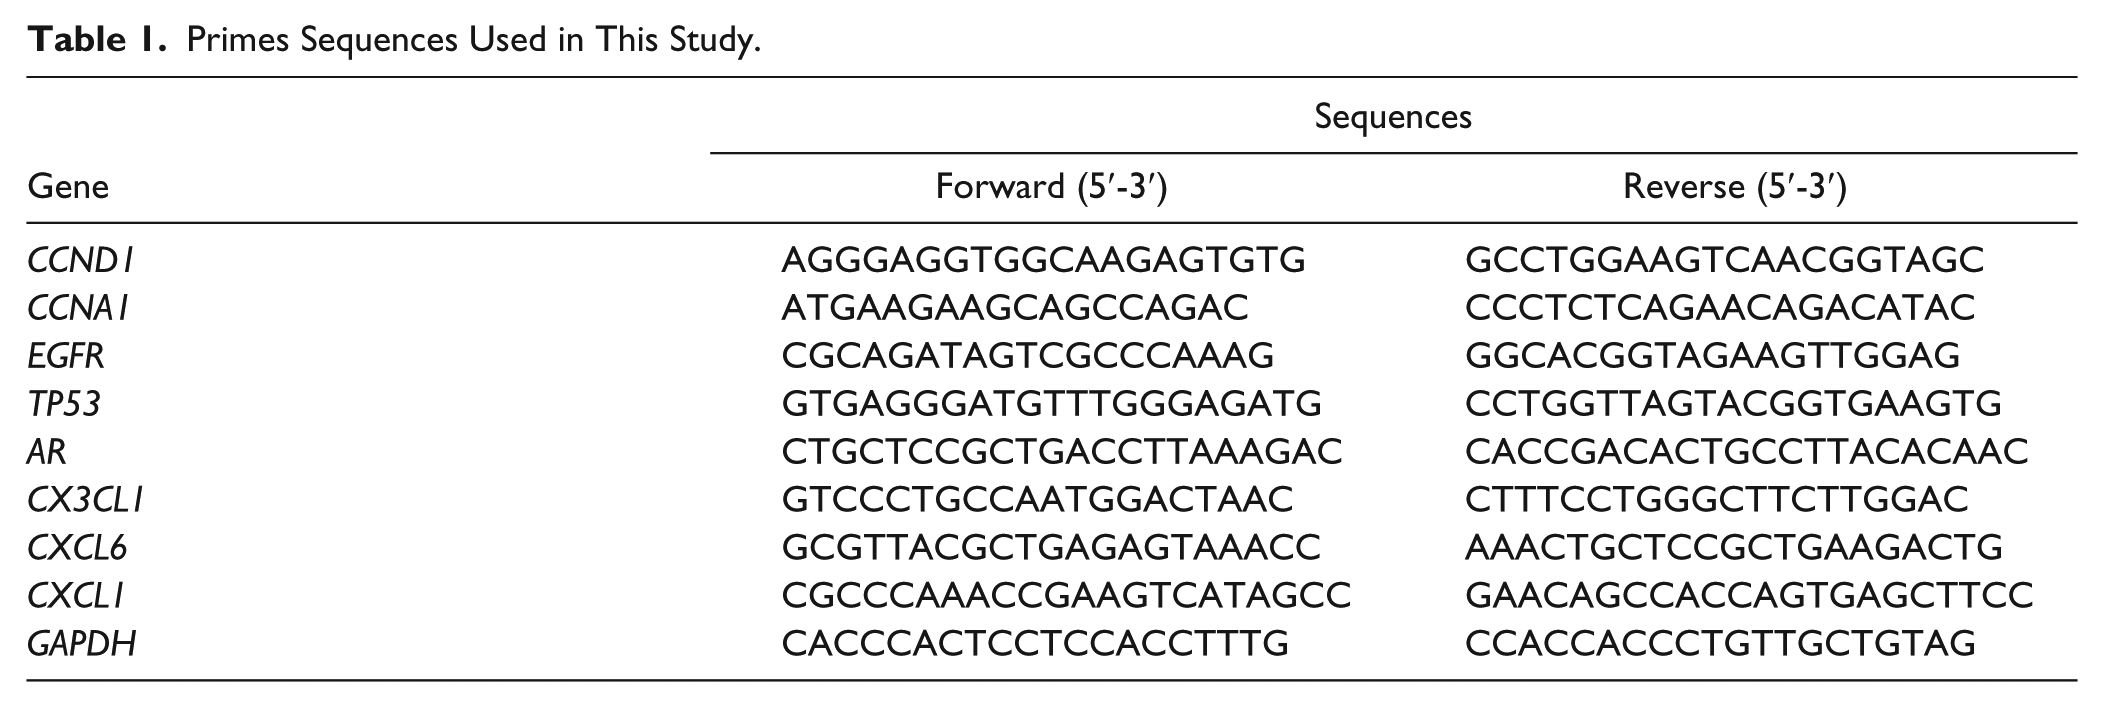
Total RNA was isolated from the urinary bladder of healthy controls and CG and BC patients in Ruijin Hospital Luwan Branch affiliated with the Shanghai Jiaotong University Medical School using Trizol reagent (Invitrogen, Tokyo, Japan) and detected by agarose gel electrophoresis. As the template for PCRs, cDNA was synthesized from 5 μg of RNA using AMV reverse transcriptase (Fermentas, Waltham, MA). Real-time PCRs were performed using SYBR Green 10× Supermix (Dalian, China) in a 25 μL total volume and on a Roche Light Cycler 480II System (Roche Diagnostics Ltd., Basel, Switzerland). Primer pairs ( Table 1 ) for human genes were designed using the Primer Express Software (Applied Biosystems, Shanghai, China). GAPDH was used as the internal control. All PCRs were performed in triplicate, and the relative expression levels of different groups were calculated by normalizing to the mRNA expression level of GAPDH using the 2–ΔΔCt method.
Primes Sequences Used in This Study.
ELISA
Secretions of CX3CL1, CXCL6, and CXCL1 were determined by ELISA. After the peripheral blood was collected from healthy controls and CG and BC patients in Ruijin Hospital Luwan Branch affiliated with the Shanghai Jiaotong University Medical School, the relative content of CX3CL1, CXCL6, and CXCL1 was measured by ELISA according to the manufacturer’s protocol (Boster BioTech, Wuhan, China).
Western Blot
Total protein was extracted from homogenized urinary bladder from CG samples and healthy controls in Ruijin Hospital Luwan Branch affiliated with the Shanghai Jiaotong University Medical School using radioimmunoprecipitation buffer (JRDUN Biotechnology Co., Ltd. Shanghai, China). And then cells were lysed in ice-cold radioimmunoprecipitation assay (RIPA) buffer (Beyotime, Shanghai, China) containing 0.01% protease and phosphatase inhibitor (Sigma, Shanghai, China), and incubated on ice for 30 min. Cell lysis was centrifuged 12,000g at 4 °C for 10 min, and the proteins in supernatant were obtained (20–30 μg) and separated by 10% sodium dodecyl sulfate–polyacrylamide gel electrophoresis (SDS-PAGE) gel, and then transferred electrophoretically to a polyvinylidene fluoride membrane (Millipore, Shanghai, China). The membrane was blocked with 5% bovine serum albumen (BSA) in TBST and incubated with primary antibodies against CCND1, CCNA1, EGFR, TP53, AR, and GAPDH. Blots were then incubated for 1 h at 37 °C with goat anti-mouse or anti-rabbit secondary antibody (Beyotime, Shanghai, China), and intensities were measured using enhanced chemiluminescence (ECL; Thermo Scientific, Shanghai, China).
Statistical Analysis
Data were presented as the mean ± SD. Statistical analysis was performed using GraphPad Prism 5 software (GraphPad Software, Inc., La Jolla, CA). Differential expression for RNA sequencing analysis was evaluated by adjusting the p value for multiple testing using the Benjamini–Hochberg correction with a false discovery rate (FDR) of 0.05. Comparison between the healthy controls and CG or BC patients was analyzed by unpaired, two-tailed Student’s t test. p < 0.05 was considered to be of statistical significance.
Results
Analysis of Gene Expression Pattern in CG Patients
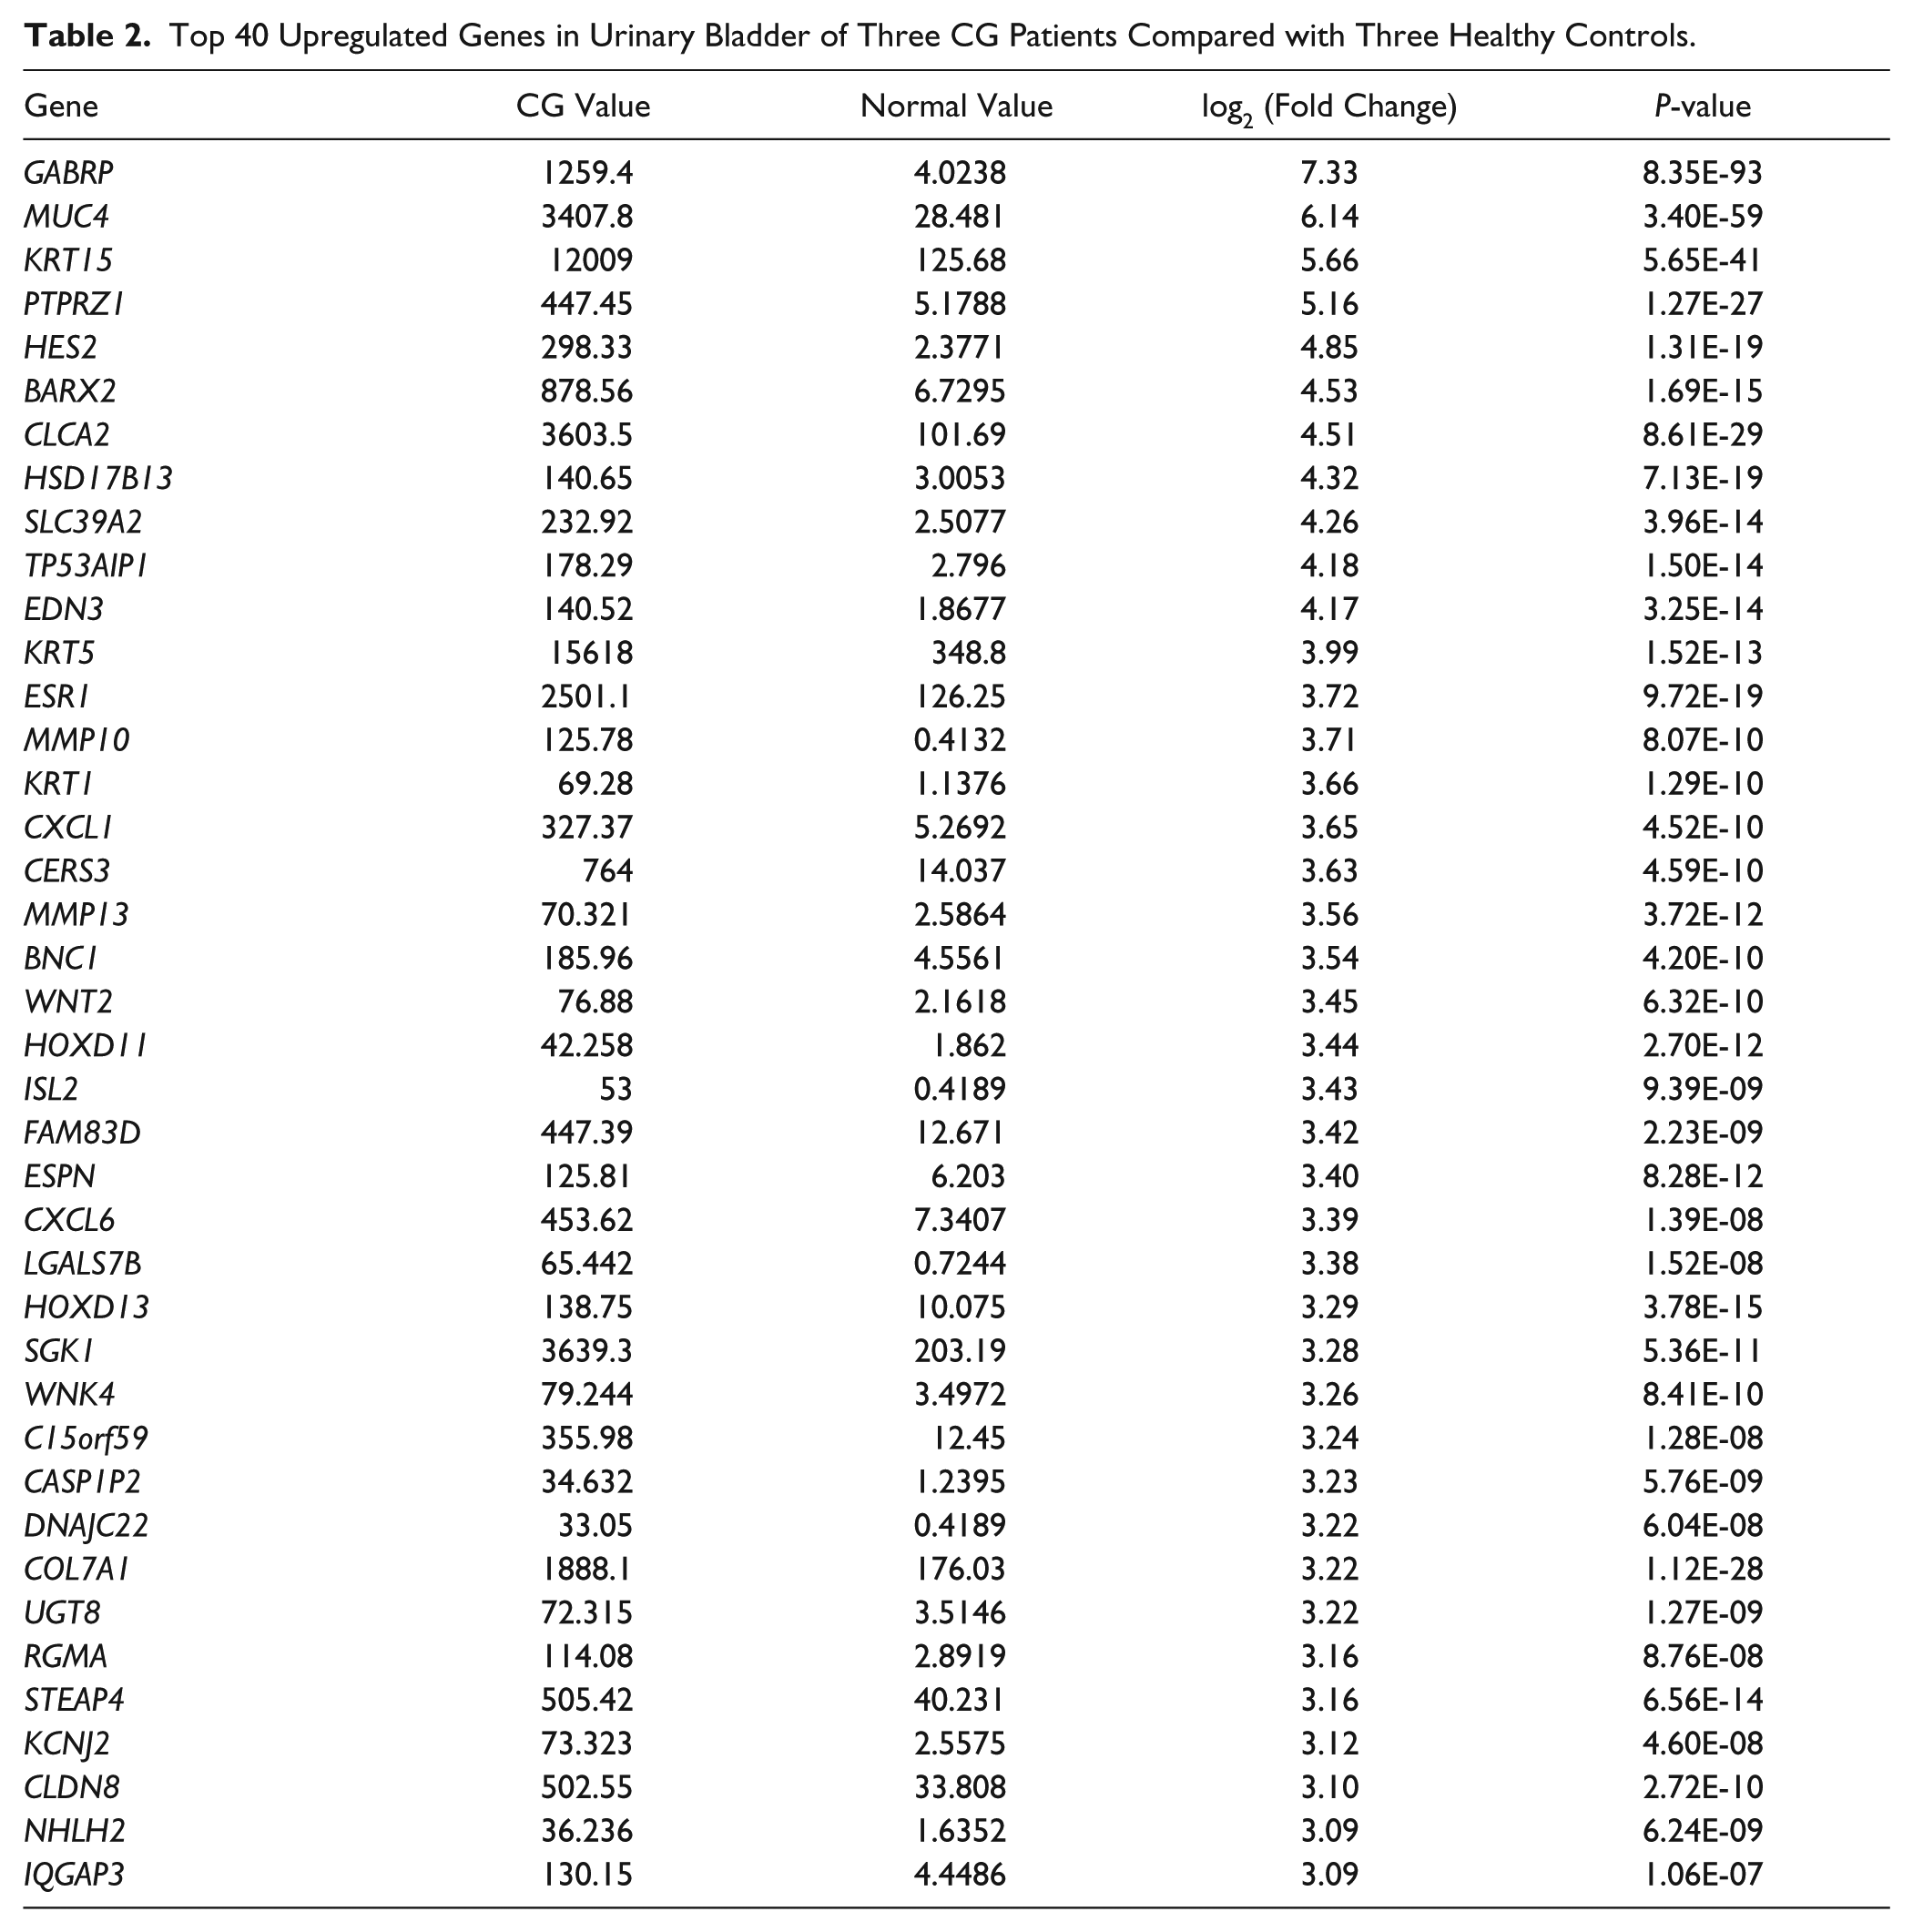
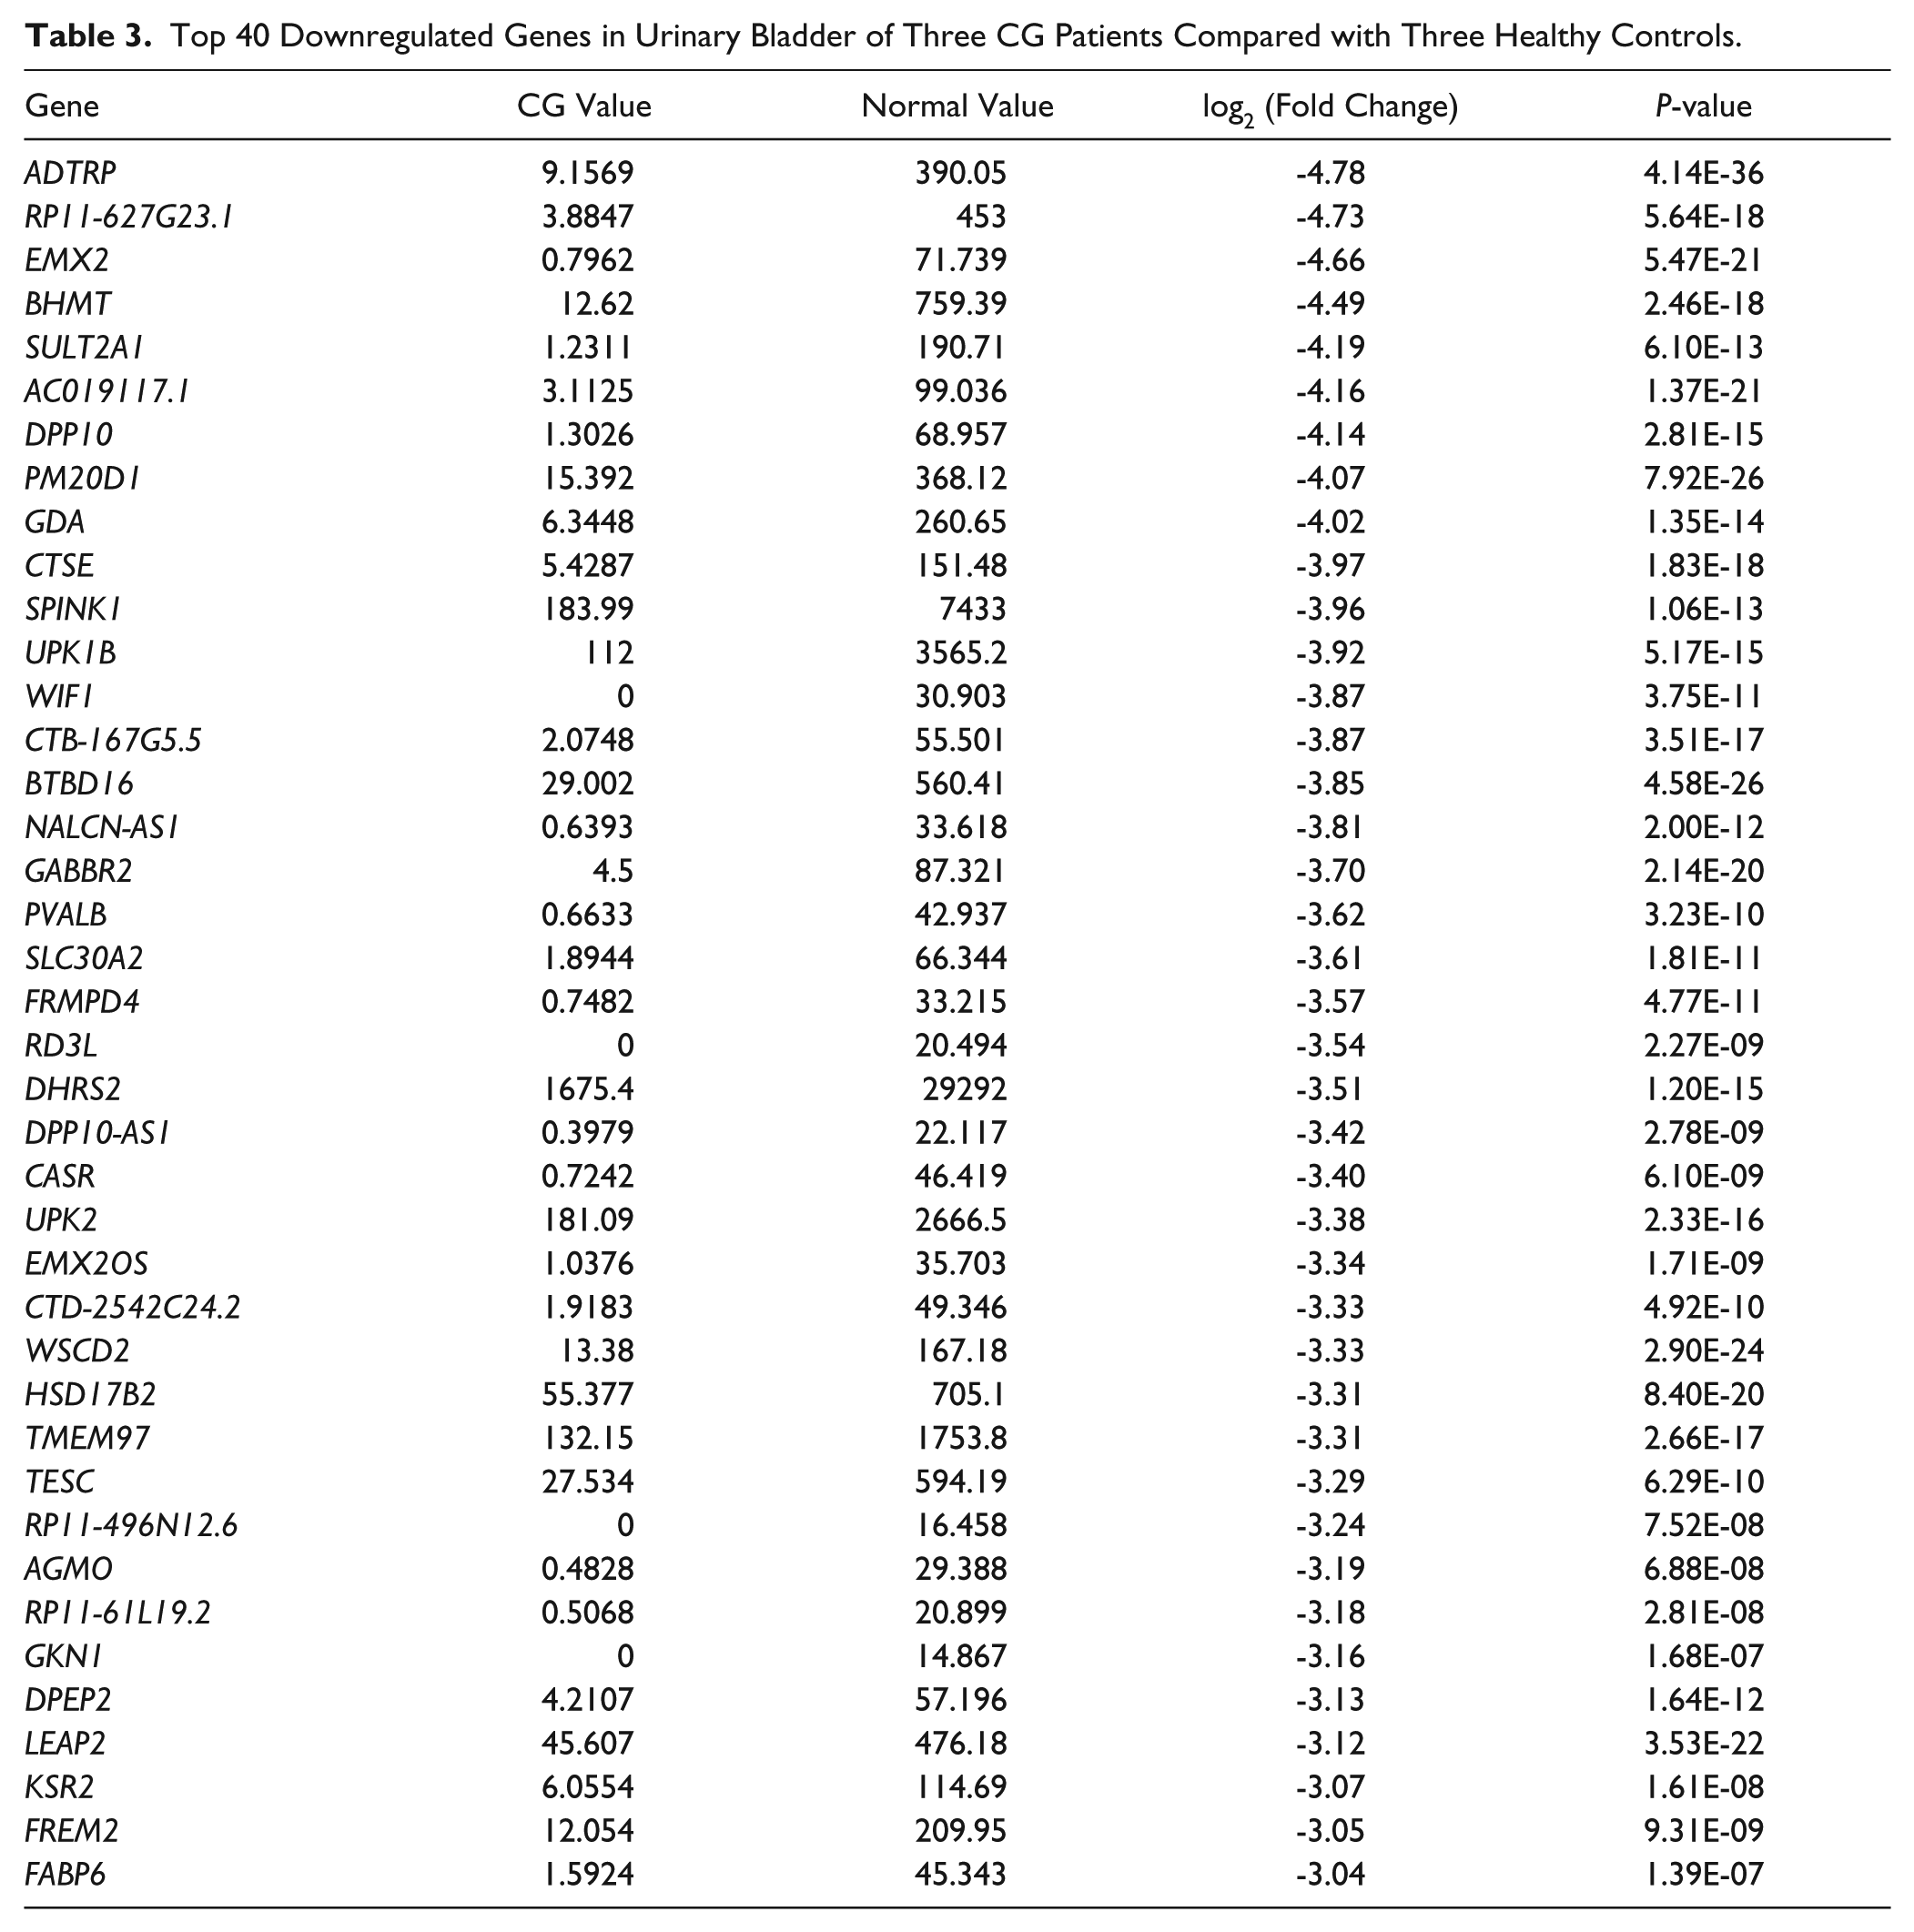
First, we compared the gene expression patterns in six independent specimens of urinary bladder comprising three CG patients and three healthy controls. We identified 4263 specific genes with significant fold changes, among which 2151 genes were upregulated and 2112 genes were downregulated in CG patients compared with healthy controls (p < 0.05, data not shown). Meanwhile, the top 40 upregulated genes, including GABRP (7.33-fold), MUC4 (6.14-fold), KRT15 (5.66-fold), PTPRZ1 (5.16-fold), and HES2 (4.85-fold), and downregulated genes, including ADTRP (4.78-fold), RP11-627G23.1 (4.73-fold), EMX2 (4.66-fold), BHMT (4.49-fold), and SULT2A1 (4.19-fold), were shown in Tables 2 and 3 , respectively.
Top 40 Upregulated Genes in Urinary Bladder of Three CG Patients Compared with Three Healthy Controls.
Top 40 Downregulated Genes in Urinary Bladder of Three CG Patients Compared with Three Healthy Controls.
Multiple Pathways Were Bioinformatically Predicted to Be Correlated to CG
To determine which signaling pathways alter in CG bladder, we performed GSEA analysis. GSEA is a bioinformatical analysis that determines whether an a priori defined set of genes shows statistically significant and concordant differences between two biological states. We generated a gene list with greatest changes using RNA sequencing data, and the enrichment of pathway clusters was evaluated by GSEA. We found that 42 signaling pathways were associated with CG progress, among which 25 pathways were upregulated in CG patients, such as cell cycle, BC, and pathways in cancer ( Suppl. Table S1 ), and 17 pathways were upregulated in healthy controls, such as ribosome, oxidative phosphorylation, and Parkinson’s disease ( Suppl. Table S2 ).
Selection of Predictive Genes
Then, we asked whether the genes that significantly changed and were involved in the pathways were associated with the pathogenesis of CG. To test this hypothesis, three genes (CCND1, EGFR, and TP53) in the BC pathway and two genes (CCND1 and CCNA1) in the cell cycle pathway were selected for further validation. Moreover, another four genes (AR, CX3CL1, CXCL6, and CXCL1) that significantly changed in CG patients compared with healthy controls were also selected as the predictor. The functions of these genes in the pathogenesis of CG have not been well characterized. Thus, we hypothesized that these selected genes may alter their expression in CG patients.
Validation of Predictive Genes
To experimentally validate the alteration of selected genes in CG patients, 15 healthy controls, 25 CG patients, and 30 BC patients were collected. Our real-time PCR analysis showed that the mRNA expression levels of CCND1, CCNA1, EGFR, AR, CX3CL1, CXCL6, and CXCL1 were significantly increased in the urinary bladder of CG and BC patients compared with healthy controls, while the mRNA expression level of TP53 was significantly decreased ( Fig. 1 ). Importantly, the mRNA expression levels of genes were notably different between CG and BC patients, with the exception of CX3CL1, suggesting that these factors may associate with the pathological progression of CG. Furthermore, CX3CL1, CXCL6, and CXCL1 concentrations in peripheral blood from 15 healthy controls, 25 CG patients, and 30 BC patients were also measured by ELISA analysis. As shown in Figure 2 , CX3CL1, CXCL6, and CXCL1 concentrations were significantly increased in CG and BC patients compared with healthy controls, and a notable difference between CG and BC patients was also found in CX3CL1, CXCL6, and CXCL1. Finally, four randomly selected CG patients and four healthy controls were further validated by Western blot for the protein expression of CCND1, CCNA1, EGFR, TP53, and AR. Interestingly, CCND1, EGFR, and AR were significantly increased in CG patients compared with healthy controls, but not CCNA1 and TP53 ( Fig. 3 ). Therefore, the expression pattern of these indicated genes that correlated to CG was not completely similar to those predicted by RNA sequencing and real-time PCR assays.
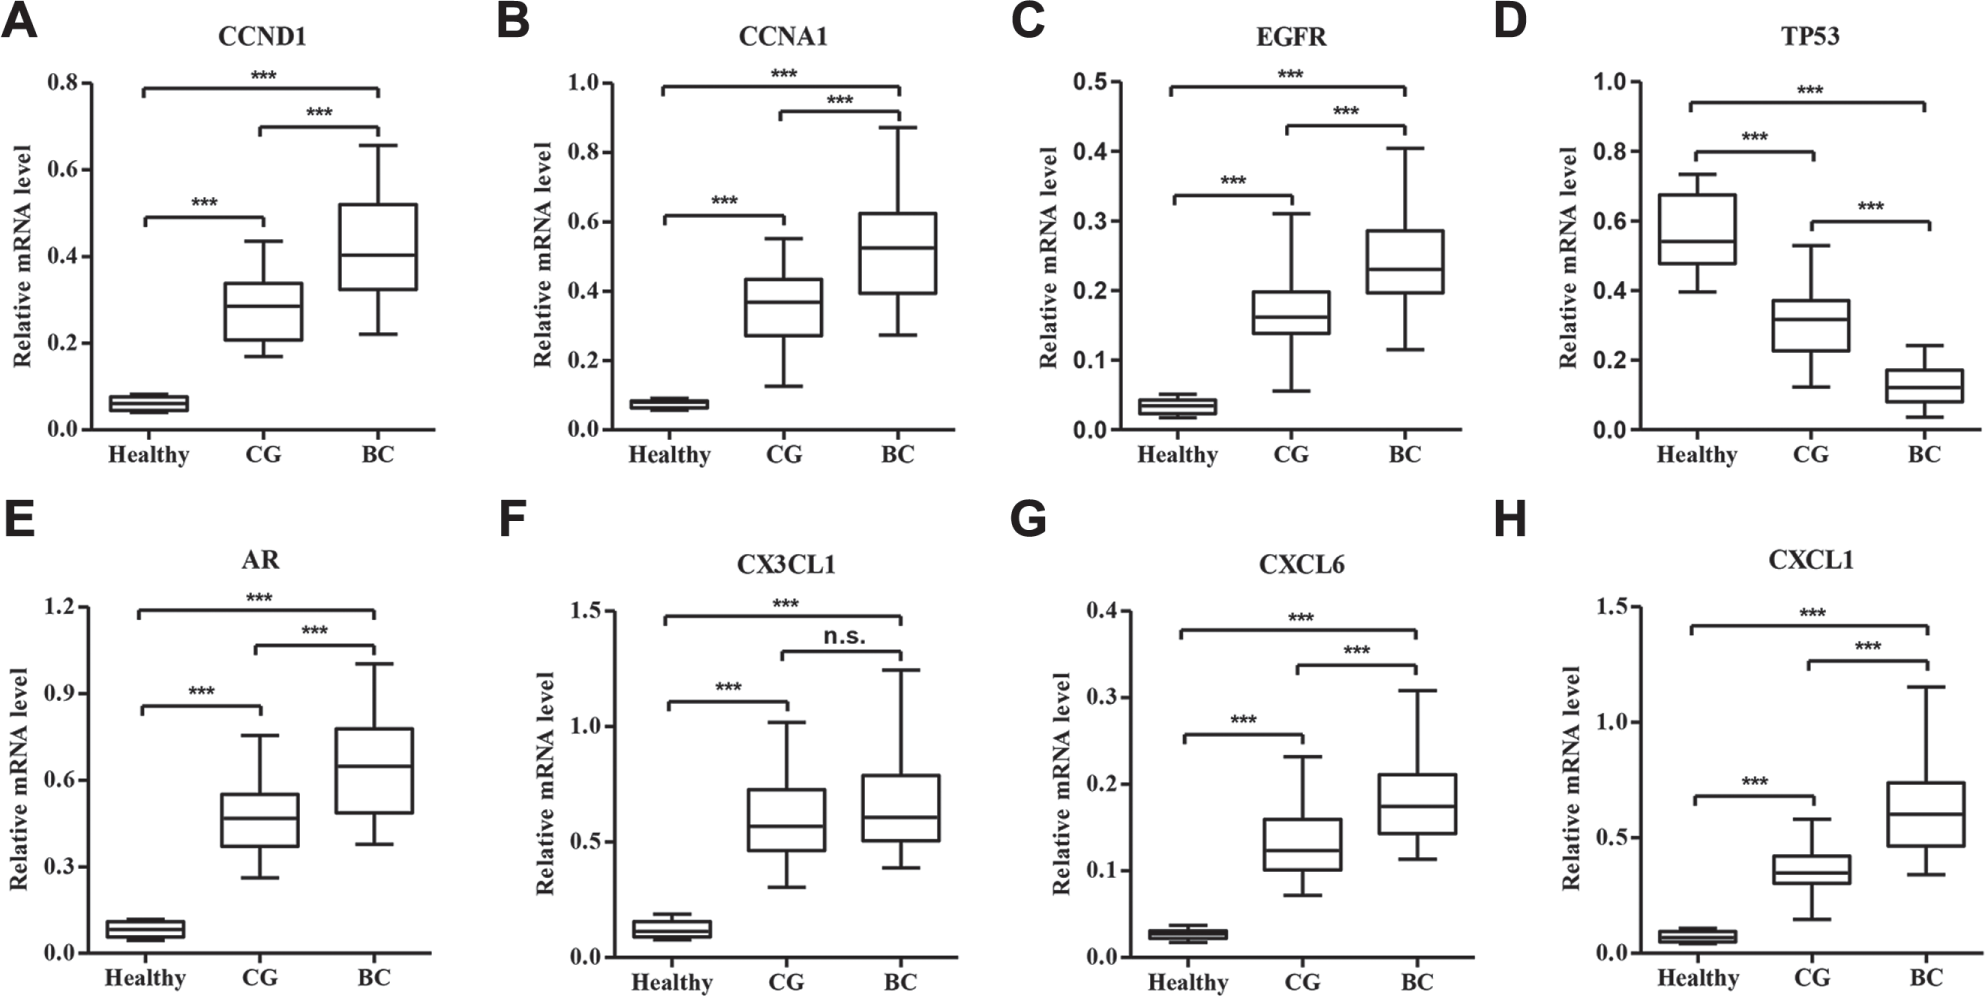
Expression of genes differently expressed between CG patients and healthy controls. To verify the results from RNA sequencing analysis, we analyzed the mRNA expression of eight selected genes in bladder tissues from 25 CG patients, 30 BC patients, and 15 healthy controls by real-time PCR and confirmed the upregulation of CCND1 (
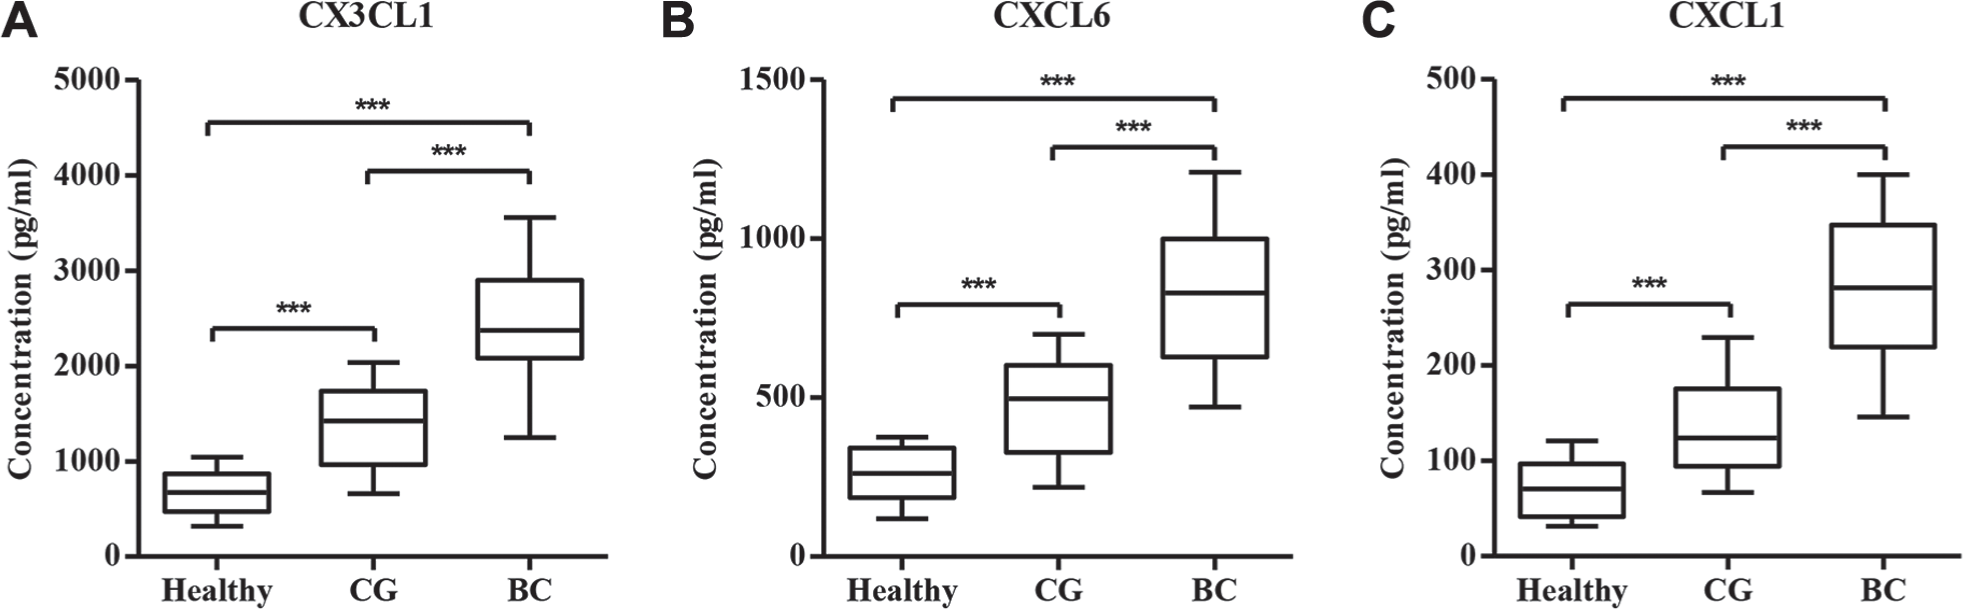
Concentrations of CX3CL1, CXCL6, and CXCL1 in CG patients and healthy controls. To verify the results from RNA sequencing analysis, we analyzed the concentrations of CX3CL1, CXCL6, and CXCL1 in bladder tissues from 25 CG patients, 30 BC patients, and 15 healthy controls with ELISA and confirmed the upregulation of CX3CL1 (
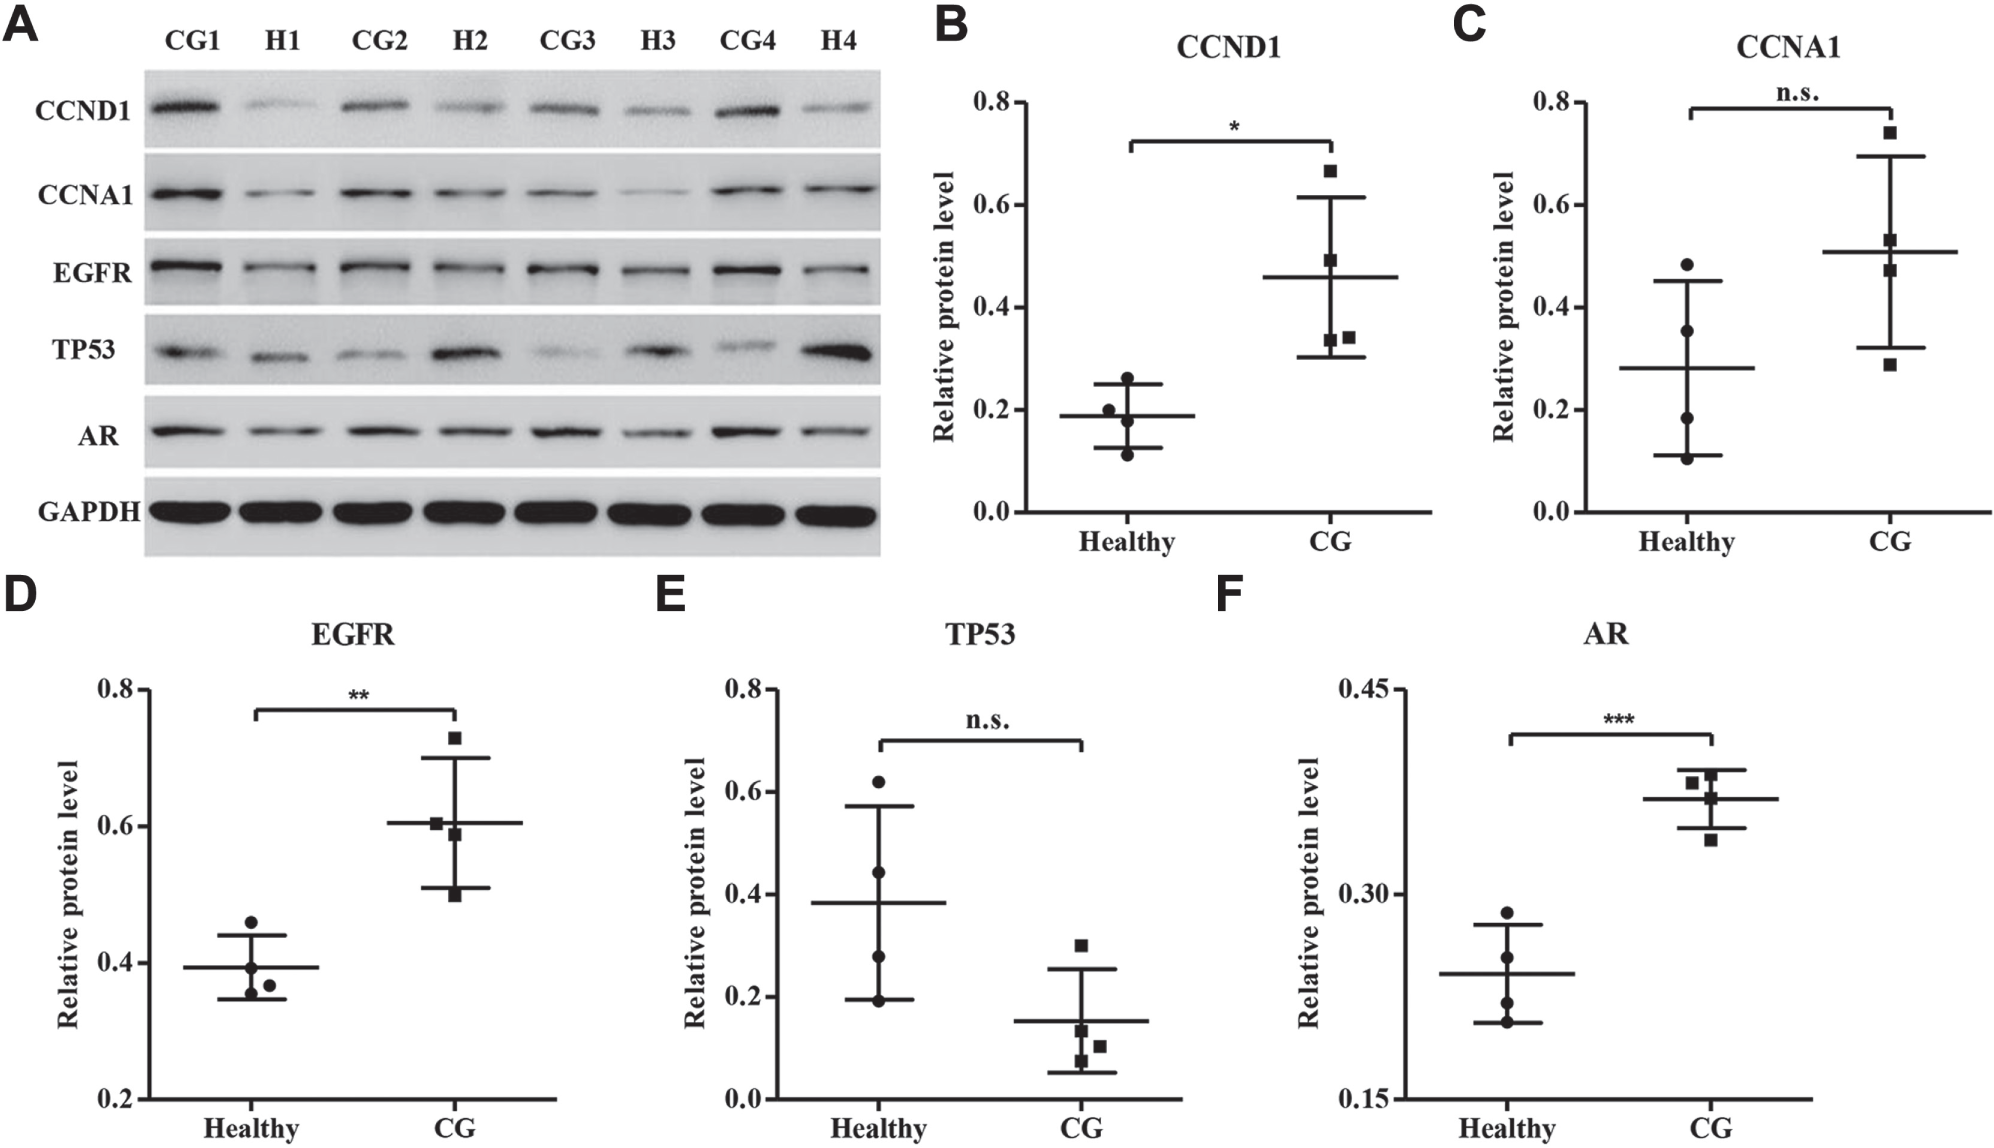
Western blot analysis of gene expression between CG patients and healthy controls. To verify the results from RNA sequencing analysis, we analyzed the protein levels of CCND1, CCNA1, EGFR, TP, and AR in bladder tissues from four CG patients and four healthy controls with Western blot and confirmed the upregulation of CCND1 (
Discussion
CG is an inflammatory bladder lesion considered benign but with uncertain malignant potential. Some authors have described the progression of bladder adenocarcinoma in long-term follow-up, and intestinal metaplasia is a risk factor and putative precursor of BC, although others have disputed this discovery.2,19 Analysis of the transcriptome features in response to CG has greatly enhanced our knowledge of the immunological mechanisms and cellular pathways that underlie disease progression and ultimately active disease. Several studies have shown differentially expressed genes in BC patients.16,20,21 However, the gene expression patterns in CG patients were rarely identified. To better understand which genes are important in CG, we performed RNA sequencing analysis of urinary bladder from CG patients and healthy controls.
The RNA sequencing analysis is a potent approach for analyses of genomic gene expression patterns based on ultra-high-throughput sequencing of total RNA and systematic counts of all expressed transcripts. Recently, RNA sequencing has been used widely because of its sensitive, unbiased, and fully quantitative and qualitative transcriptomic profile observed compared with microarray technology.10,13,14 We identified 4263 specific genes with significant fold changes, among which 2151 genes were upregulated and 2112 genes were downregulated in CG patients compared with healthy controls. Consistent with our data, previous studies have observed that UPK3A, FRFR3, HRAS, EGFR, CCND1, MYC, TP53, and E2F3 expression is associated with CG progress or BC tumorigenesis.22,23 Moreover, cell cycle, BC, and the MAPK, Notch, and JAK/STAT signaling pathways were upregulated in CG patients compared with healthy controls, and oxidative phosphorylation, asthma, Parkinson’s disease, Alzheimer’s disease, and the PPAR signaling pathway were upregulated in healthy controls compared with CG patients. These findings suggest that CG is associated with an unspecific and wider gene activation profile. Several reports have shown that adenocarcinoma of the bladder is associated with CG.3,24 The MAPK signaling pathway was activated in urinary bladder tumorigenesis through EGFR-dependent cell survival. 25
To verify some of the differences observed in the RNA sequencing analysis, we performed real-time PCR analysis in another independent sample of urinary bladder from healthy controls and CG and BC patients. We analyzed the expression of CCND1, CCNA1, EGFR, TP53, AR, CX3CL1, CXCL6, and CXCL1 in CG patients, which showed results similar to those of our RNA sequencing analysis. Importantly, the mRNA expression levels of genes were notably different between CG and BC patients, with the exception of CX3CL1, suggesting that these factors may associate with the pathological progression of CG. CCND1 and CCNA1 are regulators of progression through the G1 and S phases during the cell cycle, 26 respectively, which is consistent with our findings that cell cycle positively correlated with CG. EGFR was significantly enriched in CG patients included in the BC pathway, but TP53 was enriched in healthy controls compared with CG patients, which is in line with a previous study where Srivastava et al. 18 detected positive EGFR expression and allelic imbalance of TP53 in typical CG and glandular dysplastic foci.
We also analyzed these predictors in the healthy controls and CG patients by ELISA and Western blot analysis. We found that the concentrations of chemokines, including CX3CL1, CXCL6, and CXCL1, were elevated in the peripheral blood of CG and BC patients compared with healthy controls, with significant differences between CG and BC patients, similar to the results measured by RNA sequencing and real-time PCR analysis. Over the past several years, there has been emerging evidence that multiple pairs of chemokines and their receptors play critical roles in BC progression.27,28 Finally, the protein expression of CCND1, EGFR, and AR in urinary bladder was significantly higher in CG patients than in healthy controls, with the exception of CCNA1 and TP53, measured by Western blot. These results were greatly differing from those measured by RNA sequencing and real-time PCR analysis. However, the most likely explanations are that the real-time PCR assay we used is more sensitive than the Western blot method and the number of patients we collected in the real-time PCR assay (n ≥15) was larger than that in the Western blot assay (n = 4). Nevertheless, the correlation between these genes and the pathogenesis of CG has not been well identified, and this is our first time identifying the altered expression of these genes in CG patients.
We recognize several limitations to the present study, which need to be considered when interpreting these results. First, although this cohort quite accurately reflects the normal span of patients in a clinic, the sample size is quite small due to the rarity of the disease. Second, clinical parameter information necessary to assess a correlation between differentially expressed transcripts and markers of disease progression needs to be further validated. Last, the pathways should be further clarified in future investigation, especially those not involved in the immune- and BC-related signals.
In conclusion, we have performed a comprehensive analysis of the transcriptome response using RNA sequencing, real-time PCR, ELISA, and Western blot. In this study, we (1) identified 4263 specific genes with significant fold changes between healthy controls and CG patients, and (2) validated eight genes, CCND1, CCNA1, EGFR, TP53, AR, CX3CL1, CXCL6, and CXCL1, in the urinary bladder and peripheral blood of CG and BC patients compared with healthy controls. Targeted intervention of these genes may offer novel therapeutic approaches in an effort to attenuate the initiation and progression of CG.
Footnotes
Supplementary material is available online with this article.
Declaration of Conflicting Interests
The authors declared no potential conflicts of interest with respect to the research, authorship, and/or publication of this article.
Funding
The authors received no financial support for the research, authorship, and/or publication of this article.
References
Supplementary Material
Please find the following supplemental material available below.
For Open Access articles published under a Creative Commons License, all supplemental material carries the same license as the article it is associated with.
For non-Open Access articles published, all supplemental material carries a non-exclusive license, and permission requests for re-use of supplemental material or any part of supplemental material shall be sent directly to the copyright owner as specified in the copyright notice associated with the article.