
Abstract
In this study, the fabrication – that is, weaving and softening of linen fabric – was accomplished by on-loom integrated finishing on a handloom using a special attachment. The optimization of the process parameters (finish liquor concentration, temperature and curing time) for these on-loom integrated softening finished fabrics were investigated. The softened linen fabric was studied for their physical properties like softness, drapeability, wickability, water vapour permeability, air permeability, total crease recovery angle, tensile and tear strength against untreated fabric and also compared with similar finished market sample. Furthermore, chemical interaction of the softener with linen fabric and their morphology were studied by the Fourier transform infrared and scanning electron microscopy, respectively. The results showed that as the concentration of the finish liquor increased, the softening effect increased, while wickability decreased after the particular optimum point. It was observed that drapeability, total crease recovery angle, tensile and tear strength were increased till the optimum point with the increase in process parameters. However, water vapour permeability and air permeability were decreased. The Fourier transform infrared and scanning electron microscopy studies clearly proved the presence of softener chemical and a coating of a thin layer on the fabric. The optimum process parameters of concentration of the finish liquor, curing temperature and curing time were found to be 10 g/L, 60°C and 5 min, respectively, for softening of linen fabric using this integrated finishing method.
Introduction
Linen is the premium natural fibre used in high-value men’s shirtings. 1 Due to its high moisture regain among all natural fibres, linen fabrics are commonly used in all seasons in tropical regions and particularly during summer. Because of this characteristic, it is preferred as summer wear. It is famous for its royal look and thereby considered as premium wear. Unlike synthetic fibres that take a longer time for biodegradation, it does not harm the environment. 2 The linen fabric woven on a handloom with an integrated finishing method is eco-friendly.
Despite the advantages of linen fabrics, which are made from natural flax fibre, it is stiffer than cotton as it is extracted from the stem of the flax plant. 3 The linen fabric becomes softer after multiple washes. 4 But, initially, it requires softening treatment to make it suitable to wear and drape better. Thus, it is necessarily processed after weaving in processing mills to impart a softness property to the fabric. Commonly, softeners are employed to impart flexibility and drapeability to the textile fabrics. 5 In this regard, polysiloxanes, mixtures of inorganic–organic structure, having attractive properties like thermal stability, spreadability, oxidative stability and low fire hazard are commonly used. 6 There are various types of silicone softeners such as polydimethylsiloxane, polymethylhydrogensiloxane and organo-functional silicones for textile applications. 7 Organo modified silicones containing either amino or epoxide or alcohol groups show greater degree of softening and excellent durability compared with other silicone softeners. 8 Apart from softening agent, curing temperature and curing time are crucial factors in affecting the performance properties of softened fabrics. In this study, the linen fabric is imparted with softening finish during the weaving process on a handloom attached with an on-loom integrated finishing device.
Materials and Methods
Materials
Softener
Softening agents containing chemical composition of organo modified polysiloxane were used, which were obtained from Finish Chemical supplier.
Market Sample
With the help of Finish Chemical supplier, the manufacturer who utilized the finishing chemical in the production of the market sample (MS) was identified. The finished product with the same finishing chemical was chosen as for the MS. On analysis of the MS, the specification for on-loom development of samples (DSs) was derived, and the loom was set up accordingly for developing samples.
DSs
The loom is set up with the required reed as per analysed data for the MS. The linen warp yarn is sized by applying high quality ‘Warping oil’ while beaming. The oil used is highly refined, hydro processed, fortified with special emulsifier and antistatic additives. It is water soluble, emulsifiable and imparts flexibility to the linen yarns by reducing abrasion resistance to enable for smooth weaving. There is no starch used; thus, desizing is not necessary before applying finish.
Specification of MS and DSs
The specification was warp × weft count: 60 Lea × 60 Lea, ends/inch: 56; picks/inch: 48, weave: plain, GSM: 120. On-loom DS was done by setting up the loom with the same specifications.
Methods
On-Loom Integrated Finishing
The on-loom integrated finishing device attached to handloom mainly consists of three important parts viz. finish applicator, guide roller and curing chamber. A photograph of the handloom with on-loom integrated finishing device attached is shown in Figure 1.
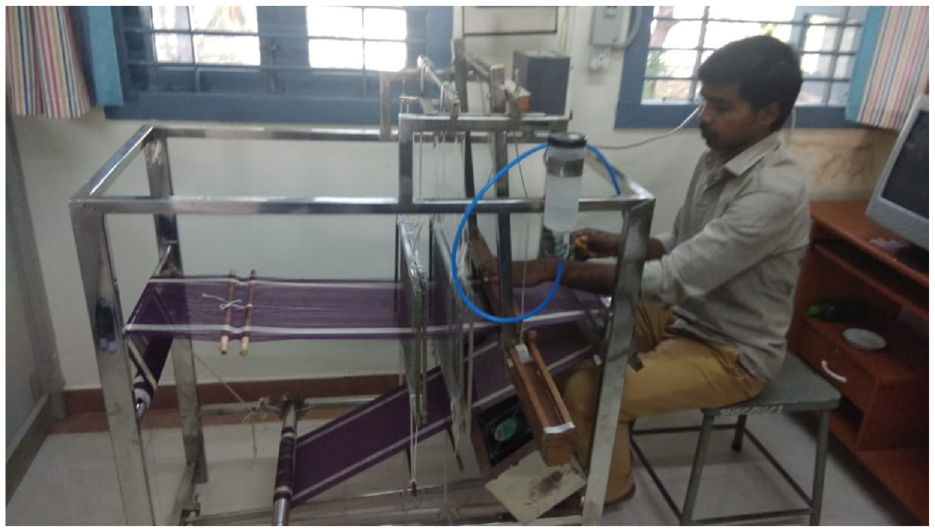
Photographic image of handloom with on-loom integrated finishing device attached.
The passage of materials, that is, warp, conversion of the same into finished fabric is shown in Figure 2. Finish liquor is applied on the woven fabric by the finish applicator. It is evenly squeezed over the width and spread over both sides of the fabric with the help of a guide roller pressing against the curved edge of the front rest, dried in the extended enclosure drying chamber and cured in the curing chamber before winding on the cloth roll. The curing chamber is controlled by a digital controller, which can control the curing chamber temperature from 30°C to 150°C, and curing time can be set from 30 s to 15 min using the digital controller.
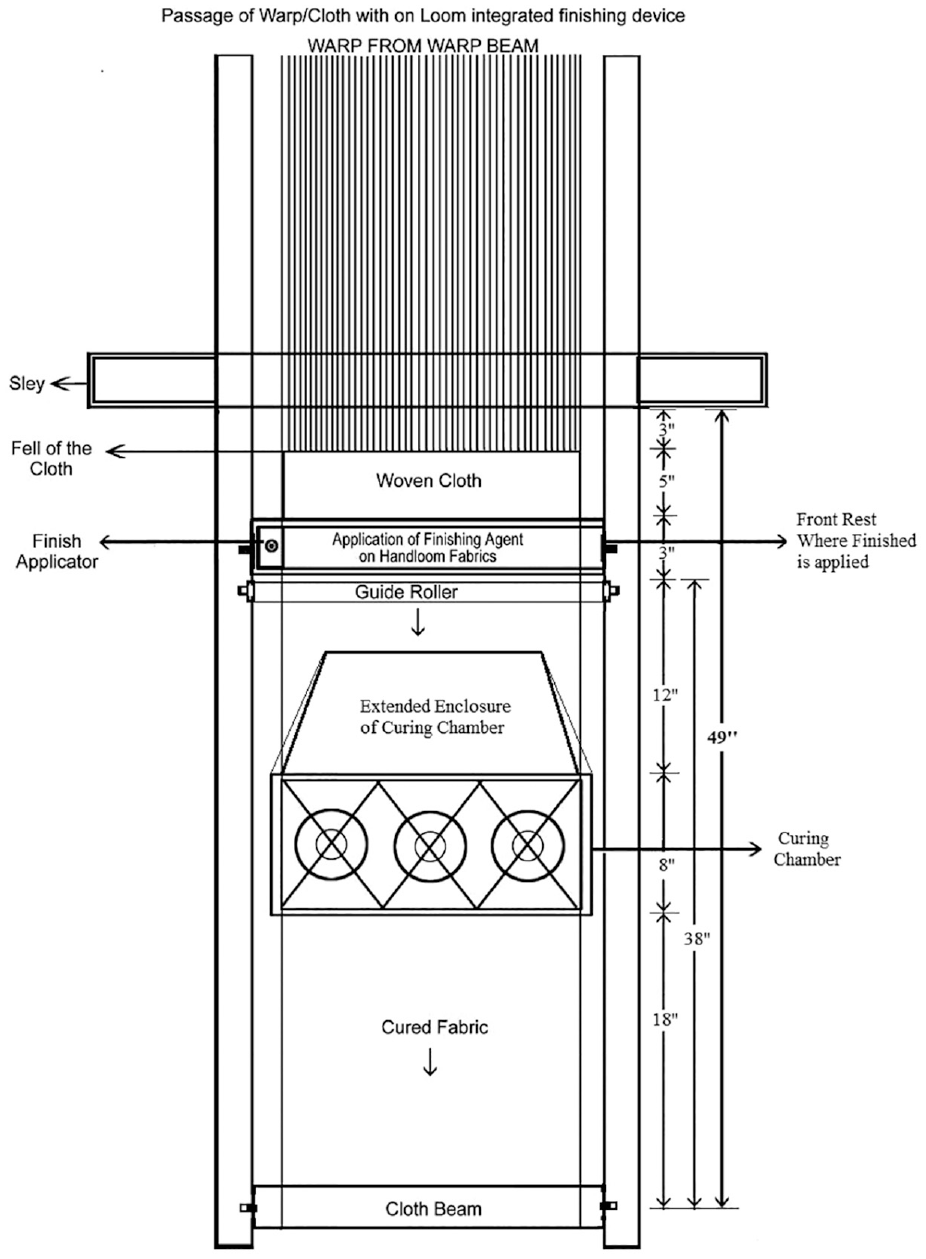
Passage of material in the loom with the on-loom integrated finishing device.
Application of Softener Using On-loom Integrated Finishing Device
Initially, the finish liquor solution is prepared by diluting the softening agent with water to a concentration of 5–15 g/L. The pH of the softening liquor was maintained at 5 using acetic acid. The loom was set up with linen warp to weave light weight linen (LWL) fabric suitable for made-ups/men’s shirting fabric with the following specifications: warp × weft count: 60 Lea × 60 Lea, ends/inch: 56, picks/inch: 48, weave: plain and GSM: 120.
The handloom weaver starts weaving after gaiting up the warp. Before starting the weaving, the finish liquor drip flow is opened and the digital controller of the curing chamber is switched on. The weaver continues weaving till it is convenient to form the shed, that is, the sley touches the fabric fell. This is the stage at which the secondary operation of let-off and take-up is to be done. Before doing this secondary operation, the weaver applies the finish on the woven fabric with the help of the ‘Finish Applicator’ which slides on the rails of the front rest. The finish is applied to woven fabric lying on the front rest by the stroke of the finish applicator. Two strokes are given for even application and to bring back applicator to its original position. Then, the secondary process of let-off and take-up is done on the handloom. While doing this take-up operation, the woven and finish applied fabric, while moving towards the cloth, the roller get squeezed with the help of a guide roller that presses against the curved edge of specially designed front rest, thus causing even spreading of finish liquor throughout the width as well as both sides of the fabric. As the digital controller is already switched on, the hot air in the extended enclosure of the drying chamber dries the fabric and on the next cycle of further weaving and take-up, the dried fabric enters the curing chamber, and during the next cycle of take-up, the cured fabric comes out to get wound onto the cloth roll. The weaver synchronizes the time to weave the length of the cloth with curing time duration to enable continuous weaving.
The MS applied with the same finish in a conventional finishing method was tested for the softening effect of finish and other physical properties. The process parameters like concentration of finish liquor, curing temperature and curing time were investigated using the on-loom integrated finishing device. The softening effect of the finish was tested by varying the process parameters and by comparing the softening effect and other properties of MS and untreated (UN) fabric sample.
Characterization
Fourier Transform Infrared Spectroscopy
A square fabric of 10 mm was cut from the integrated woven and finished handloom fabric for Fourier transform infrared (FTIR) analysis. The fabric was placed on the ATR crystal, and FTIR spectra of fabrics were recorded from 4000 to 400 cm−1 with 30 scans at a resolution of 4 cm−1 (make: Shimadzu, model: IRAffinity-1, Japan).
Scanning Electron Microscopy
The surface morphology of linen fabrics was observed by scanning electron microscopy (SEM) (JSM-6360, JEOL). In order to avoid surface charging effect of fabrics, a double coating of gold was applied for 180 s by sputtering.
Yarn Count
The length-to-weight ratio as per the standard system decides the count of yarn. The yarn count of small length samples was tested through the Beesley Balance as per standard test method ASTM D1059. The warp and weft yarn of the fabric samples were tested for their count using standard test method.
Ends per Inch and Picks per Inch
The ends per inch (EPI) and picks per inch (PPI) of the selected woven samples were counted manually using counting glass as per ASTM D3775 standard testing method. The counting glasses available for counting threads are in the size of ¼”, ½” and 1” size. The number of ends in warp/picks in weft was counted for 1” and expressed as EPI and PPI.
Grammes per Square Metre
Grammes per square metre (GSM) of the fabric samples were tested by the ASTM D3776 standard testing method using a GSM cutter and electronic weighing balance. This can be used to determine the GSM of fabric weights up to 600 g with an accuracy of 0.01 g. The sample was cut to the size of 100 sq cm by the GSM cutter. The cut sample was weighed in an electronic balance to directly get the weight in GSM.
Tensile Strength
All the fabric samples were evaluated for their tensile properties using a digital tensile tester according to the ASTM D5034-09(2017) standard testing method. The test sample size was 200 mm long by 50 mm wide. The tensile strength of UN fabric was considered as 100, and on this basis, the percentage strength retention of the DSs and MS was calculated.
Tear Strength
The tear strength properties of fabric samples were measured as per D1424ASTM-09 (2013) standard test method using the Elmendorf tear strength tester. The test results for the samples were obtained in kg. The tear strength of UN fabric was considered as 100, and on this basis, percentage strength retention of the DSs and MSs was calculated.
Bending Length
The bending length of cloth samples was measured as per BS 3356:1990 standard method using the Stiffness Tester. A fabric sample was cut to the size of 6” × 1” and was moved on a horizontal platform of the apparatus. The bending length was measured from the downwards bending of the fabric.
Drapeability and Drape Coefficient (%)
The drapeabiltiy of cloth sample was tested in Drape Tester with the BS-5058 standard test method by determining the drape coefficient of the fabrics which was measured by tracing a shadow of the draped specimen on paper. The ratio of the projected area of the cloth sample to its original area is called the drape coefficient. The drape coefficient (%) was calculated using the following equation (1):

Total Crease Recovery Angle
Samples were tested in a crease recovery tester by determining the recovery tendency of fabric and by creasing for a predetermined time using a suitable load as per the AATCC TM66-2017e2 standard testing method. After loading to a predetermined time in the clamp of the tester, the sample was allowed to recover and the angle of recovery was recorded. Crease recovery angle of warp and weft was found separately and added together to express as total crease recovery angle (TCRA) in degrees.
Air Permeability
The air permeability of samples was measured by the ASTM D737 standard testing method using the air permeability of the tester. The rate of air flow was calculated from air passing perpendicularly through a known area and the air pressure differential between the top and bottom surfaces of fabrics. The result of UN sample was considered as 100, and on the basis the percentage reduction in air permeability (AP%) of DS and MS was calculated.
Water Vapour Permeability
Water vapour permeability (WVP) or moisture vapour transmission rate for all the fabric samples was tested using cup method according to the ASTM E96-22 standard testing procedure. In the cup method, the initial weight of the fabric was noted, and the loss in weight of the fabric due to evaporation of water vapour from the fabric after 24 h was estimated. The moisture vapor transmission rate was calculated from equation (2):
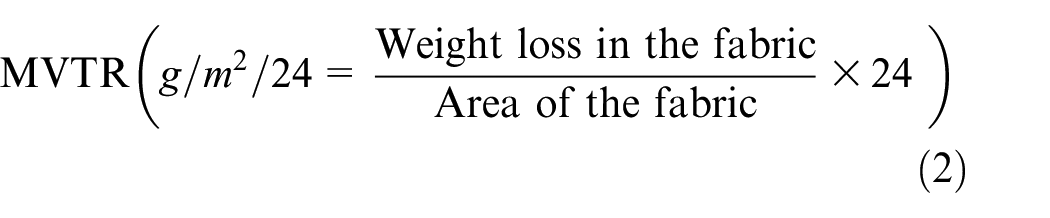
where the area of the fabric sample on the cup was 0.1164 m2.
The result of the UN sample was considered as 100, and on that basis the percentage reduction in WVP of DS and MS was determined.
Statistical Analysis
All the data were statistically analysed using the ‘t’ test. A p-value less than 0.05 was considered statistically significant.
Results and Discussion
FTIR Spectroscopy
The chemical interactions of UN linen (control) and silicone-treated linen were analysed using FTIR spectra as shown in Figure 3. It is known that linen is made up of cellulose fibres, which contain –OH, –CH,–CH2, –C–O–C– and pyranose ring in their molecular structure. In the case of UN linen, a broad peak at 3335 cm−1 is due to –OH stretching vibrations. A doublet peak at 2904 and 2853 cm−1 is due to the characteristic stretching vibration of –CH and –CH2, respectively. The bending vibration of adsorbed water (H–O–H) is found at 1638 cm−1. Strong peaks at 1431, 1315, 1159 and 1103 cm−1 are related to –CH2 scissoring, –CH2 wagging, –C–O–C stretching and –C–O stretching, respectively. In general, pyranose ring vibrations are found between 1200 and 1000 cm−1. The presence of skeletal stretching vibration of –C–O can be found at 1034 cm−1. A small peak at 895 cm−1 is attributed to glycosidic linkage between glucose units in cellulose. The characteristic peak at 663 cm−1 can be assigned to –OH out of phase bending.9–12
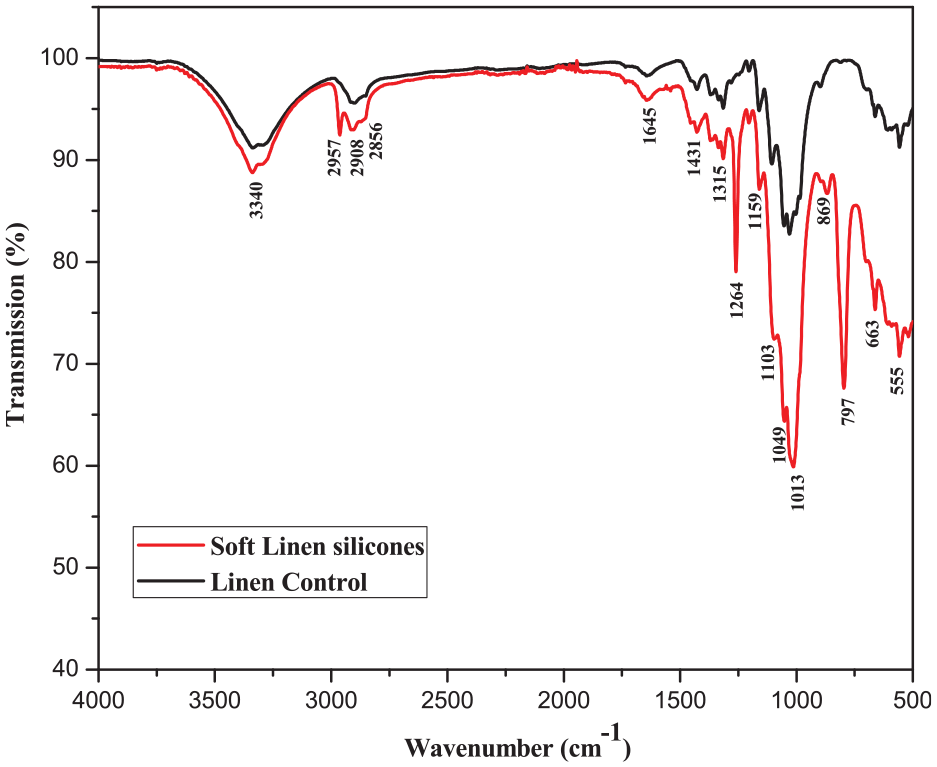
FTIR spectra of linen control (untreated) and softening finished linen fabrics.
The silicone-treated linen showed various vibrations of –Si–CH3,–Si–C, Si–O–Si and –OH with all characteristic vibrations of cellulose as shown in Figure 3. An obvious presence of two strong peaks at 1264 and 797 cm−1 in polysiloxane (silicone) coated linen is due to the stretching vibration of –Si–CH3 and –Si–C, respectively. The characteristic vibrations of Si–O–Si bonds, which are highly flexible in silicones,13,14 can be observed at 1013 cm−1. Furthermore, it can be deciphered from the FTIR spectra of silicone-treated linen that transmittance intensity is significantly higher than in UN linen. This can be attributed to strong interactions of silicones with linen containing cellulose moieties. These FTIR results reveal that the silicone coating is present on the linen fabric.
SEM Analysis of Treated and UN Fabrics
The morphologies of unfinished (control) and finished fabric samples were examined by SEM as shown in Figure 4. SEM helps to identify the presence of the coating material on the UN fabric samples. At lower magnifications of 1000× and 5000×, the shape and size of fibre can be observed. However, a higher magnification of 10,000× can clearly exhibit the difference between the unfinished and finished fabric samples. Therefore, different magnifications of SEM images are given to observe the morphological changes for better understanding.
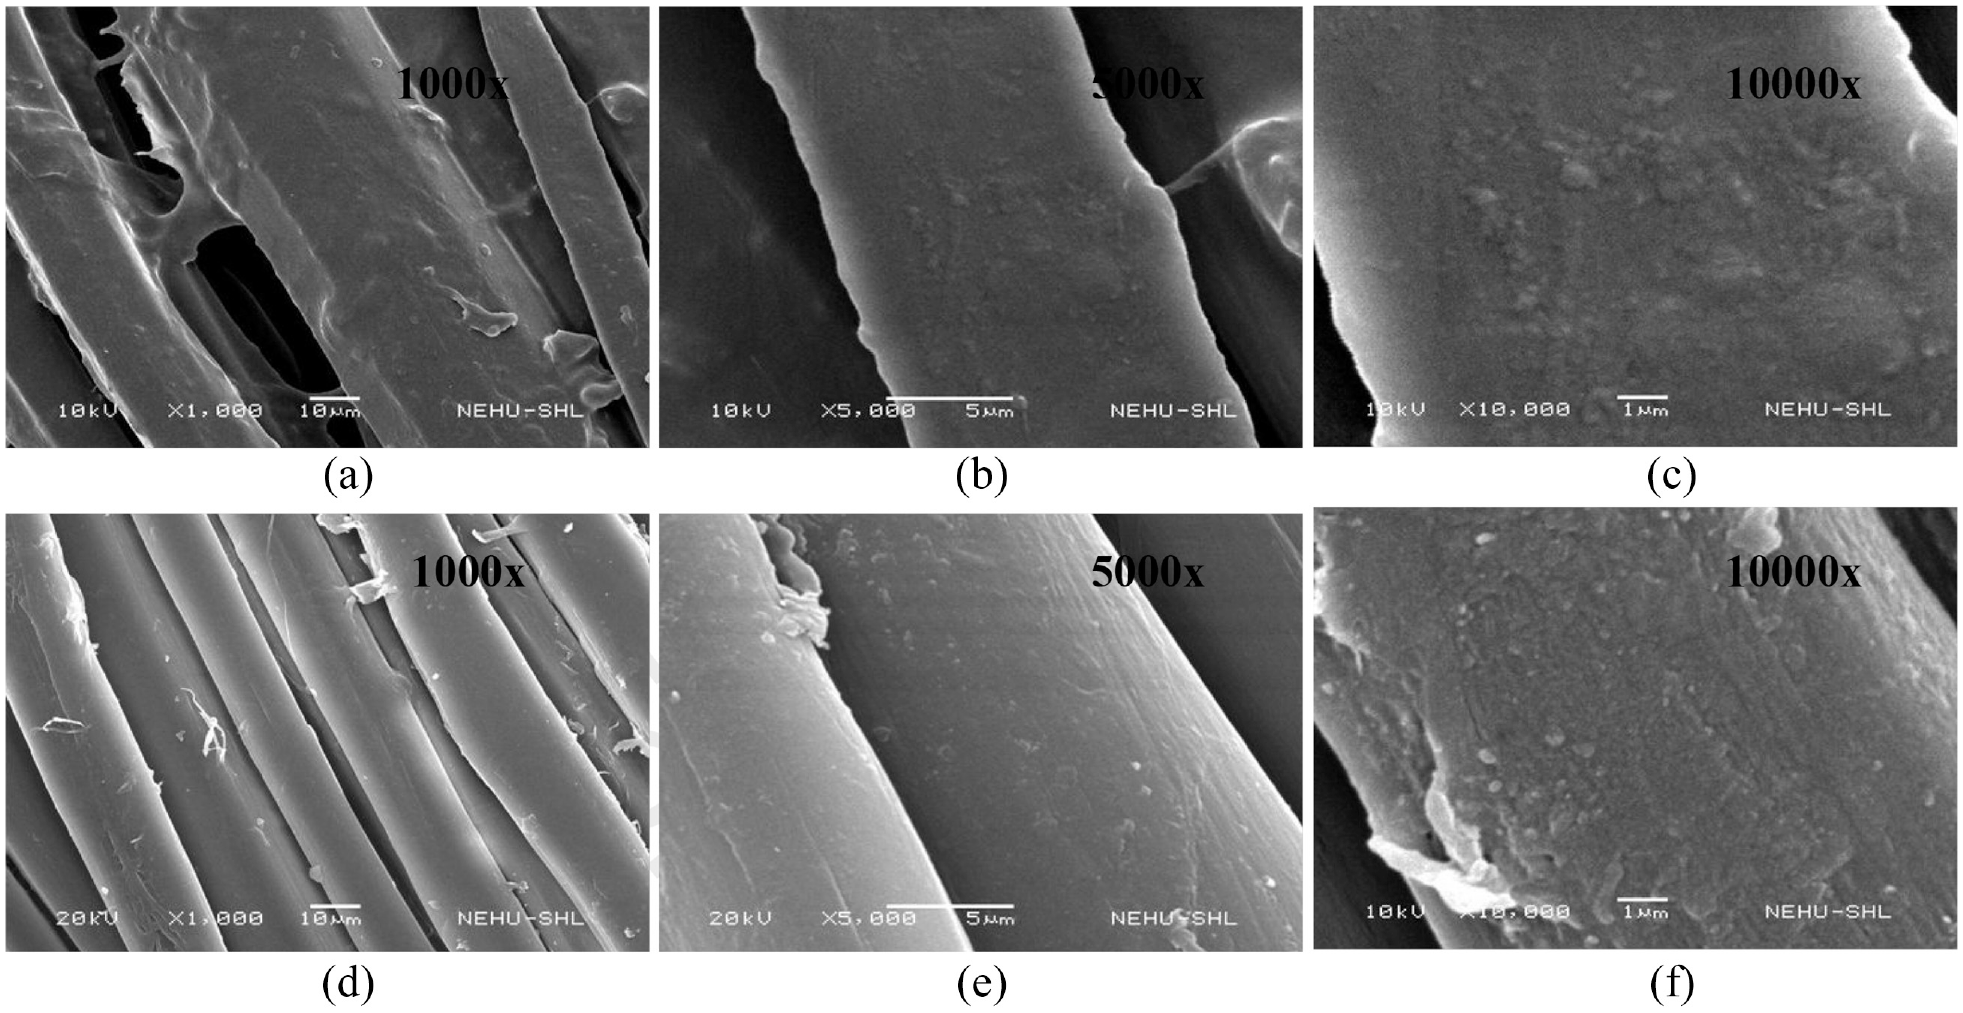
SEM images of linen control (untreated) and softening finished fabric.
SEM images show a clean surface on the unfinished linen samples (control) at both low and higher magnifications (Figure 4(a)–(c)). However, a thin film deposition was observed on silicone finished fabric samples (Figure 4(d)–(f)), particularly at higher magnifications. It was also confirmed by FTIR study that the silicone peaks were observed for finished linen fabric samples. It can be concluded that SEM and FTIR studies undoubtedly showed the presence of silicone coatings on the linen fabric.
Softening Effect and Wickability
Figure 5 shows softening effect/stiffness in bending length (cm) along with the wickability (mm) value of 27 LWL samples developed and compared with the UN sample and MS. Among them, the maximum reduction in bending length (cm) was noticed in 10 g/L at 60°C at 5 min. For the same optimum process parameters, the maximum reduction in wickability (mm) was also observed at this level. It was observed that the bending length of optimized samples was 4.2 and 4.5 cm for warp and weft, respectively, when compared with 4.7 and 5.2 cm in the warp and weft of UN sample. However, the bending length was negligibly varied (4.1 and 4.6 cm in warp and weft) when compared to the MS. The bending length and wickability data were of insignificant difference when compared to MS and were of significant difference when compared to the UN sample. Even though the maximum reduction in bending length (cm) was noticed in the rest of the process parameters at 15 g/L, at 65°C, at 6 min duration and at 15 g/L for all the samples, the wickability (mm) was reduced more as compared to the optimized processed finished sample.
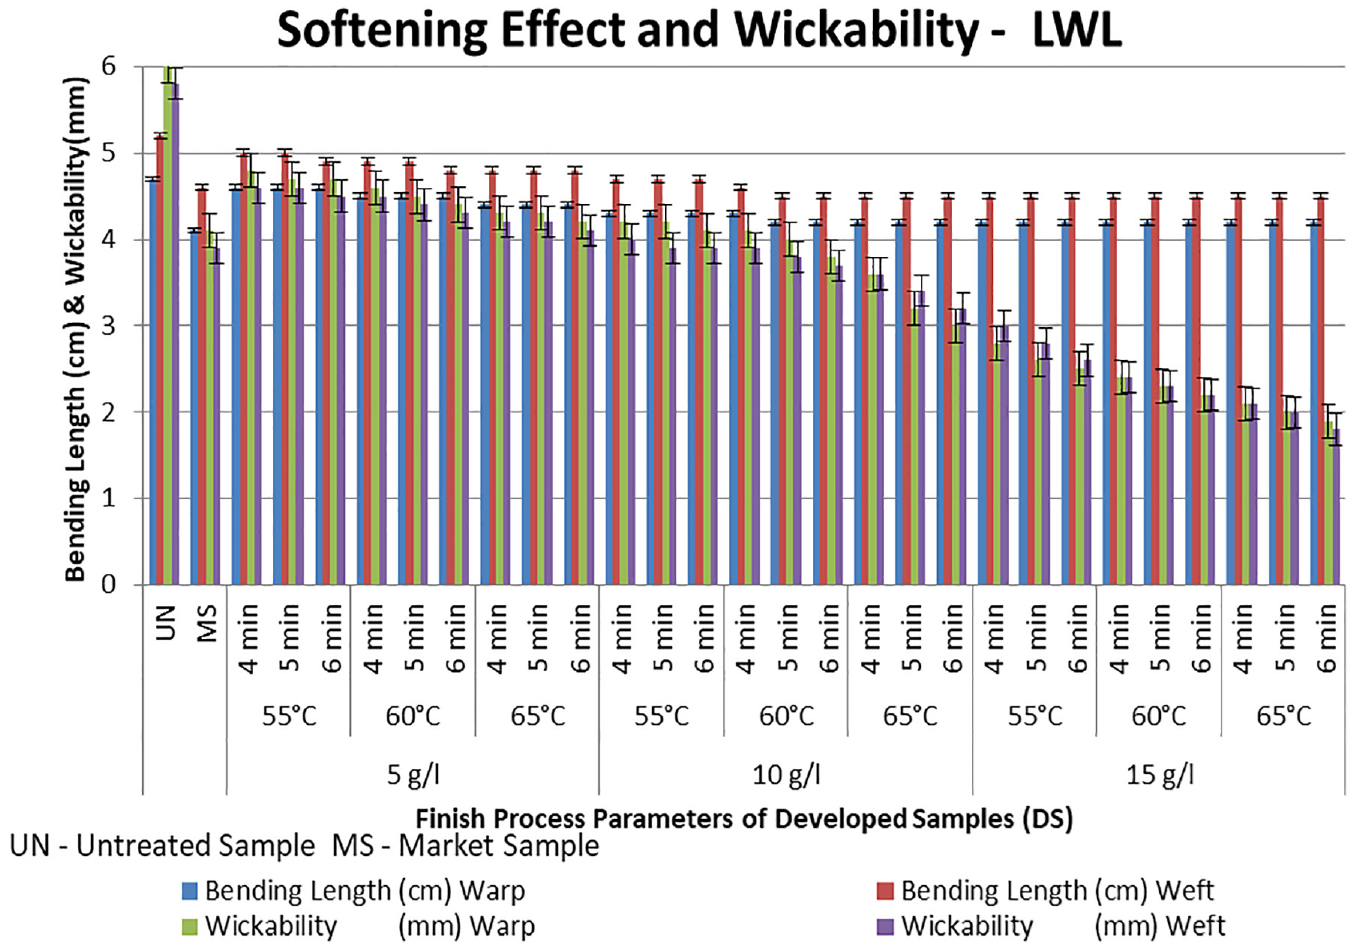
Softening effect in bending length (cm) and wickability (mm).
It was observed that the wickability (mm) of the treated fabric decreased with the increase in finish parameters. Greater amounts of softeners absorbed into the fibres decreased the wickability due to a reduction in capillary spaces of the fabric. It was noticed that at the optimized process parameter, the wickability was 4.0 and 3.8 mm at warp and weft, respectively, as compared to the UN sample (6.0 and 5.8 mm in warp and weft). The decrease in wickability is due to the reduction in capillary spaces by the absorbed softeners. The wickability of the MS was observed to vary negligibly (4.1 and 3.9 mm in warp and weft) as compared to the optimized DS.
Influence of Softening Finish on Drapeability
Drapeability was expressed in terms of drape coefficient percentage (%). The drape coefficient percentage of all the 27 samples of LWL is shown in Figure 6.
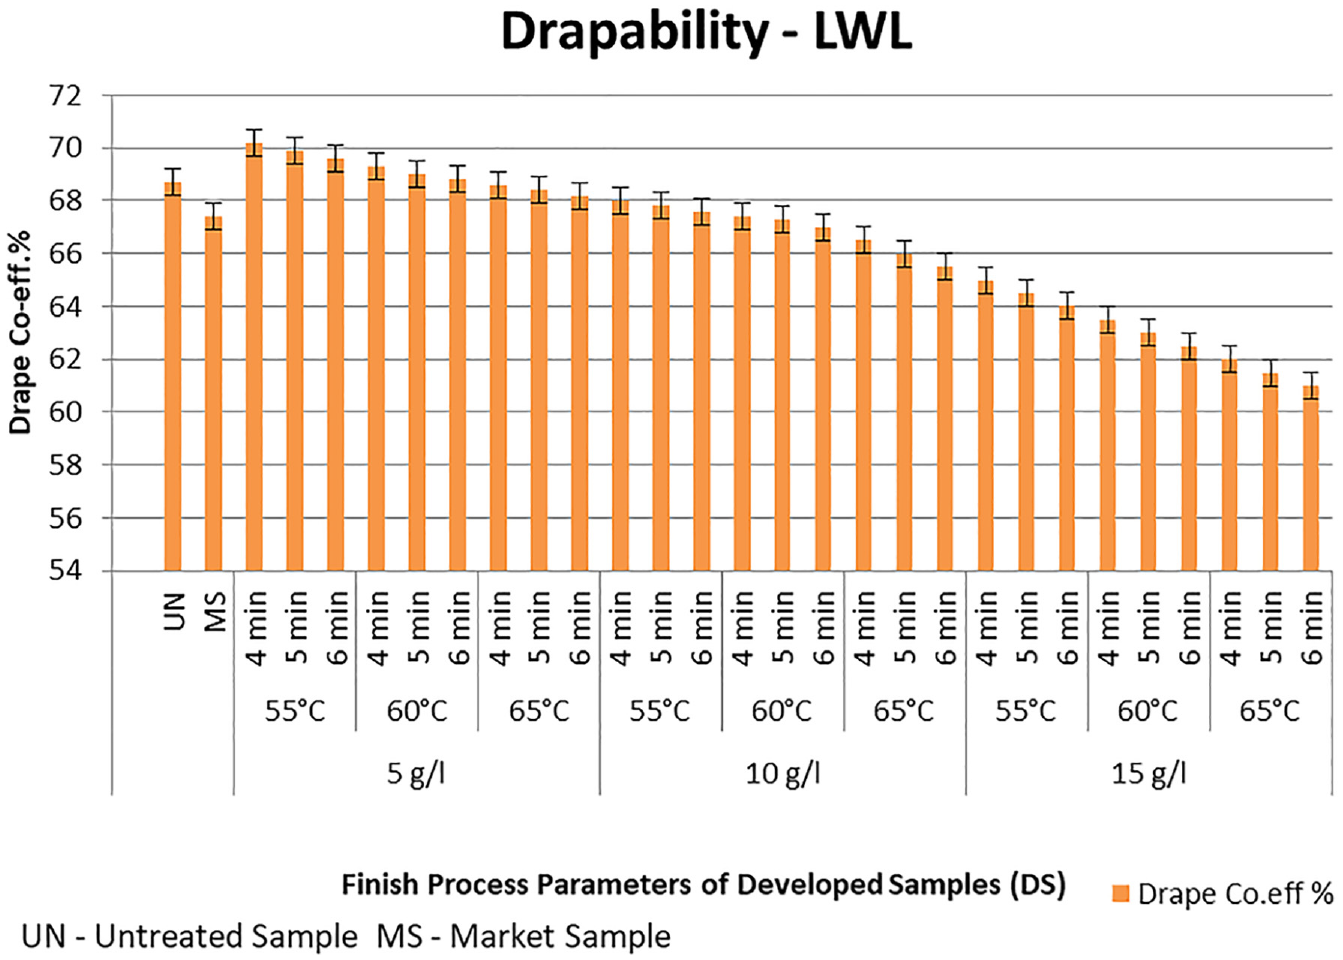
Drapeability.
It was found that the drapeability increased with the increase in process parameters for LWL due to the increase in softness which lowered the drape coefficient. It was noticed that at optimized process parameter, the drape coefficient was 67.3% as compared to the drape coefficient of UN sample which was found to be 68.7%. However, the drape coefficient was negligibly varied (67.4%) as compared to MS. The decrease in drape coefficient percentage is due to the presence of softener which acts as a lubricant and fills the spaces between fibre and yarn. Finally, it reduces the friction between yarn and fibre and improves drapeability significantly. The drape coefficient data showed statistically insignificant differences as compared to MS and showed significant differences as compared to UN sample.
Influence of Softening Finish on TCRA
TCRA was analysed for all the DSs, and the test results are shown in Figure 7.
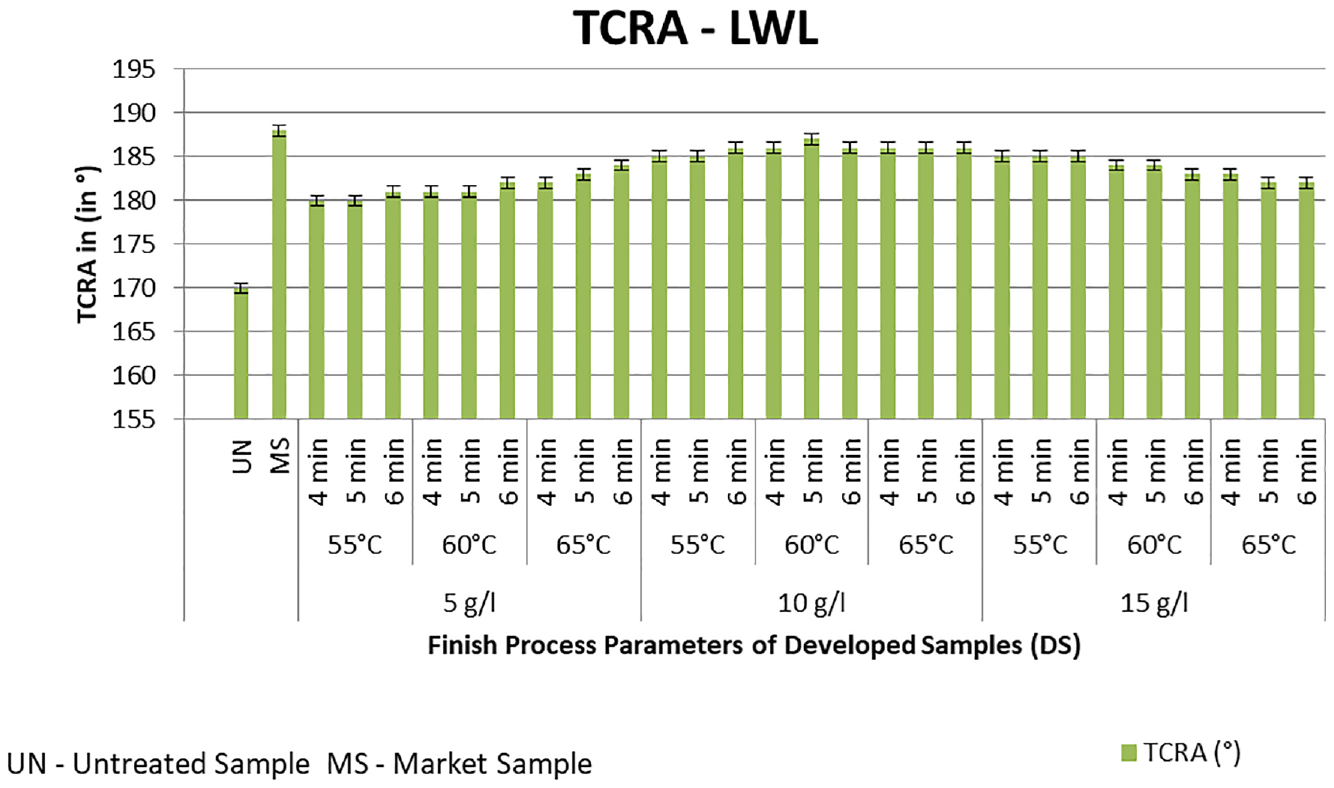
Total crease recovery angle.
TCRA results revealed that TCRA increased with the increase in finish parameters. But, after reaching the optimum point, the TCRA value was slightly reduced due to the increase in softening liquor in the fabric. It was found that TCRA was 187° at optimized process parameter, as compared to the UN sample which showed 170°. The TCRA value of the MS was observed to be closer (188°) to that of the optimized sample. The reduction in TCRA value after optimum point was due to redundant finish parameters which made the fabric lumpy and thus did not lead to proper crease recovery. With further increase in process parameters, the fabric would be very lumpy because of the high softener content that promotes inter fibre slippage, and the coating is formed on the surface of the fibre. Statistical analysis showed that the TCRA data were statistically insignificant with the MS while there was a significant difference with the UN sample.
Influence of Softening Finish on Tensile and Tear Strength Rt%
Tensile and tear strength percentage retention Rt% was evaluated for all the samples, and their test results are shown in Figure 8.
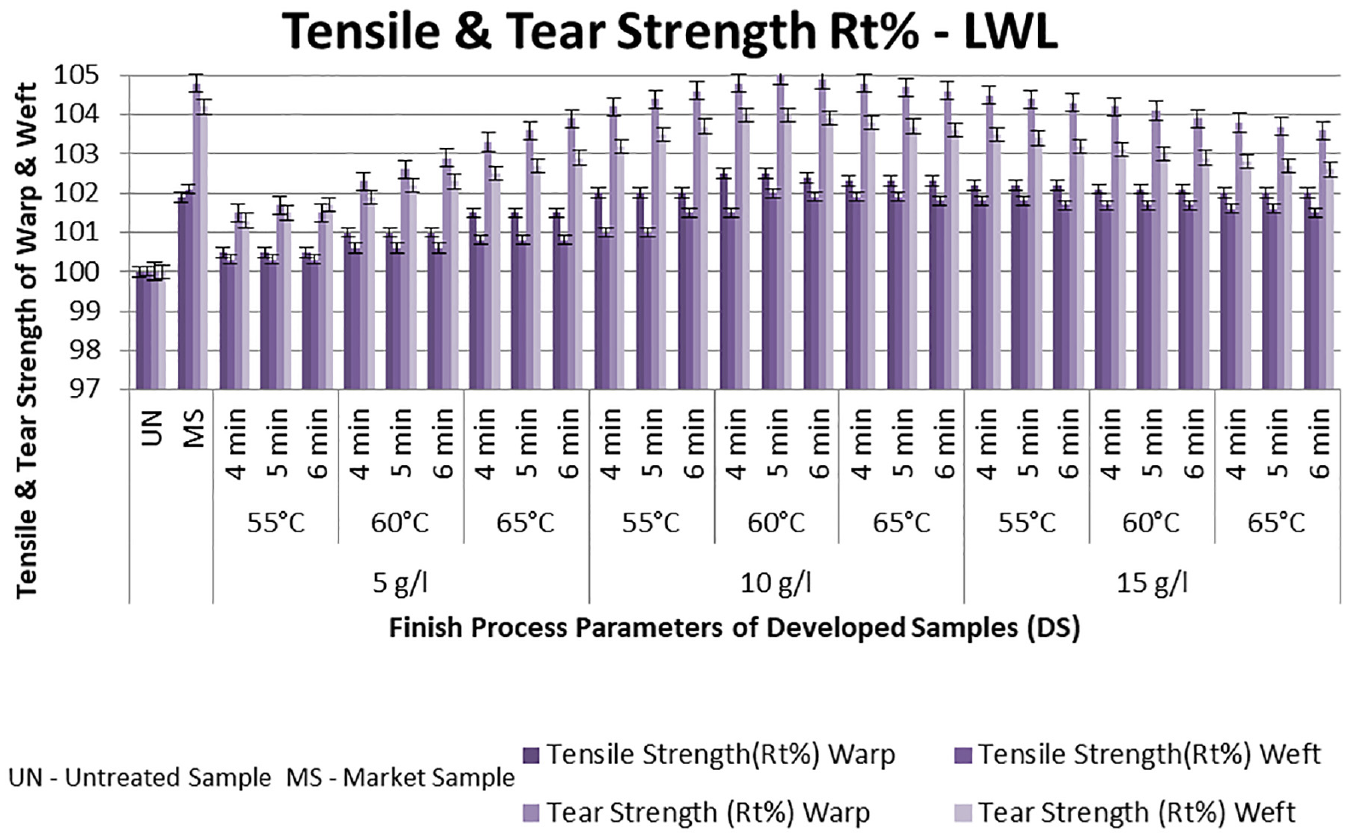
Tensile and tear strength retention.
The tensile and tear strength percentage retention Rt% of softened linen fabric was increased with the increase in finish parameters of the concentration of the finish liquor, process temperature and curing time untill the optimum point of parameter where the fabric shrank and threads became closer. Above the optimum point, there was slight reduction in percentage retention Rt%. It was observed that the percentage tensile strength retention Rt% showed 102.5% and 102% for warp and weft, respectively. It was negligibly varied (101.9% and 102.1% for warp and weft) with MS.
Similarly, the tear strength retention Rt% of the softened linen fabric was 105.0% and 104.0% for warp and weft, respectively, when compared to the UN sample while it was negligibly varied (104.8% and 104.2% for warp and weft) when compared to the MS. This increase in tensile and tear strength retention Rt% could be attributed to the closeness of the threads and slippage of fibres and yarn in the presence of softener in the linen fabric. The tensile and tear strength percentage retention data were statistically analysed using the ‘t’ test, and it was of insignificant difference compared with MS whereas there was a significant difference with the UN sample.
Influence of Softening Finish on Air Permeability (AP%) and WVP (WVP%)
The developed fabric was evaluated for its AP% and WVP% as shown in Figure 9.
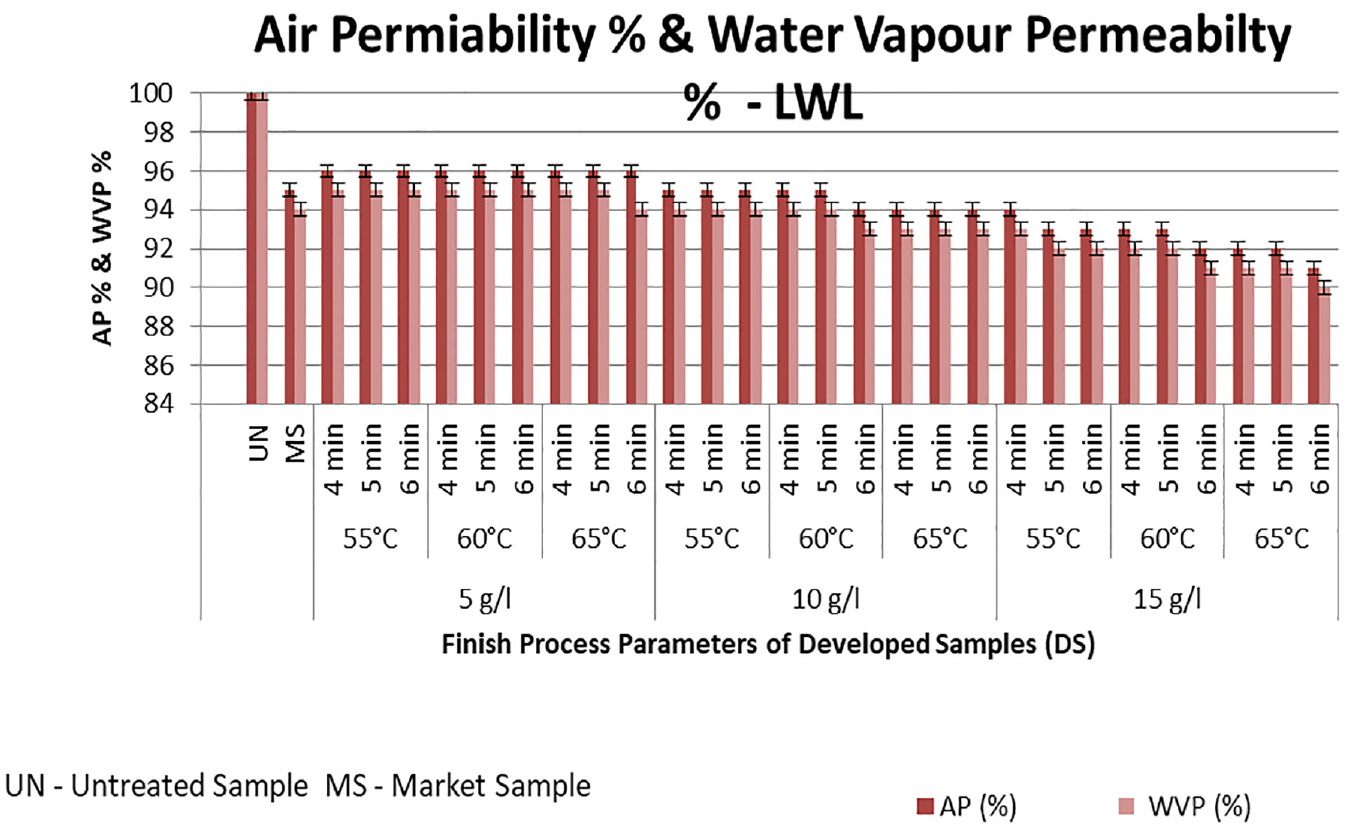
Air permeability and water vapour permeability.
A decreasing trend of AP% and WVP% was observed with the increase in process parameters for softened linen samples. The AP% and WVP% were found to be 95% and 94%, respectively, as compared to UN sample at optimized parameters. Interestingly, our results of AP% and WVP% were of similar to MS at optimized conditions. The coating of softener on the surface of the fabric reduced AP% and WVP% by decreasing the pore sizes for the passage of air and water vapour, respectively. These results showed an insignificant difference compared with the MS and a significant difference compared with the UN sample.
Conclusion
An attempt was made to fabricate polysiloxane-based softening finished handloom shirting fabrics using ‘On-Loom Integrated Finishing Device’. In this regard, three important process parameters (concentration of finish liquor, curing temperature and curing time) were considered for optimization. All the fabricated samples were studied for physical characteristics in detail for their wickability, drapeability, TCRA, tensile strength percentage retention Rt%, tear strength percentage retention Rt%, air permeability and water vapour permeability. The experimental results exhibited that the optimum parameters of concentration of finish liquor, curing temperature and curing time for linen fabrics were 10 g/L, 60°C and 5 min, respectively, using this novel device.
Footnotes
Declaration of conflicting interests
The author(s) declared no potential conflicts of interest with respect to the research, authorship and/or publication of this article.
Funding
The author(s) received no financial support for the research, authorship and/or publication of this article.