
Abstract
Emissions of air pollutants cause adverse impacts on human health and the environment. As typical air pollutants, nitrogen oxide and sulfur dioxide cause acid rain and particulate matter (PM). Significant emissions of nitrogen oxide and sulfur dioxide in the production phases make the textile industry face tremendous challenges. Determining the chemical footprint is an effective method for transforming the potential environmental risks of pollutant emissions into an intuitive form of toxicity. In this study, we adopted the chemical footprint method to assess the toxicity impact of nitrogen oxide and sulfur dioxide emissions from China’s textile industry. The results indicate that the chemical footprint of nitrogen oxide and sulfur dioxide in China’s textile industry showed a significant decreasing trend from 2001 to 2019, and the chemical footprint of nitrogen oxide was about 11 times higher than that of sulfur dioxide. Among the three sub-sectors of China’s textile industry, the textile manufacturing sector had the highest chemical footprint, accounting for 57.1–65.7% of the total chemical footprint. The remaining chemical footprint is allocated to the chemical fibers manufacturing sector, and the textile wearing apparel, footwear, and cap manufacturing sector. The chemical footprint intensity of China’s textile industry also showed a decreasing trend from 2006 to 2015, and the chemical footprint intensity of the three sub-sectors was in the order of the chemical fibers manufacturing sector, the textile manufacturing sector, and the textile wearing apparel, footwear, and cap manufacturing sector.
Introduction
Emissions of pollutants into the air will not only result in undesirable changes to the ecological environment, but will also be responsible for “shortening life on average by 20 months around the globe.” 1 According to the data of the United States Environmental Protection Agency, nitrogen oxide (NOX) and sulfur dioxide (SO2) are of concern because they are precursors to ozone formation and secondary pollutant in PM causing adverse impacts on the ecological environment. 2 NOX is a mixture of nitrogenous gases, mainly composed of NO2 and NO. In the initial stage of emission, NOX is primarily emitted as NO from anthropogenic combustion sources, including transportation, power plants, industrial production lines, and residential combustion.3,4 During diffusion, NOX undergoes a photochemical transformation with other air pollutants in the atmospheric background to form important secondary pollutants, PM, and ozone. Then, the concentration of NO2 in NOX gradually increases and becomes the main component. NO2 exposure has been shown to exacerbate natural allergic reactions by producing reversible adverse effects on human lung function and the respiratory tract. 5 Studies have shown that NO2 exposure also exacerbates the effects of other pollutants (e.g. ozone, PM10) exposure. 6 NOX could interact with water to form nitrates and nitrites. Nitrites can enter the human body to form amines nitrite, a potent carcinogen, and it can also bind to hemoglobin in human blood to form ortho-hemoglobin, which can cause loss of oxygen-carrying function of hemoglobin and lead to hypoxia. 7 The increasing SO2 emission will lead to an increase in the mortality risk of 1.01% through the respiratory system. 8 Acid rain caused by sulfate acid deposition can be detrimental to ecosystems, plants and animals, both aquatic and terrestrial.9,10
Industrial sectors are regarded as one of the largest sources of air pollutants, and the environmental problems caused by air pollutants discharged from industrial production have attracted increasing attention in recent years. 11 The Textile industry is one of the world’s largest industries. Every year, the global textile industry delivers close to 100 million metric tons of new products to the market. 12 The large number of products also hints at the seriousness of the environmental burden in the textile industry. It is often condemned for its negative impact on the environment due to the extensive use of toxic chemicals and the significant emissions of toxic air pollutants (e.g. NOX, SO2). The environmental pollution caused by the textile industry occurs from the acquisition of raw materials to the finishing of end-use products (e.g. apparel, scarfs, home textiles) and the recycling of waste textiles. 13 Each processing step is directly or indirectly involved in environmental pollution by contaminating water, air, and land. The production process of textiles consumes a large amount of energies (e.g. coal, fuel oil, thermal power), generating quantities of NOX and SO2 emissions. 14 In addition, specific dyes and auxiliaries in the fabric printing and dyeing process also emit NOX and SO2 under heating conditions.13–15 When these exhaust fumes are released to the environment, they can seriously affect the biodiversity of nature.16,17 Hence, quantifying and assessing the toxicity impacts caused by NOX and SO2 emissions in the textile industry can provide an important reference for the control of NOX and SO2, which has become a pressing concern.
After the literature review, it was found that previous studies on the environmental impact assessment of NOX and SO2 mainly use emissions and air quality as assessment indicators, without adequately considering the toxic effects of NOX and SO2 and their transport and transformation in the environment.18–22 The chemical footprint (ChF) is a practical quantitative and toxicity analysis method for specifying chemical consumption and emissions of chemical pollutants (including gaseous, liquid, and solid pollutants), as well as for toxicity assessment of potential risks to human life and the environment. 23 Roos et al. 24 first introduced ChF methodology into the textile industry. Subsequent studies on water pollutants and impacts on aquatic ecosystems in the textile industry have been gradually conducted.25–27 Qian et al. 28 first applied ChF to the environmental impact assessment of gaseous pollutants in the textile industry to quantify and assess the ChF of volatile organic compounds (VOCs) in polyester fabric production. Guo et al. 29 proposed a new method to solve the missing characteristic factors (CFs), and constructed a ChF model that can effectively assess the environmental impact of NOX and SO2 emissions in the textile industry.
Industrial activities can create economic value for society, but also have significant environmental impacts (e.g. toxicity, eutrophication, greenhouse effect). 13 Among them, the ChF of unit total industrial output value (ChFI, ChF intensity) can be used to comprehensively measure and reference both the economic benefits and the environmental impacts brought by industrial activities. China is the largest producer of textile products in the world. The development of the textile industry has made a lot of contributions to China’s economic development, but has also caused serious environmental impact. Its emissions of NOX and SO2 from the textile industry reached 80,276 tons in 2019. 14 Nevertheless, no research has yet been done to quantify and assess the ChF of NOX and SO2 in China’s textile industry. To fill the gap, this article utilized the ChF methodology to assess the toxicity impact of NOX and SO2 emitted from China’s textile industry during 2001–2019 and analyzed ChFI of China’s textile industry in conjunction with the economic output of China’s textile industry.
Methods and Data
Methods
The USEtox model has been widely used as a characterization model, which aims to estimate CFs for human and ecology toxicity, based on a unit emission of a pollutant to a specific environmental compartment. USEtox is designed to provide the relative recommendations rather than to predict local impacts. 30 Nevertheless, it has been used regularly to estimate absolute toxicity impacts.31,32 Six major urban and continental environmental compartments are nested within the USEtox, a box model that includes urban air, rural air, agricultural soil, industrial soil, fresh water, and coastal marine water. The pollutant transport (i.e. transport to other compartments, such as by volatilization or precipitation) and transformation (i.e. transformed by a physical, chemical, or biological degradation process within a specified compartment, such as hydrolysis or oxidation) among the boxes are represented as first-order losses process in the following general format: 30
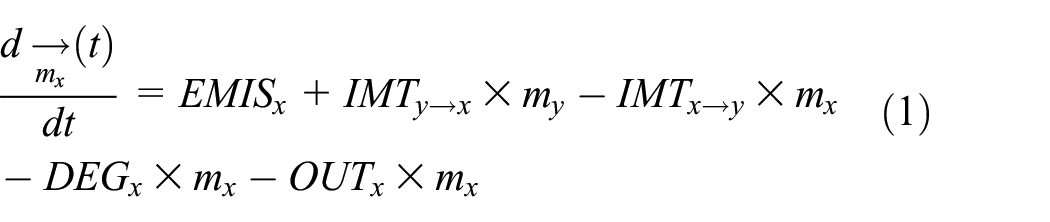
where mx is the mass of the chemical in box x (kg), t is the time (days), EMISx is the emission rate of the chemical from box y to box x (kg/d), representing the amount of chemical discharged from box y to box x every day, IMTy→x is the intermediate transfer rate of the chemical from box y into box x (days−1), representing the speed of chemicals transferring from box y to box x, DEGx is the degradation rate of chemical in box x (days−1), and OUTx is the transfer rate of chemical from box x to outside the system (days−1).
To quantify the characterization factors (CFs, PAF m3 day/kgemitted) of a chemical pollutant emitted into the environment implies a cause–effect chain that links emissions to impacts through three successive steps: environmental fate factor (FF, day), which indicates how a pollutant diffuses in the environment; exposure factor (XF), which determines how much environmental media comes into contact with human or ecological systems; and effect factor (EF, PAF m3/kgemitted), which calculates the effect on humans or ecosystems per kilogram of pollutant emitted. 33 The resulting CF that is required for the quantification of toxicity for either human health or ecological impacts is generally defined as the product of these three factors:

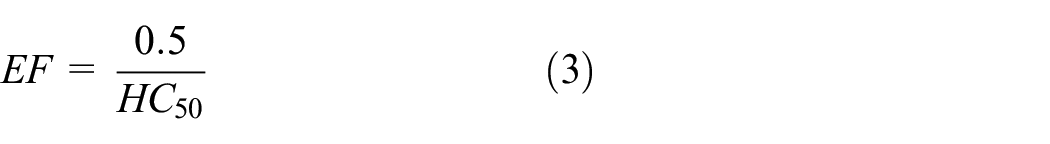
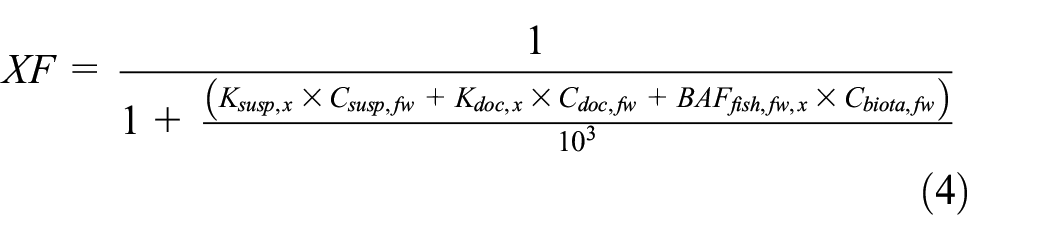
where HC50 is the geometric mean of chronic EC50 for freshwater species (kg m−3), Ksusp,x is the suspended solids/water partitioning coefficient of chemical x (L/kg), Csusp,fw is the concentration suspended matter in freshwater, 15 kg/m3 is selected as the reference according to the research of ECHA European Chemicals Agency, 34 Kdoc, x is the dissolved (colloidal) organic carbon/water partition coefficient of chemical x (L/kg), Cdoc,fw is the concentration of dissolved (colloidal) organic carbon in freshwater, 5 kg/m3 is selected as the reference according to the research of Gandhi et al., 35 BAFfish,fw,x is the bioaccumulation factor for freshwater fish of chemical x (L/kg), and Cbiota,fw is the concentration of biota in freshwater, with 1 kg/m3 is selected as the reference according to the research of Brandes et al. 36
Input data of substances, compartments, and exposure scenarios are essential for the assessment of chemical pollutants’ human and/or ecosystem toxicity impacts with USEtox methodology. Compartment data of chemical pollutants at different spatial scales and exposure scenarios are predefined in USEtox. Specific input data of substances, such as chemical identities and toxicity involved, are required from the user. 30 Since these parameters of chemical properties and toxicity are closely related to the calculation of EF, XF, and FF. 37 These parameters are molecular weight (MW), the octanol–water partition coefficient (Kow), the organic carbon–water partition coefficient (Koc), Henry’s law coefficient at 25°C (KH), vapor pressure at 25°C (Pvap), solubility at 25°C (Sol), degradation rate in air (KdegA), degradation rate in water (KdegW), bioaccumulation factor of the chemical (BAF), and water ecotoxicity (as HC50). In this study, whenever possible, the experimental values of physicochemical properties (MW, Kow, Koc, KH, Pvap, and Sol) and BAF have been taken. Estimated values were used when obtaining the experimental values of physicochemical properties, and determination of BAF was not possible according to the recommendation proposed by Fantke et al. 30 A literature survey of toxicity tests performed on freshwater organisms representative of multiple trophic levels was conducted, including algae, crustaceans, and fish in order to collect relevant EC50 values. Then, the toxic effect of NOX and SO2 was computed on the basis of the HC50 value.
The ChF of NOX and SO2 emitted into the air can be calculated as follows:
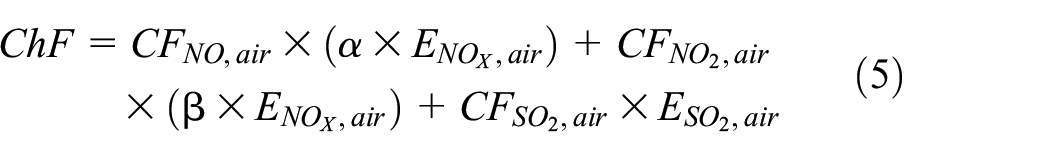
where ChF is the chemical footprint (PAF m3 day), CFNO, air is the characteristic factor of the emission of NO into air compartment, and its value is 0.1868 PAF m3 day/kg according to the calculation,
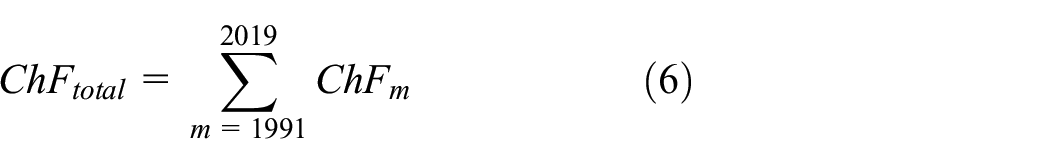
In this article, we propose the ChF intensity (i.e. the ChF per unit total industrial output value) to give a full understanding of the relationship between ChF and the economic output in the China’s textile industry. It can be calculated as:

where ChFI (in (PAF m3 day)/10,000 US dollars) is the ChF intensity. TIOV (in billion US dollars/year) is the industrial output value of the textile industry.
Data
In this article, tabulated data of NOX and SO2 generation and emissions were collected from the China Statistical Yearbook on Environment series (2001–2019). 39 The TIOV of China’s textile industry was collected from the Annual Statistic Report on Environment in China. 40 It was converted according to the annual average exchange rates between RMB yuan and US dollar. The data are listed in Tables 1–3.
NOX and SO2 generation and emissions data in the textile manufacturing sector (2001–2019).
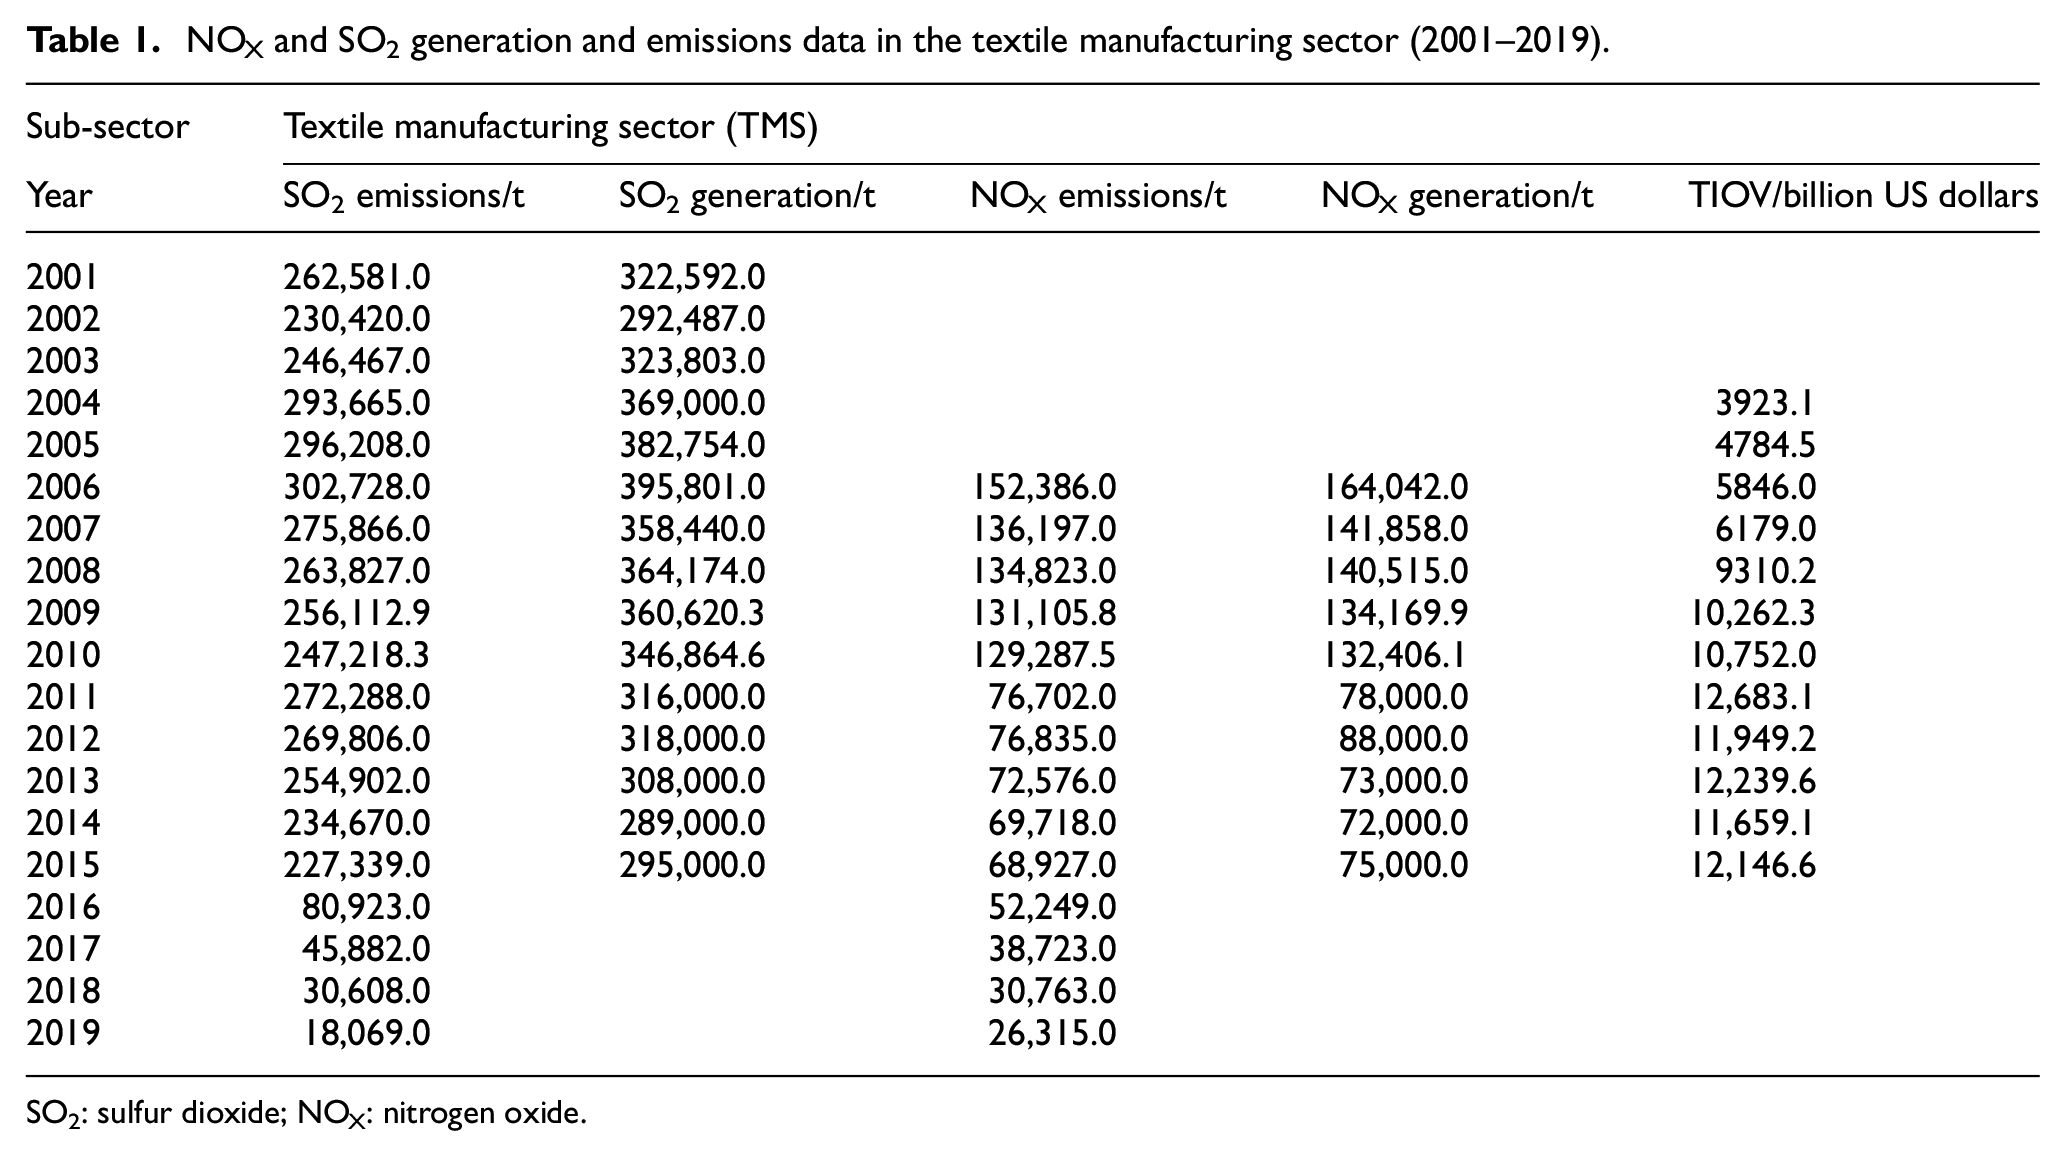
SO2: sulfur dioxide; NOX: nitrogen oxide.
NOX and SO2 generation and emissions data in the textile wearing apparel, footwear, and cap manufacturing sector (2001–2019).
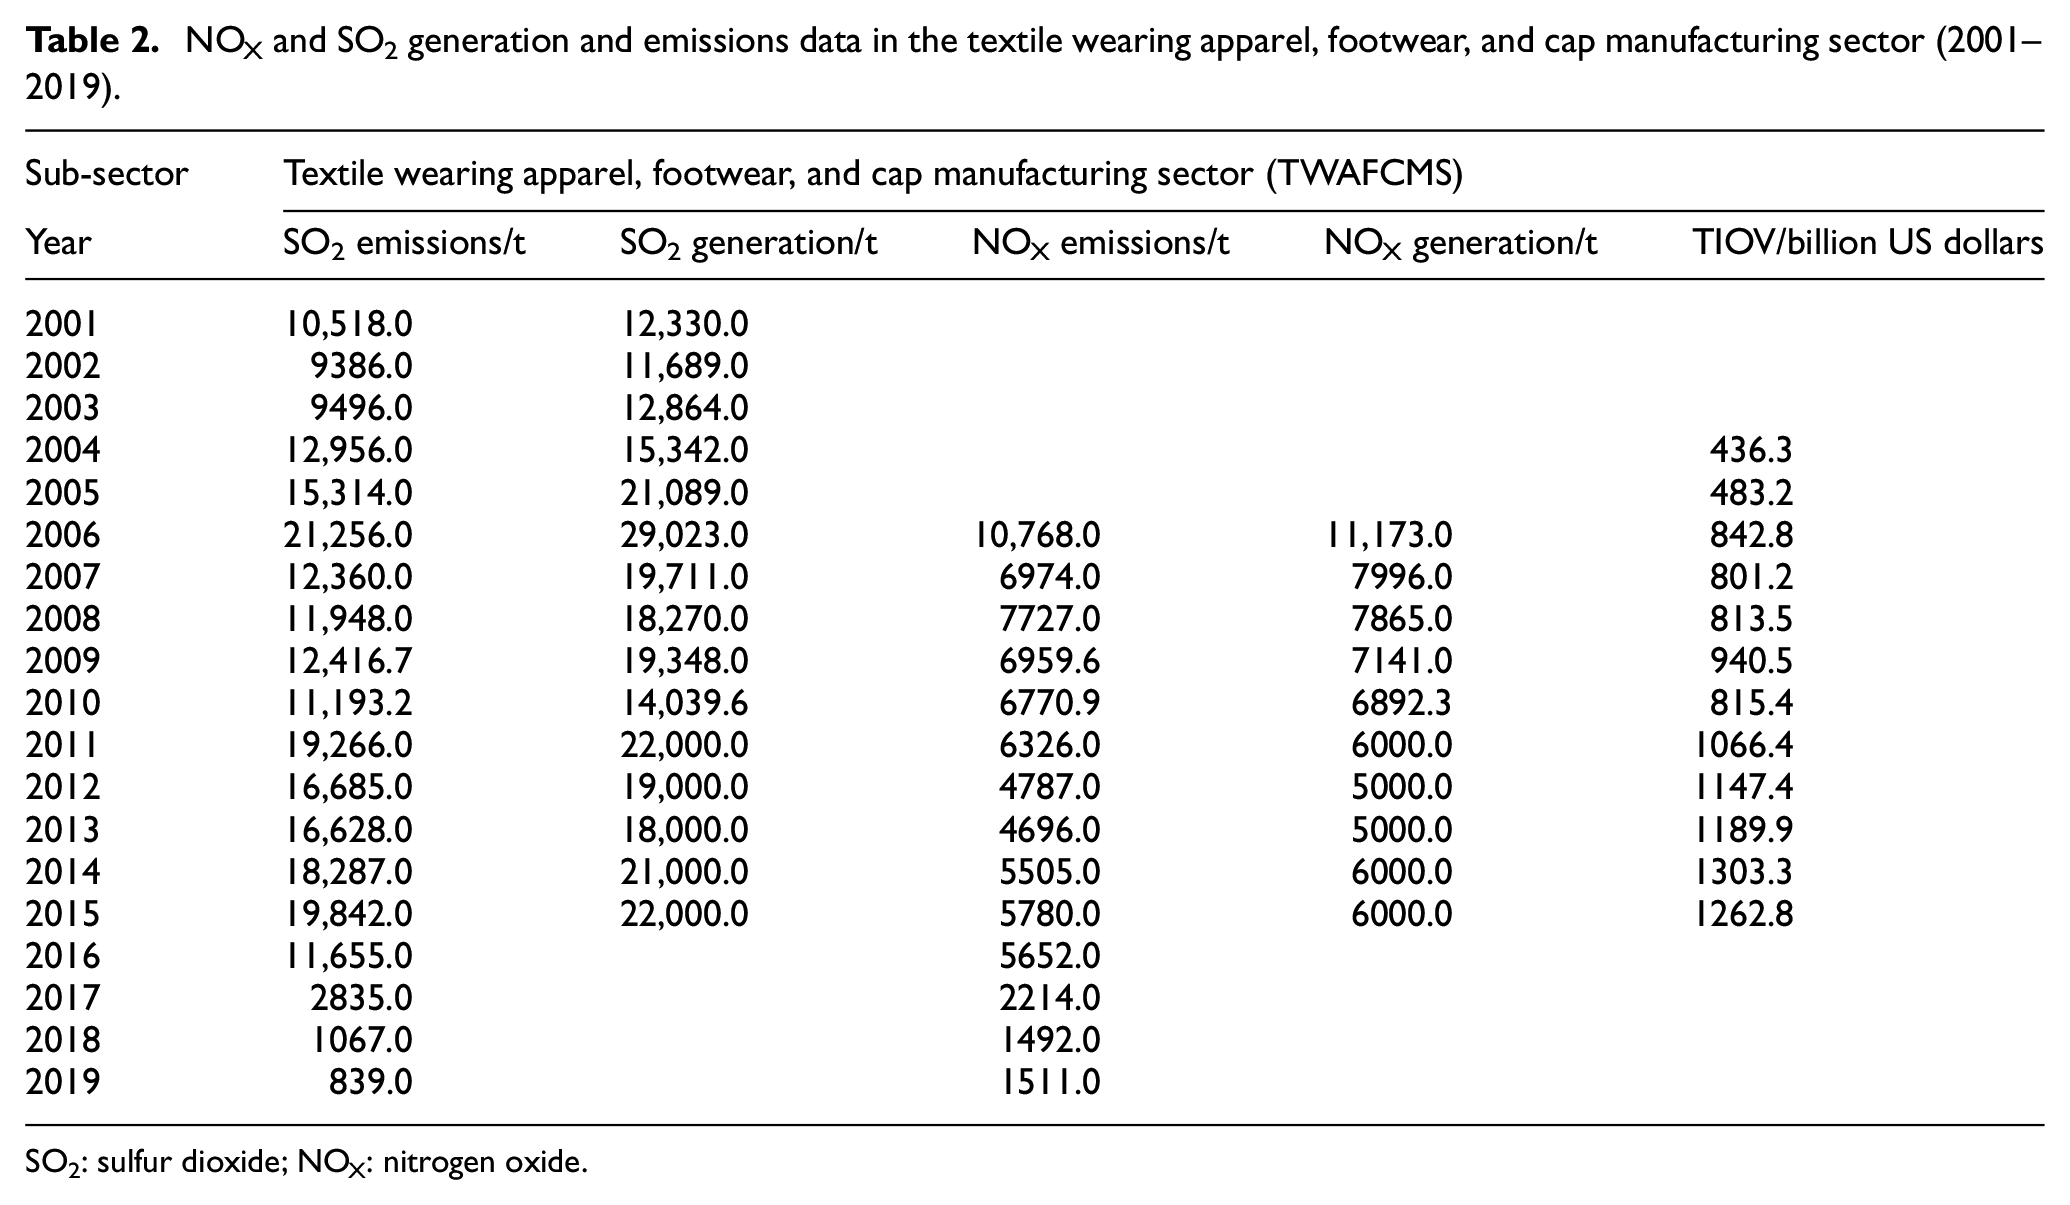
SO2: sulfur dioxide; NOX: nitrogen oxide.
NOX and SO2 generation and emissions data in the chemical fiber manufacturing sector (2001–2019).
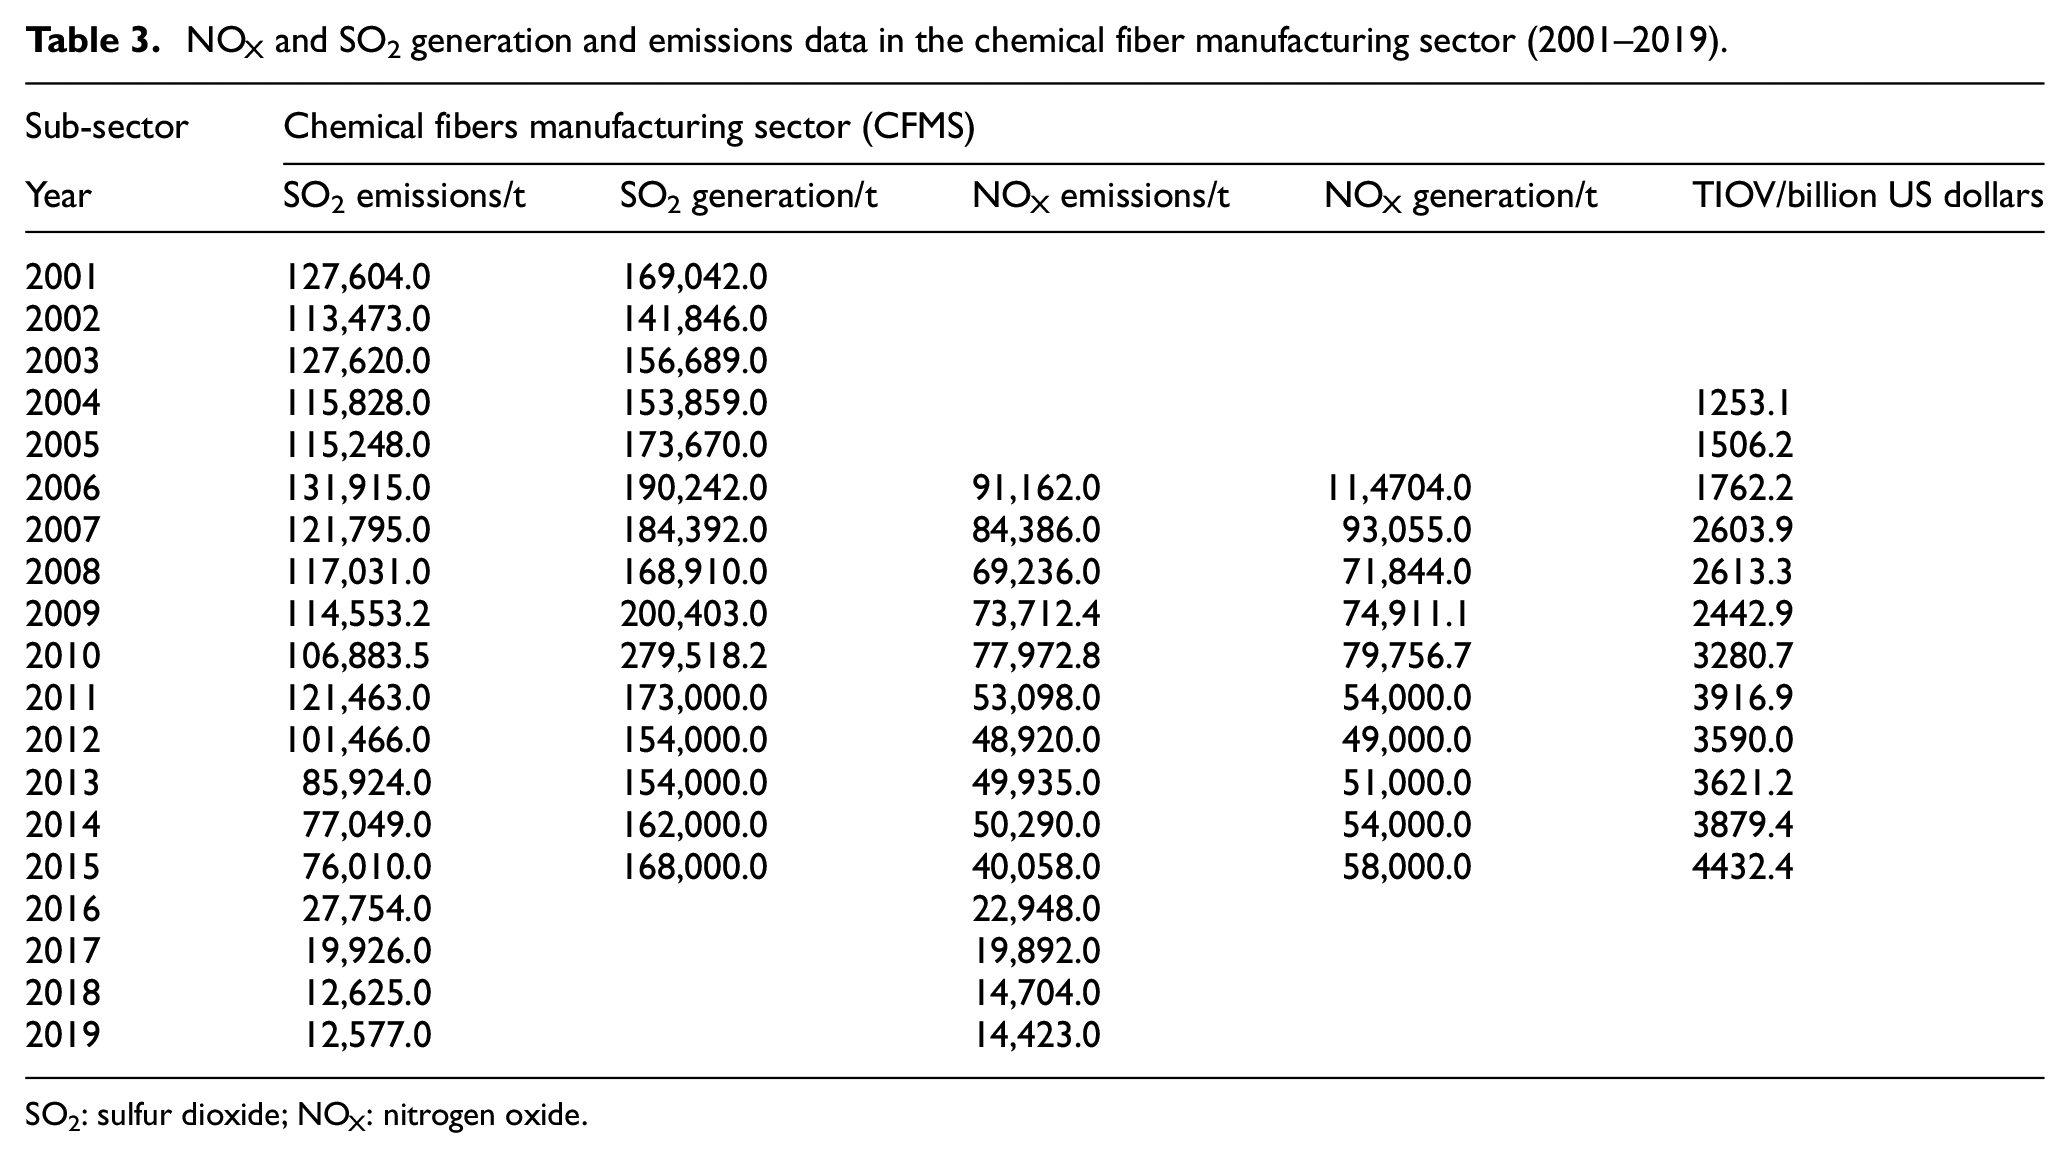
SO2: sulfur dioxide; NOX: nitrogen oxide.
Results and Discussion
The ecotoxicity CFs of NOX and SO2 were calculated first. Then, the ChF of NOX and SO2 generated (ChFgenerated, generated and discharged directly from the production line) and the ChF of NOX and SO2 emitted (ChFemitted, discharged to the atmosphere after treatment) from China’s textile industry between 2001 and 2019 were quantified, as shown in Figure 1. Data for NOX before 2006 and NOX and SO2 after 2015 were not tabulated, so the ChFgenerated and ChFemitted results for this time period were not calculated.
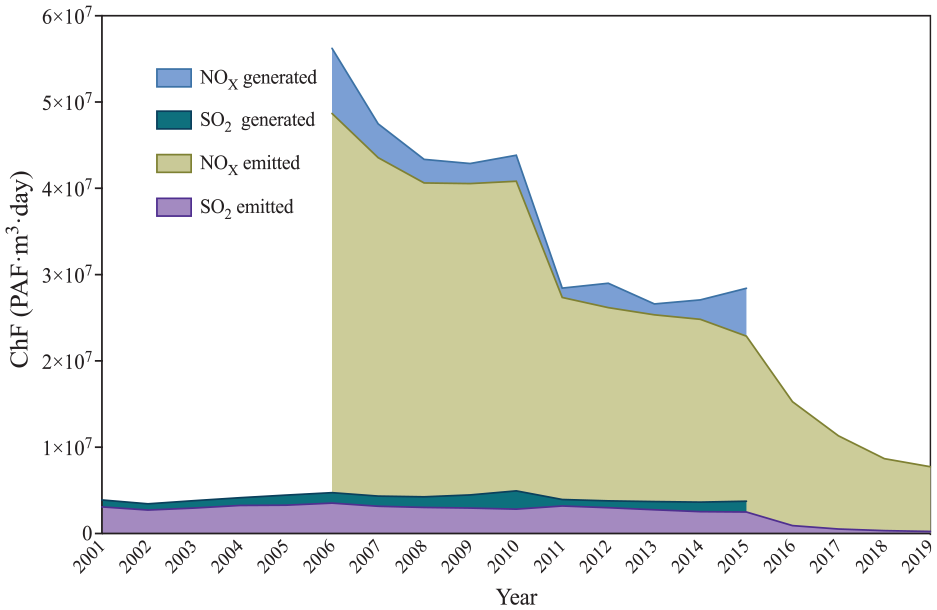
Chemical footprint of NOX and SO2 generation and emissions in China’s textile industry (2001–2019).
As shown in Figure 1, the ChFgenerated and ChFemitted of SO2 decreased slightly before 2015, and after 2015, the ChFemitted of SO2 fell dramatically. The ratio of ChFemitted to ChFgenerated showed a downward trend from year to year. The total toxicity impact due to the emission of SO2 from 2001 to 2019 was 46,849,758.4 PAF m3 day. In comparison to SO2, the ChFgenerated and ChFemitted of NOX were much larger, and the total toxicity impact of NOX emissions from 2006 to 2019 was 352,340,264.3 PAF m3 day. The ChFemitted of NOX presented an obvious downward trend. The ChFemitted of NOX from 2006 to 2010 exhibited an “L” shape, with overall decrease of 15.8%. In 2011, the ChFemitted of NOX jumped off a cliff compared with 2010, decreasing by about 37% in a single year. In contrast to the approximately 15.7% decline in ChFemitted for NOX between 2011 and 2015, the rate of decline in ChFemitted for NOX had accelerated significantly since 2015, with a 63.2% decline as of 2019. Between 2006 and 2015, the ChFemitted accounted for an average of 94% of the ChFgenerated.
The ChFemitted of NOX and SO2 emitted from the three sub-sectors of China’s textile industry (textile manufacturing sector (TMS), textile wearing apparel, footwear, and cap manufacturing sector (TWAFCMS), chemical fiber manufacturing sector (CFMS)) was evaluated from 2006 to 2019. The results are shown in Figure 2. The inner ring represents the percentage of ChFemitted in the three sub-sectors, and the outer ring represents the percentage of NOX and SO2 in each sub-sector. As the results of each year are inconsistent, interval results are shown in the figure, representing the ChFemitted proportion range of each sub-sector from 2006 to 2019. It can be seen that the ChFemitted of the TMS was the largest with a total ChFemitted of 233,909,835.5 PAF m3 day during the selected 14 years. The annual ChFemitted caused by NOX and SO2 emissions from the TMS accounted for 57.1–65.7% of the total ChFemitted of China’s textile industry. The ChFemitted of NOX in China’s textile industry was 352,340,264.3 PAF m3 day, approximately 11 times larger than that of SO2. The distribution of ChFemitted of NOX and SO2 in the three sub-sectors was similar to that of China’s textile industry.
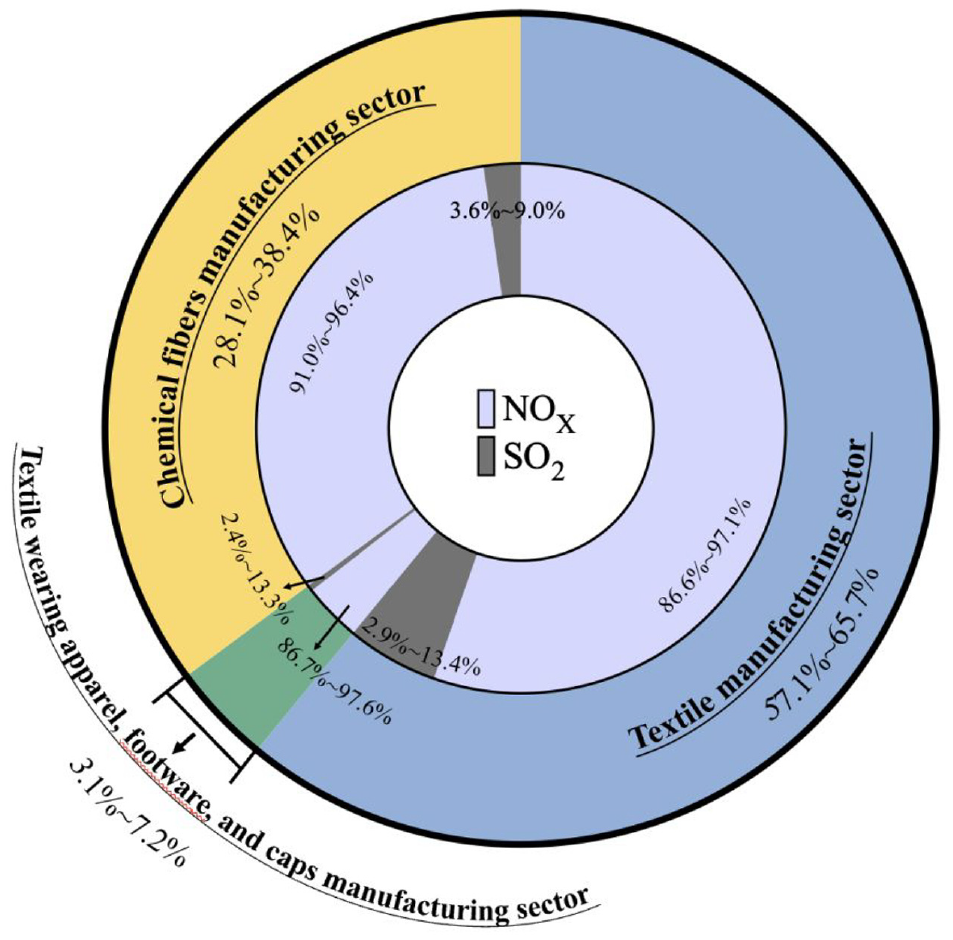
Chemical footprint of NOX and SO2 emissions in China’s textile industry (2006–2019).
The ChFI of the three sub-sectors of China’s textile industry and the average ChFI of China’s textile industry was calculated according to equation (6). The results are shown in Figure 3. In the same downward trend as ChFemitted, ChFI also declined overall during the studied years. Over the period from 2006 to 2015, the average ChFI of China’s textile industry declined by 82.6%. The ChFI of TMS, TWAFCMS, and CFMS decreased by 82.1%, 70.4%, and 86.1%, respectively. With 2011 as a watershed year, the average ChFI as well as the ChFI of the three sub-sectors fell sharply before that, and all fell slowly thereafter. Among the three sub-sectors of China’s textile industry, CFMS had the largest ChFI, followed by TMS and TWAFCMS. It is worth mentioning that only the ChFI of CFMS was greater than the average ChFI.
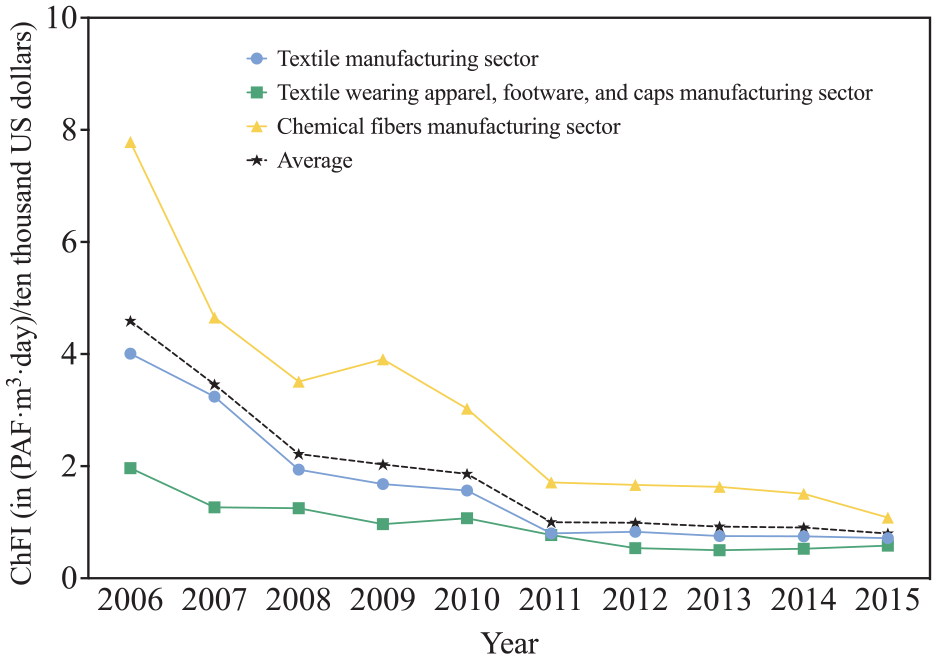
ChFI of China’s textile industry (2006–2015).
In general, the overall decreasing trend of toxicity impacts caused by NOX and SO2 emissions from China’s textile industry between 2001 and 2019 was mainly attributed to the reasonable and effective control of NOX and SO2 for the above interannual variation results. In 2001, China published the “10th Five-Year Plan for National Environment Protection,” which focused on the rectification of coal-fired power plants. However, since China became a member of World Trade Organization (WTO) in the same year, the export of textiles and garments grew rapidly year by year, resulting in an increase in the output of the China’s textile industry. 41 As a result, ChFgenerated and ChFemitted of SO2 in China’s textile industry increased by 14.6% and 6.5%, respectively, during the period from 2001 to 2005.
Since the problem of acid rain was not well solved during the 10th Five-Year Plan, the “11th Five-Year Plan for National Environment Protection” issued in 2006 continued to be used to control the emission of SO2. 42 The total SO2 emissions were required to be included in the national binding target system, to accelerate the construction of desulfurization facilities in existing coal-fired power plants, and to promote the comprehensive treatment of SO2 in various industries. 43 During the 11th Five-Year Plan period, the emissions of NOX and SO2 in China’s textile industry decreased by 15.8% and 19.9%, respectively. This indicates that the reduction and control of pollutants in China’s textile industry had achieved remarkable results. After entering the “12th Five-Year Plan” period, China had incorporated the dual indicators of SO2 and NOX emissions into the national binding indicator system. 44 In 2013, the most stringent “Air Pollution Prevention and Control Action Plan” in China focused on the textile industry, requiring the textile industry to step up comprehensive treatment, reduce pollutant emissions, adjust and optimize industrial structure, and promote industrial transformation and upgrading. 45 Previously, China’s textile industry developed rapidly, and its position in the global value chain steadily improved, which caused the TIOV to increase year by year. 46 The decrease of ChFemitted and the increase of TIOV make the ChFI of China’s textile industry decrease year by year. After 2015, with the promulgation of “13th Five-Year Plan for National Environment Protection” and the “Three-Year Action Plan to Fight Air Pollution,” more stringent requirements were set for NOX and SO2 emissions, which resulted in a significant reduction in NOX and SO2 emissions from China’s textile industry in the following 4 years. From the 11th Five-Year Plan to the 13th Five-Year Plan, China had continued to control the total emissions of pollutants, and had achieved remarkable success in controlling NOX and SO2 emissions.
The different toxicity impacts caused by the three sub-sectors in China’s textile industry were mainly due to the different products produced in the three sub-sectors. TMS involves a wide range of textiles and complex production processes, and the printing, dyeing, and finishing of textile products are mainly concentrated in this sector. Therefore, the ChFemitted of TMS accounted for nearly two-thirds of the total ChFemitted of China’s textile industry. However, TMS had 70.9% of the TIOV of China’s textile industry, so even though TMS caused the largest toxicity impact, its ChFI was lower than the average ChFI. The ChFemitted of CFMS was second only to TMS in China’s textile industry. This is due to the fact that CFMS involves the preparation of the spinning stock and the post-treatment process, consuming many solvents and additives with complex composition during the manufacturing process, thus emitting large amounts of NOX and SO2. At the same time, CFMS had the largest ChFI, which is higher than the average ChFI. This is due to the large emissions per unit industrial output value of CFMS, indicating that CFMS is a relatively low production value and high pollution sub-sector. TWAFCMS had the smallest ChFemitted, as garments, shoes, and hats are intensively sewed in this sub-sector and consume few chemicals. The less use of chemicals allows its NOX and SO2 emissions to cause only 3.1–7.2% of the total annual emissions of China’s textile industry. The low emission of NOX and SO2 of TWAFCMS leads to the small ChFemitted of TWAFCMS, which leads to the small ChFemitted under the unit industrial output value of TWAFCMS, so TWAFCMS has the smallest ChFI. The difference between NOX caused ChFemitted and SO2 caused ChFemitted not only due to the different emission amounts of NOX and SO2, but also due to the different CFs of NO, NO2, and SO2. The CFs of NO and NO2 are much larger than those of SO2, because NO and NO2 cause greater toxicity and greater exposure to air. This, coupled with the fact that the NOX emissions are also much larger than SO2 emissions, creates a large gap in the calculation of ChFemitted.
Conclusion
NOX and SO2 emitted from the textile industry could cause substantial effects on ecological environment and human health. The toxicity impacts of NOX (2006–2019) and SO2 (2001–2019) emitted from China’s textile industry was 352,340,264.3 and 46,849,758.4 PAF m3 day, respectively, with the largest toxicity impact caused by TMS. The toxicity impacts and secondary pollution problems caused by NOX and SO2 emissions had prompted the Chinese government authorities to pay more attention to these pollutants. Therefore, the Chinese government authorities had actively taken many control and treatment measures (e.g. adjusting the energy structure, optimizing the industrial layout, and constructing desulfurization equipment) to reduce the emissions of NOX and SO2 at source, thus reducing their toxic effects, as evidenced by the reduction of ChFI. However, this study indicated that the toxicity impact assessment studies on NOX and SO2 are still in their infancy. In addition, extensive studies must be conducted to fully consider the proportion of NO and NO2 components in NOX. However, both NOX and SO2 could cause the formation of secondary pollutants PM and ozone, which lead to urban haze weather. Therefore, subsequent studies can be conducted on the ChF of PM and consider its multiple environmental impact assessment with NOX and SO2 to mitigate the combined environmental impacts caused by the exhaust emissions from the textile industry in China.
Footnotes
Declaration of conflicting interests
The author(s) declared no potential conflicts of interest with respect to the research, authorship, and/or publication of this article.
Funding
The author(s) disclosed receipt of the following financial support for the research, authorship, and/or publication of this article: The authors are grateful to the Soft Science Research Project of Zhejiang Province (2022C25030), the Excellent Graduate Thesis Cultivation Foundation (LW-YP2021055), the Science and Technology Innovation Activities of University Students in Zhejiang Province (2022R406C077), the Scientific Project of Zhejiang Provincial Administration for Market Regulation (No. ZC2021A002) and the Science Foundation of Zhejiang Sci-Tech University (ZSTU) under grant number 22202009-Y for providing funding support to this research.