
Abstract
Per- and polyfluoroalkyl substances are widely used to provide a hydrophobic and oleophobic barrier in some fabric finishing. Per- and polyfluoroalkyl substances are a class of harmful chemicals that persist in the environment and our bodies. For indoor upholstery, these finishes are used to prevent staining. In this study, we examined the effectiveness of certain per- and polyfluoroalkyl substance finishes on commercial indoor fabrics for liquid repellency and stain performance. Three fabrics, each with an unfinished control, a dip finish, and a foam finish, were tested with coffee and oil-based salad dressing stains, two dwell times, two stain application procedures, and three abrasion conditions. Oil stain severity was affected by fabric type, finish, dwell time, and application procedure, but not abrasion. For water-based coffee stains, only fabric type had an effect. Droplet contact angle tests were also performed, revealing water and oil repellency is quickly lost with abrasion. Of the six per- and polyfluoroalkyl substance-finished fabrics tested, five showed small improvements in stain performance over unfinished fabrics; however, the performance differences between fabric types were much larger than the benefits from finishes. For oil stains, per- and polyfluoroalkyl substance finishes help in ideal conditions when the finish is unabraded, stains are set gently on the fabric, and stains are cleaned quickly. Our results suggest that the use of per- and polyfluoroalkyl substances on indoor furniture can be considerably reduced through intentional material selection to achieve better stain performance in lieu of per- and polyfluoroalkyl substance finishes.
Keywords
Introduction
Per- and polyfluoroalkyl substances (PFAS) are ubiquitous in the environment and have been detected in the blood of an estimated 97% of Americans. 1 Following years of scientific study, PFAS are receiving increasing scrutiny, including a new “action plan” from the US Environmental Protection Agency. 2 The most well-studied PFAS, long carbon-chain molecules like perfluorooctanoic acid (PFOA) and perfluorooctanesulfonic acid (PFOS), are known to cause health harm but have largely been phased out of production in the United States. The most common replacements for these long-chain PFAS are short-chain PFAS. While studies show these short-chain replacements may be excreted faster from the body, they are more difficult to remove from water (e.g. when treating drinking water), 3 and health hazards have been confirmed.4–6 Thus, a large number of environmental health scientists agree that they should also be phased out when and where their use is not essential. 7
PFAS are used in fabrics to create durable water repellent (DWR) finishes. Unlike other materials used to create DWRs, PFAS chemistry repels more than just water, including fluids with low surface energy like oils and certain bodily fluids. Consequently, PFAS-finished fabrics are popular among product manufacturers and consumers. Unfortunately, PFAS exposures occur during the manufacture, use, and disposal of finished fabrics, generating health risks for workers, consumers, and communities living near production sites as well as environmental harm.8,9 Non-fluorinated DWRs such as those using hydrocarbon or silicone-based polymers can provide near-equivalent water repellency but limited oil repellency and may still be harmful to humans and the environment.10,11
For PFAS-finished fabrics, especially those used in corporate, environmental, or public places, anecdotal evidence and unpublished internal testing by manufacturers suggest PFAS finishes are ineffective. 12 In these settings, stains are typically not attended to quickly and are allowed time to permeate into fabrics. Even with PFAS finishes, fabrics still stain, especially after the finishes have become worn with use. PFAS-based aftermarket sprays are then frequently reapplied on worn products (often without recommendation by the manufacturer), causing more concern for human exposure and environmental release.
In this study, we examined the effectiveness of PFAS finishes on commercial indoor fabrics for their liquid repellency and stain performance. We also evaluated water and oil repellency using droplet contact angle measurements. We used a factorial study design to assess the effects of PFAS finish type, fabric type, abrasion, stain type, dwell time, and stain application on the overall stain performance of the fabrics.
Experimental
Materials
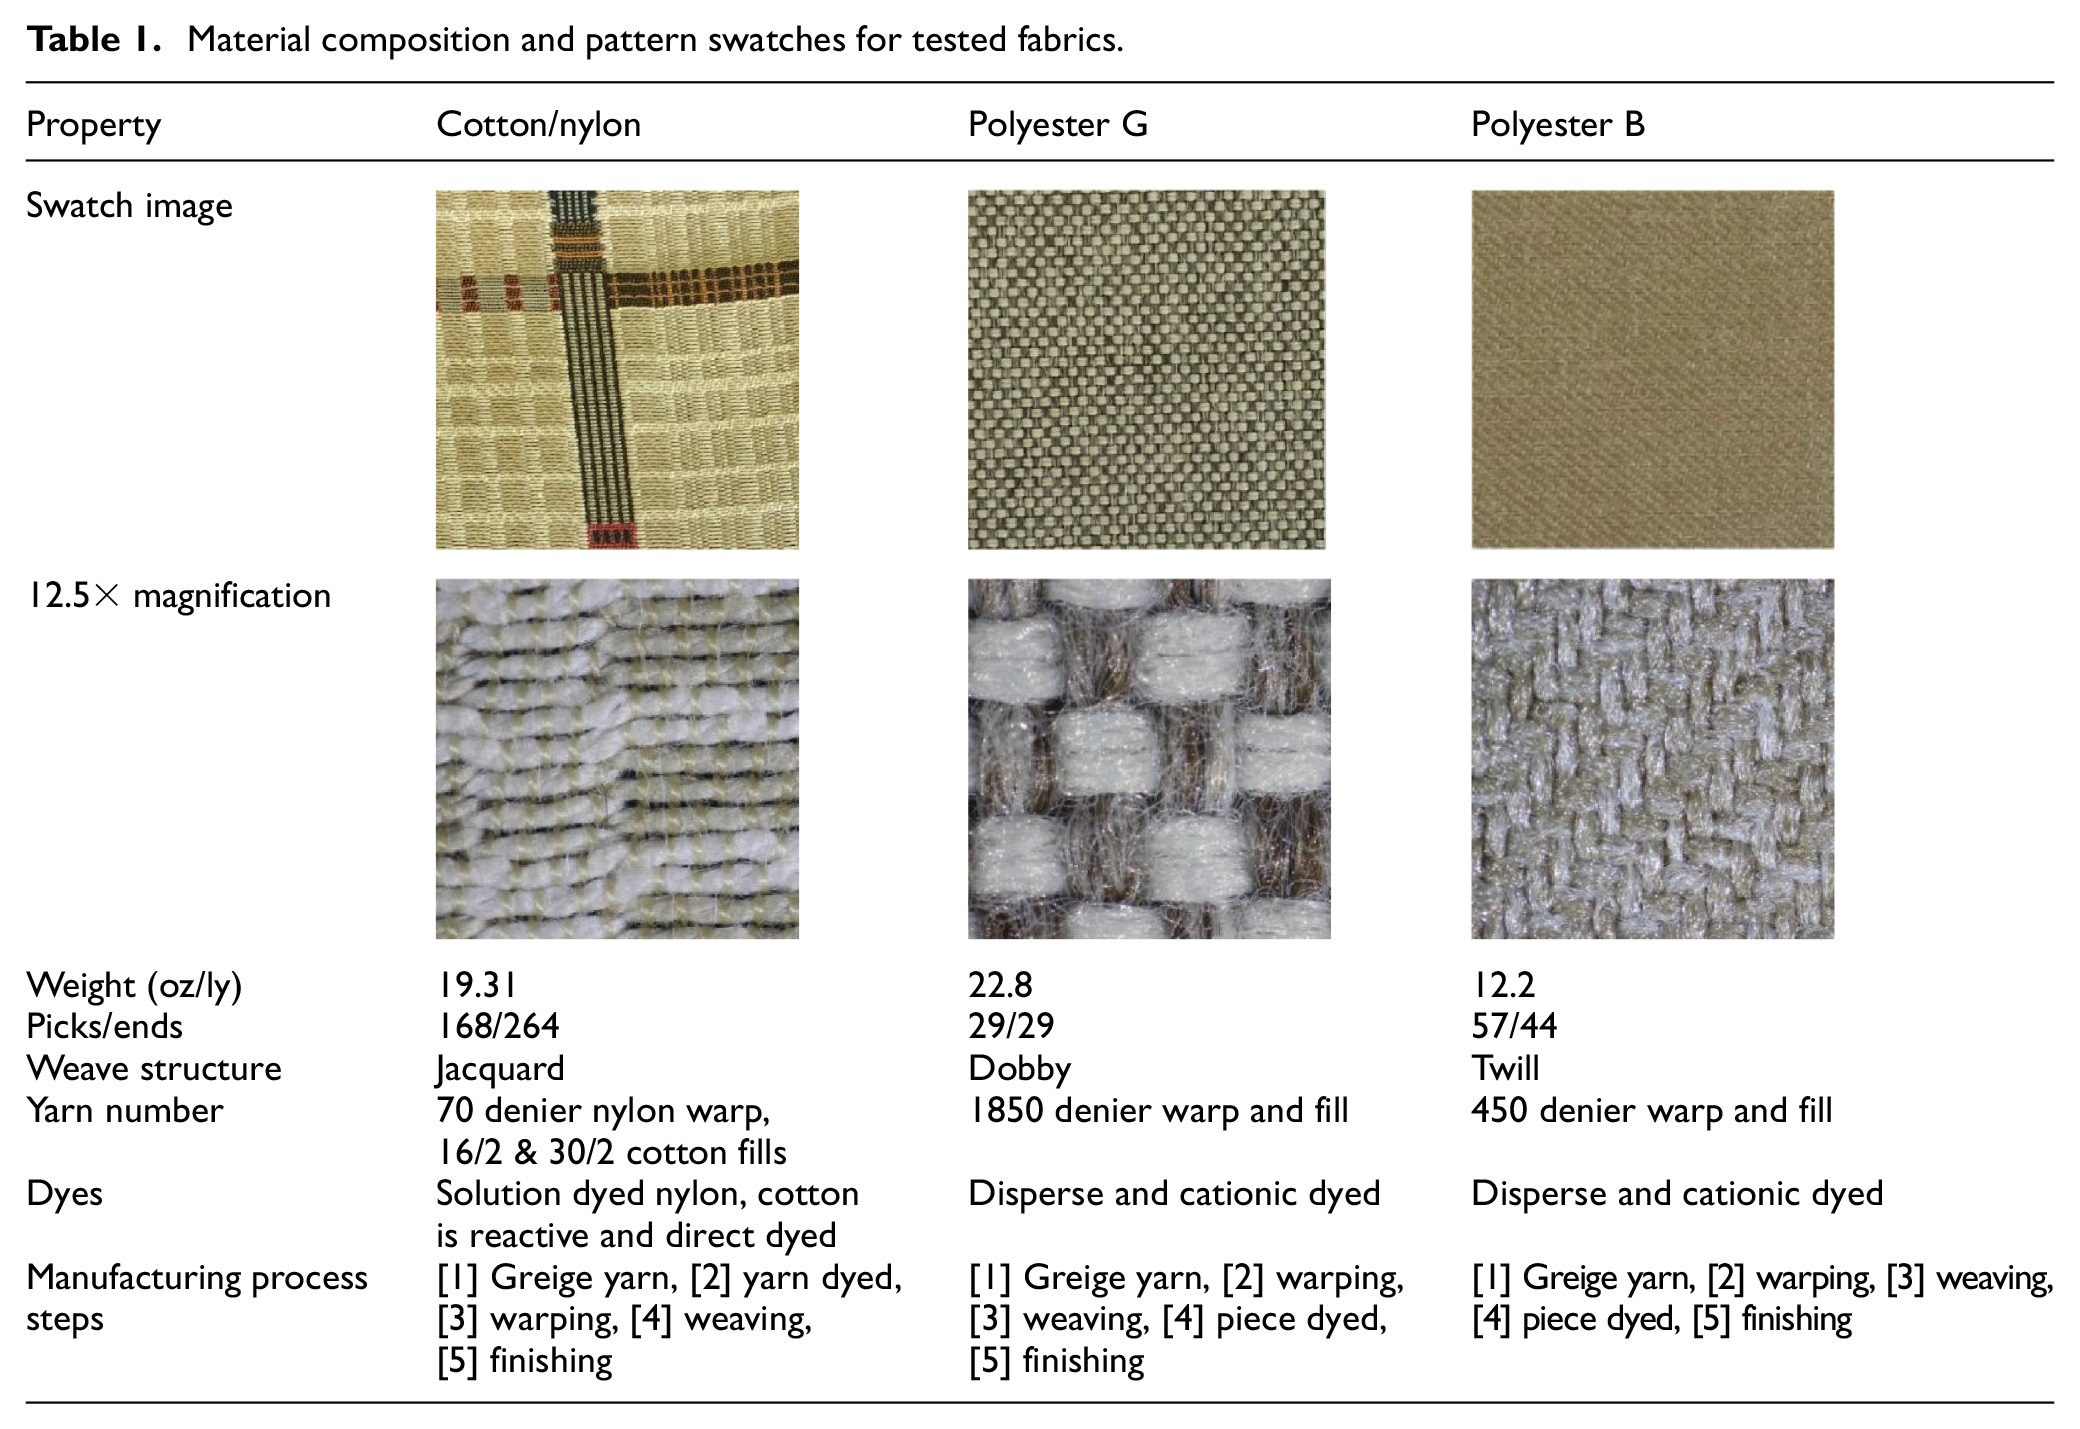
Table 1 shows the material composition and pattern swatches for the three fabrics tested. Fabrics were supplied by Maharam (New York, NY, USA).
Material composition and pattern swatches for tested fabrics.
Cotton/Nylon
The Cotton/Nylon fabric is constructed with a layered geometry in which an embellished grid overlays an irregularly checked ground. While the highly picked jacquard construction creates variety and density of color, the nylon warp enables graphic precision. Numerous contrasting tones accent the sand ground, and an acrylic backing provides support and structural integrity. This midweight fabric is constructed with fine yarns and a tight weave.
Polyester G
Designed to mimic the look and feel of wool, the midweight Polyester G fabric is constructed with piece-dyed post-consumer recycled polyester. Heavier denier yarns create a substantial basket or hopsack weave while cationic and disperse dyes offer two different hues of varying contrast. The dyes combine to create a heathered warp.
Polyester B
Polyester B fabric is cross-dyed using two types of dye — cationic and disperse — which gravitate toward different fibers for a blended bicolor surface. Finely woven yarns create a twill texture with slight stretch to this lighter weight fabric.
Finishing
The chemical composition of the PFAS finishes is protected as confidential business information. Figure 1 shows chemical structures of commonly used polymers for PFAS-based stain repellency finishes on polyesters, which are typically based on C6 chemistries. 13 Given that the fabrics were manufactured by different mills, finishing processes may vary.
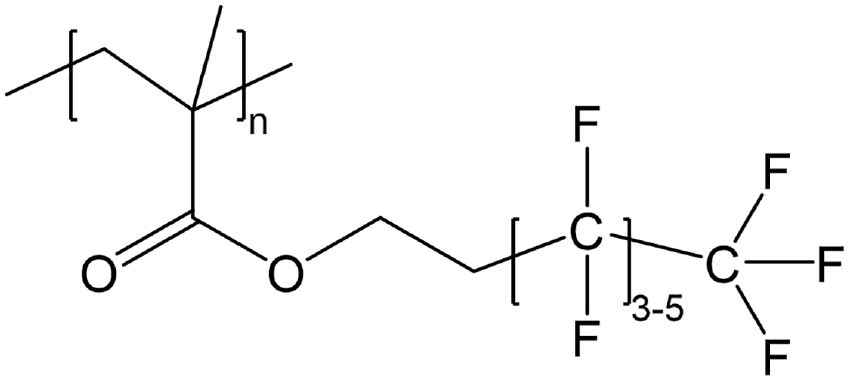
Example of a commonly used polymer for PFAS-based stain repellency finish.
The PFAS finishes are applied to the fabric samples using two methods:
Pad application (dip finish) is performed on a continuous tenter frame, where the fabric is immersed in PFAS solution in a trough. The fabric is nipped and then dried through an oven/drying chamber for curing.
Foam application uses two machines: a Gaston (foam applicator) and a tenter frame. The PFAS chemical is passed through a foam generator where it is mixed with surfactants. Then, the foam is pumped through the applicator onto the fabric surface (like shaving cream). Last, it is dried/cured on the tenter frame in a continuous process.
Note that the Polyester G fabric is usually foam-finished, while the Cotton/Nylon and Polyester B fabrics are usually dip-finished. For this study, we had custom samples made: a dip-finished Polyester G, and foam-finished Cotton/Nylon and Polyester B samples.
Methods
Contact Angle Testing
To estimate water and oil repellency, sessile (static) droplet contact angle testing was conducted on each fabric, for each finish condition, and for each abrasion condition (see “Abrasion” section). There were 21 conditions in total for these factors. One drop (∼0.04 mL) of water or olive oil was placed on the surface of a fabric sample and a high-resolution image was taken 10–15 s after placement. The image was shot at a low angle, as near horizontal as possible. The droplet contact angle was measured from both sides of the droplet, on the inward angle toward the center of the droplet. To negate uncertainty in leveling of the camera and the horizontal line of the image, the average of the two measurements was reported as the contact angle. The process was repeated for water droplets. Droplets demonstrating complete wetting of the fabric surface after 10–15 s are reported with a 0° contact angle.
Stain Testing
Separate from contact angle testing, the effects of several factors on overall staining were measured using 240 samples with 120 unique conditions. Fabrics were stained with either instant coffee (water-based) or balsamic vinaigrette (oil-based). The coffee was mixed with a concentration of one rounded teaspoon of crystals per six fluid ounces of water. The vinaigrette was shaken well before staining. Using a 3 mL bulb pipette, five drops of liquid (approx. 0.2–0.25 mL) were placed at the center of the fabric sample. For half of the samples, the liquid was immediately pressed into the fabric underneath a 5 × 5 cm sheet of Glassine paper and a 5 lb cylindrical weight with a diameter of 6.35 cm (2.5 in.) following American Association of Textile Chemists Colorists (AATCC) Test Method 130. The weight was applied for 60 s. For the other half, the liquid was allowed to sit undisturbed for the dwell time. All stains dwelled for either 15 s (short) or 1 h (long). Pressed stains were immediately cleaned after their dwell time. For set stains (not pressed), the undisturbed liquid was gently dabbed, then wiped with a fresh paper towel, and then cleaned.
Cleaning
Our cleaning method followed the manufacturer’s recommendations for spot cleaning; all samples were cleaned with a standard dish soap, concentrated at one tablespoon per two cups of warm water, and brushed with a dishrag using quick gentle strokes for 60 s. Excess soap residue was rinsed with a kitchen sponge soaked in fresh water. For oily stains that do not release with water and soap, the manufacturer recommends further cleaning with a bleach dilution, although this method was not used in this study.
Abrasion
The polyester samples were tested under three abrasion conditions (not enough fabric was available for the cotton/Nylon blend). These samples were only stained with oil, as coffee stains previously indicated much less severe staining than oil. Wyzenbeek abrasion resistance (ASTM D 4157) was performed with a #10 cotton duck to 15,000 double rubs and 30,000 double rubs to simulate moderate and heavy abrasion, respectively. 14
Stain Rating
After drying overnight, three raters, blind to the sample treatment condition, independently evaluated the stains using the AATCC Test Method 130 Stain Release Replica card (see Figure 2) and evaluated the stain patterns to the nearest half-point (the limit of discernibility), on a range between 1 and 5, with lower scores indicating darker stains. The stained fabrics were randomly ordered and all identifying marks were covered during rating. Two samples were prepared for each test condition.
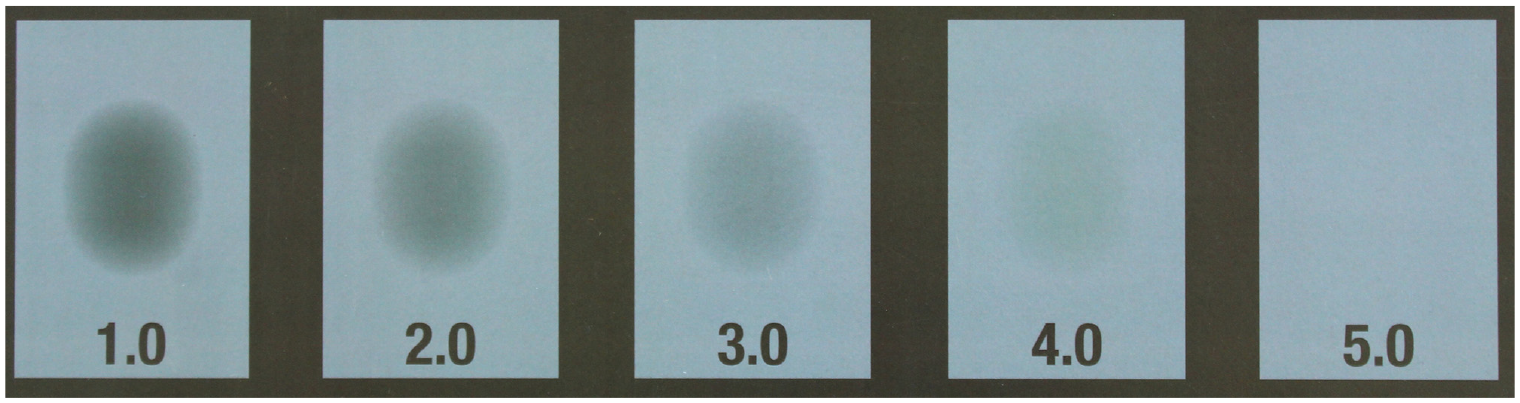
AATCC stain release replica. 15
Statistical Analyses
Statistics were implemented using the R programming language. 16 Factorial analysis of variance (ANOVA) was used to identify significant main effects and significant two-factor interactions of the factors on stain ratings. Factorial ANOVA relies on assumptions of normality of residuals and homogeneity of variance. Residuals from stain rating data largely followed a normal distribution with some compression in the upper quintile because ratings cannot exceed 5. Variances were not equal across groups, which can cause erroneous rejections of the null hypothesis; however, this issue is less severe when group sizes are equal, as they were in this study. We also urge readers to not only consider statistically significant differences but also consider physically meaningful differences in effect size. There were six factors tested: finish type, fabric type, abrasion, stain type, dwell time, and stain application. We also added a control variable to account for the possibility that samples treated with a custom finishing process may perform differently than samples treated with the standard finish. Additional two-way t tests were run to compare PFAS-finished samples and unfinished sample groups under ideal and non-ideal conditions. A p value of 0.05 was chosen to indicate statistical significance. Graphics were implemented using ggplot2. 17
Mean stain ratings and ANOVA results for main effects.
ANOVA: analysis of variance; PFAS: per- and polyfluoroalkyl substances.
p < 0.05; **p < 0.01; ***p < 0.001.
Results and Discussion
Water and Oil Contact Angles
Water and oil contact angles were measured to compare the relative hydrophobicity and oleophobicity of the fabric samples. Contact angles greater than 90° indicate hydro/oleophobicity, 18 though contact angle results are best used as relative measures. 19 All unfinished fabrics exhibited complete wetting (0° contact angle) for both water and oil droplets for all abrasion conditions (except for cotton/Nylon which was not abraded). Water droplets on cotton/Nylon exhibited average contact angles of 68.1° for dipped and 86.5° for foam-finished fabrics. Oil droplets on cotton/Nylon foam-finished fabrics exhibited an average contact angle of 98.9°. Dip-finished cotton/Nylon was unusual in that it exhibited complete wetting of oil with no abrasion. Figure 3 shows contact angle results for the polyester fabrics. The highest contact angles were observed for dip- and foam-finished fabrics with no abrasion; all but one were above 65° and most (8 of 12) were above 90°. All but one sample showed complete wetting by water droplets after moderate and heavy abrasion. For oil droplets, foam- and dip-finished Polyester G completely wetted after moderate and heavy abrasion. Polyester B maintained some oil repellency after moderate and heavy abrasion, though the contact angles were dramatically reduced to below 50°.
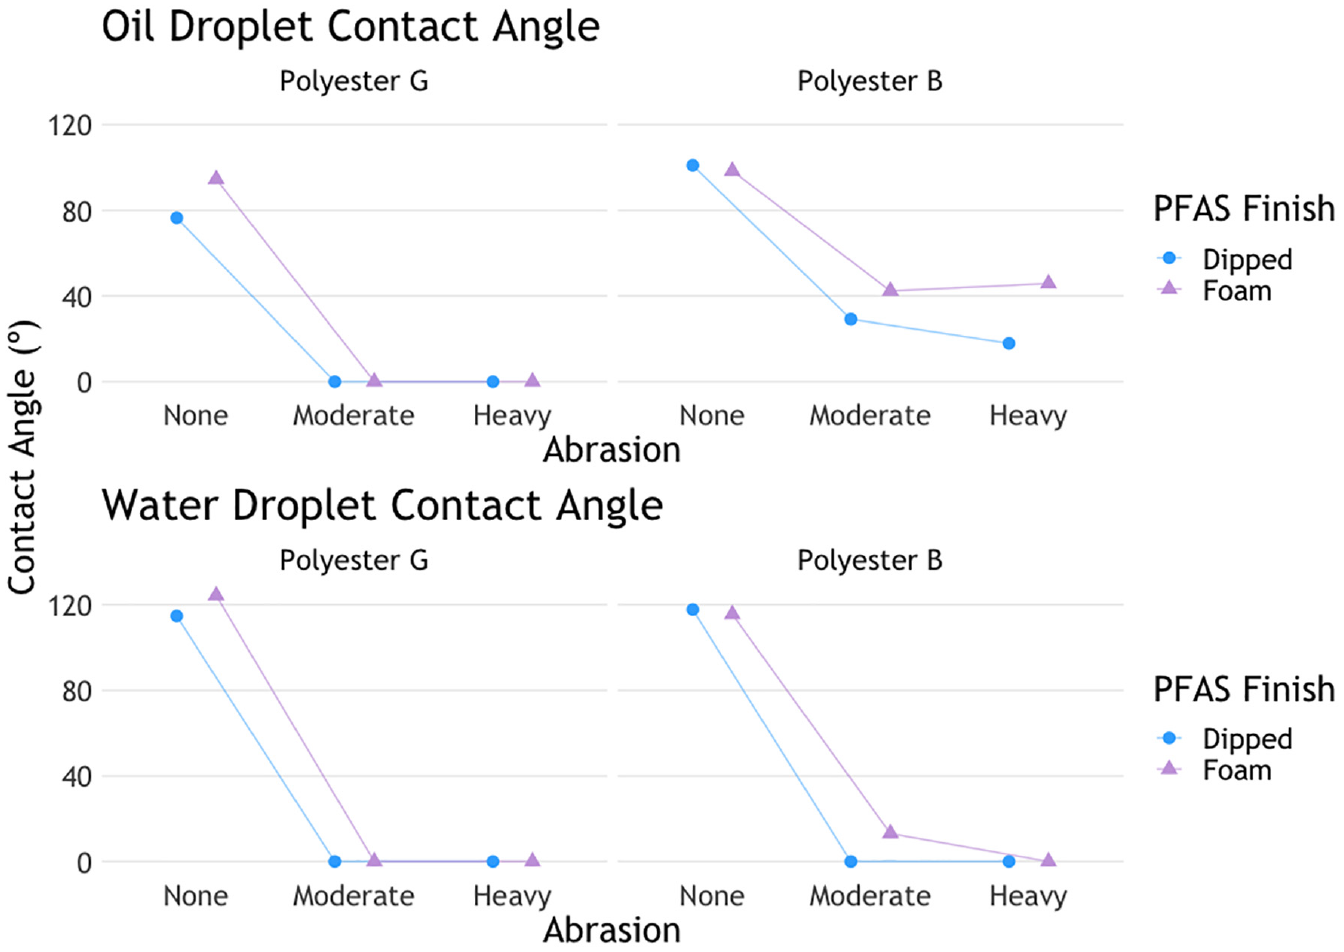
Effect of abrasion and PFAS finish type on oil and water contact angle of fabrics.
Microscopic images of the abraded fabric surfaces did not show noticeable structural damage, so structural changes to the fibers or fabric were likely not reducing repellency. These findings strongly suggest that contact angle results were due to mechanical removal of the PFAS finish, not changes to the fabric structure itself. PFAS finishes are a surface coating of side-chain fluorocarbon methacrylic polymers. The polymethacrylate backbone chain interacts weakly with the surface of the fibers, and friction can easily remove the coating. PFAS finishes have been observed to wear off from other synthetic fiber fabrics during weathering 20 and during machine washing. 21 PFAS has also been shown to migrate from treated firefighter textiles into the surrounding environment. 22
Stain Testing
For the staining experiments, we measured stain ratings of the fabrics for all experimental conditions. On a scale from 1 to 5 (Figure 2), ratings of 4 and above are very lightly stained, with 4.5 nearly indistinguishable from unstained fabric. Below a rating of 4, stains are noticeable and would attract attention, and below a rating of 3, staining is very apparent. In this study, the average variance among ratings for individual samples was 0.12 and the intraclass correlation coefficient (ICC) (a measure of interrater reliability) for the average rating of three raters, ICC(2, k = 3), was 0.94 which is considered excellent reliability. 23
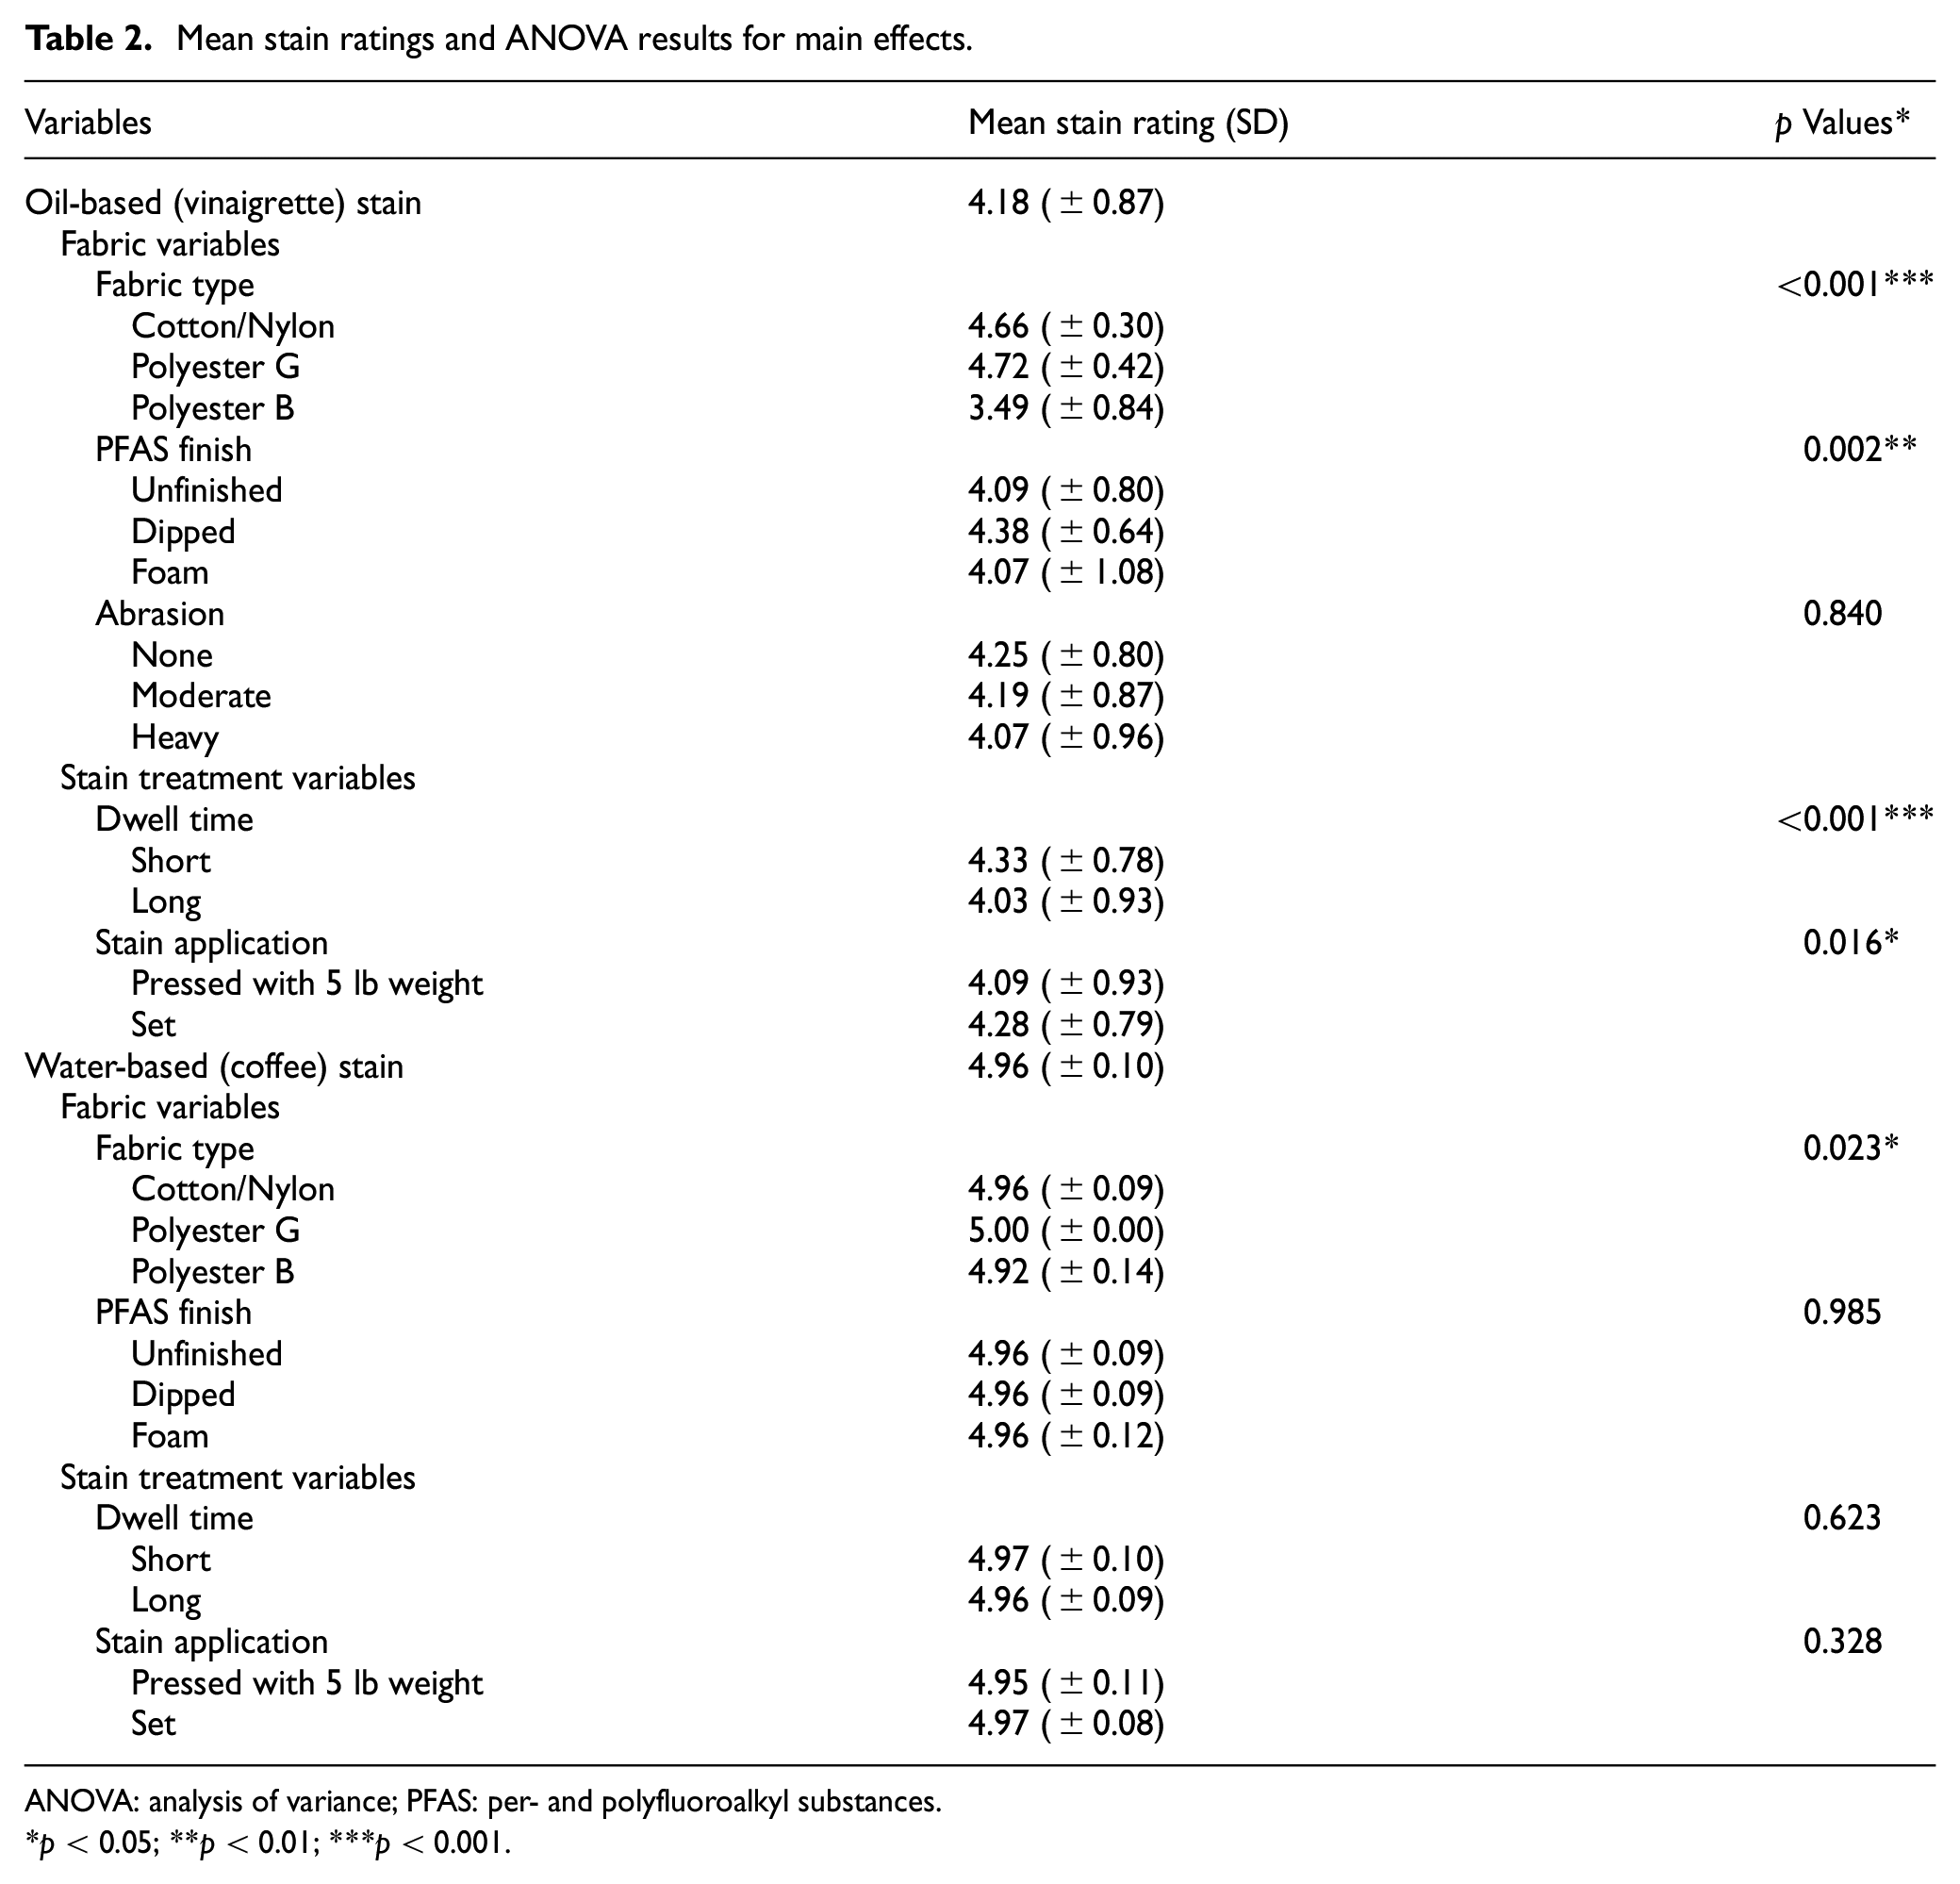
Table 2 shows the descriptive statistics and analytical results for each type of stain (water-based or oil-based) for all included variables: fabric type, finish type, dwell time, stain application method, and fabric abrasion. For oil stains, all variables except abrasion showed statistically significant effects. Unfinished fabrics and foam-finished fabrics performed slightly worse than dip-finished fabrics overall, though these differences were not consistent across fabric types. For coffee stains, only fabric type showed statistically significant effects. The two polyester fabrics rated better than the cotton/Nylon blend, but differences were very small (within 0.5 of one another, that is, the limit of discernibility of the stain rating method). PFAS finish, dwell time, and stain application made no difference for coffee stains.
Water-based coffee stains were consistently less severe than oil stains and are essentially negligible. Most fabrics stained with coffee showed no signs of any staining and the worst coffee stain received a score of 4.5, a stain that is hardly visible. The ease with which coffee stains were washed out of unfinished and finished fabrics alike indicates that the PFAS finishes we tested did not confer a benefit for these types of stains.
The factor exhibiting the largest effect on stain ratings was fabric type (Figure 4). Polyester B performed worse than the other fabrics across all PFAS finishes. Conversely, Polyester G and the cotton/Nylon fabric performed equally well (p = 0.97). On average, stain ratings on Polyester G were 0.18 points higher (better) than those on the cotton/Nylon blend and 0.94 points higher than those for Polyester B. The difference in performance between the polyester samples was the largest difference between groups observed in this study.
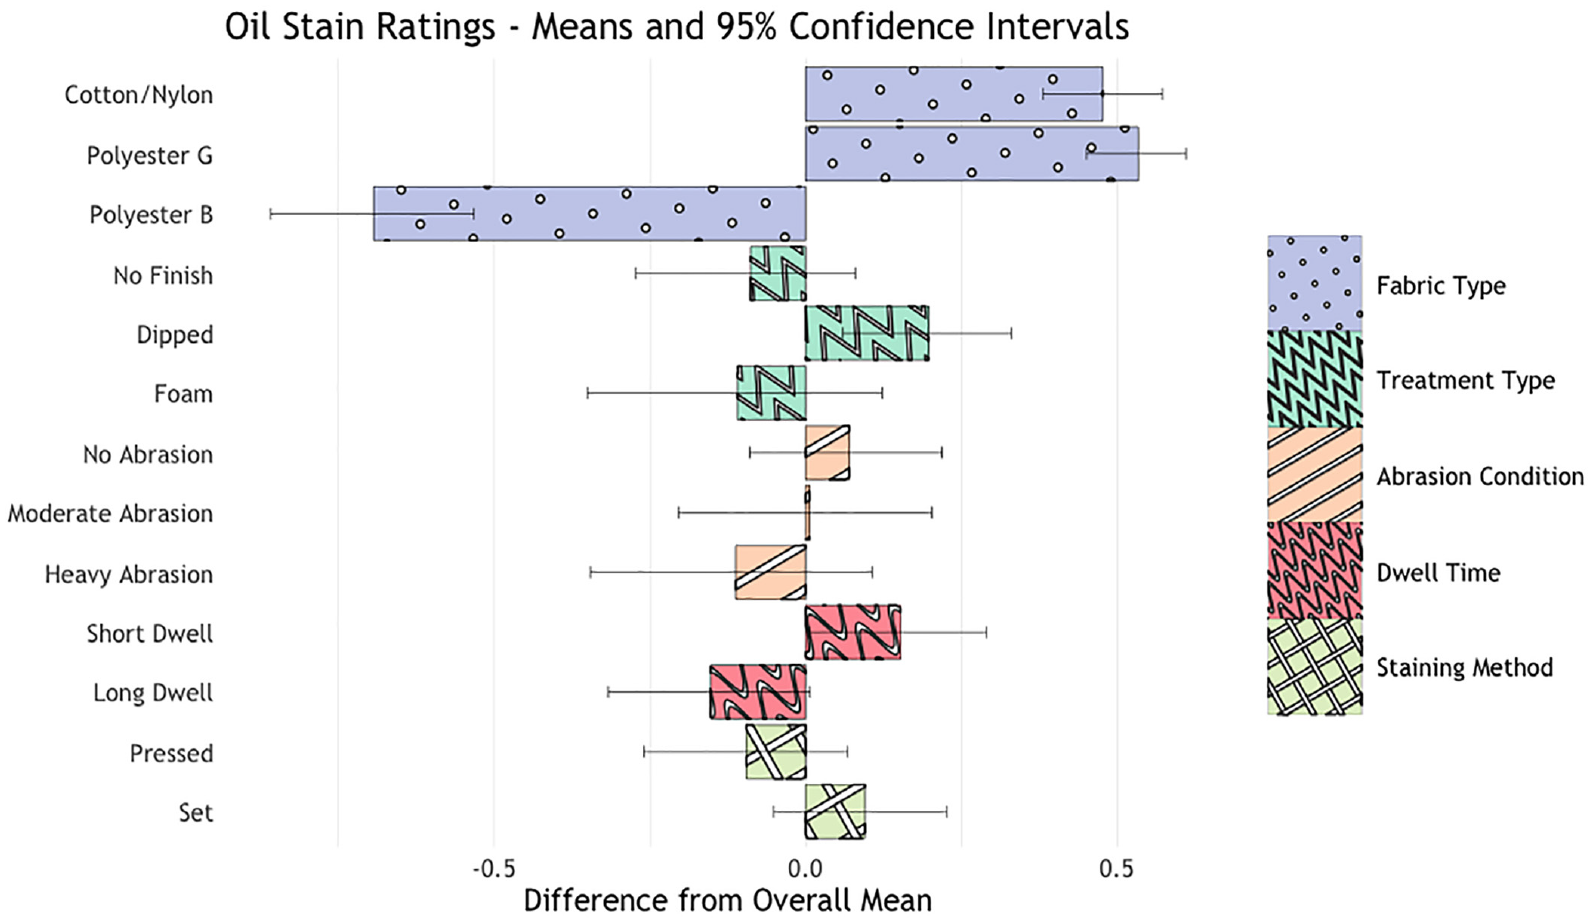
Difference in means for each test condition compared to mean of all oil stain data with 95th percentile confidence intervals for each subgroup mean. Bars extending rightward indicate better stain ratings and bars extending leftward indicate worse stain ratings.
Performance differences between fabrics could arise from differences in material, construction, and color. For example, stains were more difficult to identify on patterned fabrics. The cotton/Nylon blend had the most sophisticated pattern while Polyester G had a two-color checkerboard pattern of intermediate complexity (see Table 1 for swatch images). Polyester B had a simple blended color and the worst stains were observed for this even-toned fabric.
The construction of the fabric may also affect stain visibility. Polyester G had a looser air-textured woven basket structure, coarse yarns, and rough surfaces. On Polyester G, liquids can soak into the thicker fabric and remain trapped without being visible on the surface. Conversely, the thinner fibers and denser twill weave of Polyester B likely held stains on the surface where they were most visible. The cotton/Nylon blend also had a dense weave, and thinner fibers, but its heavier weight, different material, and color pattern were likely more important factors.
Though we are not able to specifically identify which physical properties of the fabric affect stain performance, some textile manufacturers are already knowledgeable on the stain performance of their products, including unfinished fabrics.
In general, PFAS finishes lessened the severity of staining. Dip- and foam-applied PFAS finishes imparted a performance benefit to both the cotton/Nylon blend and Polyester G compared to their unfinished counterparts. Dip-finished Polyester B also performed better than its unfinished version; however, foam-finished Polyester B performed much worse. The PFAS finishes were most effective when liquid was wiped off the unabraded fabric shortly after being placed. Departures from this ideal scenario led to worse staining. For a non-ideal scenario where stains are pressed into heavily abraded fabric and dwelled for an hour, the average stain rating for PFAS finished samples was 3.88, which was significantly different (p = 0.028) compared to 4.73 under ideal conditions (dabbed with a paper towel, unabraded fabric, and short dwell time). Unfinished samples saw no change (p = 0.83) in stain ratings across these best-case and worst-case scenarios and had an overall average of 4.22 points. This means that PFAS finished samples performed better than unfinished samples under ideal conditions and performed worse than unfinished samples under non-ideal conditions.
The main difference between the two types of PFAS finishing processes (dip vs foam) is the distribution of the PFAS on the fabric fibers. Dip-finished fabrics are immersed in a bath of the PFAS treatment, allowing the PFAS agents to fully interact with the fibers throughout the thickness of the fabric. In contrast, foam finishes only provide good contact of the PFAS with the outside surface of the fabric. A foam-finished fabric may be able to repel an oil- or water-based staining agent at the surface, but the PFAS finish may not cover all surfaces of the inside fibers, resulting in lower repellency to stains once they penetrate into the material. Stains will easily penetrate the fabric surface when they are pressed or when the finish is abraded. On foam-finished samples, stains can then become trapped under a surface layer of PFAS finish, which repels some of the soap and water used for cleaning. Other researchers have also identified this problem where cleaning is more difficult on finished fabric. 24 This is especially noticeable for Polyester B, which is a tightly woven twill made of finer denier fibers that can prevent penetration of PFAS foam. This may explain why there was worse staining for foam-finished Polyester B than any other PFAS finish and fabric pairing, especially when the liquid was pressed into the fabric. This also could explain why we saw an interaction between foam finishing and abrasion and no interaction between dip finishing and abrasion.
Longer dwell times contributed modestly to worse staining. Averaged for all conditions, a longer dwell time (approximately 1 h) compared to a shorter dwell time (15–75 s) yielded oil stains that were 0.30 points worse. Gently dabbing and wiping stains instead of pressing them into the fabric had an average benefit of 0.19 points.
Figure 5 shows oil stain results across finish types for each fabric. The interaction between fabric type and PFAS finish was significant (p < 0.001). When compared to unfinished fabric of the same type, dip PFAS finishes improved oil stain ratings on average by 0.06, 0.25, and 0.39 points for the cotton/Nylon, Polyester G, and Polyester B, respectively. Foam PFAS finishes affected stain ratings by 0.23, 0.44, and −0.57 points (a reduction in performance) for the cotton/Nylon, Polyester G, and Polyester B, respectively. In other words, across all fabric types, dip finish imparted small benefits while the foam finish helped on two of the fabrics and reduced performance for one. Fabric type also interacted significantly with dwell time, in that Polyester B was worse with longer dwell time (−0.54 pts effect size). The reduced performance was likely caused by the reduced penetration of the PFAS foam finish inside the fabrics. Notably, the overall average for the foam finish is comparable to that for the unfinished fabric group in Figure 4 (above).
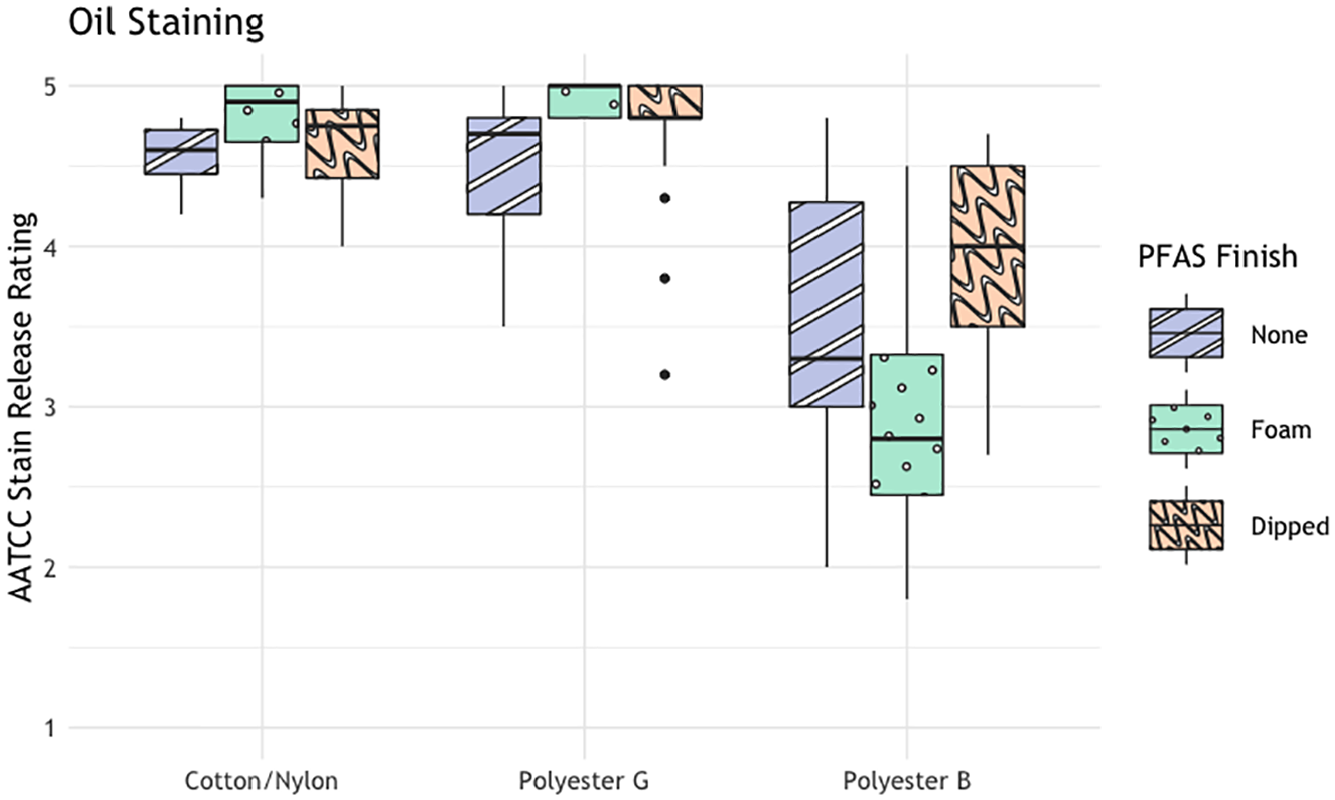
Effect of PFAS finishes across fabric types on oil staining.
PFAS finish type also showed significant interactions (p < 0.05) with stain application and abrasion. Unsurprisingly, the interaction between finish type and stain application showed that setting (not pressing) only reduced the severity of stains when it was performed on a PFAS-finished sample. Foam-finished samples saw more improvement (0.49 pts effect size) in stain rating than dip-finished samples (0.15 pts effect size) when stains were set. For the interaction between finish type and abrasion, foam-finished samples performed slightly worse (0.3–0.65 pts effect size) with increased abrasion while dip-finished and dip-unfinished samples had little interaction with abrasion (0.2–0.4 pts effect size).
Conclusion
The greatest benefit from PFAS stain repellency finishes is achieved when liquid stains are repelled entirely from the fabric and do not enter the fabric. For nearly all of the samples tested, this level of repellency was quickly lost with moderate levels of abrasive wear and liquid stains soaked into the fabric within seconds. This means worn PFAS-finished fabrics must be maintained by frequent cleaning, similar to the need for cleaning unfinished fabrics. Loss of repellency can be repaired by applying aftermarket sprays, though these will also wear from the fabric surface and can be a large source of human exposure. 25 In this study, water-based stains were minimal and easily removed from finished and unfinished fabrics alike. For oil stains, PFAS finishes help in ideal conditions when the finish is unabraded, stains are set gently on the fabric, and stains are cleaned quickly. Departures from these ideal conditions can lead to staining similar to or worse than on unfinished fabrics. Fabric choice was the largest contributing factor to stain performance. Our results suggest that the use of PFAS in indoor furniture can be avoided through intentional material selection.
Footnotes
Declaration of conflicting interests
The author(s) declared the following potential conflicts of interest with respect to the research, authorship, and/or publication of this article: B.P. is employed by Maharam that supplied the fabric samples for the study; however, she did not take part in conducting the experiments or analyzing the results. Maharam did not provide any funding for this research.
Funding
The author(s) disclosed receipt of the following financial support for the research, authorship, and/or publication of this article: Funding was provided by charitable contributions to the Green Science Policy Institute.