
Abstract
The main concern for the limited practical applications of strain-hardening cementitious composite, especially in China, is the high cost of imported materials, mainly polyvinyl alcohol fibers. This study uses local ingredients to develop strain-hardening cementitious composite reinforced with non-oil-coated Chinese polyvinyl alcohol fiber. The cementitious matrix consisting of cement, fly ash, viscosity-modifying agent, and silica fume was prepared, and the matrix tailoring was performed to achieve improved mechanical performance. The prepared composites were evaluated by rheology, three-point bending, and tensile characterizations. It is found that with the given local ingredients and matrix modification, the toughness index value of 100 (I40) according to the American Society for Testing and Materials can be achieved. Besides, the tensile results showed the improvement of 45% and 60% for first-cracking strength and peak tensile strength values, respectively. The effects of matrix modification are also analyzed statistically using the analysis of variance for the mechanical properties of the cementitious composite. The post hoc statistical analysis using the Tukey–Kramer honestly significant difference illustrated the optimum cementitious mix from the experimental data. The presented results of cost-effective strain-hardening cementitious composite are expected to promote the practical applications of strain-hardening cementitious composite in China.
Keywords
Introduction
Engineered cementitious composites (ECCs) are a class of high-performance fiber-reinforced cementitious composites developed by Li. 1 The design of ECC is based on the theory of micromechanics, which involves the controlled interactions between fiber, cement matrix, and the interface.2–4 The meticulously designed ECC comprises tensile strain-hardening 2–5% higher than conventional fiber-reinforced concrete. 5 Besides, the ECC material exhibits tiny and multiple-cracking behavior instead of a localized fracture.6,7
ECC was first developed using polyethylene (PE) fibers.4,8 Although only 2% fiber volume is required for ECC material, the practical applications were still limited due to the high cost of PE fibers. Later, polyvinyl alcohol (PVA) fibers were utilized as an alternative to PE fibers for ECC material due to their comparatively lower cost. PVA fibers, unlike PE fibers, are hydrophilic and develop a strong bond with the cement matrix. Such strong adhesion between PVA fibers and the cement matrix is undesirable because, on the application of the load, such strong bonding leads to premature fiber rupture instead of utilizing the fiber reinforcement up to its maximum capability. 9 Therefore, the surface of PVA fibers was treated with an oiling agent to reduce the bonding between fibers and cement mix. 3 The reduction in the bonding promotes the pull-out behavior of the PVA fiber, which ultimately produces strain-hardening ductile performance.
The design of ECC is not based on trial and error. Instead, it is based on controlled interaction between fiber, matrix, and the fiber–matrix interface. Unlike conventional fiber-reinforced concrete (FRC), ECC exhibits pseudo-strain-hardening (PSH) behavior resulting in 3–5% tensile strain-hardening, that is, 300–500 times higher than traditional concrete.1,2,5,7 On application of tensile load, traditional concrete demonstrates brittle fracture, whereas FRC results in a strain-softening response as shown in Figure 1(a) of supporting information. However, ECC, due to strain-hardening behavior, develops multiple fine cracks of less than 100 µm size, thus resulting in ductile response, Figure 1(b) of supporting information. As a result of this, ECC is more robust than traditional concrete and FRC in terms of brittleness and crack-width control, thus enhancing overall structural strength and durability. The ECC design philosophy comprises microstructure design based on micromechanics, cementitious matrix rheology control, and composite ingredient-controlled interactions, which provides vast opportunities for structural design for targeted applications and properties. ECC has been applied in various applications, including bridges, bridge deck patch repair, slabs, pavements, seismic-activity resistant structures, impacts, blast resistance, and so on.
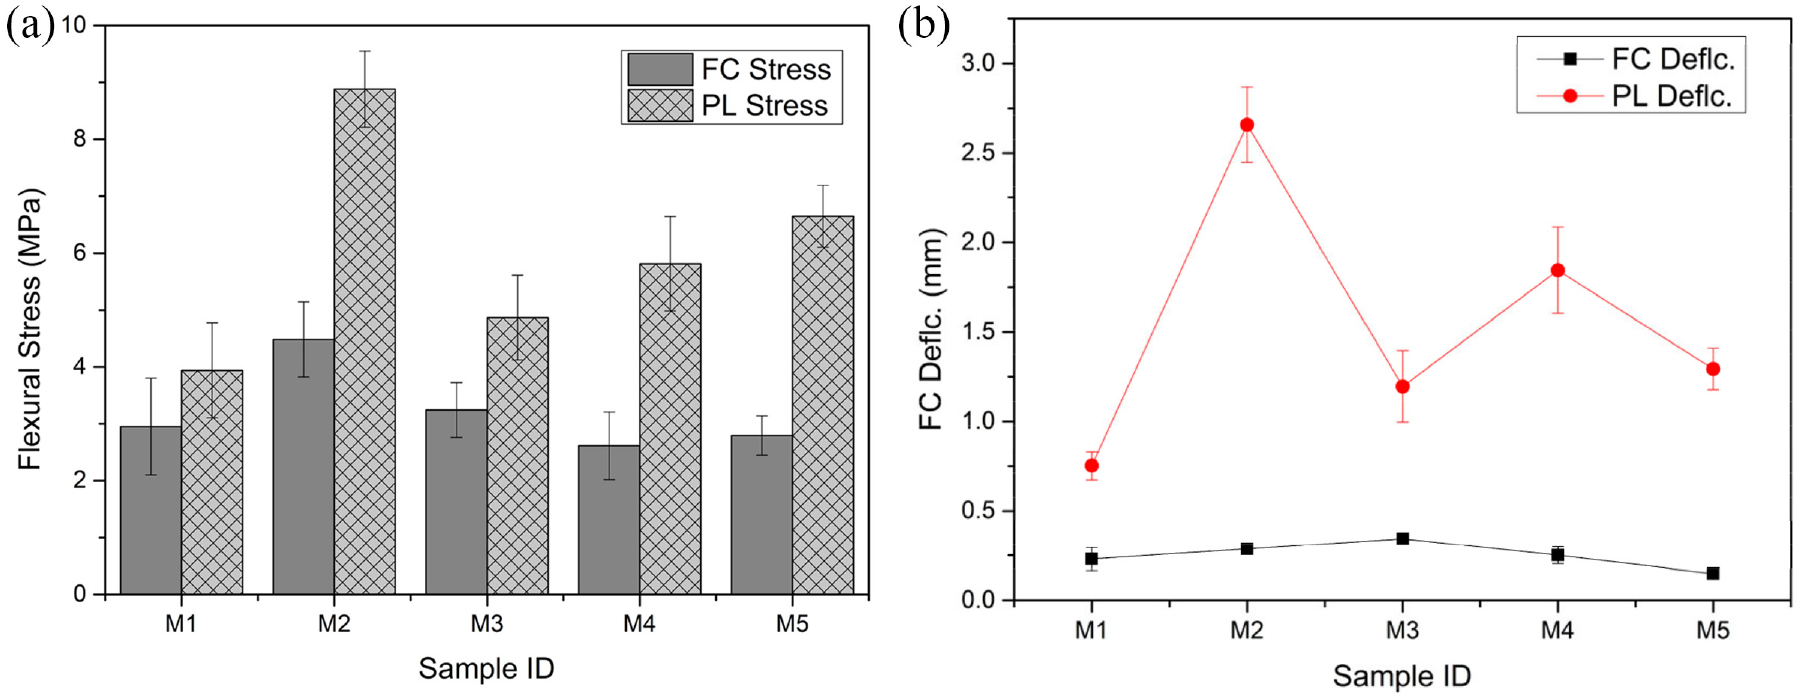
Flexural test load and displacement values: (a) first-crack stress (FC stress) and peak-load stress (PL stress) values; (b) first-crack deflection (FC deflc.) and peak-load deflection (PL deflc.) values.
In spite of the superior properties of ECC material, the practical applications on a large scale, especially in China, are limited due to the high cost of imported oil-treated PVA fiber. Several studies have been carried out to utilize local ingredients to reduce the total cost using hybrid reinforcement, 10 matrix modification,11–14 and fiber surface modification.15–18
The locally manufactured Chinese PVA fiber has lower tensile strength and elastic modulus than the imported Kuralon PVA fiber. Due to the comparatively lower tensile strength, the local PVA fiber is liable to rupture when applying load and crack propagation. According to the ECC design theory, the fibers must resist the load and pull out instead of being ruptured for smooth fiber crack-bridging capacity. Failing to do so will result in not fulfilling the ECC design criteria, causing strain-softening behavior as is often the case in typical FRC. In addition, the imported PVA fiber has an oil coating that provides controlled interaction between the fiber and the cementitious matrix. However, the local Chinese PVA fiber has no oil coating, resulting in a strong chemical bond and is thus highly liable to break during load application. Due to these different properties of local PVA fiber, ECC ingredients are re-modified to attain comparable properties. Therefore, in the present work, the matrix modification is proposed to overcome the disadvantages of domestic PVA fibers, that is, poor strength, ductility, and uniformity. The modification of ECC rheology has also been reported to contribute to achieving PSH behavior.12,19 PVA fiber being hydrophilic at a higher fiber volume percentage could intermingle and result in segregation in the cement mix. Li and Victor 20 studied the effects of fiber distribution and orientation by adjusting the rheological properties of the cementitious composite. The study concluded that the theory of micromechanical design should be related to controlled rheology to attain significant strain-hardening properties in the material. Yang et al. 21 investigated the different possibilities of modifying the yield stress and viscosity of the fresh mix using different ratios of cementitious material and admixtures. The mechanical property characterization revealed improvement in tensile strain and tensile strength of the cementitious composite. However, the utilization of local materials may alter the fresh mix as well as the hardened properties.
This study investigates the effects of using different percentages of viscosity-modifying agent (VMA) on the flexural behavior of mortar concrete, including flexural strength and toughness. VMA is reported to provide stability to the fresh cementitious mix and reduce sensitivity to variation in materials, resulting in more robust mixes. 22 As also demonstrated by the study of Domone 22 and Aarre and Domone, 23 sensitivity of water content on the mixes with VMA and without VMA was compared. It was found that the mix with VMA was, on average, comparatively less sensitive (changes in slump flow of 70 mm) than those without VMA (changes in slump flow of 150 mm) for a 1% change of water content, where changes in slump flow roughly equivalent to sensitivities. Although some research works have been carried out regarding the use of VMA, the practical applications, especially in China, are limited due to the cost constraints of the imported raw materials for strain-hardening behavior. The working mechanism of VMA for the modification of cement mix has been explained elsewhere.24,25 The present research was carried out by utilizing local ingredients only to examine the cost-effective strain-hardening behavior and study the robustness of VMA without compromising the cementitious composite’s workability, flexural strength, and toughness. It should be noted that the results discussed in the present research work are all attributed to the local ingredients and Chinese PVA fiber properties, as mentioned in the next section. Several research works have also reported the variation in the rheological properties of the cementitious mix with the different volume percentages of fibers. In addition, the fiber aspect ratio has also been reported to affect the critical fiber volume needed to achieve the strain-hardening property,26,27 which would indirectly influence the fiber distribution and mechanical properties of the composite.
The main objective of this study is to tailor the matrix using a local cementitious mix to achieve strain-hardening behavior. Consequently, recognizing the cut-off point at which the matrix modification using VMA is appropriate to achieve increased toughness and strain-hardening in both flexural and direct tensile tests for the given cementitious mix ratio. Moreover, the bending toughness calculated by three different methods is also discussed. Finally, a statistical analysis is applied in this study to explore the experimental results further.
Experimental Program
Materials Details and Mix Proportion
The local PVA fiber is used in this study with a length of 12 mm, 35 µm diameter, tensile strength 1300 MPa, and Young’s modulus 35 GPa. A fiber volume fraction of 2% is used in this study. The concrete composition contains ordinary Portland cement (type-I), fly ash (Chinese type-I), fine sand (110 µm of average size and 300 µm of maximum grain size), and high-range water-reducing admixture (HRWRA-polycarboxylic type) and viscosity-modifying admixture (VMA). All of the ingredients were purchased from local suppliers. HRWRA was used to enhance the workability of the cement mix. VMA stabilizes the fresh mix by preventing segregation and thickening the paste. The mixed samples were prepared with a combination of water-reducing admixture and VMA. Synthetic water-soluble VMA is used in the experimental work. The mix ratio is shown in Table 1 of the supporting information. Five mixes were prepared with different quantities of VMA, including one control mix without VMA but with the same ratio of HRWRA for comparison purposes. The water-to-binder ratio of 0.36 was used in all of the mixes.
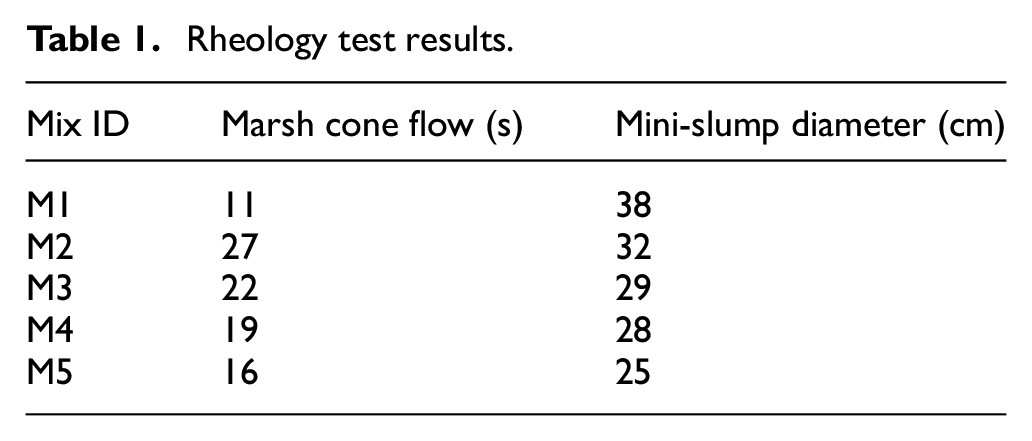
Rheology test results.
Sample Preparation and Testing Method
The dry ingredients were mixed in a Hobart mixer for 6 min at low speed. Water was added slowly and mixed for 3 min until a uniform paste was formed. PVA fibers were added slowly and mixed for 6 min until the fibers were uniformly dispersed into the cement mix. The fresh cement mix was cast into the molds previously coated with oil for easy demolding. All samples were vibrated for 2 min to remove the trapped air. Samples were demolded after 24 h and water cured for 7 days at room temperature.
The rheological properties of the mixes were tested by the Marsh cone flow test and the mini-slump test. The rheological tests were carried out without adding fibers. The mold dimensions are shown in Figure 2(a) of the supporting information. The Marsh cone flow test measures the flowability of the cementitious mix. Initially, the bottom part of the cone is closed, and the cone is filled with the fresh mix from the top opening. After the cone is filled, the bottom exit is opened, and the time required for the mix to flow out is noted in seconds. In the mini-slump test, the mold is placed on top of the glass plate, and the fresh cementitious mix is poured in the mold. Then, the cone is lifted to allow the mix to spread on the plate. Three samples were tested for each test. The two perpendicular diagonal diameters were noted, and the average was calculated for each mix.
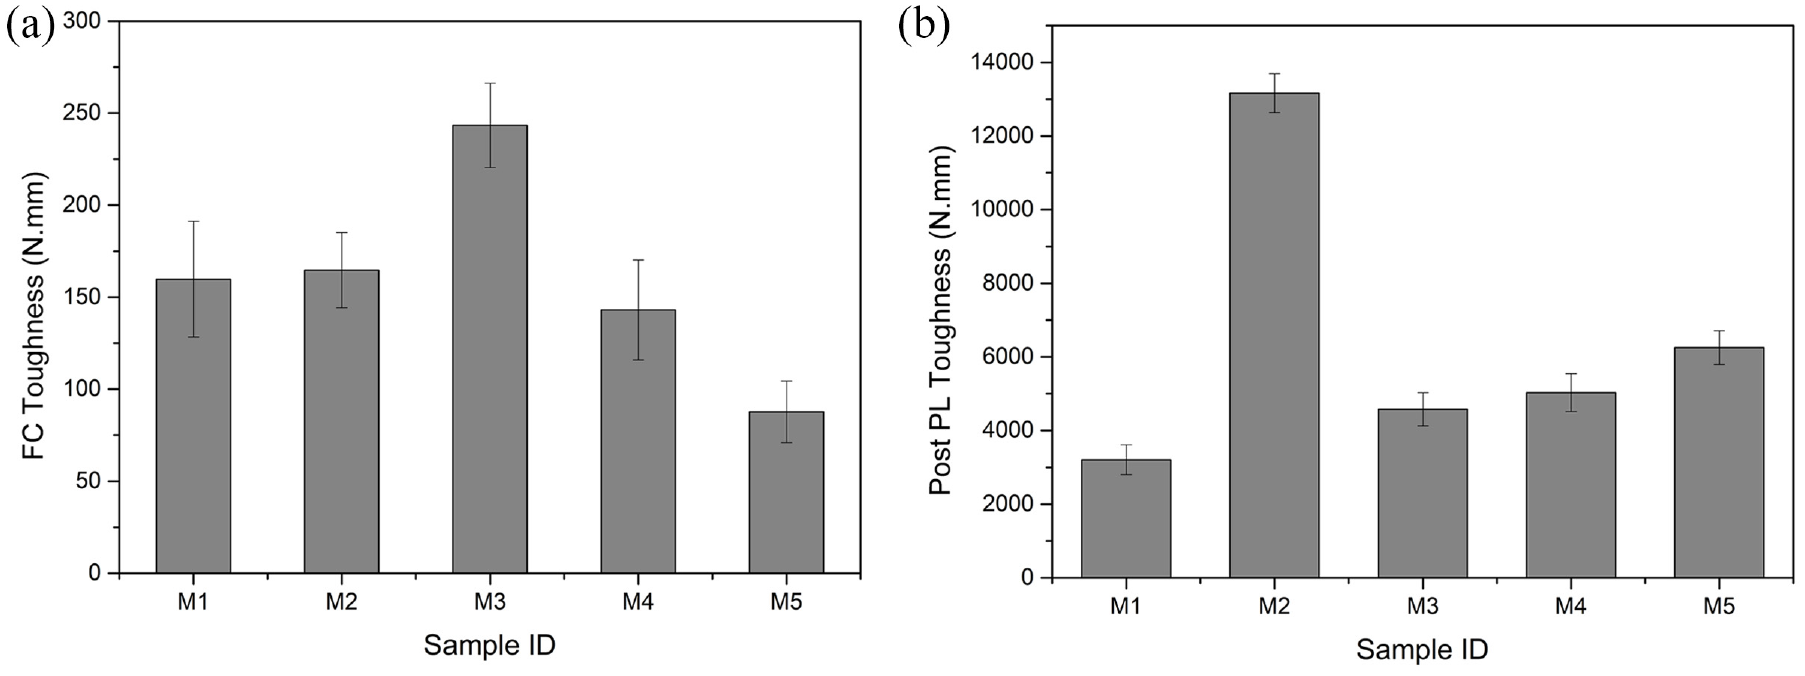
Toughness values: (a) first-crack (FC) toughness; (b) post peak-load (PL) toughness.
Flexural strength tests were carried out to analyze the mechanical properties of the prepared cementitious composites using the mold dimensions of 40 mm × 40 mm × 160 mm. The samples were tested according to the American Society for Testing and Materials (ASTM) C78 under three-point bending on MTS with 100 KN load cell capacity under the displacement rate of 0.5 mm/min. The span length of 120 mm was used in the experimental program. A total of three samples for each mix were tested for the flexural strength.
The mixing process for the tensile test was followed similarly to flexural samples. Instead, the fresh cementitious mix was poured into tensile dog-bone molds; mold specifications according to the Japanese JSCE24 (Japan Society of Civil Engineers) standard 28 are shown in Figure 2(b) of the supporting information. The samples were water cured for 7 days at room temperature. The samples were taken out from the water tank a day before testing on the MTS (642.10B) with a displacement rate of 0.5 mm/min. A total of three samples for each mix were tested for the tensile strength.
Results and Discussion
The rheology test results are summarized in Table 1. The addition of VMA showns considerable improvement in the flow time compared to the control mix. The Marsh cone flow values for the mixes show values between 11 and 27 s. The difference in the flow time can be attributed to the improved plastic viscosity, indirectly inferred from the Marsh cone flow, of the cementitious mix. The optimal dosage of VMA resulted in plastic viscosity sufficient to provide an improved cohesive mix. The composite performance is also improved within a certain range, as discussed below for flexural and tensile tests. The results imply that the dosage of the M2 mix is optimum for the given cementitious mix to achieve a favorable flow time to get better fiber distribution, as also demonstrated by Li and Victor. 20 Outside the suggested range, the increasing amount of VMA affected the fluidity of the mix, which also decreased the flow time. Moreover, the effects of adding VMA in the matrix recipe are visible from the mini-slump diameter test results for all the mixes. The control mix has a diameter of 38 cm, whereas the increasing amount of VMA generally resulted in reduced slump flow values.
The resulting load–displacement curves for all mixes are shown in Figure 3 of the supporting information. On the occurrence of the first crack, all of the mixes have deflection-hardening effects. Initially, the matrix resisted the load as indicated by the elastic region. Once the first crack was formed, the load was transmitted to the fibers to initiate the fiber crack-bridging action. The fibers could resist the load and distribute the applied load by forming multiple tiny cracks, instead of the concentrated load at one point which would otherwise have resulted in a localized single crack. The failure shape of the flexural specimens is shown in Figure 4 of the supporting information.
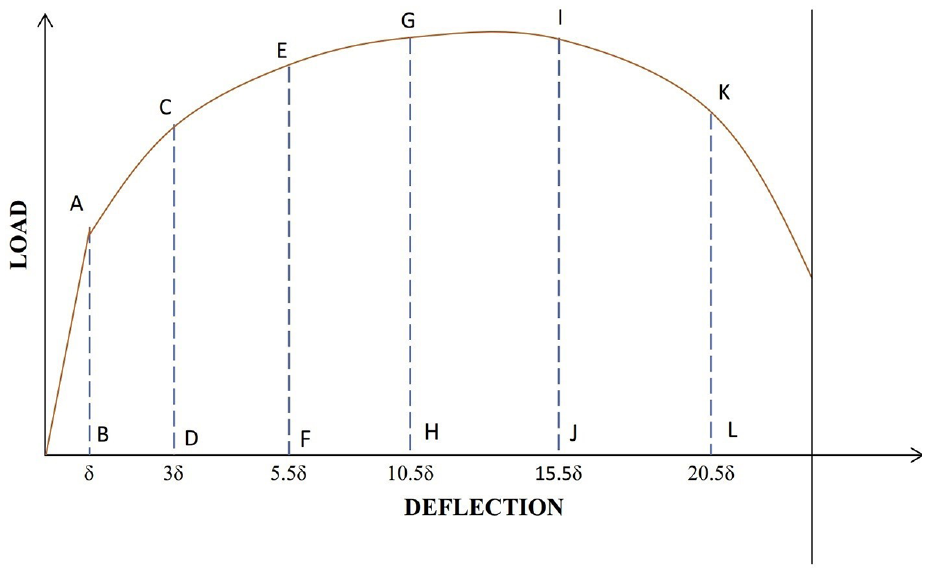
Graphical representation of ASTM toughness indices. 29
Toughness indices according to the ASTM standard.
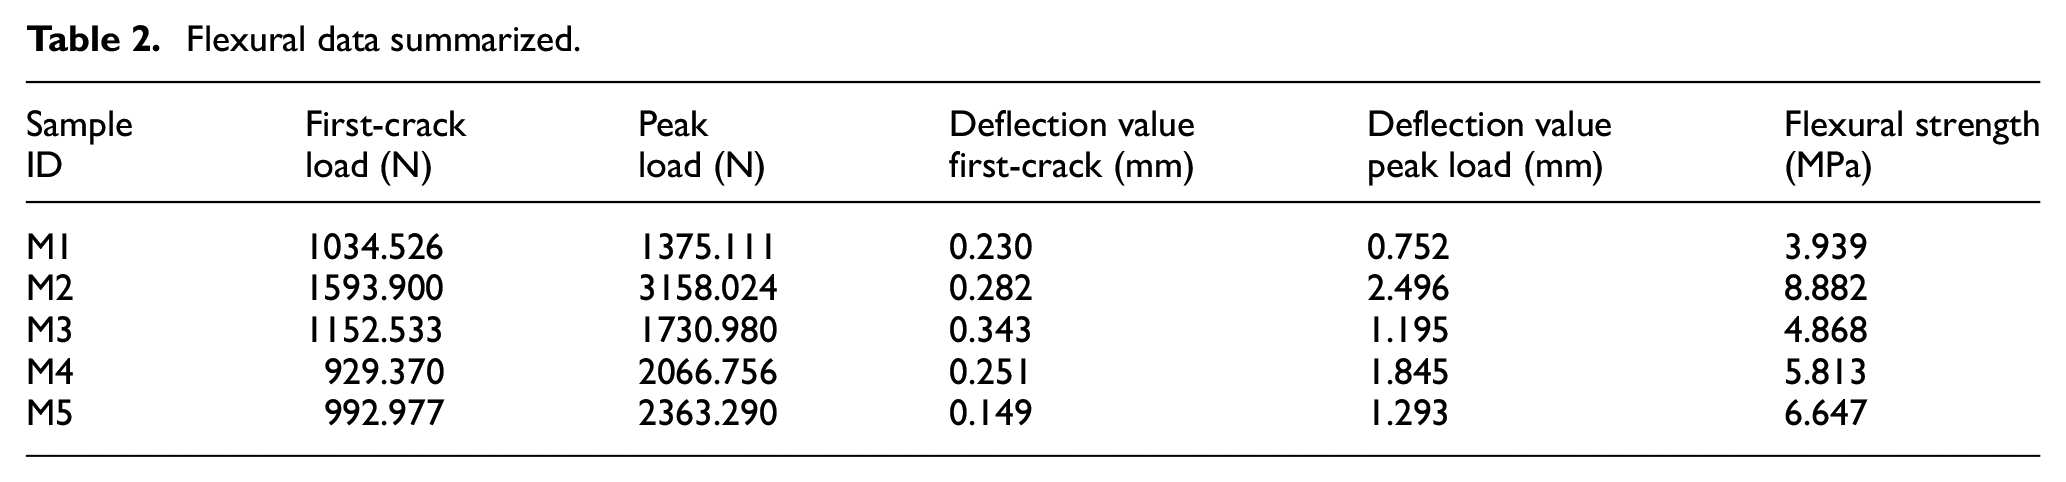
The first-crack load, peak load, and the corresponding first-crack deflection and peak-load deflection values are shown in Figure 1(a) and (b), respectively. Flexural stress was calculated using equation (1) based on the ASTM C1609 30 from the load–deflection curve obtained in the three-point bending test. The values shown are an average of three specimens for each mix. The first-crack value was taken as the point on the load–deflection curve on which the first non-linearity occurs after the elastic stage. Although the first-crack deflection values are nearly similar for all the mixes as summarized in Table 2, the first-cracking strength behavior of M2 is entirely different than the others. M2 shows 50% more first-crack load strength, while the resultant values for all other mixes are more or less similar to those for the control M1 mix:
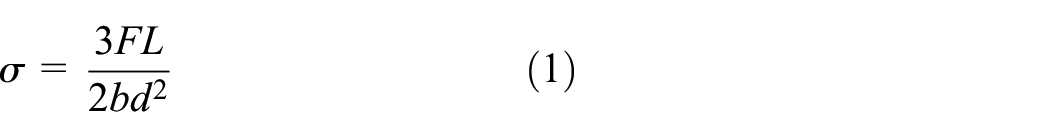
where F is the load (N); L is the span length (mm); b is the breadth of the specimen (mm); and d is the thickness of the specimen (mm).
Flexural data summarized.
In general, adding VMA shows improvement in the post-cracking behavior for all mixes. The peak-load values, also known as the modulus of rupture, are higher than those of the control mix. M2 shows a dramatic increase of more than 200% in the post-cracking load. However, the mixes M3–M5 show an increasing linear trend of peak load with the increasing content of VMA. The maximum among them achieved by M5 is still lower than that of the peak-load value of M2. It should be noted that a VMA content higher than M5 severely reduced the workability of the concrete mix in the fresh state; therefore, it was discarded from the present experimental program.
First-crack toughness values, shown in Figure 2(a), were calculated by the area under the load–displacement curves till the corresponding first-crack deflection values. The resultant values are almost similar for the mixes except for M3, which unexpectedly shows the highest first-crack toughness. However, the post-cracking toughness, as shown in Figure 2(b), follows the pattern of the peak-load values. The post-cracking toughness was calculated using the area under the curve until the load value reached half of the maximum load after the highest load point. The control mix (M1) shows the lowest post-cracking toughness values, while M2 has significantly increased post-cracking toughness. This behavior can be attributed to the flocculated structure for the control mix and mixes having higher than optimum VMA concentration, as was also demonstrated by Li et al. 19 As also demonstrated by Ghafoori and Diawara, 31 the flocculated mix is stickier, requiring more repulsive forces to properly disperse the constitutive materials and fiber reinforcements. And since the dispersion of the fibers could be affected by the flocculated mix, the composite toughness is also severely reduced.
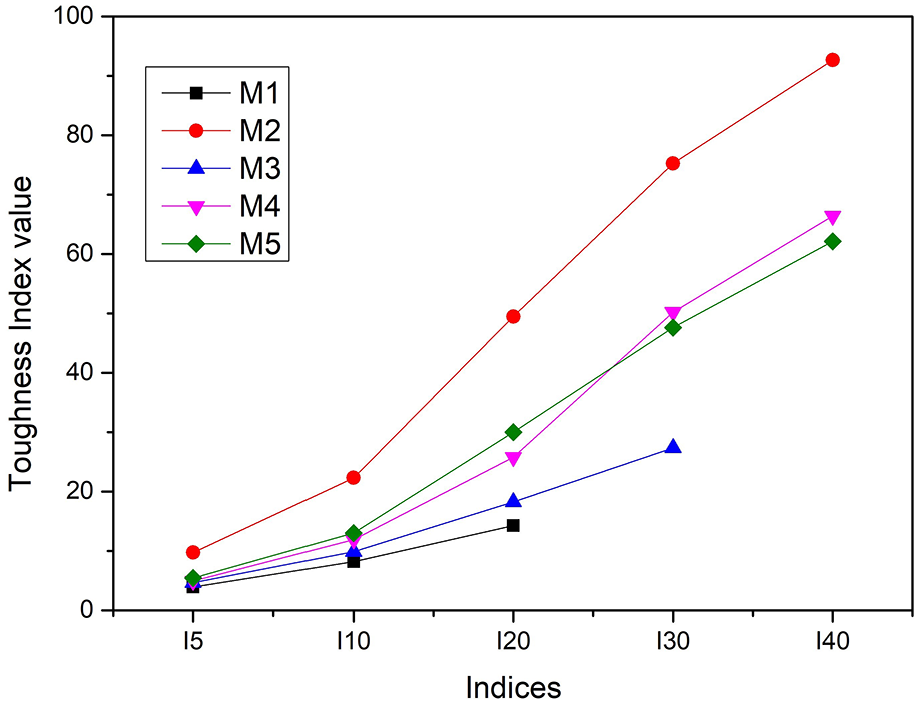
The toughness was studied using three different standards/methods. The toughness indices, were calculated according to the ASTM C1018 standard. 32 The toughness index is a ratio of the area up to a certain deflection value to the area of the first crack as shown in Figure 3. Naaman and Reinhardt 33 stated that a toughness index higher than I20 characterizes the material’s deflection-hardening property. In the present research work, the results shown in Figure 4, toughness indices I5, I10, I20, I30, and I40 represent the ratio of the area under the load–deflection curve for the corresponding values of 3, 5.5, 10.5, 15.5, and 20.5 times the respective first-crack deflection. The increase in toughness index values is more prominent at the high toughness index than the low toughness index. This behavior is likely because the fiber bridging action was not activated at lower index values. With the increment of the toughness index, the difference became more noticeable as the fibers started to resist the cracks. A toughness index as high as I40 has been observed for all of the specimens tested. Although mixes M2, M4, and M5 have a toughness index up to I40, the corresponding index value for M2 is higher than those of other mixes in all of the other calculated indices. This may be due to the optimum dosage of VMA in M2 which assisted the fibers in an improved distribution and better cohesion in M2 as compared with other mixes. Although only the mechanical properties are studied in this study, the addition of VMA directly influences the yield stress. The effect of yield stress on the fiber distribution and orientation within the cement mix was studied by Boulekbache et al. 34 Boulekbache et al. concluded that the concrete with high yield stress resulted in lower ductility. In contrast, the low yield stress concrete showed improved ductility performance due to the better fiber distribution and alignment. Also, the optimum VMA dosage has been reported to improve fiber dispersion by increasing the plastic viscosity of the cement mix. 20 The increased plastic viscosity generates higher shear forces during mixing, resulting in improved fiber distribution.
Some literature has reported concerns regarding the reliability of the ASTM toughness index results due to the difficulty in locating the actual first-crack point.35–37 The variations in locating the first-crack point affect the ASTM toughness index results. Therefore, the toughness using the Japanese standard JSCE-SF4 38 has also been calculated in the present research work. The results are shown in Figure 5. The toughness expressed by the flexural toughness factor in JSCE was calculated by:
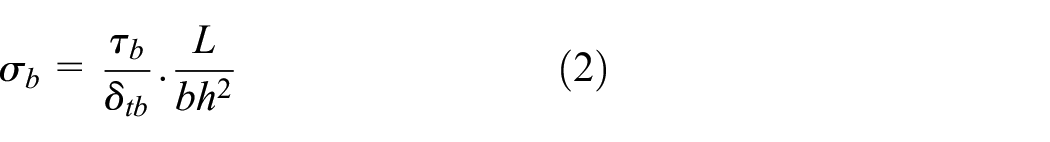
where δtb is the deflection of 1/150 of the span; L is the span length; τb is the flexural toughness up to the deflection of δtb; b is the beam width; and h is the beam height.
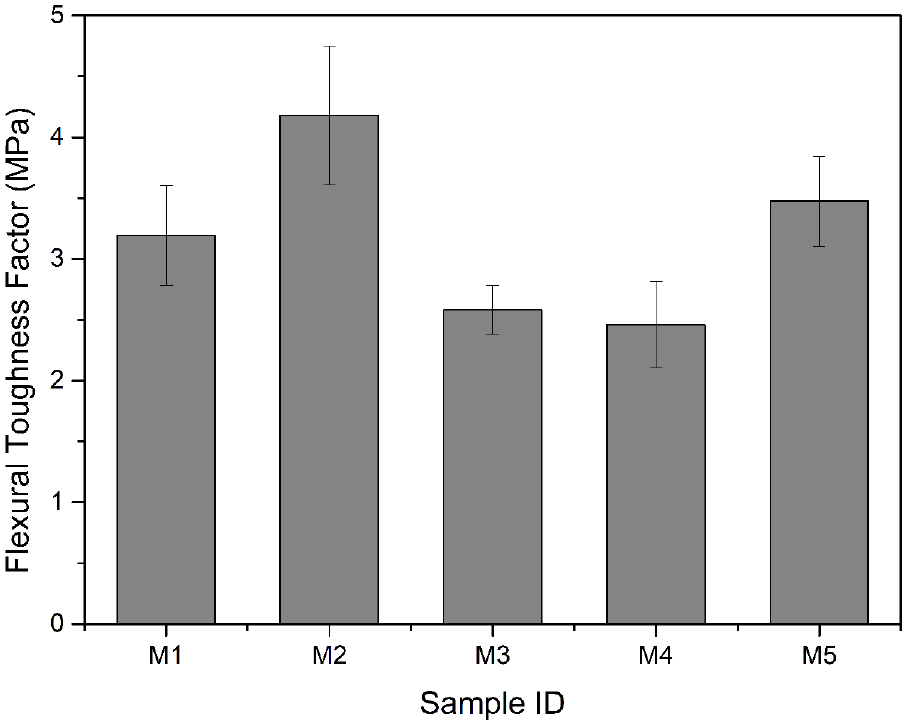
Flexural toughness factor according to the JSCE standard.
The flexural toughness factor, to some extent, replicates the residual material strength up to the δtb. The M2 mix has shown the highest flexural toughness factor of 4.3 MPa. The mixes M3–M5 have shown almost the same trend as was seen in Figure 2. This may be due to the JSCE calculations, which rely, among other factors, on the total toughness, which in the case of FRC, has a significant part of post-cracking behavior.
Recently, a new method was proposed by Banthia and Trottier 39 for characterizing flexural toughness from load–displacement curves. According to the authors, the proposed method provides insight into the material properties, useful for analysis/comparative assessment from a structural load–displacement curve. The technique involves dividing the curve into two regions, that is, pre-peak and post-peak.
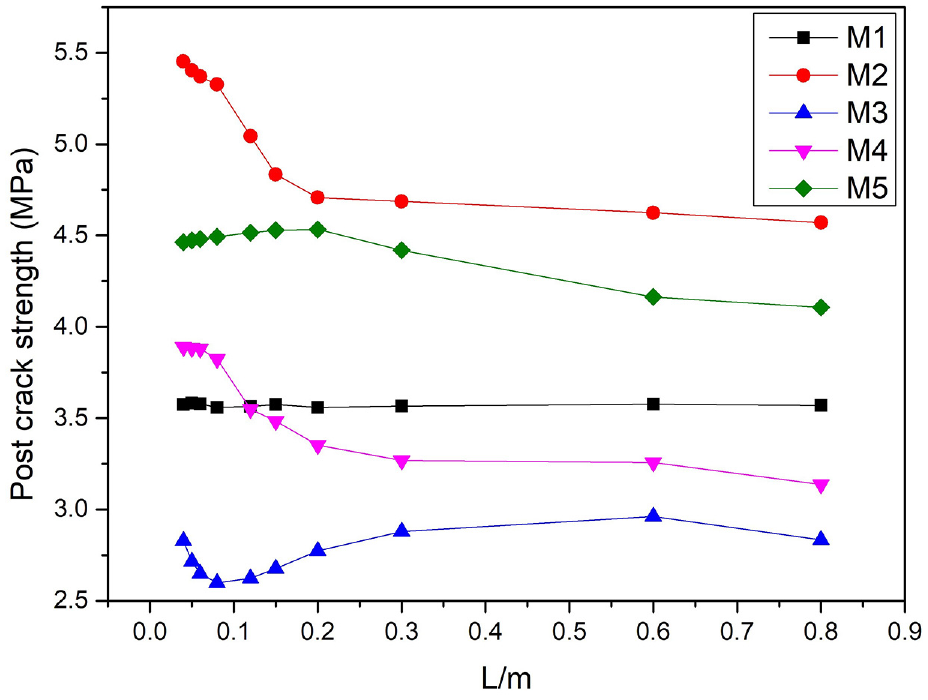
The division point is the point of the maximum load in the load–displacement curve, which omits the error of locating the point of the first crack. The post-peak energy is calculated by the difference of total energy Etotal,m, and pre-peak energy, where Etotal,m is the area under the curve up to the specified deflection of L/m, with L being the span-length and m ranging between 150 and 3000. The calculation steps are explained briefly in Banthia and Trottier. 39 In this study, the values of deflection points (L/m) were chosen as (0.04, 0.05, 0.06, 0.08, 0.12, 0.15, 0.2, 0.3, 0.6, and 0.8 mm). The post-crack strength (PCS) was calculated by:
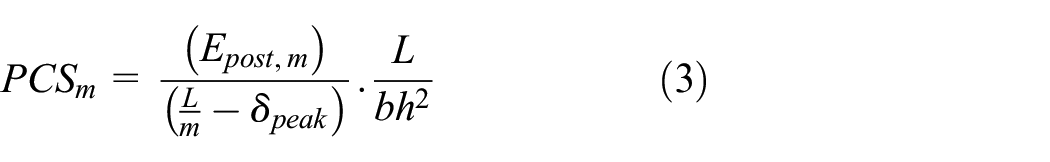
The results from the PCS method are shown in Figure 6. The control mix shows a (post-crack strength measurement) PCM value of around 3.5 MPa. With the addition of VMA in M2, the curve has demonstrated an increase of nearly 1.58% in the PCM value. However, the further increase in the admixture content shows a decreasing trend compared to M2. Although mix M4 initially showed a higher PCM value than M1, with the increasing deflection (L/m), the resultant values were lowered. Such behavior, however, was not identified in the JSCE method. The response generated by the JSCE method was more general; yet it did not correctly depict the initial and final behavior as in the case mentioned here between M1 and M4.
Post-crack strength according to the PCS method.
Based on the flexural test results, the ratio of M2 for VMA was selected to test the tensile properties, and the results were compared with the control specimen prepared without VMA. The tensile test results are shown in Figure 5 of the supporting information. The addition of VMA showed better tensile strength and toughness properties. The percentage increase was recorded as 45% and 60% for tensile first-cracking strength (σfc) and peak-strength values (σ0), respectively. The improved performance can be attributed to the improved fiber distribution and cohesiveness compared to the control specimens. The VMA quantity mentioned in mix M2 is suitable for improved performance for the given matrix mix ratio.
Statistical Analysis
Statistical analysis comprising analysis of variance (ANOVA) is utilized to investigate the effects of matrix modification on the flexural properties of the cementitious composite. ANOVA is a valuable technique to statistically analyze the effects of independent variables on the dependent variables of the final product. The analysis involves determining the F0 value from the experimental results and comparing it with the Fcritical value associated with a significance level (0.05 in this study), number of groups and observations, degree of freedom (df), mean squares (MSs), and the sum of squares (SSs). The ANOVA results for the first-crack flexural stress and peak-load flexural stress are shown in Table 2 of supporting information and Table 3. The calculated values of F0 for both stresses are more significant than the corresponding F0.05,4,10 values under a 95% confidence level. The result implies that adding VMA has a statistically significant effect on the mechanical strength of the cementitious composite. Besides, the lower p-values than pcritical for both first-cracking stress and peak-load stress reject the null hypothesis and demonstrate the significance of matrix modification. The null hypothesis (H0) for (k) number of groups with group mean value (µ) is shown mathematically in equation (4) as follows:

ANOVA table for peak-load flexural stress.
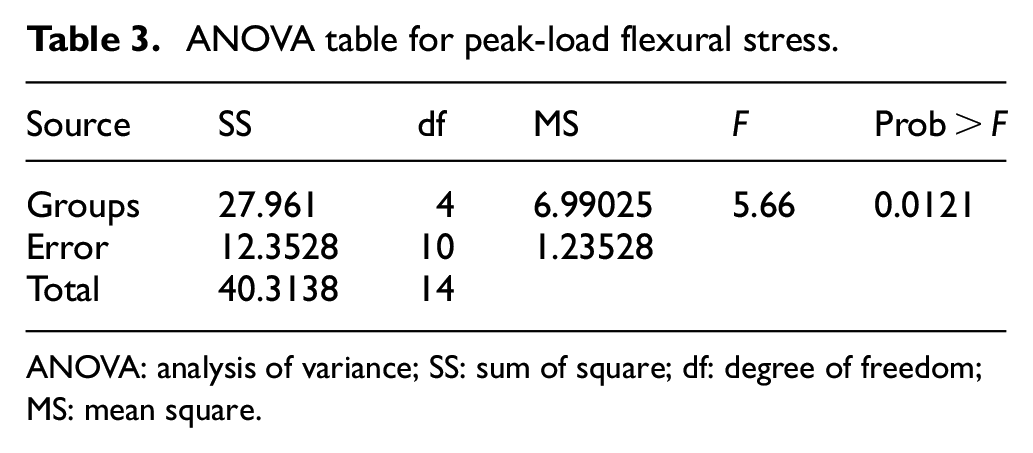
ANOVA: analysis of variance; SS: sum of square; df: degree of freedom; MS: mean square.
To further analyze the prepared samples, a post hoc statistical approach of the Tukey–Kramer honestly significant difference (HSD) is applied to the present studies; the results are shown in Figure 7. ANOVA results demonstrated that the null hypothesis is rejected; however, the results do not illustrate which group has a significant effect on the mechanical properties of the cementitious composite. The Tukey–Kramer HSD statistical tool provides a pairwise group comparison of all the samples for detailed evaluation. The results show a significant difference in the matrix tailoring of M2 mix samples compared to the M1 samples in terms of enhancing both first-cracking stress and peak-load stress in a flexural strength test. Varying the amount to a higher percentage than M2 does not illustrate any statistical difference in the mechanical properties of the cementitious composite.
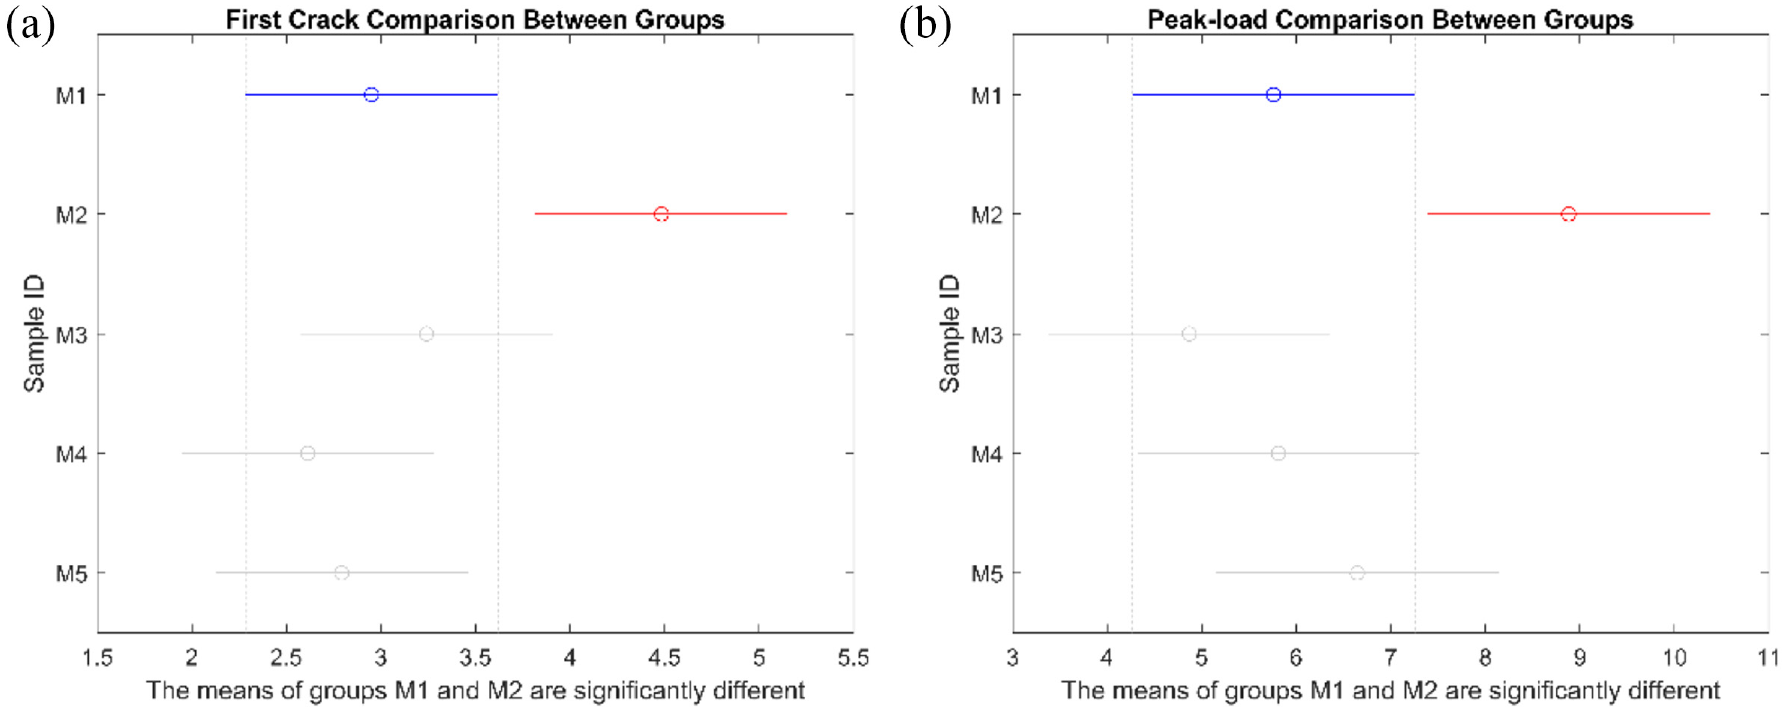
Tukey–Kramer HSD analysis: (a) first-cracking stress group comparison; (b) peak-load stress group comparison.
Conclusion
In this study, the local ingredients were utilized to identify the optimum quantity of VMA and study the effects of the varying percentage of VMA on flexural toughness. The following conclusions can be drawn from this study:
The addition of VMA directly influences fiber dispersion and orientation due to improved shear stress observed indirectly from the comparative analysis of the post-cracking behavior of the control mix and mix containing the different percentages of VMA.
The addition of VMA did not significantly affect the flexural first-cracking strength. However, different VMA ratios with the same cement ingredients have shown substantially varying post-cracking behavior.
Cement mix M2 has proven effective in achieving the deflection-hardening property with a significant post-peak strength of 9 MPa on average. The low shear deformation-resistant behavior of M2 provided considerable performance improvement compared with high or no-dosage mixes.
The ASTM flexural toughness analysis resulted in the highest toughness index value for the M2 mix of around 100 for I40. The JSCE method displayed a flexural toughness factor value of 4.1. The response of JSCE behavior is more general than that of PCM, which has differentiated initial and final behavior, as in the case of M1 and M4, for flexural toughness. Nonetheless, the overall toughness behavior, as analyzed by JSCE, at least in this study, is still valuable in identifying the VMA optimum percentage.
The addition of VMA showed an improved tensile behavior with a percentage increase of 45% and 60% for first-cracking strength (σfc) and peak-strength values (σ0), respectively, to the control mix.
For the given matrix mix ratio, the VMA quantity mentioned in mix M2 is suitable for improved flexural and tensile performance.
The statistical analysis allowed the evaluation of each cementitious mix on flexural properties and determined the most significant mix ratio. The results showed that the matrix tailoring of M2 is the most effective mix ratio in improving the overall performance of the composite.
Supplemental Material
sj-docx-1-aat-10.1177_24723444221147982 – Supplemental material for Matrix Tailoring for Polyvinyl Alcohol (PVA) Fiber-Reinforced Ductile Cementitious Composites
Supplemental material, sj-docx-1-aat-10.1177_24723444221147982 for Matrix Tailoring for Polyvinyl Alcohol (PVA) Fiber-Reinforced Ductile Cementitious Composites by Muhammad Fahad Arain, Hafeezullah Memon, Mingxue Wang, Arsalan Ahmed, Jianyong Chen and Huapeng Zhang in AATCC Journal of Research
Footnotes
Declaration of conflicting interests
The author(s) declared no potential conflicts of interest with respect to the research, authorship, and/or publication of this article.
Funding
This study was supported by National Natural Science Foundation of China (Project No. 21706238).
Supplemental material
Supplemental material for this article is available online.
References
Supplementary Material
Please find the following supplemental material available below.
For Open Access articles published under a Creative Commons License, all supplemental material carries the same license as the article it is associated with.
For non-Open Access articles published, all supplemental material carries a non-exclusive license, and permission requests for re-use of supplemental material or any part of supplemental material shall be sent directly to the copyright owner as specified in the copyright notice associated with the article.