
Abstract
This study aimed to investigate the heat transfer around the infant surface in the indoor environment based on computational fluid dynamics analysis. A three-dimensional numerical model containing a virtual infant manikin was developed in COMSOL software. The high-quality geometry model of the infant was obtained using three-dimensional body scanning technology. Governing fluid flow and energy equations were solved along with the low Re k–ε turbulence model. Real-scale measurements were carried out to determine the accuracy of the developed numerical model. Good agreement was found between the simulation results and the experimental data. The results showed that, at room temperature of 21oC, the convective heat transfer coefficient was 64.2% greater than the radiative heat transfer coefficient, which demonstrated that the convective heat transfer was the main approach for heat exchange between the infant and its surrounding environment. Moreover, the largest convective heat transfer coefficients were observed at the forearm and calf, indicating the importance of the additional thermal protection at these regions. The findings will be beneficial to provide some instructions on infant thermal care for caregivers.
Keywords
Introduction
The indoor environment is regarded as an essential factor influencing the health and growth of infants. Due to the immaturity of the thermoregulation system, infants are susceptible to air temperature, airflow, and other environmental conditions. 1 Infants cannot actively regulate the surrounding environment and may suffer from hot or cold stress under improper thermal protection. 2 Therefore, it is vital to understand and quantify the thermal action between an infant and its surrounding environment for providing instructions on the thermal care of infants.
In the past, many physiological studies on the thermal reactions of infants have been carried out. Core body and skin temperatures, transepidermal water loss, metabolic production, and microenvironmental temperatures in the infant’s bedding were detected to determine their thermal states under varied environmental conditions (e.g. ambient temperature, air velocity, and humidity).3–7 The impact of diverse insulation conditions, such as naked or dressed, clothing layers, and mattress types, were also evaluated.2,8 A mismatch between thermal environment and insulation has been reported as the main cause of overheating.9,10 Increased air temperature and excessive clothing insulation lead to high core temperature and heavy sweating. Based on infant physiological characteristics, Nelson et al. 11 developed a theoretical model of thermal balance and proposed thermoneutral temperature ranges for an infant in light and heavy dress. Furthermore, thermal manikins mimicking the shape of an infant have been constructed to investigate the heat transfer coefficients for convection, radiation, and conduction.12–15 The impacts of bedding type and body posture on the heat loss of infants have been investigated on manikins of different sizes.15,16 Besides, the evaporative heat transfer can be evaluated on a sweating thermal manikin, which is impossible to perform on neonates for ethical reasons. 17
Despite the advancements made, these two traditional methods have some shortcomings because the physiological experiments have the possibility of hypothermia or hyperthermia, and the development of an infant manikin was difficult and expensive. In recent years, CFD simulation has provided a safe and economical method to solve the heat exchange around the infant. 18 It can visualize the temperature and airflow distribution around the human body three-dimensionally (3D), which will help evaluate infant thermal comfort.
Several CFD models have been established to investigate the heat transfer process at the infant surface. These studies often adopted a simplified infant physical shape, represented by geometric primitives.19,20 For example, Fic and colleagues21,22 applied a half-cylinder with a radius of 0.0573 m and a length of 40 cm to simulate a real neonate. In Zhu et al.’s 19 study, the infant’s head was simplified as spheres. Although these simplified geometries reduced the computational memory, a noticeable difference in regional skin temperature was observed, indicating the simulation results had low accuracy.
With the enhancement of computer-aided design technology, several studies have employed digitized two-dimensional (2D) images and 3D modeling (i.e. CATIA and 3D MAX software) to develop the more accurate geometry of an infant.23–26 However, the model accuracy remained an issue for 2D imaging, and the process of 3D modeling was challenging. Alternative solutions that have high efficiency and accuracy need to be explored. Recently, 3D body scanning technology and reverse engineering software have provided an available method for establishing the geometry of an infant rapidly and accurately. The spatial coordinate data points of the human body can be captured using a 3D body scanner. A high-quality 3D model of the human body can be obtained after data post-processing in the reverse engineering software for further simulation. 27 This greatly improves the efficiency of reconstructing the physical experiment in CFD software. Over the last few years, many scholars have investigated the heat transfer around the human body by scanning adult thermal manikins. The simulation results showed good agreement with the measurements in experiments.28–31
For the simulation, model validation with experimental data from accurate measurements is also essential. Due to the technical challenges and ethical restrictions, the tactile measurement of infant physiological parameters is still difficult. In Ginalski et al.’s 25 study, the model validation was performed by comparing the model results with the heat losses of infants measured by Elabbassi et al. 14 and Hammarlund et al. 7 Nevertheless, the comparison of the simulation results and the published data only provided limited validation due to the diversity in body shape and environmental conditions. Therefore, validation with experimental data from real scale measurements was necessary for simulation.
This study aimed to investigate the heat transfer around the infant surface in the indoor environment. A high-quality geometry of the infant was obtained using 3D body scanning technology, and the CFD program was fully validated with experimental data. The findings of this study will be beneficial to understanding the thermal action between infants and the environment and improve their thermal comfort.
Methodology
To investigate the heat transfer around an infant, an experiment aimed at providing boundary conditions and validation data for the modeling was first performed in a climate chamber. Second, a CFD numerical simulation of the physical experiment was conducted using COMSOL Multiphysics 5.6 (COMSOL, Inc., USA).
Measurements in the climate chamber
Infant thermal manikin
An infant thermal manikin (Thermetrics, Seattle, WA, USA) (height: 73 cm, surface area: 0.44 m2) with the shape of a 9-month-old infant was used in this experiment. A total of 19 independent body segments were contained, as shown in Figure 1. The manikin consisted of a carbon fiber-epoxy body form with surface painting, which had an emissivity of 0.95 similar to real human skin. Distributed heating wires and wire sensors at the manikin surface can accurately control and measure skin temperature.
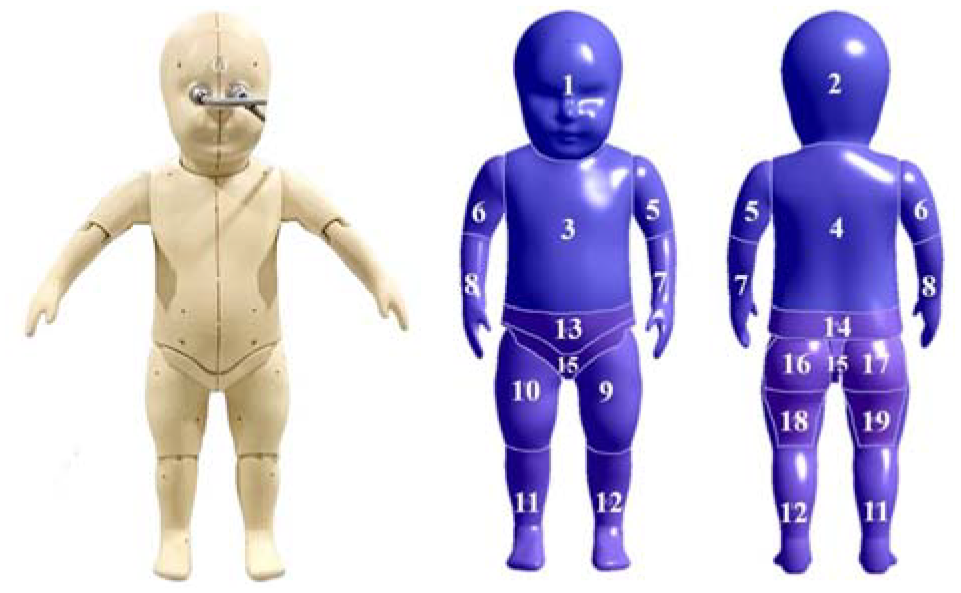
Infant thermal manikin and segment division.
Experimental protocol
The infant manikin was placed in the center of a climate chamber (W6×D5×H2.44 m) and lifted 49 cm above the floor (Figure 2). The ambient temperature and the relative humidity were set at 21 oC ± 0.5oC and 50% ± 10%, respectively. The air speeds at the airflow inlet and 54 sites at 9 locations in the chamber (Figure 3(a)) were measured using omnidirectional anemometers (Sensor Electronic, SensoAnemo5100LSF, accuracy: ±0.02 m/s ±1.5%). Each point was recorded during 5 min at 10-s intervals. Since the thermal microclimate near the human body plays a role in heat transfer, 32 the temperature distribution in the proximity of the manikin surface was detected using a set of seven thermocouples (Omega, 5TC-TT-K-36-72, diameter: 0.13 mm, calibration accuracy: ±0.02oC). These thermocouples were distributed within 16 cm from the head, abdomen, frontal thigh, upper arm, and back of the manikin, as shown in Figure 3(b). For the first thermocouple in the rows, the temperature measurement point was located using marking tapes to reduce misalignment. The temperature sensor at the top was adjusted to fit snugly on the manikin, and the recording started when the observed temperature approached 34oC. A total of 35 points were retained for the temperature measurement. Each point was recorded for 20 min at 20 s intervals.
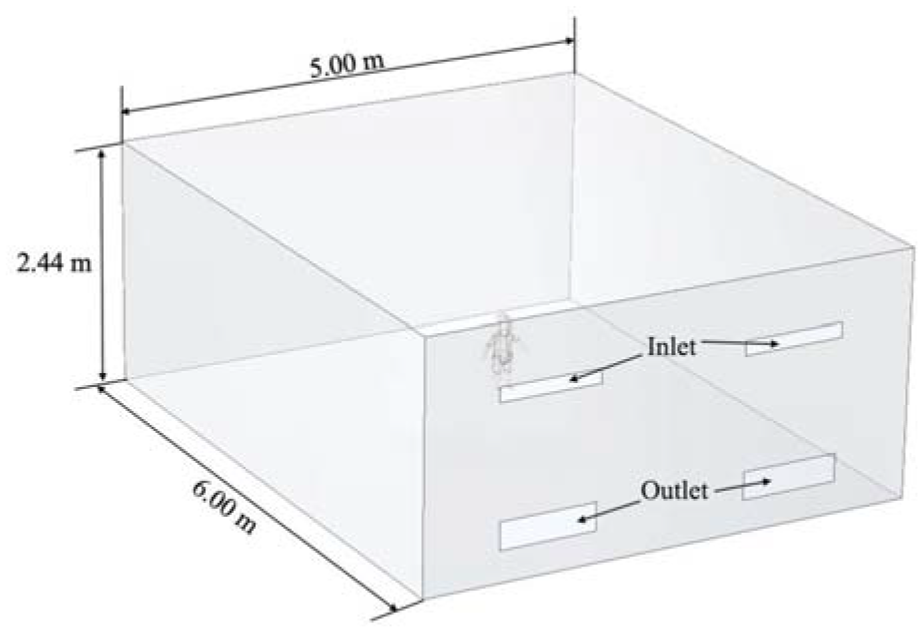
Diagram of climate chamber.
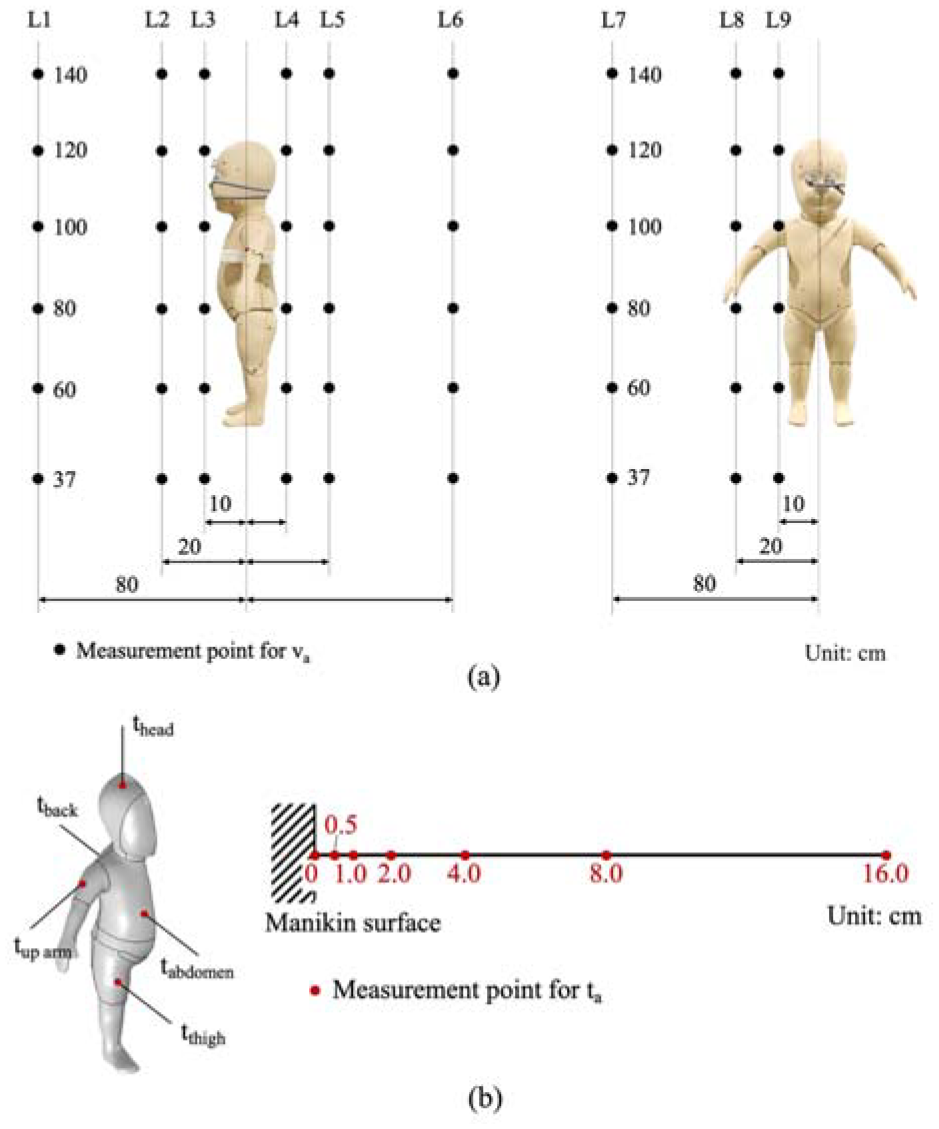
Measurement points for model validation in the experiments: (a) air speed and (b) air temperature.
In the experiment, the manikin surface temperature was kept uniform at 34oC ± 0.1oC. The heat flux generated to maintain the surface temperature was considered equivalent to heat loss from the infant body. It was monitored every 30 s during the 20 min by ThermDAC8® Control Software. The measured air speed at the airflow inlet was applied as the boundary conditions of the inlet in the simulation. The averages and the standard deviations (SD) of the air temperature, air speed, and heat fluxes at the manikin surface were calculated to compare with the simulation results for the model validation.
CFD simulations of physical experiments
3D scanning and data post-processing
A hand-held 3D laser scanner (Handycan700, resolution: 0.050 mm, accuracy: 0.030 mm) was used to capture the 3D data of the infant manikin surface. This data obtained from the scanning was imported into Geomagic Studio software to refine the 3D geometry of the infant manikin. The data process is shown in Figure 4, including detecting and editing contours, constructing patches, and constructing grids. Finally, the NUBRS (Non-Uniform Rational B-Splines) surface of the infant manikin was formed. The processed 3D scanning data were saved as an STP file for the preparation of the simulation.
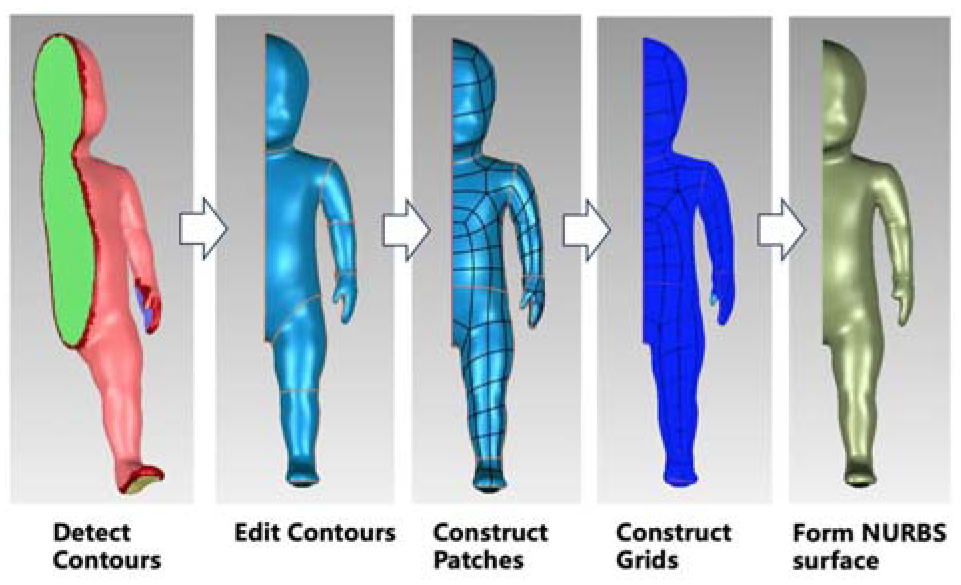
Post-processing for the geometry.
Geometry model and mesh generation
Geometry models of the chamber and the infant manikin were established in COMSOL software. For reducing the computational cost, only half of the models were involved in the simulation, as shown in Figure 5(a).
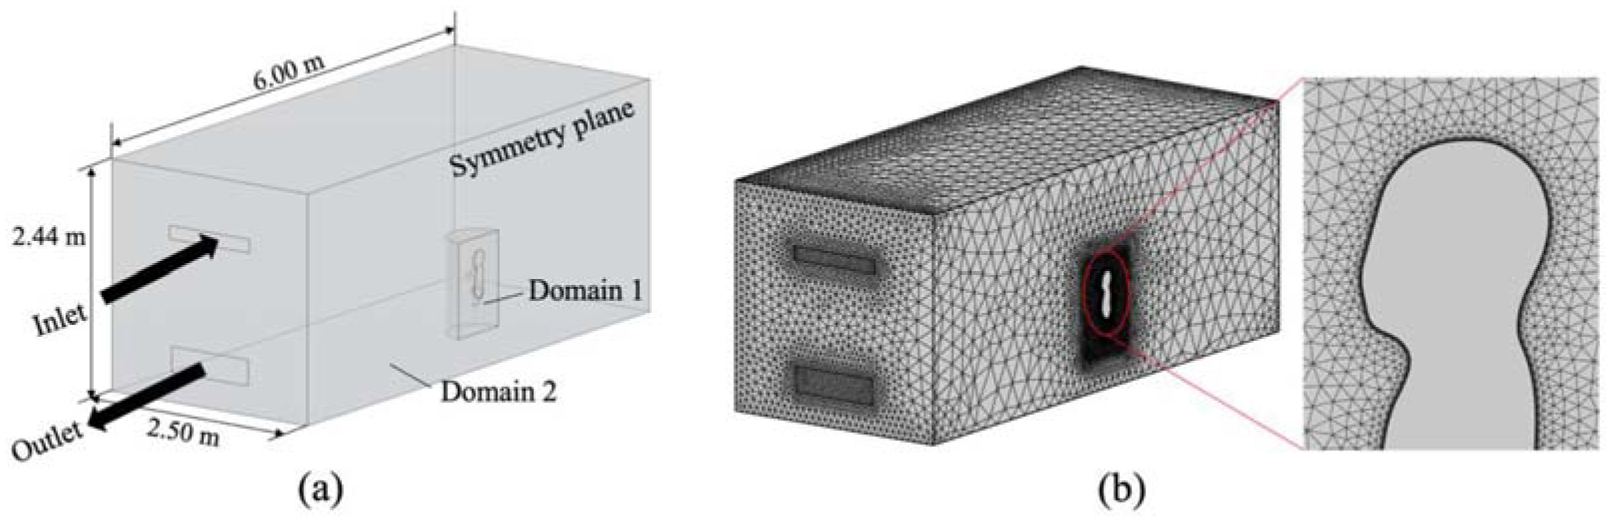
Geometry models and mesh generation: (a) half of the models and (b) mesh generated in the chamber.
The virtual chamber had a size of 6.00 × 2.50 × 2.44 m3, which was consistent with half of the artificial climate chamber. It contained one airflow inlet and one outlet on the same wall. The 3D infant model created by Geomagic software was imported, and the location of the virtual infant manikin was the same as the experiment.
The computational domain was divided into two parts: the semi-cylinder around the virtual manikin (Domain 1) and the remaining part of the domain (Domain 2). For simulating the airflow around complicated geometries, unstructured grids are more flexible in mesh distribution and often used. Therefore, the triangular surface meshes were generated on the manikin surface, and the tetrahedral domain mesh was used to mesh two domains. To improve the simulation precision, the mesh generated in Domain 1, where the air velocity and temperature near the manikin changed dramatically, was denser than that in Domain 2 (Figure 5(b)). Five layers of prism mesh with an initial thickness of 0.5 mm and a growth rate of 1.2 were created around the manikin surface to make the value of y+ near to and even lower than 1 (Figure 6).
Distribution of y+ for the manikin.
Governing equations and boundary conditions
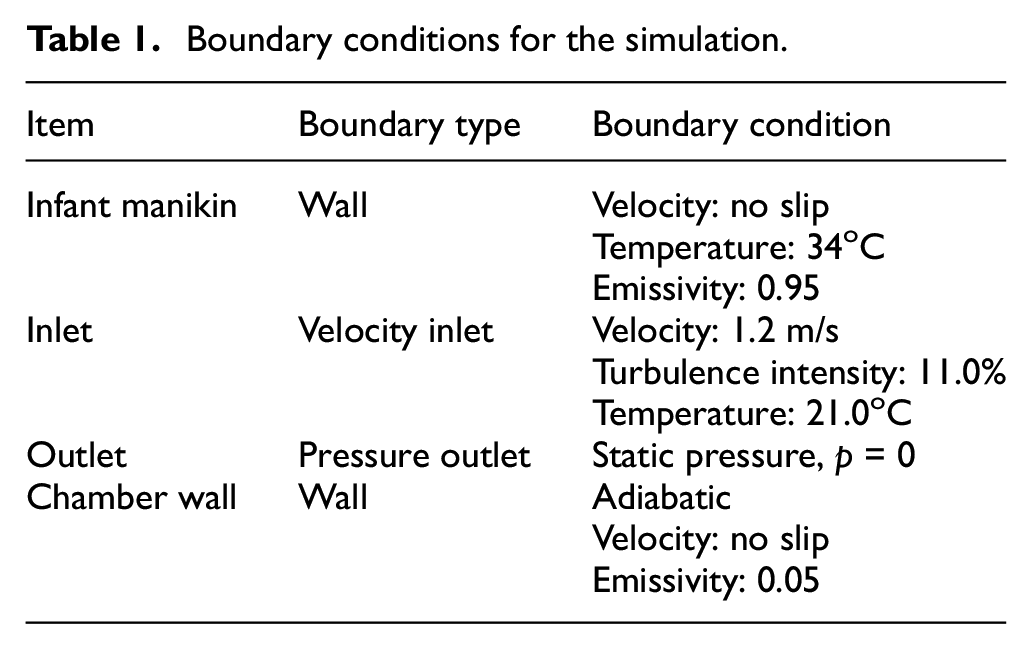
The airflow and temperature field were calculated by the three-dimensional and steady-state Reynolds averaged Navier-Stokes (RANS) equations, combined with continuity and energy equations. To solve these nonlinear equations, a proper turbulence model should be employed to reflect the turbulence characteristics. The standard k–ε, low Re k-ε, and shear stress transfer (SST) k–ω turbulence models were widely used to solve the indoor airflow field.28,29,33 The low Re k–ε and SST k–ω models have advantages in solving the airflow near the wall with good accuracy utilizing dense mesh, whereas the standard k-ε model employs a wall function to deal with the area near the wall and has high computational efficiency and good robustness. In this study, these three turbulence models were respectively applied for calculation, and the simulation results were compared with measurements of physical experiments. The model with higher precision and lower computational costs was selected for further analysis. The surface-to-surface (S2S) radiation model was used to compute the radiative heat transfer between the manikin surfaces and the chamber walls. The boundary conditions are depicted in Table 1.
Boundary conditions for the simulation.
Mesh independent study
Five different numbers of mesh were created for the mesh independent study. They were created by reducing the maximum mesh size of the triangular surface mesh on the infant model surface and the tetrahedral domain mesh around the infant. The mesh number mainly influences convective heat flux, but it has few impacts on radiative heat flux. Figure 7 illustrates the variation of convective heat flux of the infant manikin with the mesh number as well as the corresponding computational time. When the mesh got denser, the change of convective heat flux gradually became stable, and ultimately, the heat flux was no longer affected by mesh number. The change rate of convective heat flux was only 0.19% as the mesh number increased from 0.683 million to 1.245 million. Considering that the computational time increased by 1.4 times, the mesh number of 0.683 million was chosen for simulations.
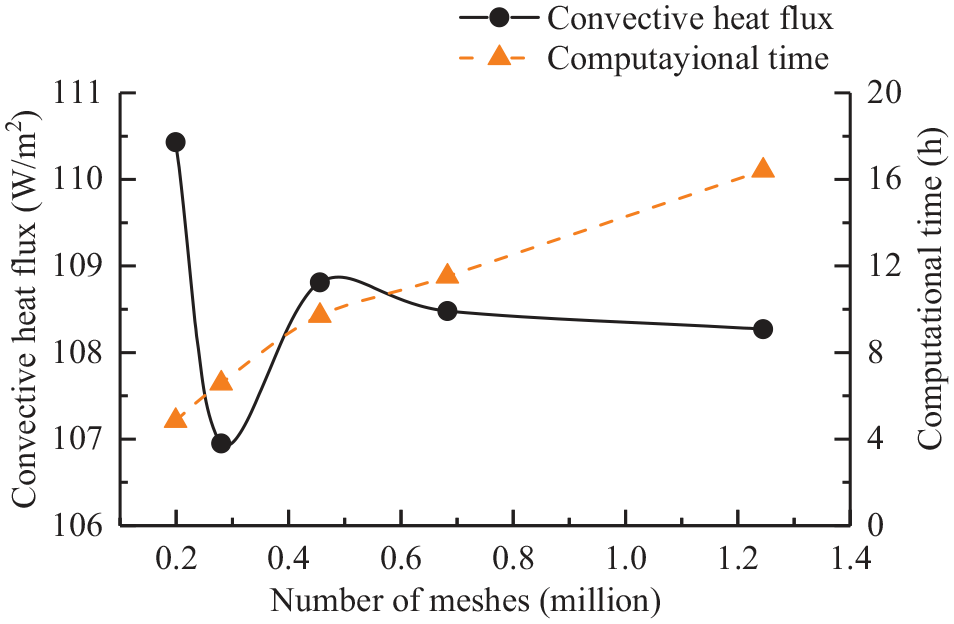
Mesh independent study for the simulation with low Re k–ε model.
Data analysis
The model was validated by comparing the simulation results and the measurements in the climate chamber. The root-mean-squared errors (RMSE) and the standard deviation (SD) of the heat flux at the infant surface, air temperature, and air speed were calculated and compared. The correlation analysis by Pearson was performed to check the consistency between the simulated and experimental results, and the significance level (p) was set at 0.05.
Results and discussion
Model validation
Heat flux
The heat flux at the manikin surface was an important indication for model validation because it directly characterizes the heat transfer process between the human body and the environment. The simulated heat flux was calculated by convective heat flux and radiative heat flux obtained from COMSOL software.
Figure 8 displays the simulated results of the whole and the individual segments as well as the experimental data. A significant correlation was found between simulated heat flux and experimental heat flux for all three turbulence models (p < 0.01). The correlation coefficients were 0.928, 0.941, and 0.973, respectively, for standard k–ε, low Re k–ε, and SST k–ω models. The results illustrate that the area-weighted average heat fluxes from the three simulations have good agreements with the experimental data.
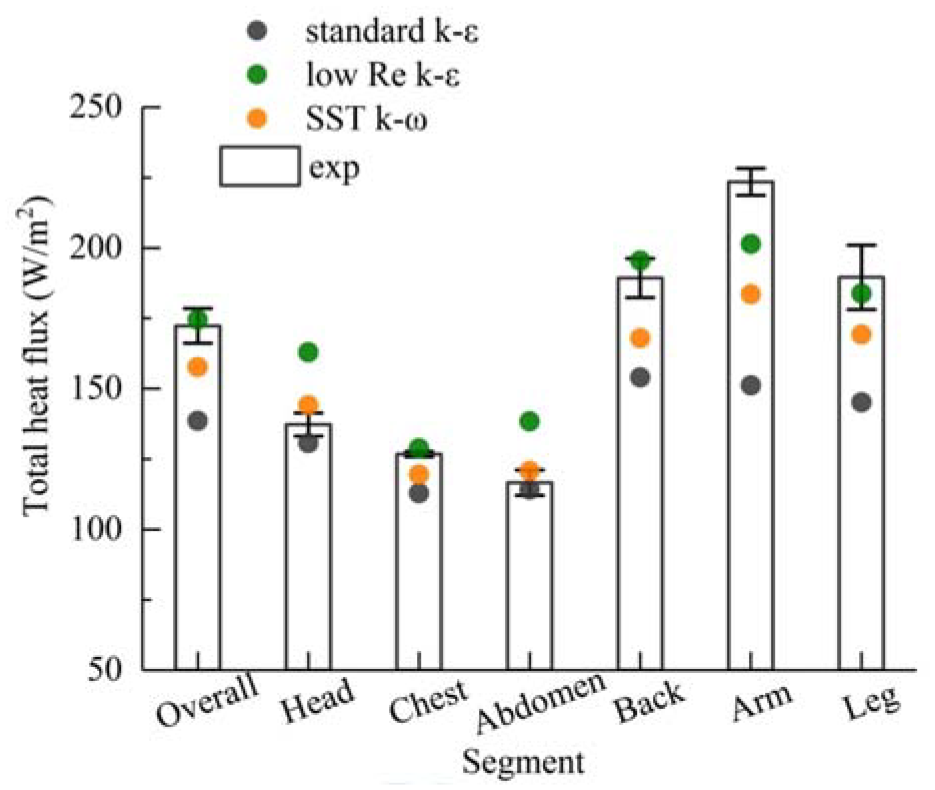
Measured and simulated heat flux of the infant manikin.
A detailed comparison showed that the average differences between simulated and measured results were smaller for the low Re k–ε (8.1%) and SST k–ω models (9.0%), compared with the standard k–ε model (15.9%). It confirmed that the standard k–ε model was not good at dealing with the heat transfer at the solid wall (manikin surface). In addition, a noticeable discrepancy between simulations and measurements was observed at the arms and legs, with average differences of 20.0% and 12.4%, respectively. This was mainly related to the differences in the shape of computational and real infant manikins. The upper and lower limbs of the real manikin were partitioned into the upper arm, forearm, thigh, and calf. Large gaps existed between two linked body sections, but they were eliminated in the computational manikin. These shape differences may change the airflow around the arm and leg, and thereby affect heat exchange.
Air velocity
Figure 9 presents the measured and simulated va in the vicinity of the infant manikin in three directions. The values of average SDs and RMSEs at all nine locations are also displayed in Table 2. The measured va ranged from 0.02 to 0.45 m/s. The value of va on the side of the manikin was larger than that on the front and rear due to the location of the airflow inlets. The RMSEs for the three models were close to and even lower than the SDs, and their discrepancies were within 0.07 m/s. Generally, the simulation results agreed well with the measurements. By comparison, low Re k–ε models displayed the best performance in predicting va around the manikin.
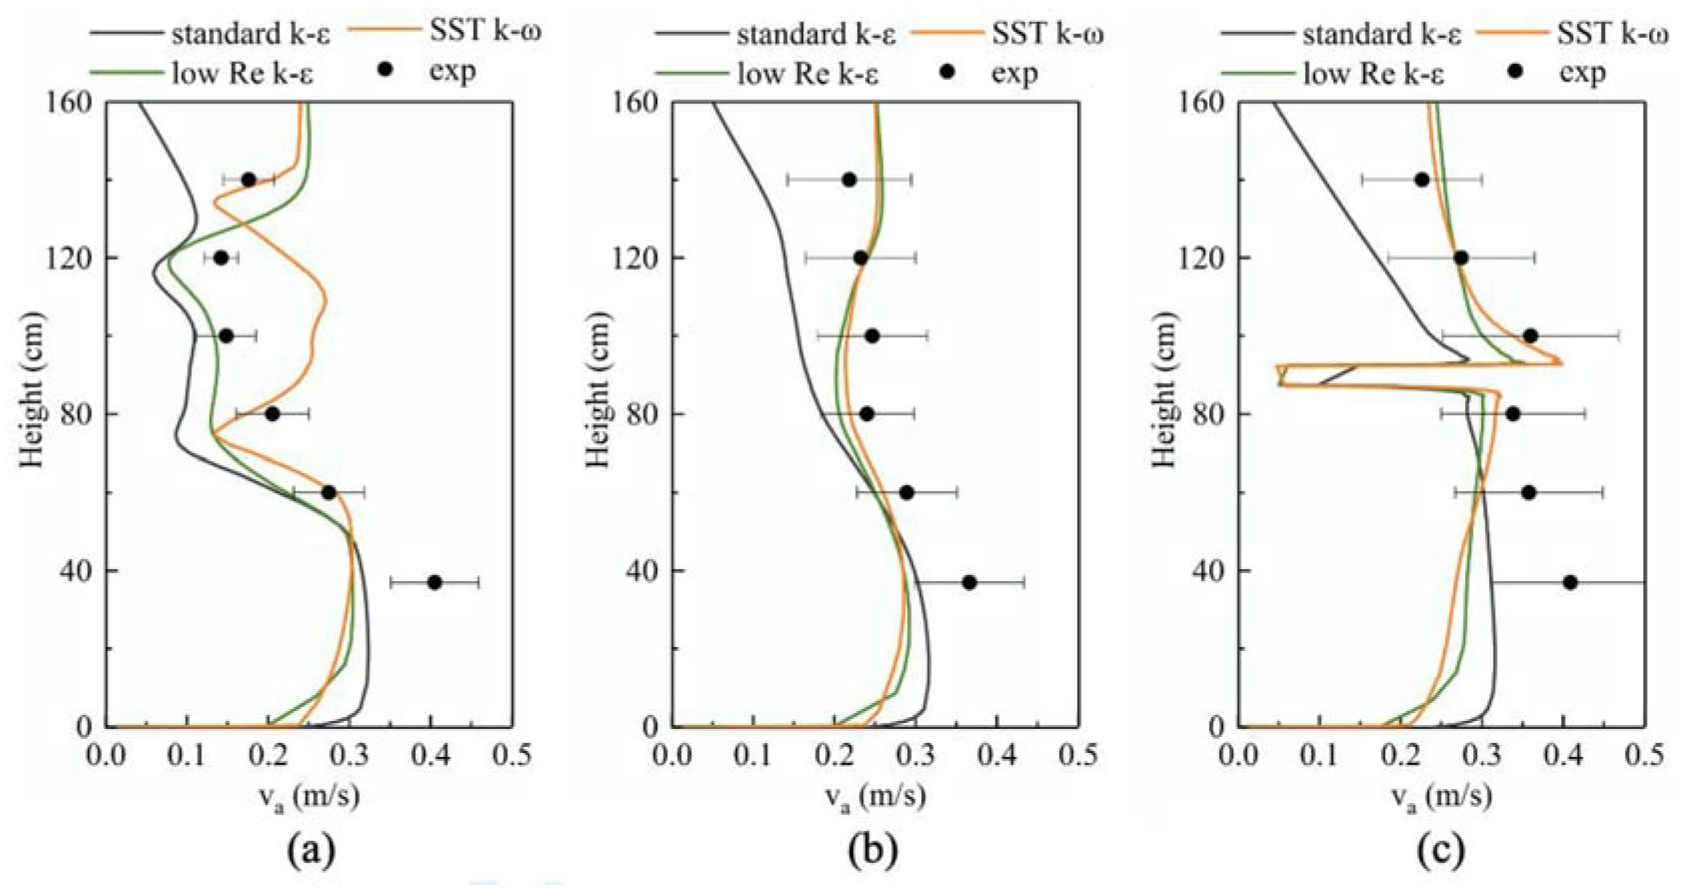
Measured and simulated air velocity. (a) L2, (b) L5, and (c) L8.
The SD of measured air velocity and the RMSE of simulated air velocity at nine locations.
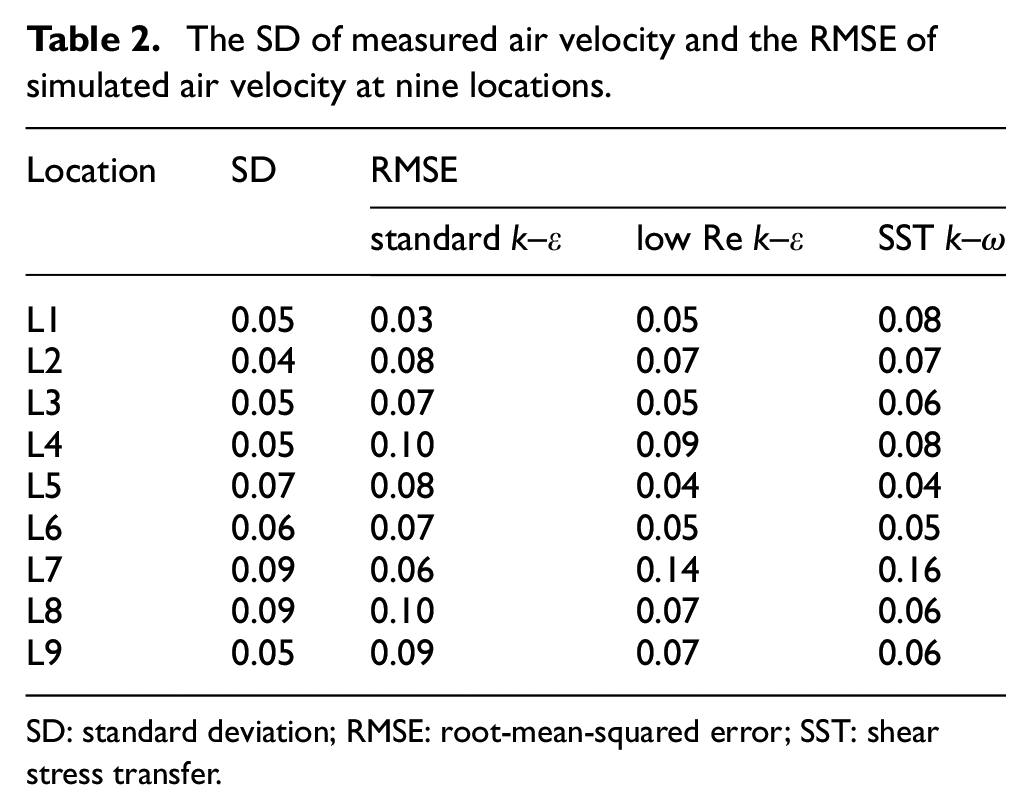
SD: standard deviation; RMSE: root-mean-squared error; SST: shear stress transfer.
Air temperature
The simulated and measured ta near the manikin surface in three directions as well as the average SDs and RMSEs for all locations are presented in Figure 10 and Table 3. Generally, the ta sharply decreased from 34oC to around 22oC within the distance of 2 cm from the manikin surface, and it finally stabilized at 21oC, which was the temperature supplied by inlets. The difference between SD and RMSE was in a range of 0.1–1.1oC. In particular, the measured ta within 1 cm was quite different from the simulation results from the three models. This can probably be attributed to the measurement error when using thermocouples. These thermocouples were fixed at the designated locations, but deviations might happen in the position of the temperature sensor, as shown in Figure 11. Since the ta near manikin surface dropped dramatically, even a position deviation of 1 mm might result in a large discrepancy in measurements. When the values at the distance of 0.5 cm and 1.0 cm were excluded, the differences between simulation and experiments were reduced to below 0.6oC. Considering that the low Re k–ε model had the smallest average difference of 0.5oC, it produced better estimations of the air temperature.
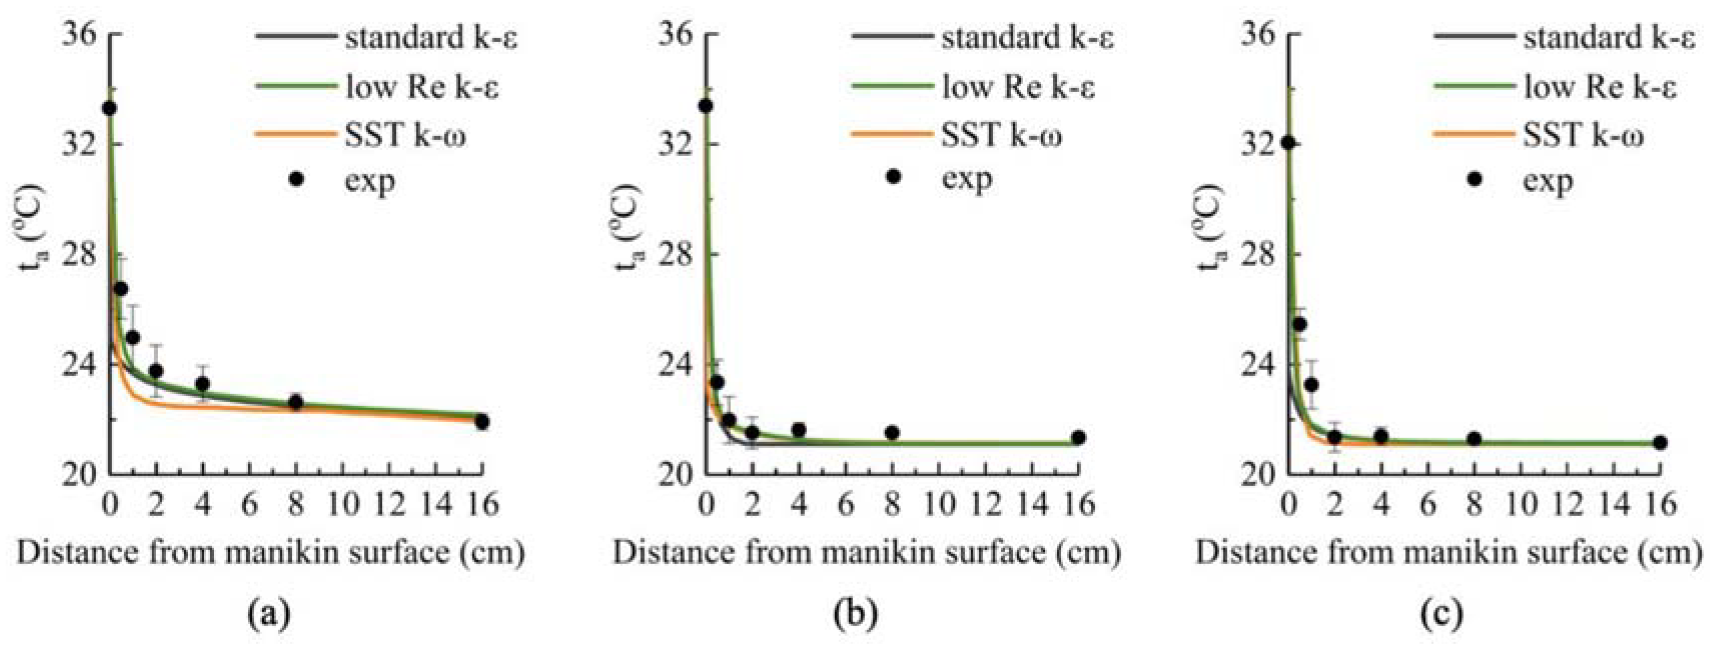
Measured and simulated air temperature around the manikin: (a) abdomen, (b) back, and (c) upper arm.
The SD of measured air temperature and the RMSE of simulated air temperature near five locations.
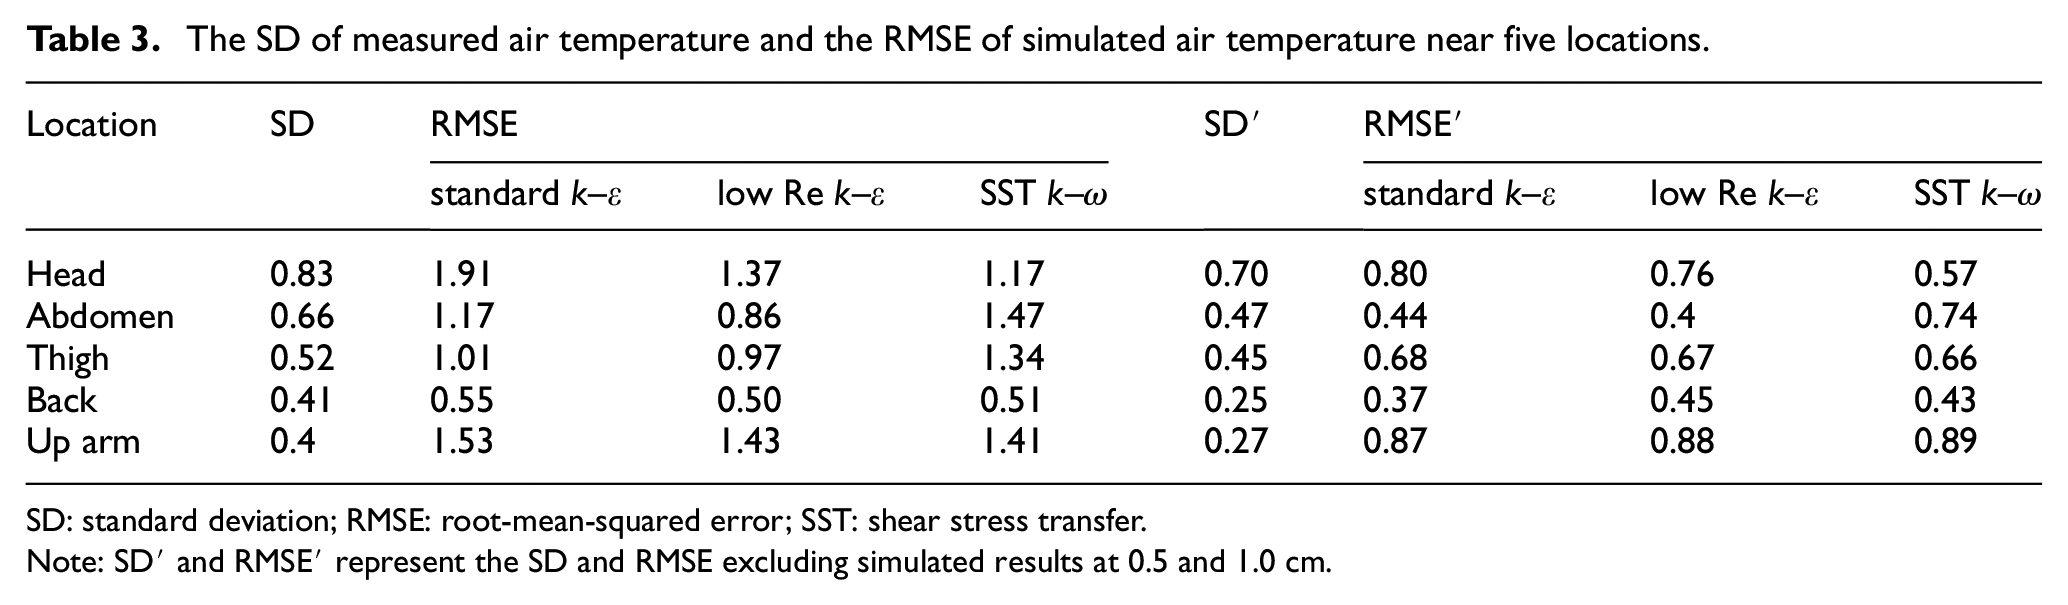
SD: standard deviation; RMSE: root-mean-squared error; SST: shear stress transfer.
Note: SD′ and RMSE′ represent the SD and RMSE excluding simulated results at 0.5 and 1.0 cm.
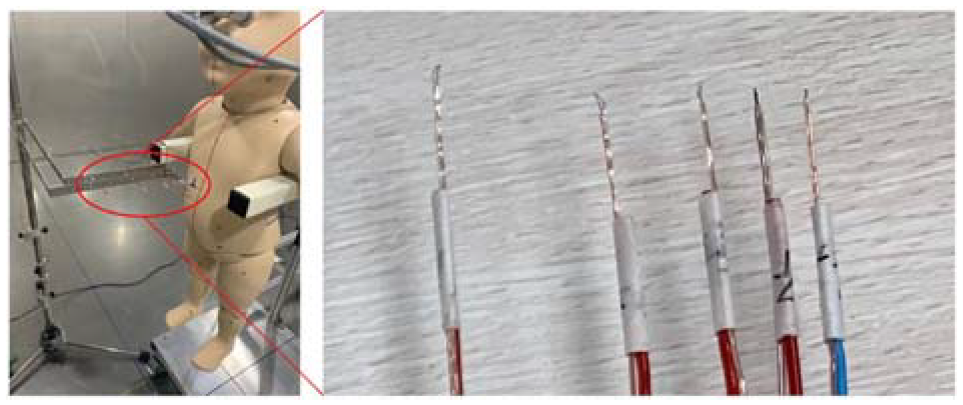
Setting of thermocouples.
By comparing heat flux, va, and ta, the low Re k–ε model was skilled in predicting airflow and temperature field around the infant manikin, and it was selected for further analysis.
Heat transfer at the infant surface
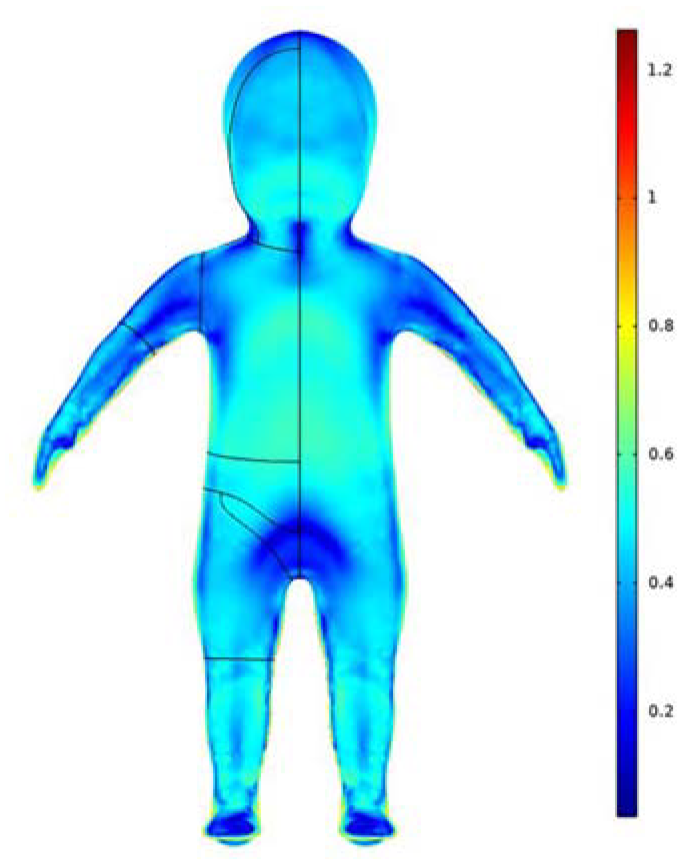
Figure 12 presents the simulated convective heat transfer coefficient (hc) and radiative heat transfer coefficient (hr) of the whole and the individual body parts at the infant surface. The two heat transfer coefficient distributions were also visualized in Figure 13. The simulation results showed that the whole hc and hr were 8.34 and 5.08 W/m2·K, respectively. The value of hc was 64.2% greater than hr, demonstrating that convective heat transfer was the main approach of heat exchange between the infant and its surrounding environment.
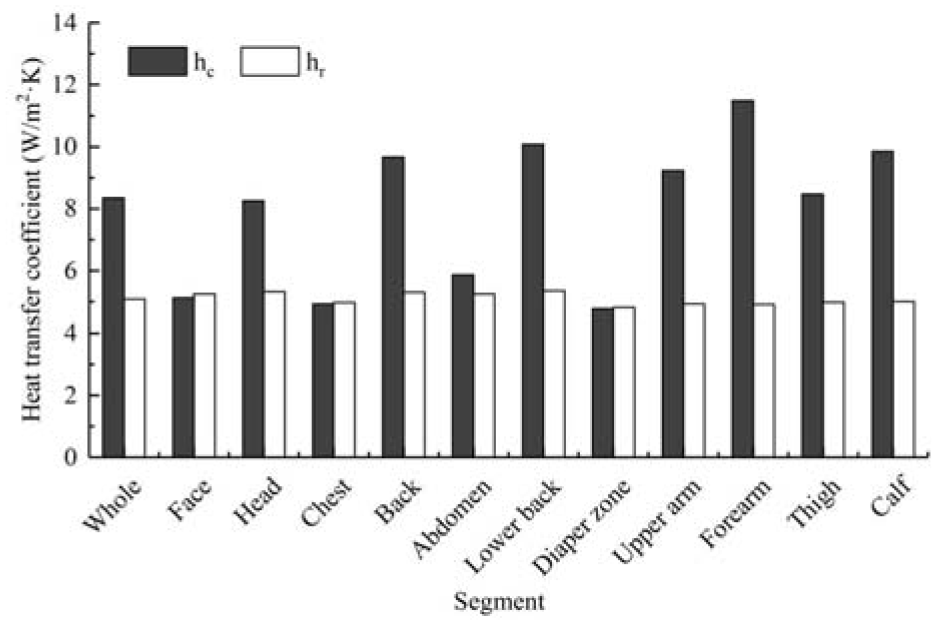
Simulated convective and radiative heat transfer coefficients of the whole and individual body parts.
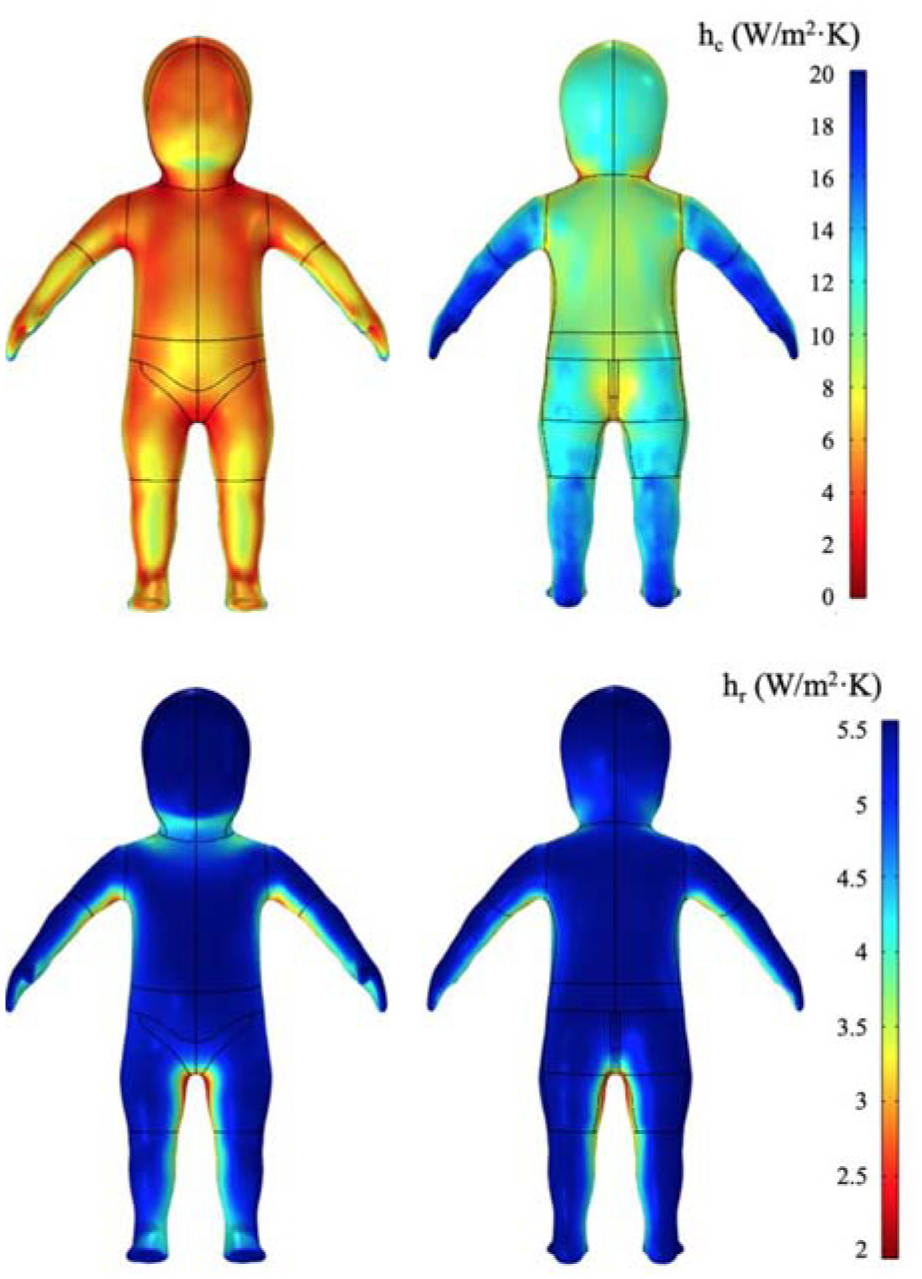
Distributions of convective and radiative heat transfer coefficient at the infant surface.
The regional hc was in the range of 4.78–11.49 W/m2·K. A noticeable discrepancy in regional hc was observed among varied body segments. Generally, the body segments at the front of the infant body (e.g. head, back, lower) had lower hc than the segments at the back (e.g. face, chest, abdomen, and diaper zone), which was associated with the airflow direction around the human body. As shown in Figure 14(a), the airflow first entered from the inlet at the speed of 1.2 m/s and then flowed from the back of the infant body to the front at a low speed of about 0.3 m/s due to the blocking of solid wall and the force of gravity. The back of the infant body played the role of the windward side, where convective heat exchange was accelerated.
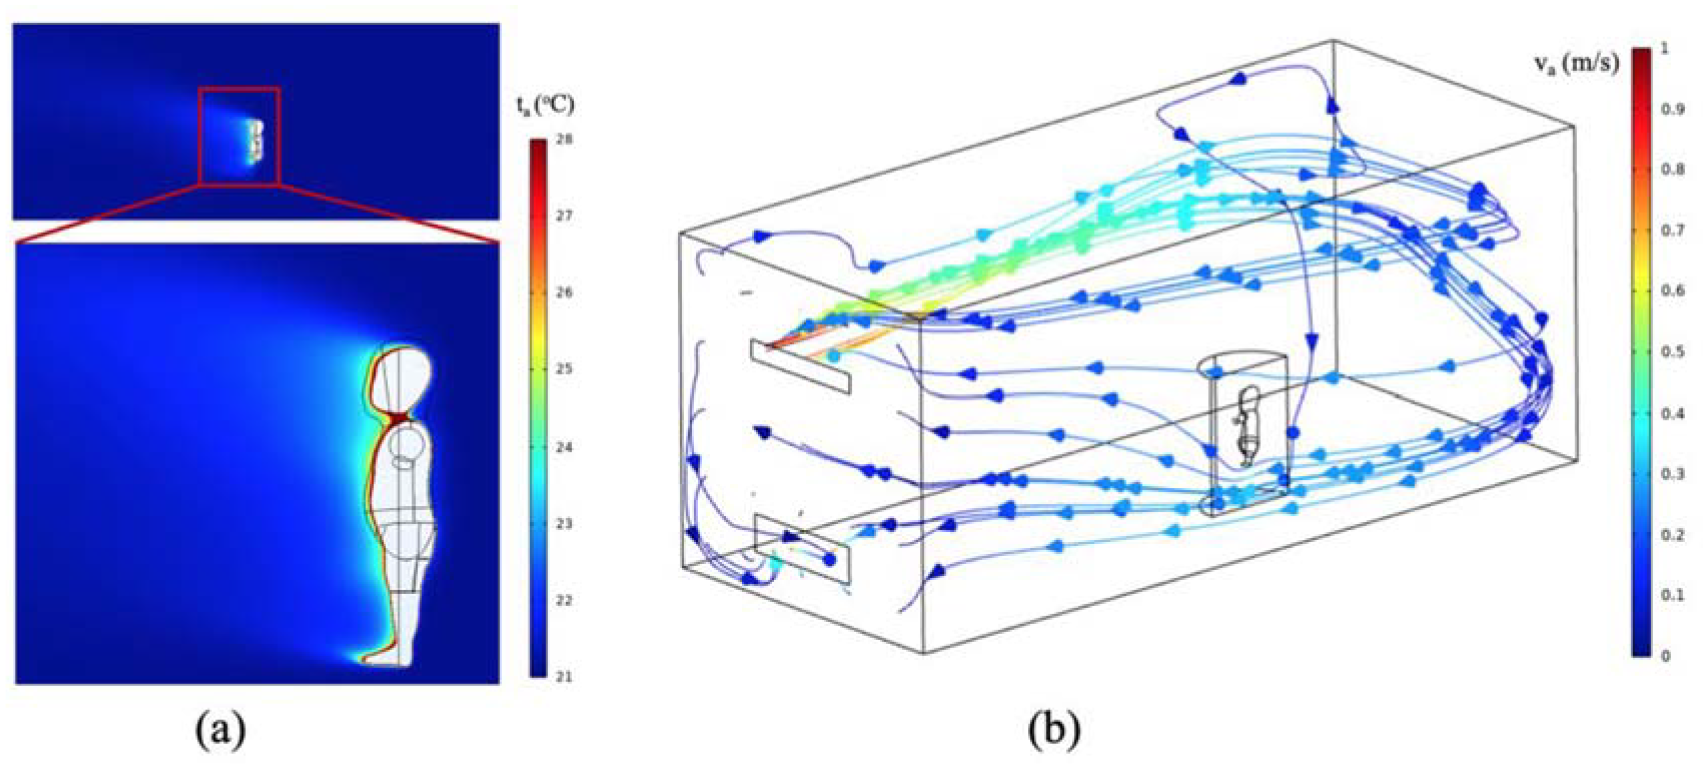
Air temperature and velocity distributions in the chamber: (a) air temperature and (b) air velocity.
Among all the body segments, the forearm and calf had the largest hc, respectively, with values of 11.49 W/m2·K and 9.85 W/m2·K, which were pronouncedly greater than that at the trunk. This result was in good agreement with the findings in previous studies.30,34 This can be attributed to the difference in the thermal plume around the human body caused by varied height locations of body parts. Figure 14(b) shows that the thermal plume developed diagonally upward along the human body. The forearm and calf were surrounded by the undeveloped thermal plume due to the location at relatively lower heights, and its thermal boundary was thinner at these body parts. This revealed that the forearm and calf would quickly cool down at low temperature, compared with other body parts.
In addition, the hr was distributed evenly at the infant surface, ranging from 4.81 to 5.35 W/m2·K. Figure 13 revealed that the armpit and crotch showed a slightly lower hr, which can be explained by the smaller effective radiative area of these locations faced with the climate chamber wall.
The above results showed that convective heat transfer is an important approach of heat exchange between an infant and the environment. The value of hc can be easily affected by the airflow around the human body, and the airflow direction noticeably influenced the distributions of regional hc at the infant surface. Since the unevenly distributed hc may result in discomfort at regional body parts, it is essential to study and improve the indoor ventilation equipment for ensuring the thermal comfort of infants. Considering the large hc at the forearm and calf, gloves and socks should be added for infants at low temperatures. This may provide caregivers with some guidelines on thermal care for infants.
Limitations
The current study has some limitations that should be acknowledged. The study was conducted in the laboratory with strictly controlled environmental conditions. The infant manikin was exposed to stable ambient temperature and airflow with almost uniform and low velocity. However, in practice, infants are often exposed to fluctuating air temperature and non-uniform airflow. Additional environmental conditions should be considered in the investigation of heat transfer mechanisms for infants. Besides, the geometry model contained a nude thermal manikin in a standing position lifted above the floor, which was simplified from real scenarios. For the dressed condition, the clothing may change heat dissipation from the body surface at varied regions, and a lower heat transfer coefficient will be generated compared to the nude manikin. Diverse body postures, such as being held by caregivers, leaning on a chair, or lying on a bed, are commonly used and should be further considered in the future.
Conclusion
This study established a fully validated CFD numerical model to investigate the heat transfer around the infant surface in the indoor environment. An accurate surface of an infant was obtained using 3D body scanning technology combined with an infant thermal manikin. The simulated results were compared with the measured air temperature, air speed, and heat flux at the infant surface, which showed good agreement. It was found that the convective heat transfer dominated a room temperature of 21oC, and the airflow had an obvious effect on the regional convective heat transfer coefficients. The forearm and calf had the greatest convective heat transfer coefficient, indicating the significance of sufficient thermal protection at these locations. In the future, the heat transfer process around the infant should be investigated under various environmental conditions based on validated CFD models.
Footnotes
Declaration of conflicting interests
The author(s) declared no potential conflicts of interest with respect to the research, authorship, and/or publication of this article.
Funding
The author(s) disclosed receipt of the following financial support for the research, authorship, and/or publication of this article: Fundamental Research Funds for the Central Universities (Grant NO. 2232022G-08), International Cooperation Fund of Science and Technology Commission of Shanghai Municipality (Grant NO. 21130750100) and Graduate Student Innovation Fund of Donghua University (Grant NO. CUSF-DH-D-2022048).