
Abstract
This research is an in-depth study into the optimization of tensile properties of hydro-entangled nonwoven fabrics made of greige cotton. The effect of five different testing parameters, weight, gauge length, speed of testing, angle to machine direction, and specimen width on the tensile properties of hydro-entangled nonwoven fabrics are tested. The parameters to express tensile properties include load at break, extension at break, tensile stress at break, tensile strain at break, Young’s modulus, and energy at break. The testing process was performed according to central composite design. The regression analysis and optimization analysis are used for data analysis.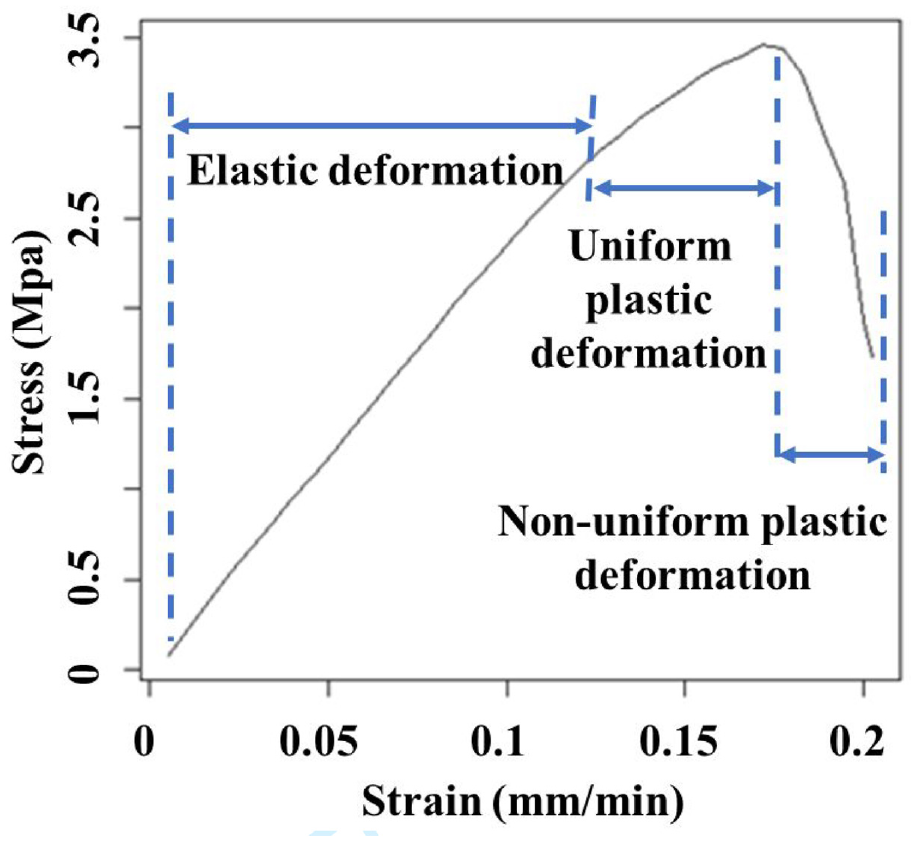
This research is an in-depth study into the tensile properties of hydro-entangled nonwoven fabrics made of greige cotton. The effect of five different testing parameters or sample characteristics, weight, gauge length, speed of testing, angle to machine direction, and specimen width, of hydro-entangled nonwoven fabrics made of greige cotton were correlated with load at break, extension at break, tensile stress at break, tensile strain at break, Young’s modulus, and energy at break. The regression equations with an average r2 of 0.82 demonstrated parameters’ positive and effective influence on tensile properties. The influence order of all testing parameters is gauge length = specimen width > speed. This analysis aims to study the effects of testing parameters or sample characteristics on tensile properties. It is hoped that this study can contribute a better understanding of the relationship between hydro-entangled nonwoven fabric mechanical performance and web formations, potentially promoting greige cotton applications.
Introduction
Cotton 1 has a long history of serving people’s lives, from traditional weaving or knitting products to recent nonwoven products, which have been applied in all aspects of life: medical, hygienic, industrial, military, and environmental. With the characteristics of natural, flexible, excellent vapor absorption and transport properties, comfortability, and high production rate, cotton fiber is widely used in breathable fabrics with a year worldwide yield rate of around 25 million tons. 2 Greige cotton 1 refers to unfinished raw cotton with natural color, impurities, and odor. Compared to finished white cotton (e.g. after washing, bleaching, and dyeing), greige cotton with surface waxes, pectic substances, ash, and pigment exhibits significantly different properties: hydrophobic and unsmooth, which can be used for functional applications3–5 (e.g. oil absorption) and decorating materials (e.g. pillows, drapery, upholstery).1,2,6
Nonwoven textiles 7 have been widely studied in academic institutes and produced as a commercial product in these decades, and they are currently tremendously growing worldwide. 8 Nowadays, most nonwoven fabrics are made of synthetic polymer-based fibers, including polypropylene, polyester, and polyethylene. Natural fibers, including cotton fibers, are used to a limited extent in the nonwoven area due to economics and certain technical factors.
However, most nonwoven cotton fabrics, especially for medical use, 9 are manufactured with bleached cotton that is relatively expensive, difficult to process, and environmentally sensitive. Compared to bleached cotton, greige cotton exhibits too many contaminants and requires extra cleaning. However, the study and employment of specific equipment and technology in traditional nonwoven textile plants largely impede the development of greige cotton-based nonwoven fabrics.
Much attention has been devoted to using greige cotton in the nonwoven field because traditional cotton preparation processes including scouring and bleaching cost time, energy and equipment, increasing manufacturing costs and decreasing manufacturing efficiency. In addition, it is acceptable to employ low-grade, greige cotton in other applications like low-end bedding and absorbent wiping, especially in environmental and military fields. For these reasons, inexpensive non-bleached greige cotton has great potential market demand in the nonwoven sector. Currently, the US Department of Agriculture aims to enhance the value-added utilization of cotton. The Cotton Chemistry and Utilization Research Unit (CC&U RU) at the Southern Regional Research Center is exploring approaches to improve the usage of cotton in nonwoven fields. 8 New machinery consisting of a cross lapper, a pre-needle-punch machine, a hydro-entanglement (H-E) system, 10 a water purification system, and a high-production nonwoven card has been developed by modifying an existing cotton (tandem) card to produce a web of cotton fibers instead of a silver, which showed that run-of-the-mill greige cotton could be efficiently manufactured on downstream nonwovens production equipment.6,11 In addition, in this research, pre-needled condensed webs of greige cotton fiber were produced on commercial-grade needle punch equipment to investigate the H-E process of fabricating nonwovens with a special emphasis on the effects of various processing parameters, such as hydraulic energy and production speed, on the properties and characteristics of the produced nonwoven fabrics. 8
In most research, conventional methods were employed to determine the influence of manufacturing parameters by varying the studied parameters systematically and keeping constant the others, resulting in an unreliable number of experiments. 12 Recently, experimental design methodologies have been used to optimize the effective parameters with the minimum number of experiments. The response surface methodology (RSM) is one of the common experimental design techniques for process analysis and building models. The main objectives of RSM are to optimize the response surface and quantify the relationship between parameters and response surfaces. 13 In detail, the procedure of RSM can be divided into four steps: (1) performing a series of experiments, (2) building a mathematical model, (3) determining the optimal set of parameters, and (4) representing the direct and interactive effects of parameters. 12 RSM is an efficient method for finding optimal parameters in experiments. Based on the requirement of experimental data, RSM has two designs: the central composite design (CCD) and the Box-Behnken design.14,15 Compared to the Box-Behnken design, the CCD requires fewer experiments to describe the majority of steady-state process responses. 16
In this paper, we comprehensively study the tensile properties of hydro-entangled nonwoven fabrics made of greige cotton using the CCD to obtain fabric maximum strength and high testing precision, accuracy, and reproducibility. Five testing parameters or sample characteristics have been tested, including the effects of weight, gauge length, speed of testing, angle of machine direction, and specimen width on the tensile properties of hydro-entangled nonwoven fabrics. The tensile properties like load at break, extension at break, tensile stress at break, tensile strain at break, Young’s modulus, and energy at break were collected to analyze the mechanical properties of nonwoven fabrics. We seek a set of test parameters that give the most sensitive tensile test responses. It is also important to note that this study can potentially contribute to a better understanding of the correlation between fabric mechanical properties and web formations to guide greige cotton nonwoven manufacturing parameters or protocols.
Materials Preparation
Materials and Preparation of Cotton Webs
The cotton webs were kindly provided by the US Department of Agriculture (USDA, New Orleans). The cotton fibers used to produce hydro-entangled webs have properties measured by the high volume instument (HVI) and advanced fiber infromation (AFIS) systems as follows: micronaire of 4.7, short fiber content of 9%, maturity ratio of 0.87, fineness of 160 mtex, strength of 29.54 g/tex, and elongation of 6.9%. Greige cotton fibers were processed using the opening cleaning lines before being fed into textile carding and web formation equipment. Subsequently, the obtained web was fed for needle punching using a speed of 5 m/min and pre-wet conditions of 30 bar. The needle-punched webs were then hydroentangle bonded under a 120-bar using the flat drum.
Methods of Testing and Experiment Designing
Thickness Test
The thickness of nonwoven samples was tested according to the ASTM standard (ASTM D-1777-96 (2007)). Basically, 10 samples were tested with an applied pressure of 4.14 kPa, and average results are used.
Tensile Strength and Elongation Test
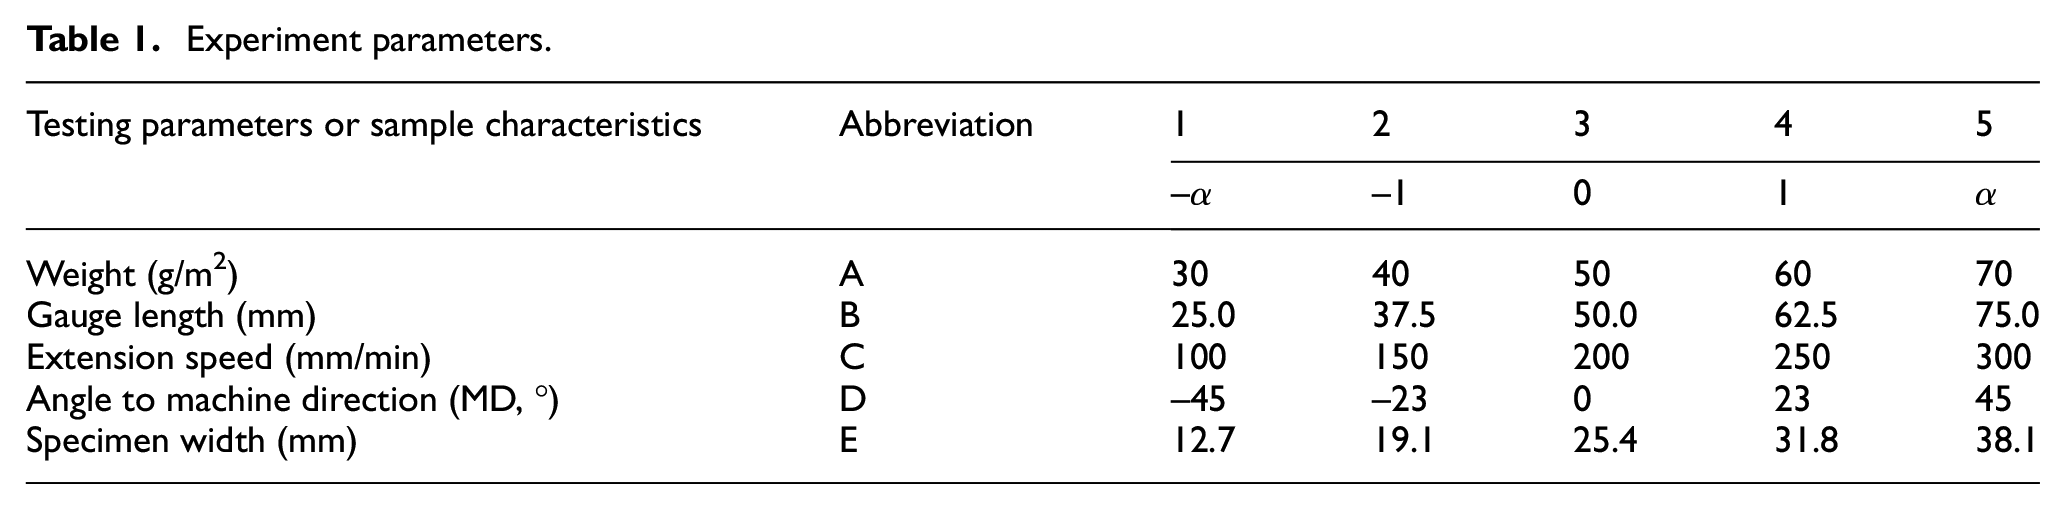
To test tensile properties, the cotton hydro-entangled webs were first to cut into different dimensions (as shown in Figure 1). As shown in Table 1, the specimen width ranged from 12.7 to 38.1 mm, and the weight varied from 30 to 70 g/m2. In addition, the angle to machine direction (MD) was also concerned with investigating the tensile properties of cotton nonwoven webs with a range from −45° to 45° (−45°, −23°, 0°, 23°, and 45°). These samples were tested on an Instron tensile tester 5569 (Instron Corporation, Norwood, MA). The load cell used in this study is 250 N. The measuring parameters for tensile properties include extension speed (100, 150, 200, 250, and 300 mm/min) and gauge length (25.0, 37.5, 50.0, 62.5, and 75.0 mm). A modified ASTM 5034 method, a standard tensile and elongation test of woven and nonwoven (sample extension speed, gauge length, and width of 300 ± 10 mm/min, 75 ± 1 mm, and 100 ± 1 mm), was employed to measure the tensile properties of greige cotton nonwoven webs. The modifications were extension speed, gauge length, and specimen width, as shown in Table 1. The purpose of parameter modification was to acquire the effect of test parameters on the sensitivity of tensile test results for greige cotton nonwovens. However, the modifications may change the precision of biases of the results, which are potential limitations. Furthermore, the purpose of the study was not to evolve a method or standardization of a test method, but to understand the influence of different testing and sample parameters on important tensile properties using a statistical experimental design process, which is an important academic exercise. Tensile properties including load at break (N), extension at break (mm), tensile stress at break (MPa), tensile strain at break (mm/mm), Young’s modulus (MPa), and energy at break (J) were measured and calculated to quantify the tensile properties of cotton nonwoven fabrics.
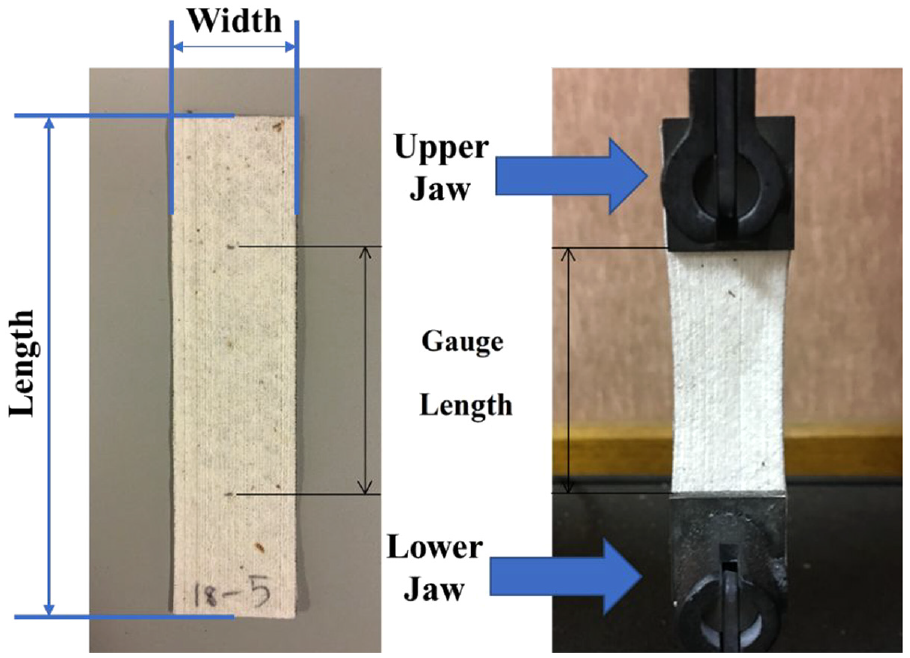
Specimen cut and test setup.
Experiment parameters.
Response Surface Methodology and Central Composite Design
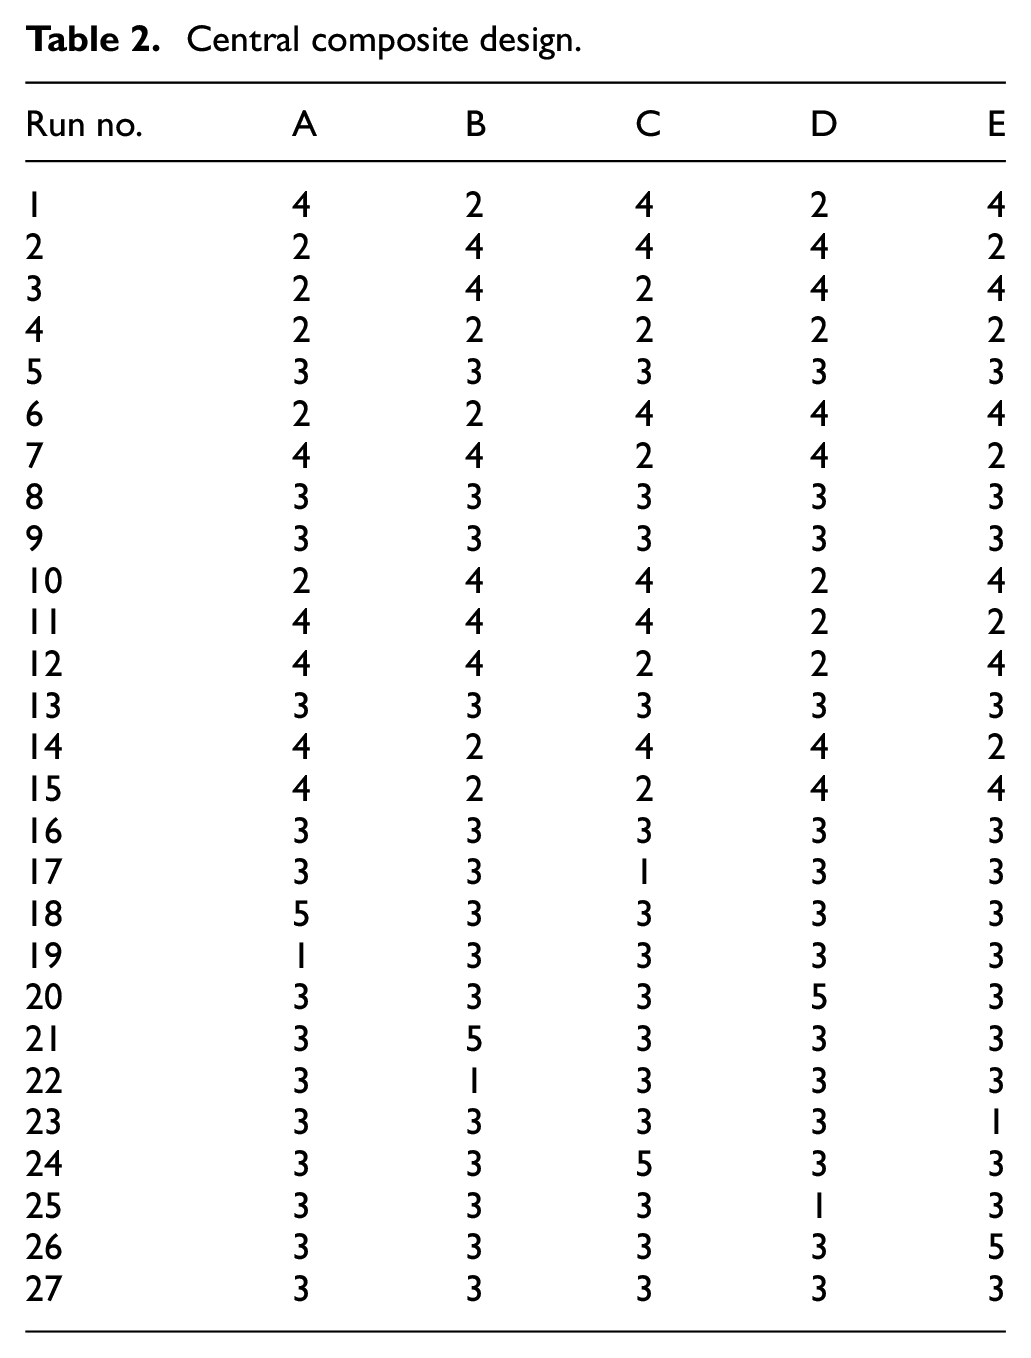
The RSM applied in this study focused on the associations between tensile testing results and independent variables, which were tensile testing parameters. The utilized response surface experiment was a five factorial CCD. The selected five factors were sample weight, gauge length, extension speed, angle to MD, and specimen width. The CCD, or Box and Wilson design, is a factorial-fractional design with a distance between center and factor points of ±1 and a distance between center and star points of ±α (
Central composite design.
Methods of Data Analysis
The F-test is used to verify the statistical significance, which is set at p < 0.05. Statistical analyses used R software. Five repeats (n= 5) and 10 repeats (n = 10) were selected for tensile and thickness testing. The results displayed in Table 3 are the average values. Regression analysis (with JMP software) and optimization methods were applied in processing and analyzing the data to discuss the relationship between testing parameters or sample characteristics and tensile properties results and the optimal testing parameters or sample characteristics to achieve the highest tensile properties.
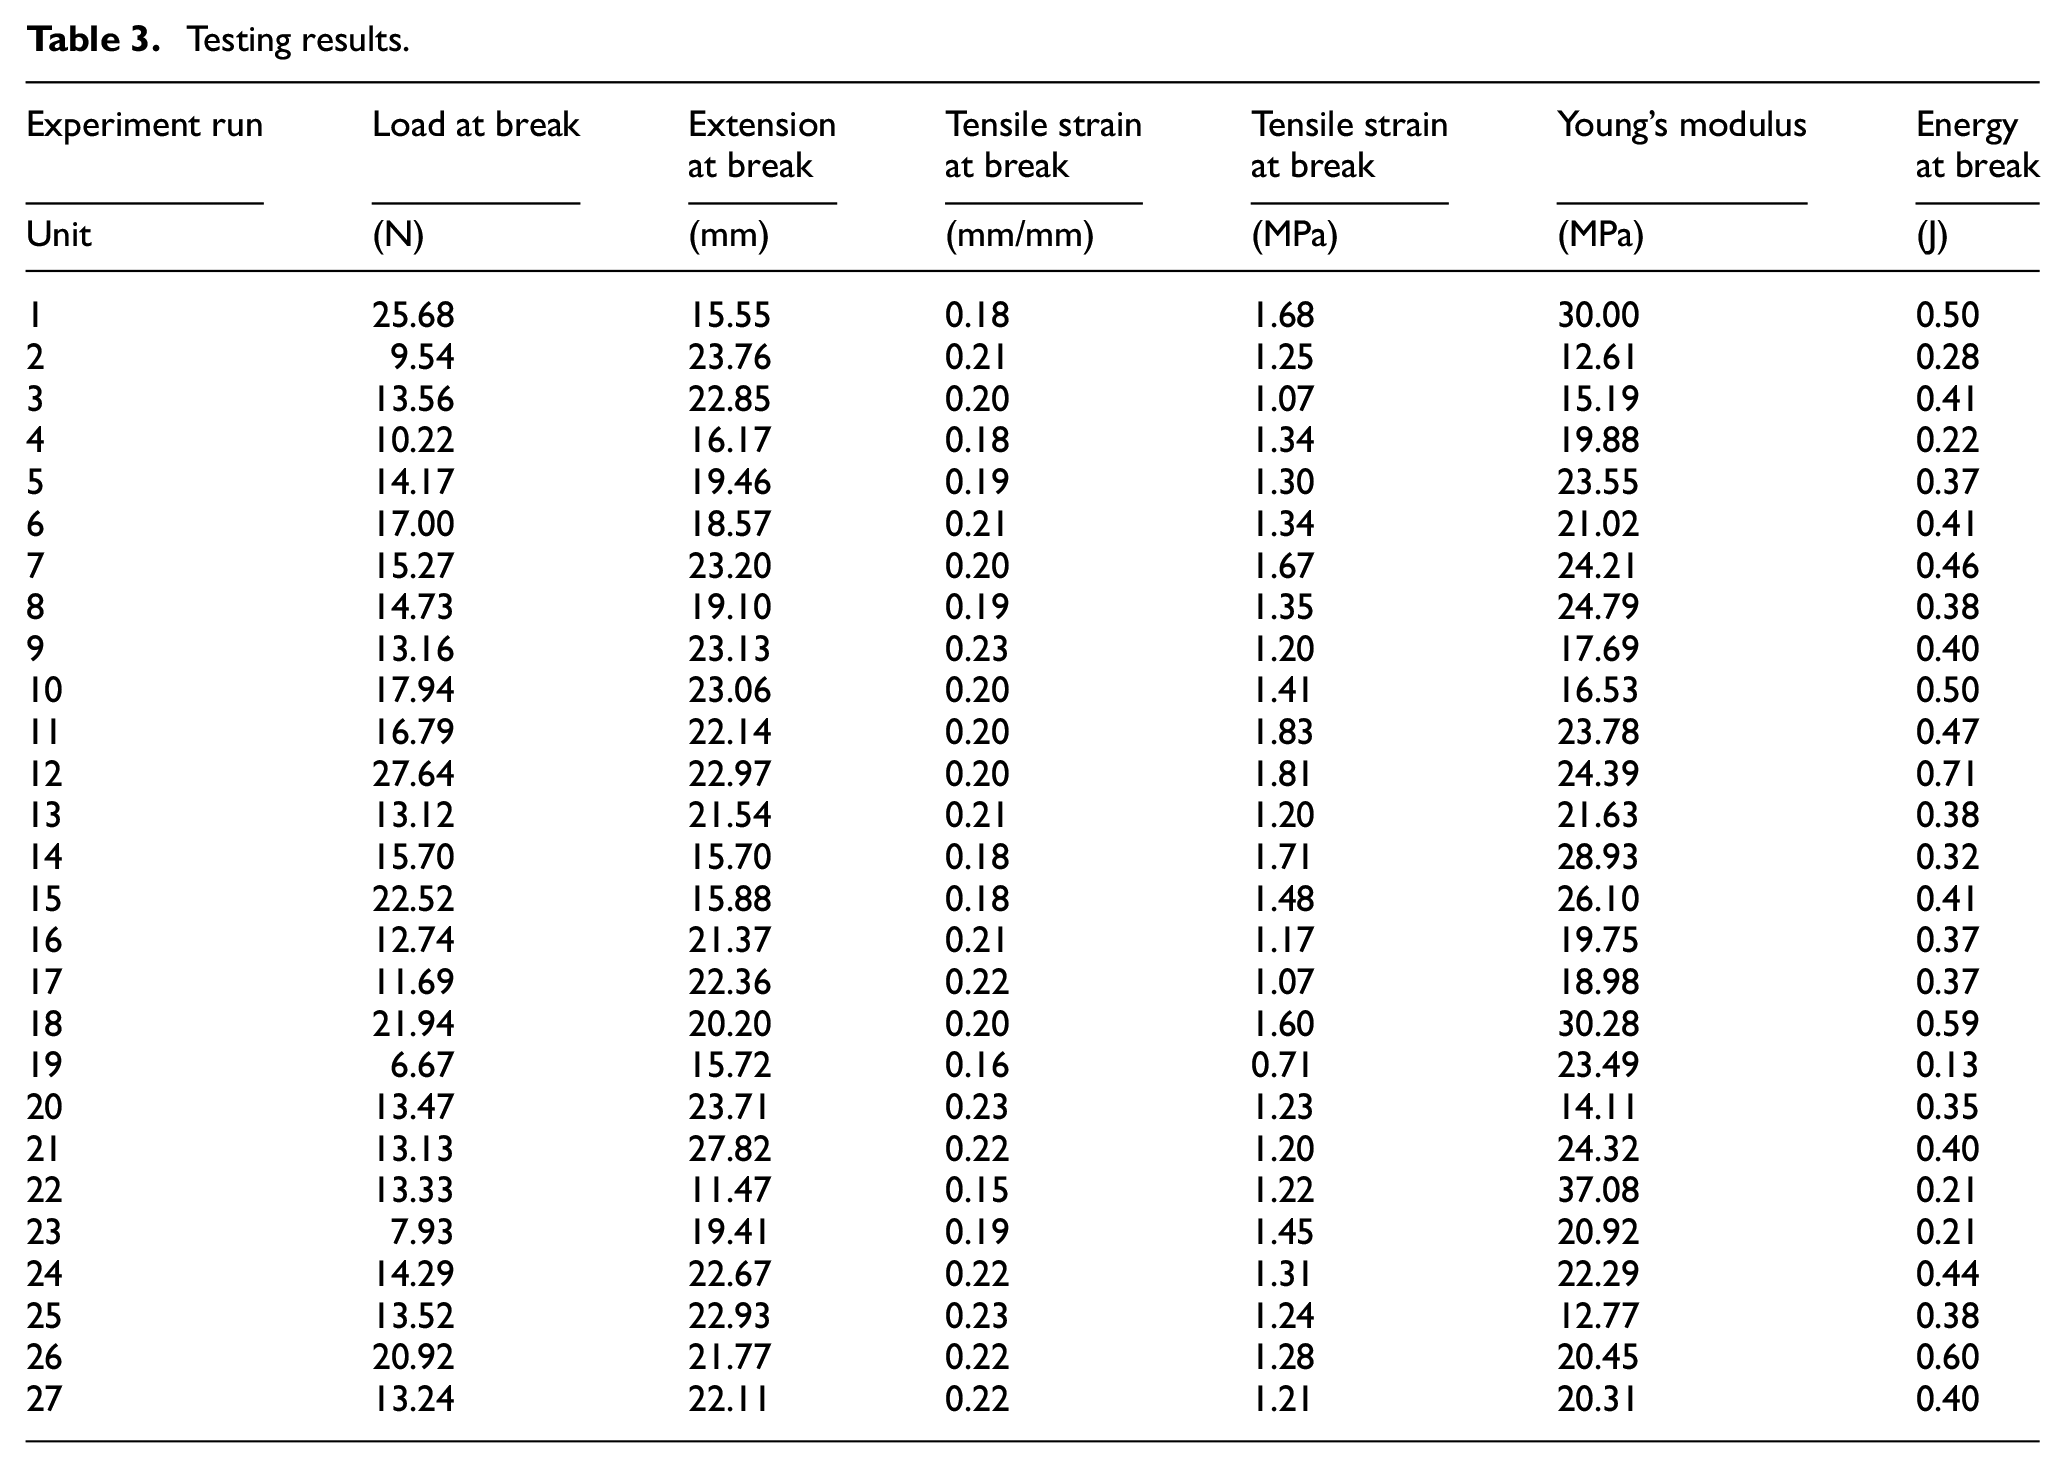
Testing results.
Abbreviations
In the results and analysis tables, the following abbreviations will be used. L represents load at break (N), Ex represents extension at break (mm), Se represents tensile stress at break (MPa), Sa represents tensile strain at break(mm/mm), M represents Young’s modulus (MPa), and E represents energy at break (J).
Results and Discussion
The CCD consists of 27 experimental runs to analyze the input tensile testing variables A-E to obtain the most sensitive tensile test responses. Table 3 shows the testing results of the following six parameters: load at break, extension at break, tensile stress at break, tensile strain at break, Young’s modulus, and energy at break. For each experiment run, five repeats were conducted. Each number in the table is the average of all five repeats. The regression equations of the least squares method are shown in Table 4, and Figure 2 shows the regression curve for the six property parameters.
Regression equations and F-test results.
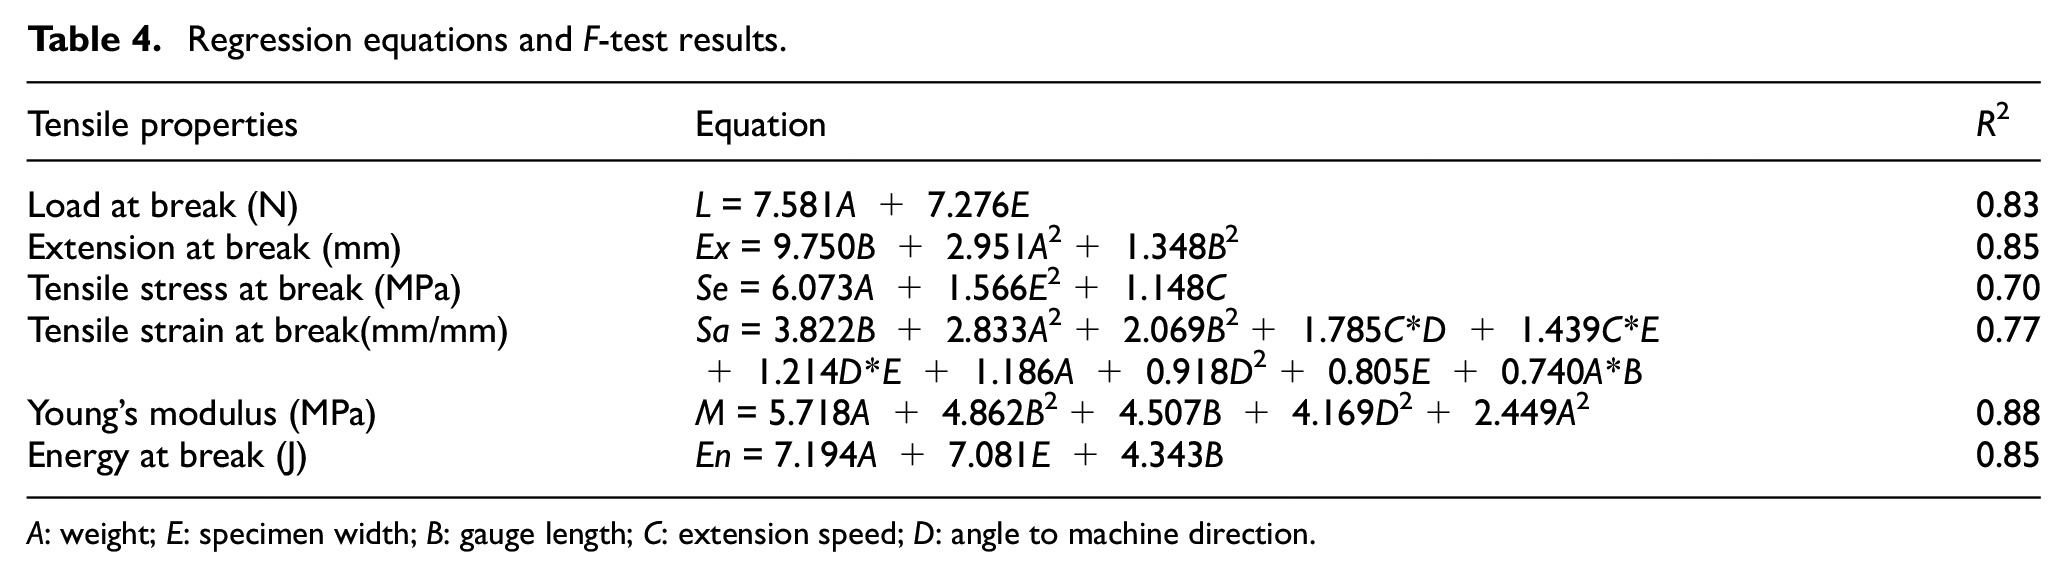
A: weight; E: specimen width; B: gauge length; C: extension speed; D: angle to machine direction.
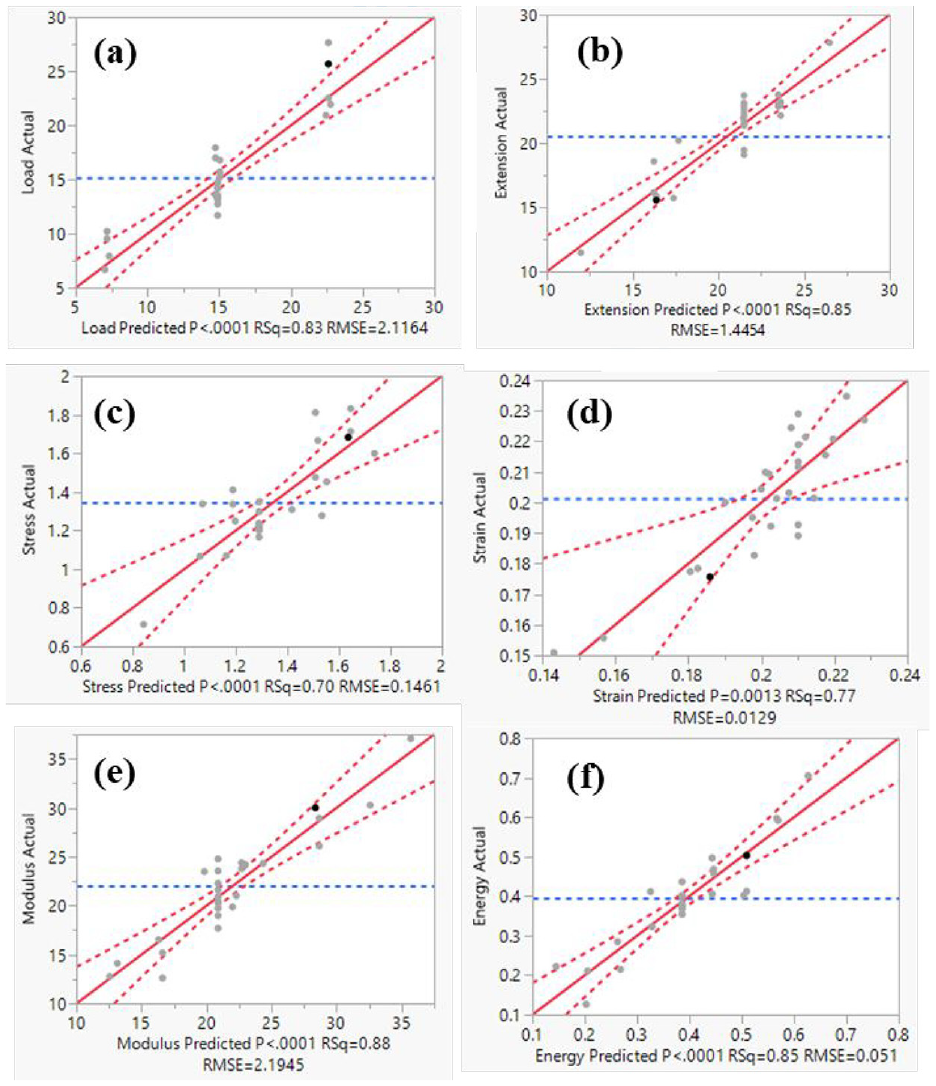
Regression curve: (a) load at break; (b) extension at break; (c) tensile stress at break; (d) tensile strain at break; (e) Young’s modulus; and (f) energy at break.
The regression equations in Table 4 and regression curves in Figure 2 were formulated and plotted by the software JMP Statistical DiscoveryTM from SAS. The F-test verified the statistical significance and coefficients of the regression equations. As is shown in Table 4, the R2 of most regression equations is around 0.8 (L: 0.83, Ex: 0.85, Sa: 0.77, M: 0.88, En: 0.85), which means that there is a strong positive relationship between testing parameters or sample characteristics and tensile results; therefore, the parameters have obvious influence on these five tensile properties. Comparatively, the R2 of tensile stress is 0.70, which is much lower than the other R2; a study by Lou et al.17, 18 showed that an R2 of 0.70 possibly indicates the influence of interactive effects or inherent fiber factors (e.g. molecular weight or viscosity). In summary, the method and analysis are reliable in this study.
From observing the regression equations by the least square method, we can find that A or A2 has appeared in all regression equations, indicating that parameter A (specimen weight: g/m2) has a stronger relationship with all the tensile properties than other testing parameters or sample characteristics. In addition, the second most frequent parameters in the equations are B (gauge length) and E (specimen width). These parameters, gauge length, and specimen width are also very important in influencing the testing results. Moreover, the empirical models (Figure 2) indicate that the experimental data (dots) align uniformly on both sides of predicted equations (solid lines), with most of the data lying within the confidence limits (dotted lines).
The optimization analysis for the experiment data is to obtain: (1) the influence of tensile testing parameters or sample characteristics on the resulting tensile parameters, (2) fabric maximum strength and high testing precision, accuracy, and reproducibility, and (3) the correlation between fabric mechanical property and web formations to guide greige cotton nonwoven manufacturing parameters or protocols. Figure 3 in the line graph displays the K values for all the result parameters at different testing levels (the different testing levels are the five values of all the five testing parameters or sample characteristics: A, weight (g/m2); B, gauge length (mm); C: extension speed (mm/min); D, angle to machine direction (°); and E, specimen width (mm). A and D are not discussed as the optimization parameters because they are sample and structure characteristics. Figure 3 was drawn by Origin 7.5 using the data in Tables 2 and 3. The K-value of the optimization test is the average of the sum of data at each level of each parameter, indicating the level of parameter influencing on tensile parameters. A higher K-value indicates a higher influence effect of that factor on tensile properties. Its significance in optimization analysis is to demonstrate the influence of experimental factors on the results by their fluctuation. As we can see from the graphs in Figure 3, E (specimen width) has the biggest influence on load at break; B (gauge length) has the biggest influence on tensile strain at break and Young’s modulus.
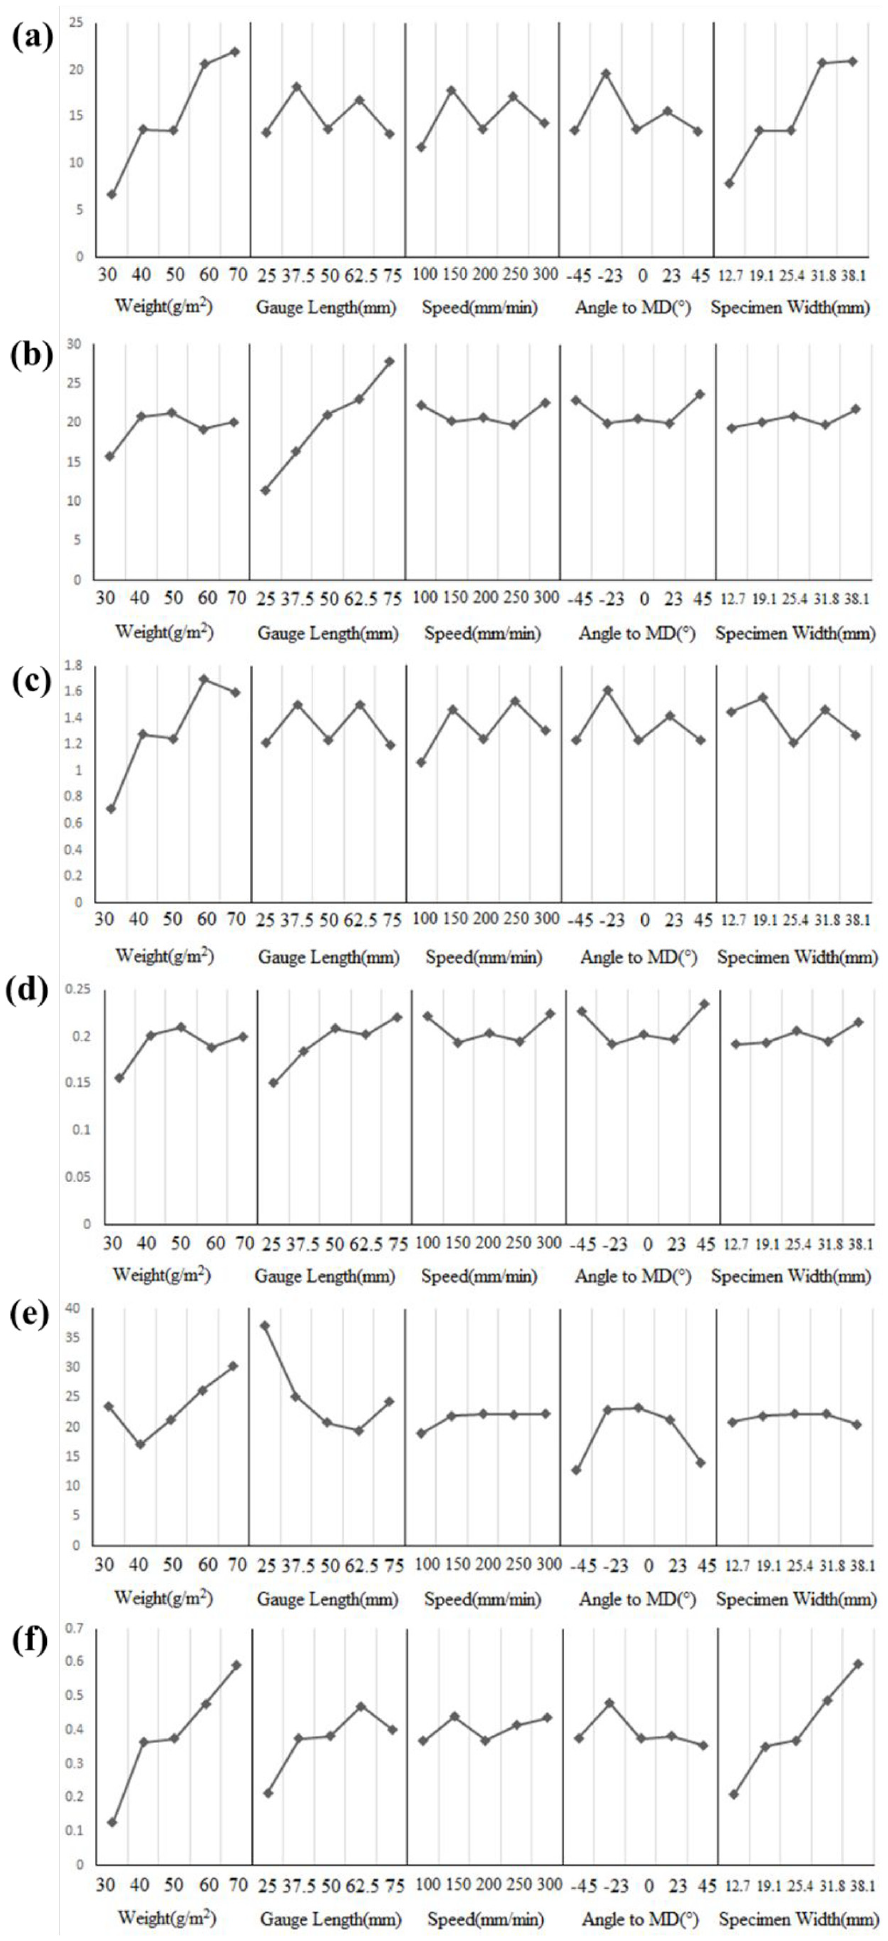
K values: (a) load at break; (b) extension at break; (c) tensile stress at break; (d) tensile strain at break; (e) Young’s modulus; and (f) energy at break.
This study is a multi-factor experiment rather than a single-factor. Therefore, it is difficult to track the mechanism of each parameter. However, we can roughly check the influence based on the K-values displayed in Figure 3(a) and (e). Generally speaking, K-values decreased with gauge length, which might be attributed to the weak-link effect. It is because more defects are shown at longer gauge lengths. Opposite to gauge length, increased mechanical properties with the increase in sample weight can be observed. This because of the increased bonding structure and fiber nodes. These testing results matched the mechanism with our previous results about nanofiber webs [18]. This study’s mechanisms of testing speed, angle to machine direction, and specimen width are not clear due to the multi-factor experiment.
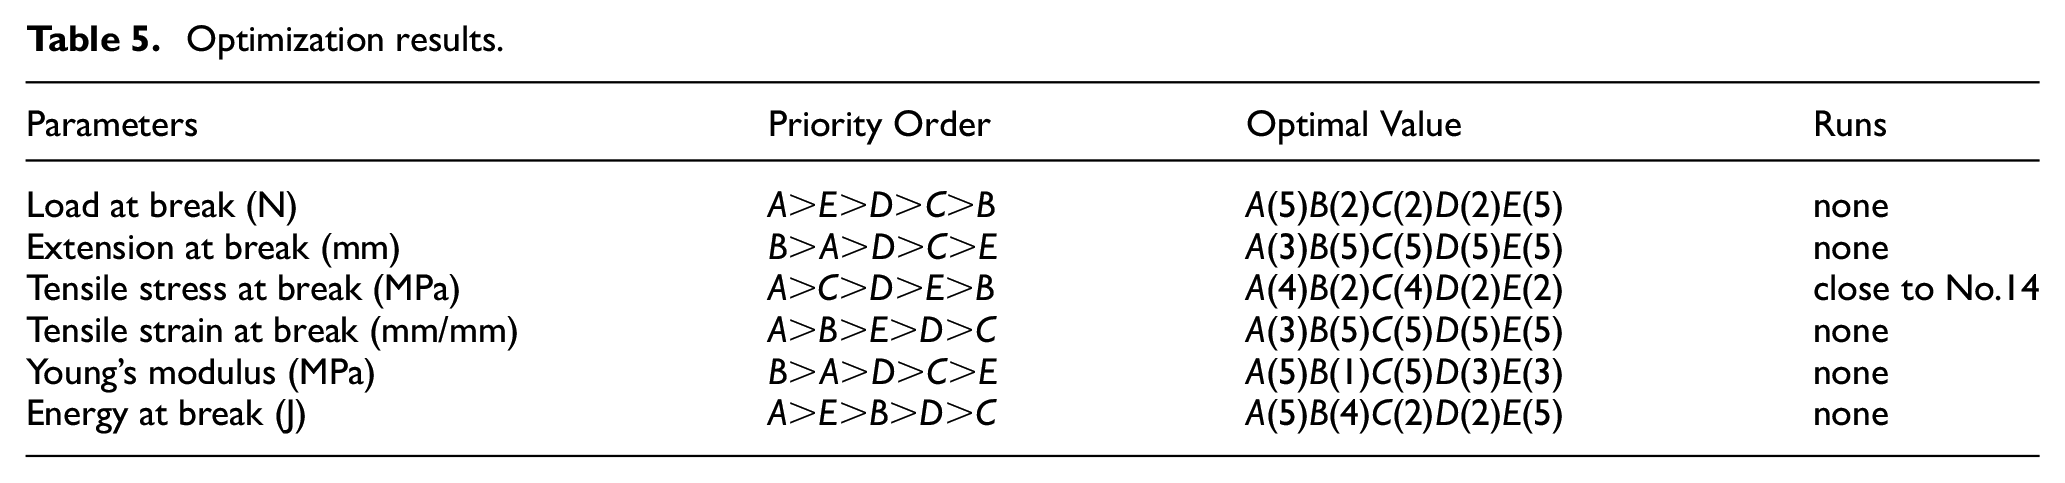
After analyzing the variation of K values, we concluded the sensitivity order and maximum values of all the testing parameters or sample characteristics for each property parameter as shown in Table 5. In summary of all the orders, the order of testing parameters or sample characteristics for all the properties from the biggest sensitivity to the least sensitivity is B>C>E, which is gauge length> extension speed>specimen width. The tested average tensile properties were load at break of 35.59 N, extension at break of 20.13 mm, tensile stress at break of 1.70 MPa, tensile strain at break of 0.23 mm/mm, Young’s modulus of 22.54 MPa, and energy at break of 0.83 J.
Optimization results.
The results also reflect greige cotton hydroentangled nonwoven formation. For example, the angle to MD to achieve maximum mechanical property is related to the orientation direction of fibers (ODF). The optimization study demonstrated that the highest tensile strength achieved at −23 degree and significant differences between -23 and 23 degrees, indicating skewed, non-symmetrical fiber orientation distribution during nonwoven fabric formation process. It might be a significant fabric processing problem. Meanwhile, we can suggest the web formation parameter based on its mechanical performance to guide greige cotton nonwoven manufacturing parameters or protocols and promote its applications.
The stress–strain curves of hydro-entangled nonwoven fabrics made of greige cotton were plotted by R i386 3.5.1 and are shown in Figure 4. The tensile strain–stress curve consists of three regions: the elastic deformation stage, the uniform plastic deformation stage, and the non-uniform plastic deformation stage. At the elastic deformation stage, the nonwoven samples exhibit linear elastic behavior under low strain, gradually straightening curled fibers. At the uniform deformation stage, the tensile stress keeps increasing with the increase in external strain where the bonded points among fibers gradually shift and weaken, or bonded points tend to break. At the non-uniform deformation stage, the tensile stress starts to decrease with the further increase of external strain where most bonded points break, resulting in the final collapse of the tested sample.
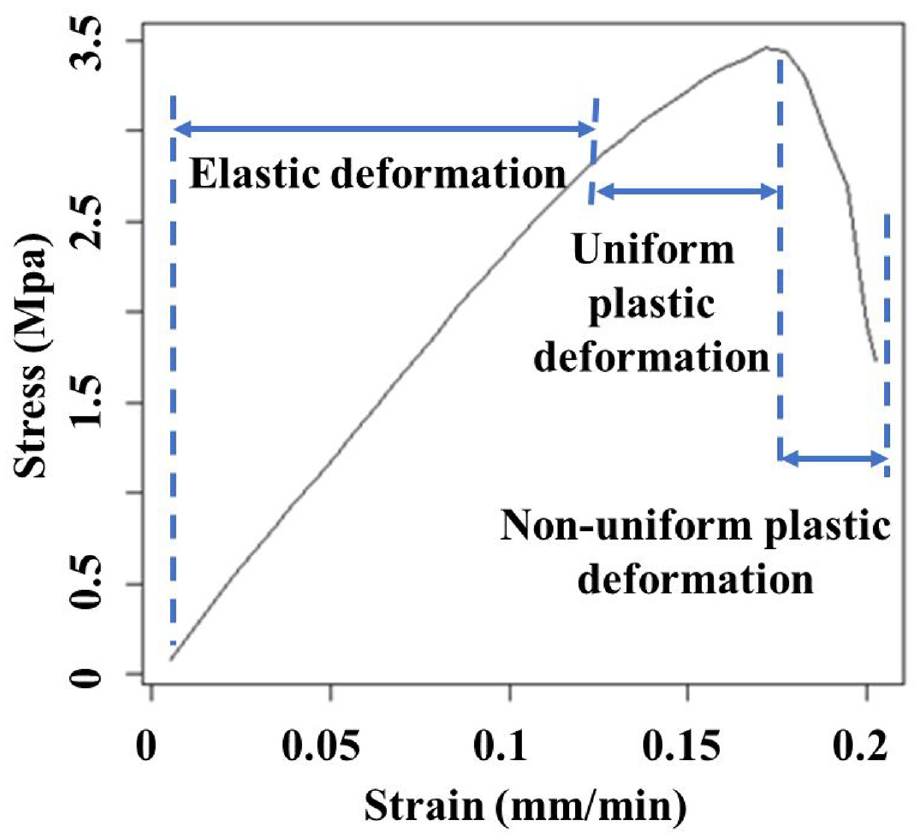
Stress–strain curve.
Conclusions
This research targets a comprehensive study of greige cotton hydro-entangled nonwoven fabrics’ tensile properties. We analyzed the effect of five different testing parameters or sample characteristics, weight, gauge length, speed of testing, angle to machine direction, and specimen width, on greige cotton nonwoven fabric’s load at break, extension at break, tensile stress at break, tensile strain at break, Young’s modulus, and energy at break using the CCD method. The results demonstrated that the mechanical property sensitivity order is gauge length = specimen width > speed. We also discussed greige cotton nonwoven fabric’s deformation mechanism based on its tensile strain–stress curve. Overall, this research studied the effects of tensile testing on the mechanical properties of hydroentangle nonwoven fabrics.
Footnotes
Acknowledgements
Seshadri Ramkumar gratefully acknowledges Texas cotton producers for supporting the research reported in the paper. This work was funded partially through the Texas State Support Committee of the Cotton Incorporated, Contract# TX 16-399 and Cotton Incorporated, Contract # 18-497. The authors would like to thank the Southern Regional Research Center of the USDA, New Orleans, for providing nonwoven samples used in the study.
Declaration of conflicting interests
The author(s) declared no potential conflicts of interest with respect to the research, authorship, and/or publication of this article.
Funding
The author(s) disclosed receipt of the following financial support for the research, authorship, and/or publication of this article:This work was funded partially through Texas State Support Committee of the Cotton Incorporated, Contract# TX 16-399 and Cotton Incorporated, Contract # 18-497.