
Abstract
In this article, an intelligent inspection method based on image analysis is proposed to identify the color and woven pattern of yarn-dyed fabric automatically. The local sequence images under the reflected light and transmitted light (LSRT images), which consist of reflection sequence images and transmission sequence images, are first captured by a fabric image acquisition device. Then the Fourier transform, image segmentation, and arithmetic operations are employed to the transmission sequence images to determine the location of weave points. Subsequently, the L*a*b* values of each weave point are extracted from the reflection sequence images. To inspect the color pattern, X-means clustering algorithm is used to classify the weave points based on the L*a*b* values. To detect the woven pattern, incomplete weave pattern matrixes of all sequence images are used to match the weave pattern database. Eight LSRT images of each yarn-dyed fabric sample are tested by the proposed method. The experimental results proved that the proposed method can recognize the color and weave pattern of yarn-dyed fabric with satisfactory accuracy and good robustness.
Introduction
With the higher demands for the clothes’ appearance, yarn-dyed fabric plays an increasingly important role in the textile market. 1 Color pattern and weave pattern are the two most important types of information for yarn-dyed fabric during the production. 2 In the textile enterprises, traditionally these two structural parameters of yarn-dyed fabric are inspected manually. This inspection method is very tedious and time-consuming. With the development of computer technology, many methods have been proposed to detect the color pattern and weave pattern of yarn-dyed fabric automatically. These methods can be categorized into two groups with four parts. These can be summarized in Table 1. These methods are as follows:
Group I—separate single yarn from fabric image.2–10 In this group, the single yarn was segmented from the fabric image first. Second, the clustering methods were applied for recognizing the color pattern of yarn-dyed fabric image. For weave pattern identification of yarn-dyed fabric image, existing methods including Radon transform and local orientation pattern method, 5 infill algorithm method, 2 kernel fuzzy c-means clustering method, 4 and pattern database method 3 were used. Finally, all these methods usually use an error correction method to rectify the detection results. These error correction methods included feedback error correction method 2 and distance matching function method. 4
Group II—not separate single yarn.1,11–18 In this group, the yarn-dyed fabric images were detected directly without segmenting out the yarn. The whole images were preprocessed first based on some image processing methods. Then genetic algorithm, 15 backpropagation (BP) neural network, 11 probabilistic model and hierarchical segmentation, 12 logical analysis, 1 and cluster method13,14,16–18 were utilized to inspect the color pattern of the whole yarn-dyed fabric image. The weave pattern could not be detected using this group of methods.
The existing methods for detecting the color pattern or weave pattern of yarn-dyed fabric.

FCM: fuzzy c-means clustering; BP: backpropagation.
All these existing methods can detect the color pattern or weave pattern and can achieve some good results under their specific capture environment. However, these methods have some decisive weakness:
All are based only on one large size of fabric image. This may generate some unavoidable misjudgments and cannot be used to detect the layout of color yarns online because the camera’s view is not large enough to capture the whole fabric pattern. Furthermore, the increase of camera’s view may affect the resolution of image, and this will compromise the results of image analysis.
Some methods need to set certain parameters under artificial interference, such as the clustering numbers in the clustering methods and the template size in the image enhancement methods. These parameters need to be determined manually in advance. These may have a great influence on the detection results if not correctly confirmed.
The methods of determining the location of weave point may include some interstice information (background information). In Group I, the edge location of color yarn is found to segment out the weave point. However, this method will contain some interstice information in each weave point. This may cause some wrong results.
Therefore, the above methods are not the true automated detection methods for yarn-dyed fabric images. This article aims at using the local sequence images under the reflected light and transmitted light (LSRT images) and the weave pattern database to detect the color pattern and weave pattern of yarn-dyed fabric automatically.
The LSRT images can be used to avoid the segmentation error and realize the layout detection of color yarns online. The weave pattern database can be applied to rapidly confirm the weave pattern and stay out of the error correction methods. The flowchart of the proposed method in this article is shown in Figure 1 and the content in this article is arranged as follows: (1) The LSRT images are captured by a fabric image acquisition device. (2) Fourier transform, image segmentation, and arithmetic operations are utilized to separate the weave points from the transmission sequence images. And then the color information of each weave point can be attained from the reflection sequence image. (3) The Euclidean distance of the average L*a*b* values of each weave point is calculated. Then a threshold value T is adopted to determine whether the color variety of all the weave points is one or more. (4) Incomplete weave pattern (IWP) matrixes of all sequence images are obtained preliminarily based on the obtained color matrixes. (5) All IWP matrixes of one yarn-dyed fabric sample are used as templates to match the weave pattern database. The optimal matching result is the yarn-dyed fabric’s weave pattern and the whole weave pattern can be confirmed precisely.

The flowchart of the proposed method.
Experimental details
Sample preparation
In the experiment, two kinds of yarn-dyed fabric samples are applied for evaluating the proposed method. For each fabric sample, eight image pairs (reflection image and transmission image are one image pair) are prepared and tested. The details of the different yarn-dyed fabric samples are listed in Table 2.
Two kinds of yarn-dyed fabric samples.

Fabric image acquisition
In order to acquire the LSRT images, a fabric image acquisition device is constructed to capture a reflection image as well as a transmission image in the sRGB mode, as shown in Figure 2. In the figure, a VHX-5000 series digital microscope manufactured by Keyence Corporation is applied to acquire the images. Two light-emitting diode (LED) lights, with RGB color properties similar to those of CIE D65, are placed above and under the experimental sample, namely, the reflected light and transmitted light, respectively. These built-in LED lights with high brightness are also produced by Keyence Corporation. Each LED light has two states, ON and OFF. There is a light intensity controller that can adjust the illumination intensity of the LED lights simultaneously.

Fabric image acquisition device.
The fabric sample is placed above the transmitted light when capturing an image. Utilizing the two states of the two LED lights, reflection and transmission images of the same region in the fabric are captured. When capturing the reflection image, the reflected light is ON and transmitted light is OFF; conversely, the transmission image can be captured. To obtain the sequence image, the fabric sample is moved by hand slightly, and the neighbor images should contain a certain level of overlapping area while moving. Eight successive yarn-dyed fabric image pairs are captured by the fabric image acquisition device with a resolution of 1111 × 1599 pixels as shown in Figure 3. The resolution is set at 0.0019 mm/pixel × 0.0019 mm/pixel along the X and Y coordinate axes. The photograph distance is set at 5 cm, and a 1/1.8-in complementary metal oxide semiconductor (CMOS) image sensor is applied.

The LSRT images of two kinds of yarn-dyed fabric samples: (a) #1 sample: Plain 1/1 and (b) #2 sample: Twill 2/2↖. P1–P8 represent the reflection sequence images and N1–N8 the transmission sequence images.
Image preprocessing for transmission sequence image
In order to segment out the weave points from the yarn-dyed fabric image, the transmission sequence images are processed first. Take P1 and N1 of #1 sample as an example; the specific processing methods are as follows.
Fourier analysis to determine the yarn location
According to the Fourier theorem, any signal can be represented by the sum of sine and cosine waves with various amplitudes and frequencies. 19 The Fourier spectrum is ideally suitable for describing the directionality of periodic patterns in gray-level images of texture. The power spectrum can be generated from the fabric image by a two-dimensional (2D) discrete Fourier transform (DFT). The 2D DFT is defined as20–22

where f(x, y) is the gray level at (x, y) in the original image of size M × N. u = 0, 1, 2, …, N – 1 and v = 0, 1, 2, …, M – 1 are the frequency variables. After 2D DFT, the power spectrum of the original image is shown in Figure 4(c).
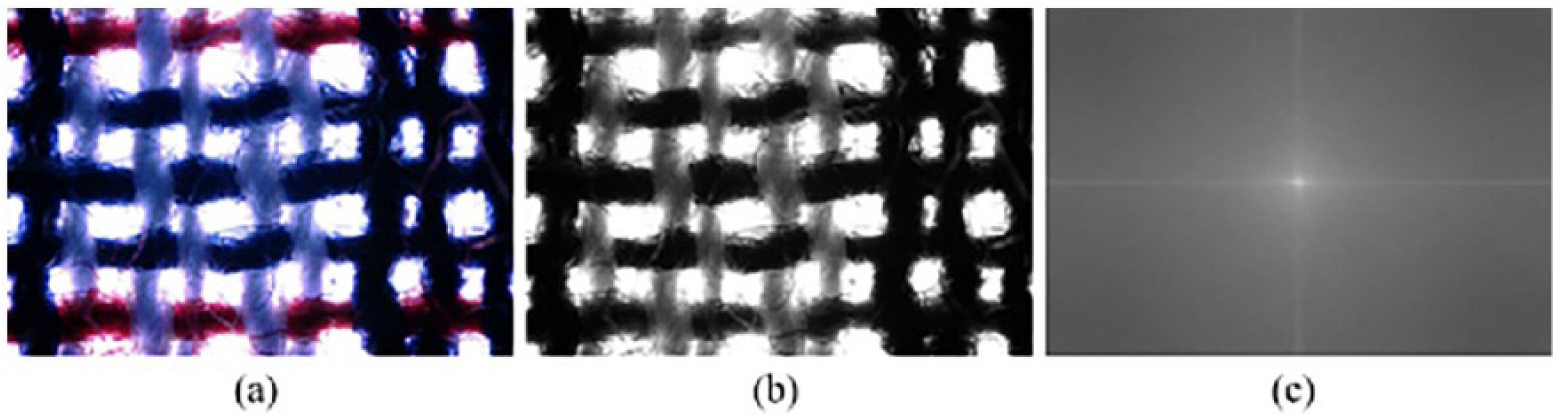
Results of 2D DFT: (a) original image of transmitted light; (b) grayscale image; and (c) power spectrum image.
The frequency components of the center stripe in the power spectrum can be extracted to reconstruct the fabric image. 20 The directional lines of texture can be removed by detecting the corresponding high-energy frequency components in the Fourier domain image and setting them to 0. 9 In Figure 4(c), two centerlines of the vertical and horizontal directions are retained and others are set at 0. The resulting images are shown in Figure 5(a1) and (a2). Then, after an inverse 2D DFT of such a reduced spectrum, a reconstructed image where only one set of yarns remains can be obtained, as shown in Figure 5(b1) and (b2). The inverse 2D DFT is defined as20–22


The process of determining yarn locations: (a1) the centerline of the vertical direction in Figure 4(c); (a2) the centerline of the horizontal direction in Figure 4(c); (b1) reconstructed image of the image in (a1); (b2) reconstructed image of the image in (a2); (c1) the smoothed projection curve of the image in (b1); (c2) the smoothed projection curve of the image in (b2); (d1) the weft yarn locations; and (d2) the warp yarn locations.
The reconstructed image is projected in the horizontal and vertical directions, respectively, to obtain the projection curves and detect the yarn locations. After smoothing these curves, the projection curves are shown in Figure 5(c1) and (c2). In the two figures, the abscissa indicates the number of rows or columns of the image, and the ordinate represents the sum of image pixels. By searching the valley values, the yarn locations can be confirmed. The determined locations of weft yarn and warp yarn are shown in Figure 5(d1) and (d2), respectively.
Image segmentation and arithmetic operations to determine the locations of weave point
From the gray-level histogram of the transmission grayscale image (as shown in Figure 4(b)), it is easy to obtain a threshold value to segment the grayscale image because the intensity value of the background is high. The gray-level histogram is shown in Figure 6(b), and the intensity value of background can be retained as shown in Figure 6(c).

Image segmentation: (a) grayscale image; (b) gray-level histogram; and (c) binary image.
From Figure 6(c), we can see that some fabric porosities (white points) are decentralized and some disappear after image binarization. Thus, arithmetic operations are applied to complement the fabric porosities based on the yarn locations in this article. The detailed steps are given to verify the locations of weave points as follows:
Step 1. Use the yarn locations to separate Figure 6(c) into blocks, as shown in Figure 7(a).
Step 2. Count the number of white pixels in each block. If the number is more than 5 pixels, then search the minimum column and maximum column of the white point for each row and the minimum and maximum rows of the white point for each column in each block. And fill in white pixels from the minimum column (row) to the maximum column (row). If the number is less than 5 pixels, then this block’s center and its neighbor pixels are filled in white pixels. The resulting image is shown in Figure 7(b).
Step 3. Apply four adjacent blocks to initially determine the location of each weave point. As shown in Figure 7(b), the bottom right corner’s coordinates of the white points in Block 1, the bottom left corner’s coordinates of the white points in Block 2, the top right corner’s coordinates of the white points in Block 3, and the top left corner’s coordinates of the white points in Block 4 are utilized to constitute an initial weave point, as shown in Figure 7(c).
Step 4. Combining Figure 7(c) and the reflection image, it can be found that the initial weave point includes some wrong information, as the white quadrilaterals shown in Figure 7(d). So the maximum inscribed rectangle of the initial weave point is used to obtain the final weave points (the blue rectangle in Figure 7(d)).
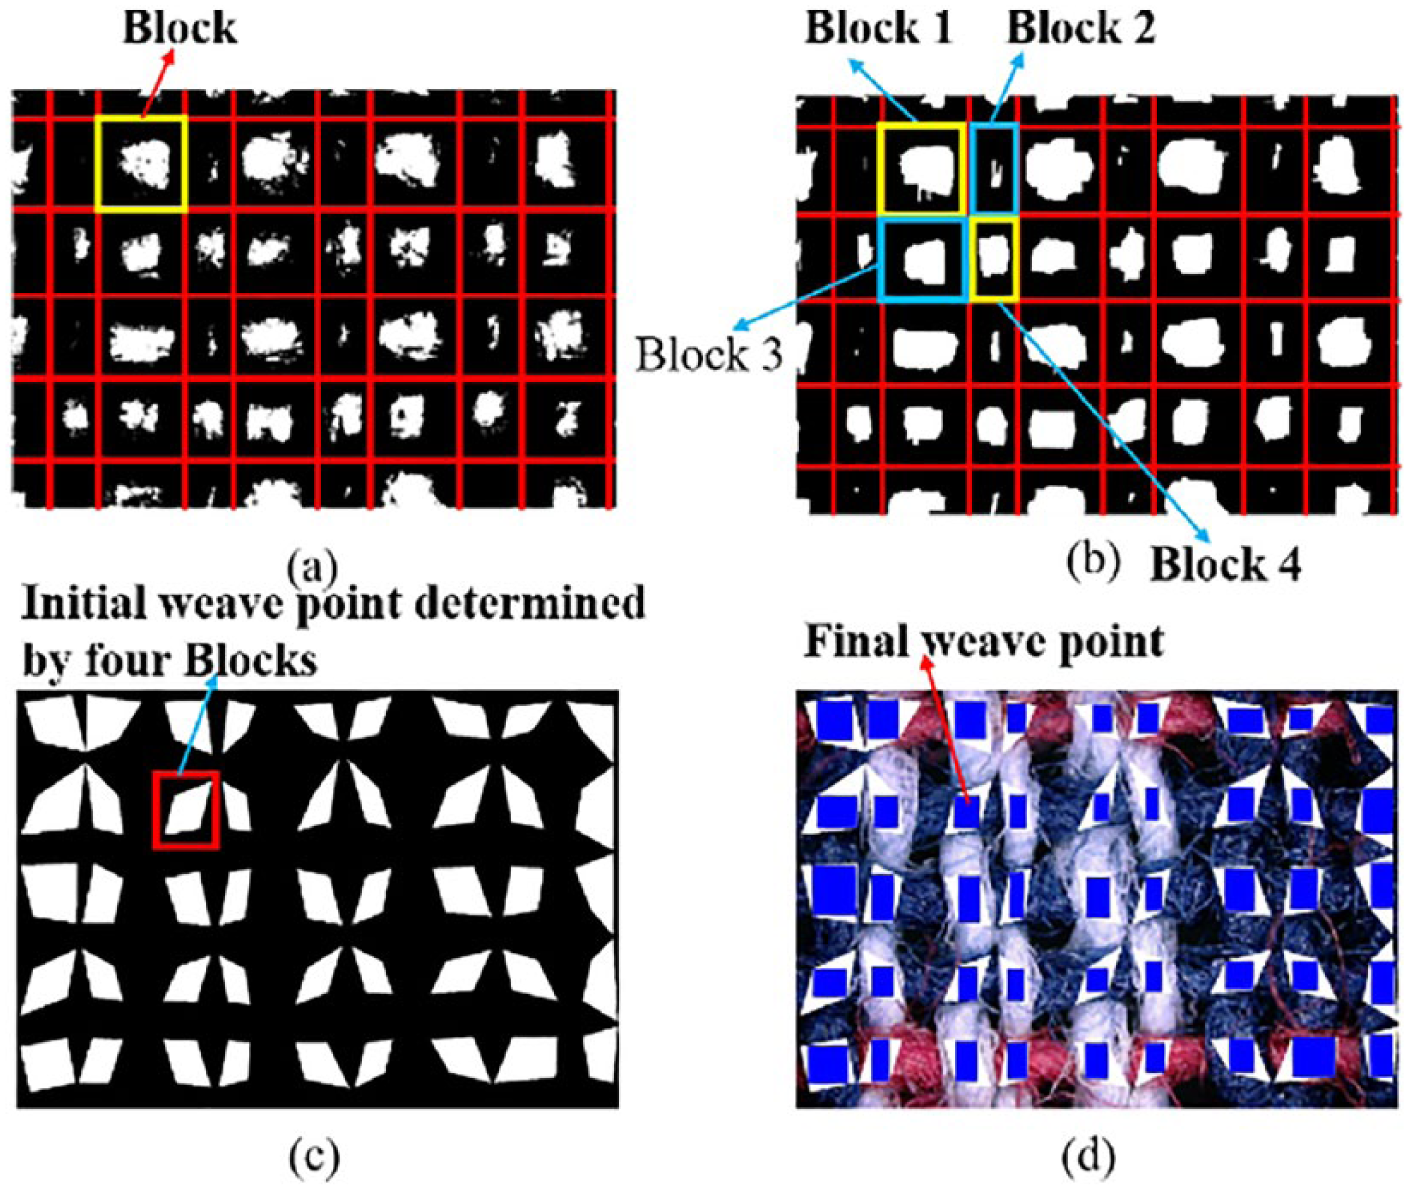
Confirming the locations of weave point: (a) binary image with grid and blocks; (b) complementing the binary image; (c) initial weave point; and (d) final weave point.
Extraction of color information from the reflection sequence image
In this section, the sRGB color information of each weave point in the reflection sequence images is extracted. Because the reflected LED light is set to be similar to the CIE D65 light, the sRGB color value can be transferred into the CIE L*a*b* value using the following equations: 23
1. sRGB to XYZ color space

where r, g, and b represent the linearized gray values obtained from the three channels of the sRGB color space, respectively.
2. XYZ to L*a*b* color space

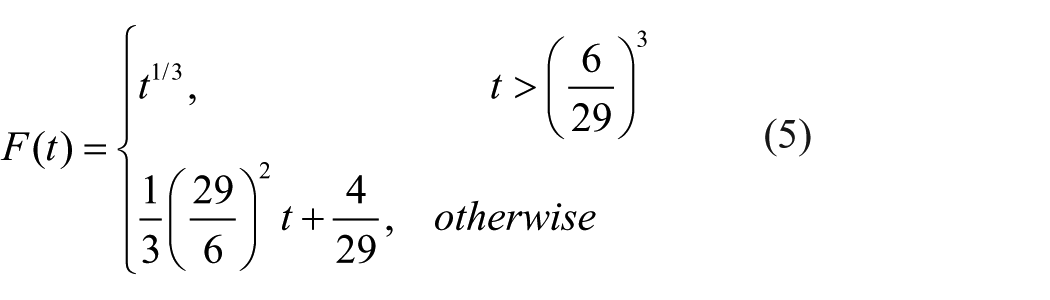
where Xn, Yn, and Zn are obtained from the r, g, and b values corresponding to the sRGB stimulus of the white reference. After conversion, the values of L, a, and b will range from 0 to 100, –128 to +128, –128 to +128, respectively. Then the values of L, a, and b are normalized at [0, 1].
For yarn-dyed fabric image, the warp yarn and weft yarn may have the same color in a local sequence image. In this case, the cluster method cannot be used. Therefore, Euclidean distance DE of the L*a*b* average values is calculated between the weave points using equation (6). A threshold value T is set to judge the color number of all the weave points. If DE < T, it means that the weave points of the detected image have only one color, and this image will be skipped and the next image will be considered. Otherwise, the weave points have more than one color, and the X-means clustering algorithm is applied to classify the colors based on the L*a*b* values. After testing many times, T is set at 60 in this article

where (L1, a1, b1) and (L2, a2, b2) are the L*a*b* average values of two weave points, respectively.
Color and weave pattern recognition
Color pattern recognition
To determine the color pattern of the weave points which have more than one color automatically, the extended version of K-means, X-means, 24 is applied. For a data set, we first specify a range [K1, K2] in which the true cluster number k lies acceptably. Then the K-means algorithm is carried out from K1 to K2 based on an evaluation function DB(k). 25 The function is defined as

where k is the cluster number where k ∈ [K1, K2], Cij is the distance between class Ci and class Cj, Wi is the average distance from all sample data in class Ci to its cluster center, and Wj is the average distance from all sample data in class Ci to the center of class Cj.
The optimal cluster number can be attained when the DB value is the minimum. 23 The cluster results of weave points extracted from Figure 7(d) using the X-means clustering algorithm are shown in Figure 8. The DB values are drawn in Figure 8(a) when K1 = 2 and K2 = 10. From the figure, it can be seen that the optimal cluster number of Figure 7(d) is 3. The clustering category labels are shown in Figure 8(b).
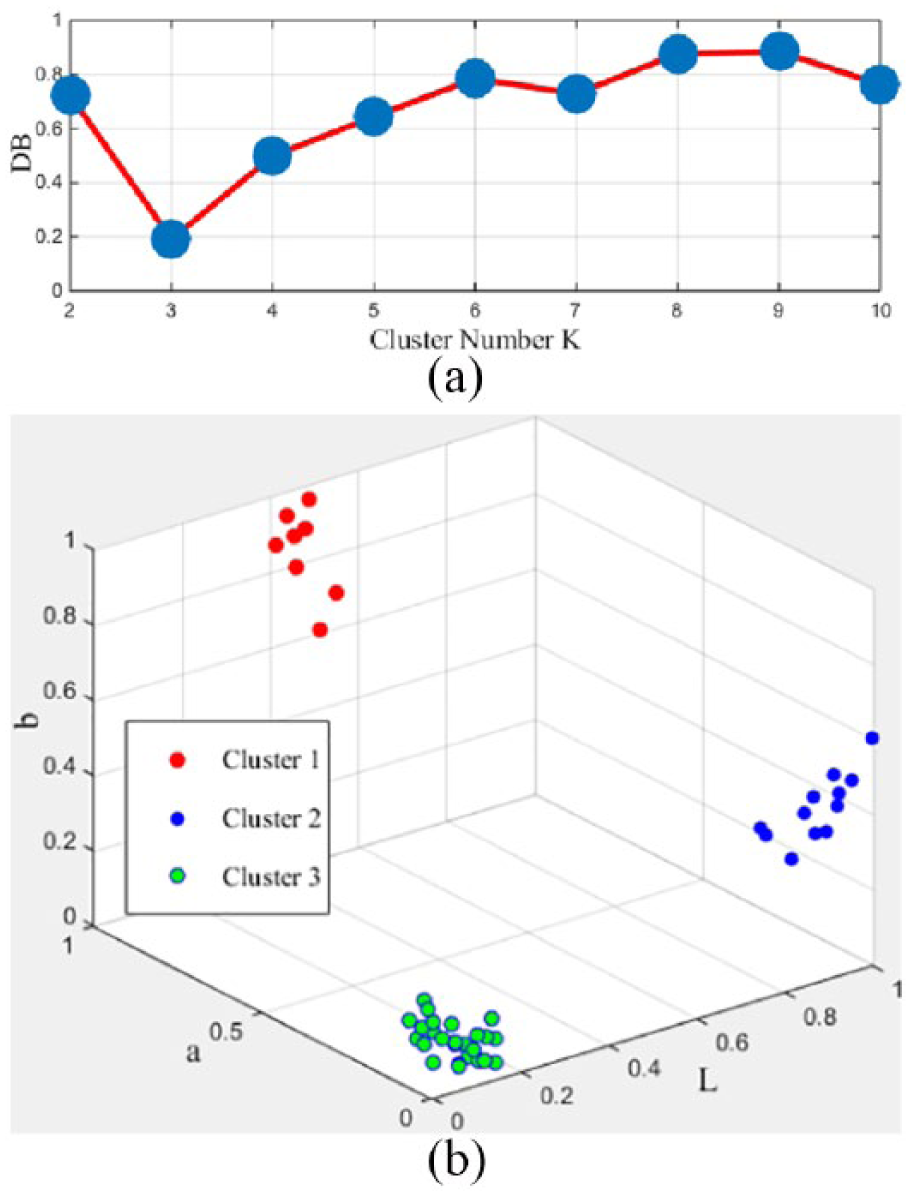
X-means clustering results: (a) DB values and (b) clustering category label.
After X-means clustering, the color pattern and color matrix of Figure 7(d) are shown in Figure 9. In Figure 9(b), “1” represents dark blue, “2” represents dark white, and “3” represents dark red.

(a) Color pattern and (b) color matrix of Figure 7(d).
Weave pattern recognition
Preliminary recognition
This component focuses mainly on the process of recognizing weave pattern partly according to the color pattern and color matrix obtained in section “Color pattern recognition.” It can be divided into two steps:
Step 1. Confirm the color of warp and weft yarn and ensure the rationalization.
The color of the warp or weft yarn of a column or row in the color matrix is simply the color with the highest frequency in this column or row by investigating the yarn-dyed fabrics.2,3,6 Using this theory, the colors which appear most frequently in each row and column are considered to be the color of each weft and warp yarn, as shown in Figure 10. In the figure, “×” indicates that the color of yarn cannot be decided because two or more colors have the same frequency in each row or column.
Step 2. Infer the IWP matrix based on the wrap and weft yarn’s colors.
Let CM represent the color matrix (as shown in Figure 9(b)) and WP represents the weave pattern matrix. The matrixes CM and WP have the same size. Then each element WP(i, j) in the weave pattern matrix WP can be inferred as follows:2,3
1. If the color of CM(i, j) is the same as the corresponding warp yarn color and the corresponding weft yarn color cannot be decided or the color of CM(i, j) is the same as the corresponding weft yarn color and the corresponding warp yarn color cannot be decided, WP(i, j) cannot be inferred and it is a fuzzy float.
2. If the color of CM(i, j) is the same as the corresponding warp yarn color and different from that of the corresponding weft yarn, it must be a warp float with WP(i, j) = 1.
3. If the color of CM(i, j) is the same as the corresponding weft yarn color and different from that of the corresponding warp yarn, it must be a weft float with WP(i, j) = 0.
4. If the color of CM(i, j) is the same as the corresponding warp and weft yarn color, WP(i, j) cannot be inferred and it is a fuzzy float.
Following these rules, the IWP matrix should be shown as in Figure 11(b) according to Figure 10. In Figure 11(b), “×” indicates that the float situation of the weave points cannot be decided, “1” represents the warp float, and “0” represents the weft float.

Determining the color of each warp and weft yarn.

The result of preliminary recognition: (a) color matrix and (b) IWP matrix.
Weave pattern database
In the above section, a part of weave pattern is obtained. However, the whole weave pattern of LSRT images cannot be affirmed. Therefore, a series of sequence images are detected for obtaining their IWP matrixes. Then these IWP matrixes are entered into the weave pattern database to verify the whole weave pattern.
In the weave pattern database, some basic woven patterns are included. Because the woven pattern’s size of all the sequence images are less than 15 × 15, the weave pattern matrix of each basic woven pattern is set at 15 × 15, the warp float is set at “1,” and the weft float is set at “0.” To discriminate different woven patterns, each pattern is stored with the four parts in the database: “Pattern ID,” “Basic Pattern Matrix,” “Weave Pattern Name,” and “Weave Pattern Matrix,” as shown in Figure 12.
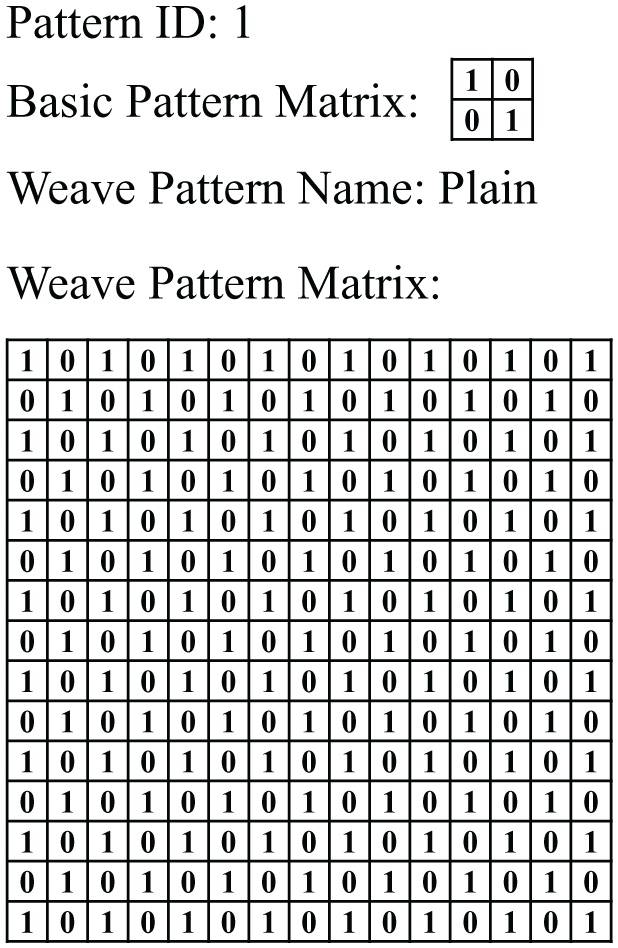
Four parts of plain weave in the weave pattern database.
Precise recognition
In section “Preliminary recognition,” a part of weave pattern is recognized based on the color pattern. To obtain the whole weave pattern, the values (“1” and “0”) in each position of Figure 11(b) are applied to match each weave pattern’s “Weave Pattern Matrix” in the database. The matching principle is shown in Figure 13.

The schematic diagram of matching.
In Figure 13, a matrix, which has the same size as the IWP matrix, is used as a template to traverse the plain’s “Weave Pattern Matrix” from top to bottom, left to right first. When the locations of the 0 and 1 values of the template in the “Weave Pattern Matrix” match exactly with those in the IWP matrix, the traversal is terminated. All the IWP matrixes of a fabric sample are utilized to carry out the above process. And if the matching numbers of “0” and “1” between the IWP matrix and the “Weave Pattern Matrix” equal the total number of the “0” and “1” values in each IWP matrix, the number will be recorded. In the optimal matching result, most of the recorded numbers in one fabric sample are not 0. Thus, the “Pattern ID,” “Basic Pattern Matrix,” and “Weave Pattern Name” of the optimal matching result will be output.
Results and discussion
Color pattern recognition results for two yarn-dyed fabric samples
In this section, all of the #1 and #2 samples, which are shown in Figure 3, are processed using the above methods. The identified results of color pattern are shown in Figure 14.

The identified results of the color pattern of two yarn-dyed fabric samples: (a) results of #1 sample and (b) results of #2 sample. (a11–b11) Results of P1 and N1; (a22–b22) results of P2 and N2; (a33–b33) results of P3 and N3; (a44–b44) results of P4 and N4; (a55–b55) results of P5 and N5; (a66–b66) results of P6 and N6; (a77–b77) results of P7 and N7; and (a88–b88) results of P8 and N8.
Weave pattern recognition results for two yarn-dyed fabric samples
From Figure 14, we can see that the color pattern results of eight sequence image pairs in two samples are identified correctly using the proposed method. Then the IWP matrixes are obtained based on the methods proposed in section “Preliminary recognition.” The 16 results of the two samples are shown in Figure 15.
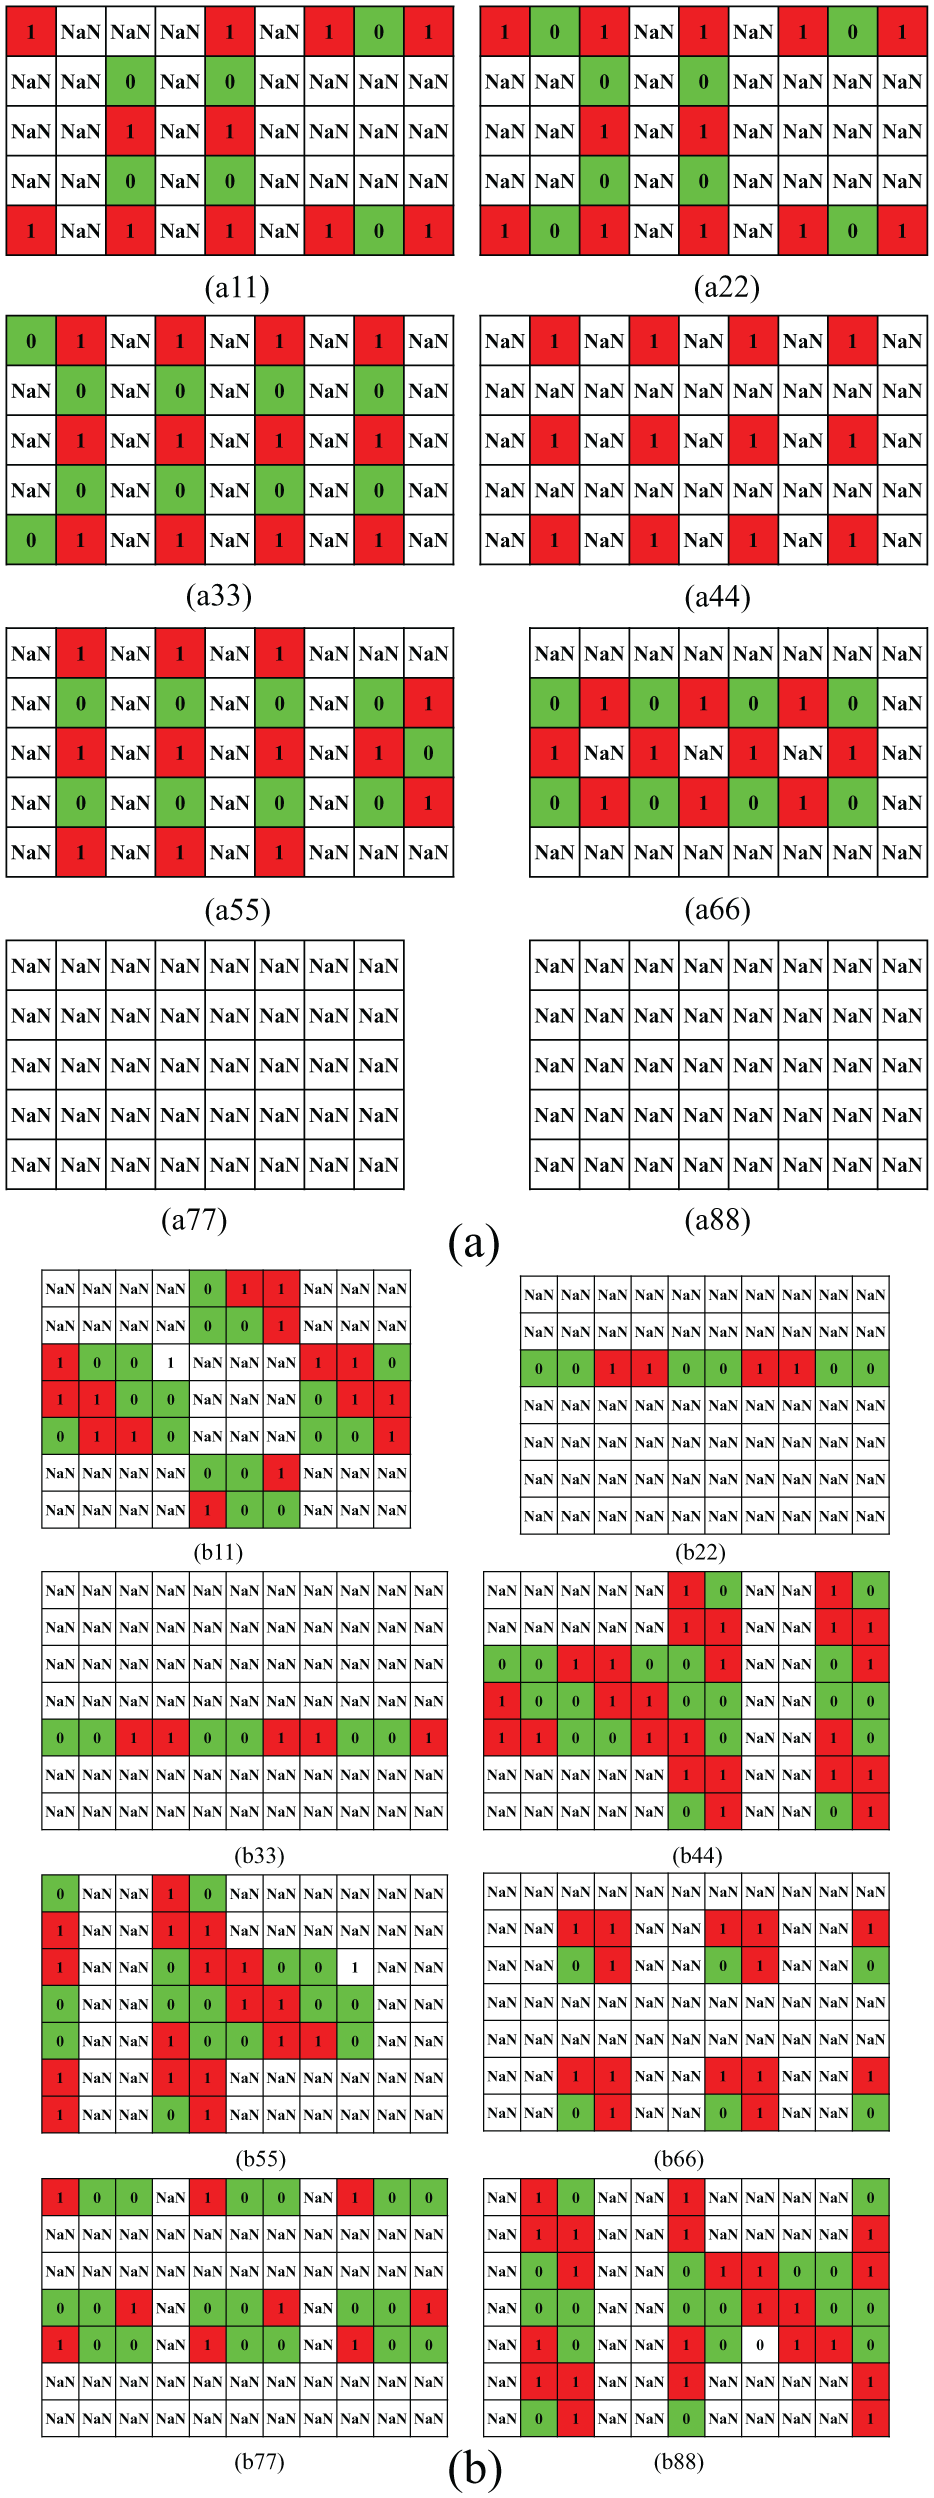
Preliminary recognition results of the weave pattern of two yarn-dyed fabric samples: (a) IWP matrixes of #1 sample and (b) IWP matrixes of #2 sample. (a11–a88) Results of images P1–P8 in #1 sample and (b11–b88) results of images P1–P8 in #2 sample; “NaN” indicates that the float situation of the weave points cannot be decided.
From Figure 15(a77) and (a88), we can see that all the matrix elements are “NaN.” It means that we cannot determine the warp float and weft float from their color pattern. Therefore, the locations of the “1” and “0” values in Figure 15(a11) to (a66) and (b11) to (b88) are applied to match all the “Weave Pattern Matrix” in the weave pattern database. If the matching numbers of the “1” and “0” values equal the total number of the “1” and “0” values in each IWP matrix, these numbers are drawn as shown in Figure 16.

Matching numbers of two samples: (a) #1 sample and (b) #2 sample.
All six IWP matrixes of Figure 16(a11) to (a66) have the same match numbers with “Pattern ID 1” and all eight IWP matrixes of Figure 16(b11) to (b88) have the same match numbers with “Pattern ID 18.” Therefore, the whole weave pattern of #1 sample is “Plain” and the whole weave pattern of #2 sample is “Twill 2/2↖.” In the figure, there are some different points. These points indicate that a single IWP matrix can match more than one basic weave pattern. So the sequence IWP matrixes must be used to detect the whole weave pattern of the yarn-dyed fabric in this article.
In order to display the matching results clearly in Figure 16, we just show a small portion of the database. Till now, the color pattern and weave pattern of yarn-dyed fabric are all recognized by the proposed method in this study.
There are also some limitations of the proposed method: (1) The proposed method may not suitable for the yarn-dyed fabric which has similar color of warp yarn and weft yarn in the L*a*b* color space. (2) The situation of the tilted fabric is not discussed in this article because it will increase the calculation time for finding the inclined angle and rotating it. Thus, the tester is required to straighten the fabric samples as much as possible. (3) In the proposed method, four angle positions of fabric porosity are applied to determine the location of each crossover point. Therefore, a relatively large image resolution is required for obtaining more accurate color information.
Conclusion
In this article, an intelligent inspection method is proposed to detect the color pattern and weave pattern of yarn-dyed fabric automatically based on the LSRT images, which consists of transmission sequence images and reflection sequence images. The transmission sequence images are processed to position the weave points, and the L*a*b* values of these weave points in reflection sequence images are applied to calculate Euclidean distance (DE). A threshold value T is set to cluster the DE value into two parts. After several trials in the experiment, T is set at 60. If DE < T, the weave point has only one color, and this image will be skipped and the next image will be considered. If DE > T, the weave point has more than one color. Then the X-means clustering algorithm is utilized to classify weave points based on the minimum DB value, and the color pattern and color matrix of each weave point are obtained.
In weave pattern recognition, IWP matrixes are identified first based on the obtained color matrixes. Then eight IWP matrixes of one fabric sample are input into the established weave pattern database to match the optimal result.
Experiments on actual fabrics indicate that the proposed method can recognize the color and weave pattern of a yarn-dyed fabric. It also can realize the true identity of fabric structural parameter automation. The proposed method provides a basis for detecting the layout of color yarns online.
Footnotes
Declaration of conflicting interests
The author(s) declared no potential conflicts of interest with respect to the research, authorship, and/or publication of this article.
Funding
The author(s) disclosed receipt of the following financial support for the research, authorship, and/or publication of this article: The authors would like to acknowledge the Research Innovation Program for College Graduates of Jiangsu Province (No. KYLX_1132); the China Postdoctoral Science Foundation Funded Project; the China Postdoctoral Science Foundation Funded Project (2018M640453); the Fundamental Research Funds for the Central Universities (JUSRP11805); the Jiangsu Province Postdoctoral Science Foundation (2018K037B); the National Natural Science Foundation of China (61802152); and the Natural Science Foundation of Jiangsu Province (BK20180602).