
Abstract
Background
Reverse total shoulder arthroplasty (rTSA) offers tremendous promise for the treatment of complex pathologies beyond the scope of anatomic total shoulder arthroplasty but is associated with a higher rate of major postoperative complications. We aimed to design and validate a machine learning (ML) model to predict major postoperative complications or readmission following rTSA.
Methods
We retrospectively reviewed California's Office of Statewide Health Planning and Development database for patients who underwent rTSA between 2015 and 2017. We implemented logistic regression (LR), extreme gradient boosting (XGBoost), gradient boosting machines, adaptive boosting, and random forest classifiers in Python and trained these models using 64 binary, continuous, and discrete variables to predict the occurrence of at least one major postoperative complication or readmission following primary rTSA. Models were validated using the standard metrics of area under the receiver operating characteristic (AUROC) curve, area under the precision–recall curve (AUPRC), and Brier scores. The key factors for the top-performing model were determined.
Results
Of 2799 rTSAs performed during the study period, 152 patients (5%) had at least 1 major postoperative complication or 30-day readmission. XGBoost had the highest AUROC and AUPRC of 0.681 and 0.129, respectively. The key predictive features in this model were patients with a history of implant complications, protein-calorie malnutrition, and a higher number of comorbidities.
Conclusion
Our study reports an ML model for the prediction of major complications or 30-day readmission following rTSA. XGBoost outperformed traditional LR models and also identified key predictive features of complications and readmission.
Introduction
Reverse total shoulder arthroplasty (rTSA) uses a spherical glenoid and concave humeral prosthesis to provide the deltoid with a mechanical advantage in patients with a deficient or damaged rotator cuff. 1 The altered biomechanics of rTSA enable the treatment of complex shoulder pathologies including primary glenohumeral arthritis with significant glenoid deformity, rotator cuff arthropathy, pseudoparalysis due to rotator cuff tear, proximal humerus fractures, tumor and rheumatoid arthritis.1–4 The incidence of rTSA has increased exponentially over the past decade with some models projecting a 90% to 350% growth in rTSA volume between 2017 and 2025. 5 Though rTSA has enabled the treatment of conditions beyond the scope of traditional anatomic total shoulder arthroplasty (aTSA), the surgery is associated with a particularly high rate of postoperative complications, often reported as greater than 15%.6–11 As the incidence and indications for rTSA continue to rise and expand, research efforts have been directed towards identifying preoperative risk factors that may help identify patients at risk for perioperative complications. Despite successful attempts to study singular factors such as operative indication or surgeon experience, there is still a need for accurate comprehensive risk stratification to meaningfully improve safety and lower costs associated with rTSA.7,12,13
The subjective and multifactorial nature of surgical outcomes has long been a challenge for clinical research in orthopedic surgery. Machine learning (ML) methods offer a means of accounting for many variables and identifying nonlinear relationships between these factors that can overwhelm traditional regression techniques. Following early adoption for radiographic purposes, ML has been increasingly applied to clinical questions.14,15 The growing availability of accessible data sets and ML models, including a variety of ensemble methods that promise greater accuracy and efficiency, offers an opportunity to analyze complex problems like postoperative outcomes from a novel and holistic perspective.16–20
The aims of this study are to (1) implement an ML model to predict patients at risk of at least one major postoperative complication or 30-day readmission for any cause following rTSA, (2) compare the performance of our model to a traditional logistic regression (LR) model, and (3) compare which features have the most predictive power between our most accurate ML model and LR. We hypothesized that an ensemble ML model would outperform a traditional LR model and that feature analysis would reveal novel variables that correlate with the risk of complications.
Methods
Data
We retrospectively reviewed California's Office of Statewide Health Planning and Development (OSHPD) database, which contains longitudinal patient and inpatient procedure information across all licensed nonfederal hospitals in California. Inclusion criteria were patients older than 18 from 1 October 2015 to 13 December 2017 who underwent primary rTSA based on International Classification of Diseases, Tenth Revision, (ICD-10-CPS) codes. The principal inclusion codes were: 0RRJ00Z, 0RRK00Z. Per the 2020 Procedure-Specific Complication Measure Updates and Specifications Report, patients were excluded if they had discharge diagnosis codes for fracture of the upper extremity/shoulder girdle, concurrent revision, resurfacing, or implanted device/prosthesis removal, mechanical complications, malignant neoplasm of the upper extremities/shoulder girdle, bone/bone marrow or a disseminated malignant neoplasm.
Following the selection of patients in the database who underwent primary rTSA, we identified the incidence of readmission for major complications: myocardial infarction, pneumonia, sepsis, pulmonary embolism, wound infection, surgical site bleeding, mechanical complication, or 30-day readmission. Myocardial infarction, pneumonia, and sepsis were included if they occurred during the initial admission or within 7 days. Pulmonary embolism was included if it occurred during the initial admission or within 30 days and wound infection and surgical site bleeding were included if they occurred within 90 days. Readmission for any cause within 30 days following index rTSA was also included. These complications and timeframes were identified using ICD-10 codes adapted from the performance by the Centers for Medicare and Medicaid (CMS) for total joint replacement. 21
The patient features (explanatory variables) available in the OSHPD data included demographic characteristics (age, gender, race, ethnicity, and insurance type) while medical comorbidities were defined using the CMS hierarchical condition category risk adjustment model. Hospital characteristics included academic teaching status and hospital volume of rTSA. These variables served as features for our ML models.
ML Modeling
We utilized 5 publicly accessible ML methods including LR and 4 benchmark ML methods—random forest, 22 adaptive boosting (AdaBoost), 23 gradient boosting machines (Gradient Boosting), 24 and extreme gradient boosting (XGBoost). 25 We implemented LR, random forest, AdaBoost, and Gradient Boosting using the scikit-learn Python library 26 and XGBoost using the xgboost python library. 25 The hyperparameters (which define the mathematical limits of an ML algorithm) of each model were selected via grid search: for LR, the coefficient for L2 regularization was chosen from a set of values in a logarithmic scale between 1 × 10⁻³ to 1 × 10³; for Random Forest, Adaboost, Gradient Boosting, and XGBoost the number of trees and the maximum depth of each tree were selected from (50, 100, 200, and 300) and (2, 3, 4, and 5), respectively.
Validation
We performed 5-fold stratified cross validation, using 80% of the data set for training and 20% of the data set for testing in each iteration. For each ML model, we calculated the area under receiver operating characteristic (AUROC) curve, area under the precision–recall curve (AUPRC), and Brier score, reported as a mean and standard deviation. The AUROC is used extensively across all ML applications to measure classifier performance. The receiver operating characteristic (ROC) curve plots the true positive rate against the false-positive rate, and the AUROC reflects the predictive power of the model—an AUROC of 1 suggests perfect classification and an AUROC of 0.5 indicates no discriminative power. 27 Precision–recall curves plot sensitivity against the positive predictive value and are used for imbalanced or skewed data sets with small numbers of positive cases. Unlike the AUROC, the baseline for AUPRC is equivalent to the proportion of positive cases in the data set. Predictive power is reflected by an AUPRC greater than this baseline value, so in an imbalanced data set with few positives, an AUPRC well >1 but well above the baseline may still suggest a strong model. 28 Finally, the Brier score represents a cost function based on the probability predicted by the model and the actual outcome. A well-calibrated model, which has probabilistic confidence comparable to its prediction accuracy, will have a Brier score closer to 0, while a poorly calibrated model will have a Brier score closer to 1. 29 The performance scores (AUROC, AUPRC and Brier scores) were generated to the 15th decimal but rounded to the third decimal in this study for brevity.
Feature Analysis
To determine what features were most important to the top-performing ML benchmark and LR algorithms, we applied Friedman's partial dependance function, 24 which calculates the marginal effect of each variable on the model's prediction. The continuous variables were standardized to zero mean and unit variance, and the categorical variables were one-hot encoded.
Results
Demographics
A total of 2799 rTSAs were performed during the study period and met inclusion and exclusion criteria. In total, 51%of the cohort was male with median age of 69 and an interquartile range of 12. A summary of demographics and patient features is provided in Table 1. We identified 142 (5.1%) patients with at least 1 major postoperative complication or readmission within 30 days of the index surgery for any cause. The all-cause 30-day readmission rate was 2.7% and wound infection was the most common major complication (0.8%). The incidence of each complication is documented in Table 2.
Baseline Cohort Demographics.
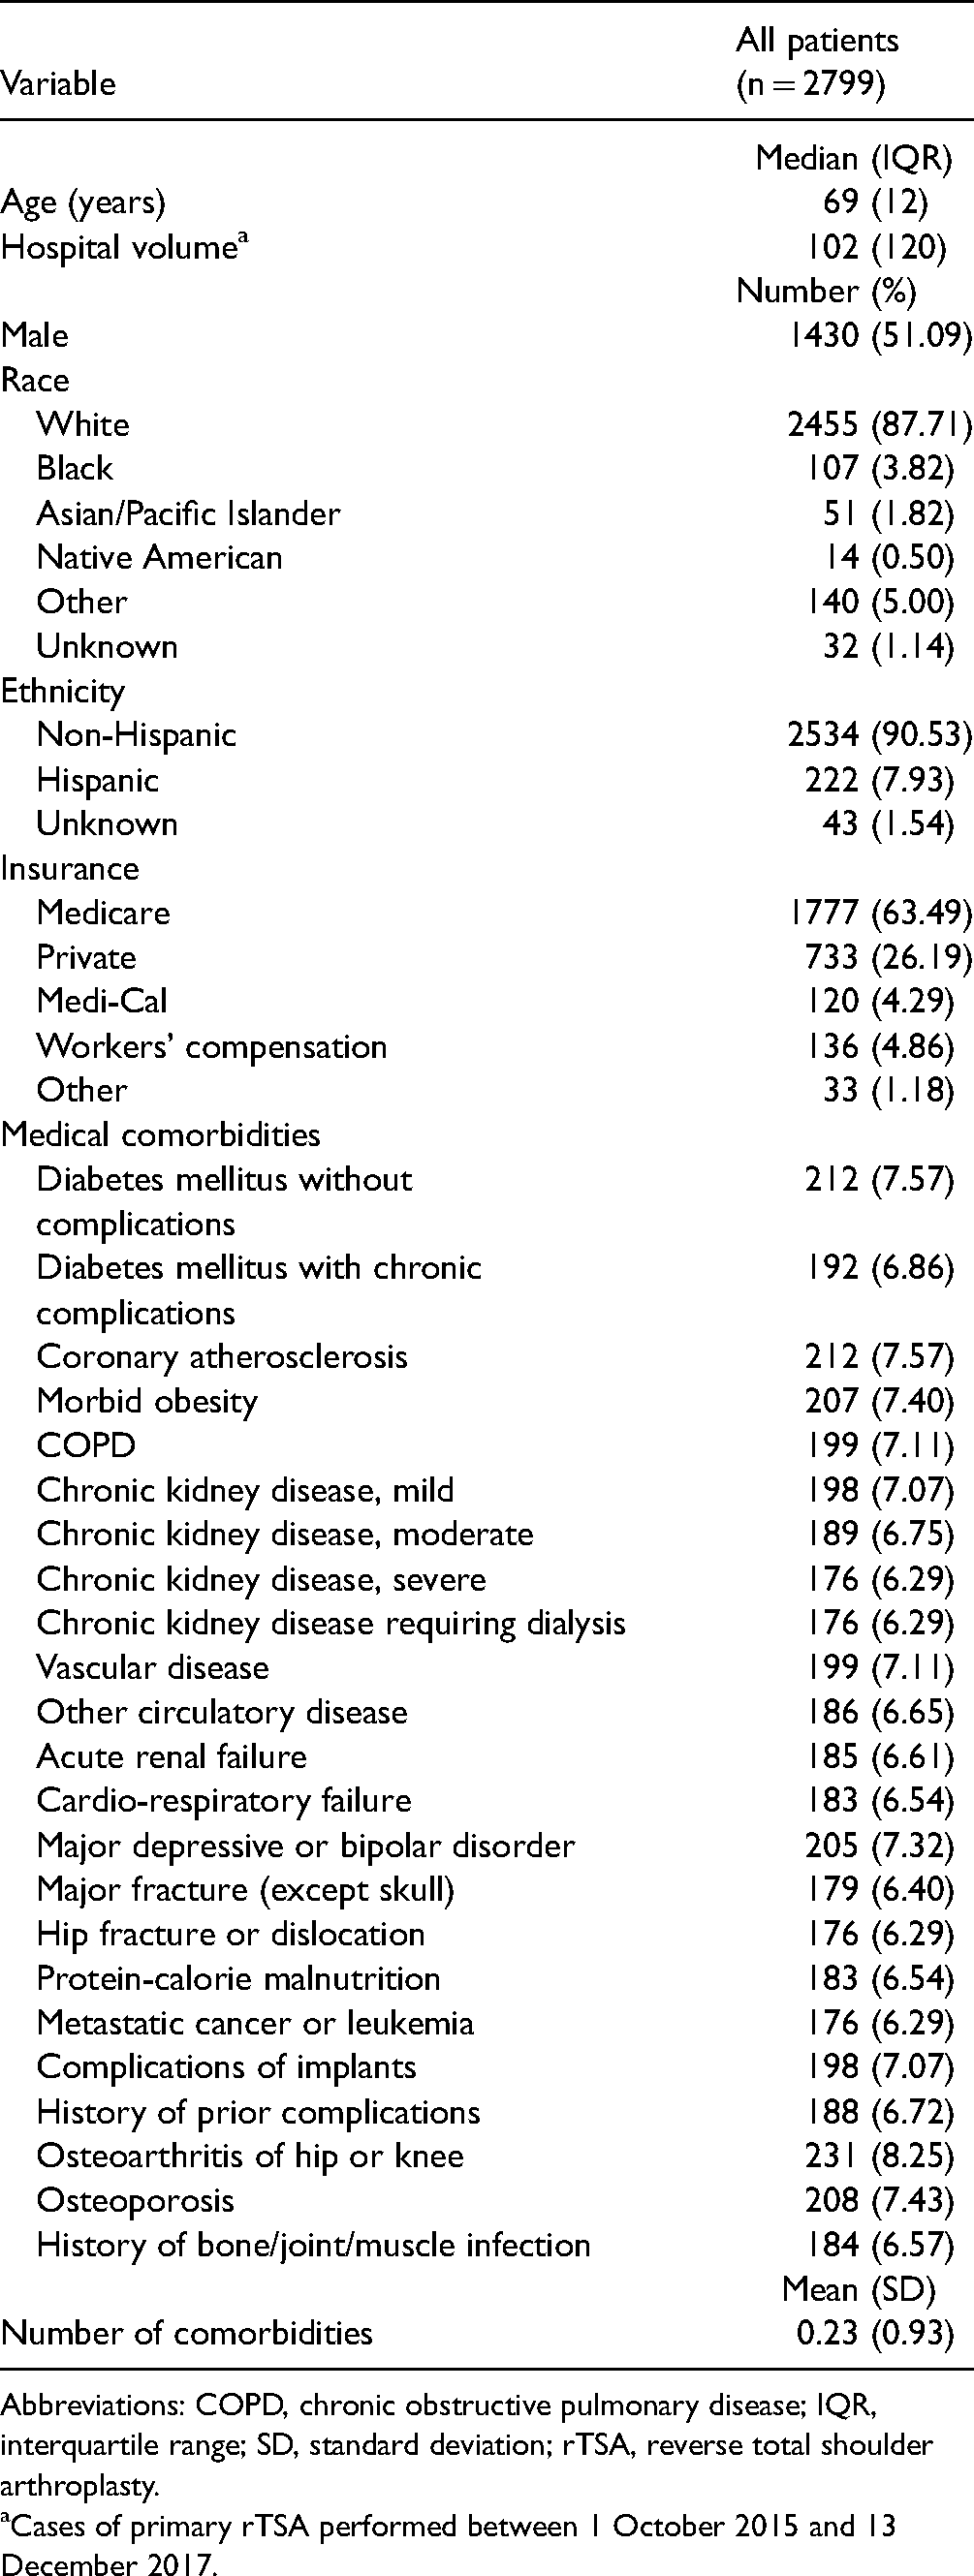
Abbreviations: COPD, chronic obstructive pulmonary disease; IQR, interquartile range; SD, standard deviation; rTSA, reverse total shoulder arthroplasty.
Cases of primary rTSA performed between 1 October 2015 and 13 December 2017.
Major Complications and Readmission.

Model Performance
Based on the AUROC and AUPRC, XGBoost had the greatest predictive power with an AUROC of 0.681 and AUPRC of 0.129. Comparatively, LR had AUROC of 0.637 and AUPRC of 0.105. The data set baseline value used for AUPRC reference was 0.051. Random forest and gradient boosting methods had comparable AUROCs of 0.667 and 0.638 but lower AUPRCs of 0.075 and 0.104. XGBoost, random forest, gradient boosting, and LR were well-calibrated with Brier scores of 0.037, 0.044, 0.043, and 0.038, respectively. AdaBoost had an AUROC of 0.568, AUPRC of 0.082, and Brier score of 0.170. The validation results of each model are summarized in Table 3. The ROC curves and precision–recall curves of the XGBoost and LR models are depicted in Figures 1 and 2, respectively.

Area under receiver operating curve. Receiver operating characteristic curves for extreme gradient boosting (XGBoost) and logistic regression.
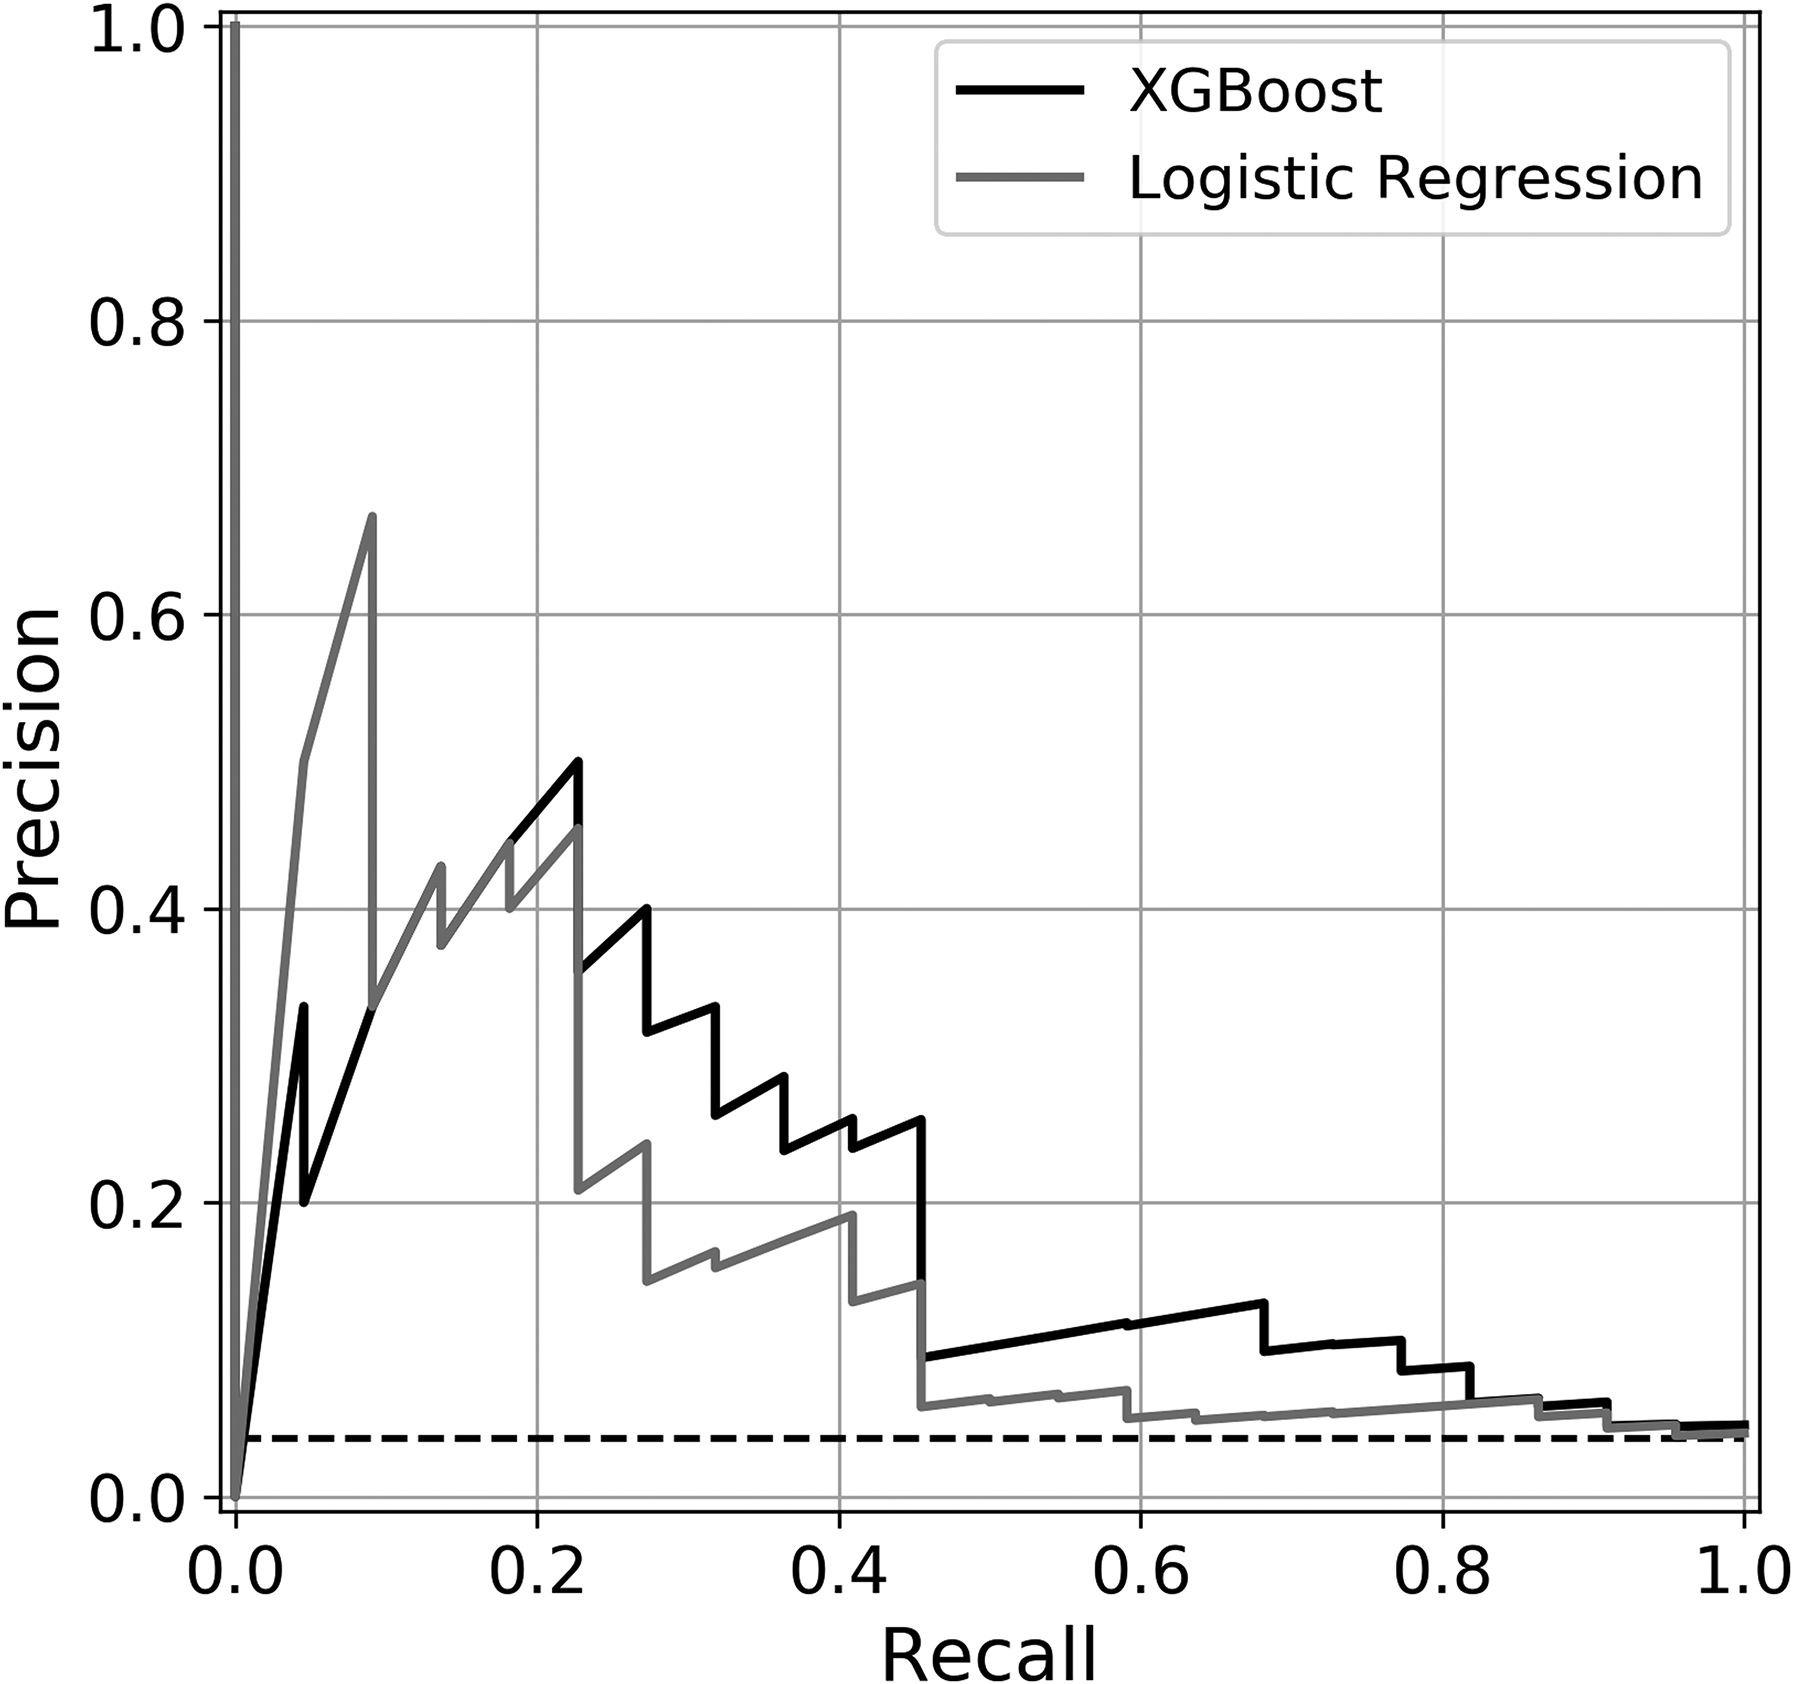
Area under precision–recall curve. Precision–recall curves of extreme gradient boosting (XGBoost) and logistic regression.
Discrimination and Calibration.
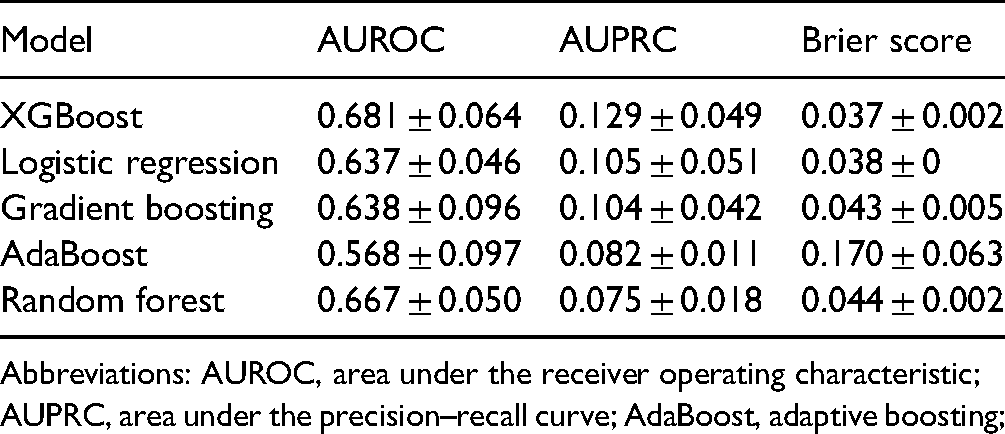
Abbreviations: AUROC, area under the receiver operating characteristic; AUPRC, area under the precision–recall curve; AdaBoost, adaptive boosting;
Feature Analysis
Given the performance results above, XGBoost was selected for feature comparison to the traditional LR model. The 6 features with the most discriminating power for each of the 2 models, as determined by the partial dependance function, are ranked in Table 4. A patient history of implant complications was the most significant feature for both models. Hospital-type was second most important for XGBoost and third most important for LR, while protein-calorie malnutrition was the second most important predictive variable for LR and third most important for XGBoost. The remainder of the listed features was distinct for each of the 2 models.
Relative Feature Importance for Complications or Readmission Following Primary rTSA.

Abbreviations: rTSA, reverse total shoulder arthroplasty; XGBoost, extreme gradient boosting.
Discussion
Much of the recent increase in TSA volume can be attributed to the exponential growth in the use of reverse TSA. 5 The expansion of surgical indications and the relatively high complication rate of rTSA when compared to its alternatives create an especially pressing need to better understand the risk factors for complications that will only increase as demand for the surgery continues to increase. ML offers a unique opportunity to process large volume multivariable data sets to generate more accurate predictive models than traditional methods.16,19,30 The purpose of this study was to create an ML algorithm to predict postoperative complications following rTSA using a statewide retrospective database. We found that XGBoost produced the most accurate predictive model with a patient history of prior implant complication being the most important patient feature to the prediction model.
Comparing multiple standard ML methods enables us to understand how different algorithms handle the data set and paves the way for the continued improvement of predictive accuracy. XGBoost was the top-performing model by AUROC and AUPRC metrics. LR has traditionally been used in clinical studies for outcome prediction, but the results of this study suggest that ensemble ML methods like XGBoost may be better equipped to handle the complex multifactorial relationships between features and postoperative complications. Though the AUPRC is more difficult to interpret than the AUROC, it is an important metric given the imbalanced data set with a minimal incidence of positive cases. Compared to the baseline reference of 0.051 the XGBoost AUPRC of 0.129 supports the findings that XGBoost provided more accurate predictions than the other methods. Compared to gradient boosting and AdaBoost, XGBoost uses model formalization to control overfitting and improve computational efficiency, which may explain the performance benefits observed in the study. All methods were well-calibrated per the Brier scores.
A few groups have previously applied ML techniques to study outcomes of TSA. 31 Kumar et al 32 analyzed 3621 primary rTSA patients using XGBoost to predict whether patients experienced a minimal or substantial clinical benefit after TSA. Their model reported AUROCs ranging from 0.70 to 0.94 depending on which outcome they were predicting and whether or not they were using an abbreviated feature set. Despite this study of clinical improvement following rTSA using ML, there is still a need to understand the specific predictors of postoperative complications. The American College of Surgeons National Surgical Quality Improvement Database database uses the same code for aTSA and rTSA, patients who underwent either procedure were treated as a single group. Utilizing this database, Gowd et al 33 and Arvind et al 34 applied ML methods using data to predict short-term postoperative complications and unplanned readmissions following shoulder replacement surgery. The AUROC of the random forest classifiers used in these studies ranged from 0.74 to 0.77.
Our study uniquely examines complications of rTSA independently, which is valuable because rTSA has different indications and a significantly greater complication rate than aTSA. The AUROC of 0.681 of our XGBoost model is comparable to the above studies, but the limited breadth of features used in the OSHPD database may explain the slightly lower value when compared to models that were trained with alternative data sets.
Both XGBoost and LR identified a patient history of implant-related complications as the feature with the most discriminating power, with teaching hospitals and protein-calorie malnutrition in either order being the second and third most significant binary features. The nature of these models does not allow us to infer causality, but it is plausible to hypothesize relationships to postoperative complications. A history of implant complications suggests a patient may be prone to further complications related to the failure of existing prostheses. Teaching hospitals may be more likely to encounter complex patients and pathologies that are more prone to complications, and patients with protein-calorie malnutrition may experience delayed recovery, increasing the likelihood of medical complications. Among the continuous variables, the number of patient comorbidities was the strongest predictor for both XGBoost and LR, which is in line with the rationale that patients with a more extensive medical history may be at greater risk of complications. XGBoost also identified increased age and lower hospital volume as having associations with postoperative complications. Walch et al 13 previously identified that less surgeon experience, which may correlate with lower hospital volumes, was associated with a greater rate of postoperative complications following rTSA.
Of note, the top features in the XGBoost model consistently had a greater influence on risk prediction than those in the LR model, suggesting that XGBoost was better able to identify and process significant features. Quantifying the impact of each feature using the partial dependance function provides key insights that can be applied to the design of future novel predictive models.
Though the design of our study enabled analysis of a large cohort, it does have limitations. The variables serving as features are dependent on ICD-10 codes and were selected from an administrative data set. This strategy enables us to process a wide range of variables but likely limits the accuracy of ML models due to the dependance on coding accuracy. Prior studies have found more specific variables such as surgeon experience and the indication for surgery to be predictors of complications in rTSA, and the data set does not allow us to directly incorporate these features into our model as a systemic chart review would.11,13 Similarly, we recognize that predicting orthopedic/implant-related complications would be clinically useful, however, were unable to do so with this particular data set. Despite the substantial size of the data set, the number of patients found to have major postoperative complications was small, reducing the number of positive cases available to train the algorithms. We consequently analyzed our validation data using AUPRC, but the lack of complications may have limited the predictive capabilities of our models. Another challenge of working with ML is that methods often operate as a black box, making it difficult to interpret the relationships that the algorithms build between variables. 35 We can intuitively explain the directionality of relationships between many features and outcomes but cannot conclusively infer causality.
Conclusion
We achieved the aims of building an ML model for the prediction of postoperative outcomes, showing the superiority of XGBoost over LR, and determining which features had the greatest discriminatory power. This model and identified prognostic features have the potential for improving preoperative decision making and the informed consent process. Additionally, this tool may hold value with risk adjustment of outcome-based performance measures and reimbursement programs. Further studies can continue to improve feature selection, aggregating the results from our feature analysis with other studies that have identified singular risk factors in rTSA to improve the accuracy of our top-performing models. Using data sets built from chart review would enable greater control of input variables at the expense of volume and offer additional insights into the relationships between patient factors and outcomes. Going forward, as we apply new techniques to improve our predictive accuracy, we hope that this study's novel application of accessible ML methods to rTSA complications offers a foundation and provides insights into ultimately helping surgeons improve patient outcomes.
Footnotes
Declaration of Conflicting Interests
The authors declared no potential conflicts of interest with respect to the research, authorship, and/or publication of this article.
Funding
The author(s) disclosed receipt of the following financial support for the research, authorship, and/or publication of this article: This study was supported in part by the H H Lee Resident Research Grant [HHLEE FAU 4414893H-62252].