
Abstract
Liquid biopsy techniques have developed rapidly in recent years and demonstrated success in cancer detection, disease characterization, and ongoing disease monitoring. These components, including circulating tumor cells (CTCs), circulating tumor DNA (ctDNA), and cell-free DNA (cfDNA), offer minimally invasive diagnostic tools that provide valuable insights into the genomic landscape of tumors. Its applications have expanded to include various malignancies, including renal cell carcinoma (RCC). RCC, a heterogeneous malignancy, poses unique diagnostic and therapeutic challenges. Up to 40% of patients experience recurrence or metastasis following initial surgical resection, necessitating the need for precise diagnostic and prognostic tools. The application of liquid biopsy in RCC, particularly through CTCs and ctDNA/cfDNA, holds significant promise. This review first delves into the various methodologies of CTC and cfDNA/ctDNA detection in RCC and highlights their roles in RCC management. Next, we discuss in depth about current existing evidence for the utilization of liquid biopsy in RCC diagnosis, prognosis, treatment outcomes prediction and association with the progression of the disease. Despite advancements, RCC's biological features, including low ctDNA shedding and significant intratumoral heterogeneity, present challenges in the clinical application of liquid biopsy. The review also discusses the limitations of current techniques and emphasizes the need for standardized protocols and further validation in large, diverse cohorts. Future directions include integrating liquid biopsy with advanced imaging techniques and leveraging artificial intelligence to improve RCC diagnostics and patient management. With continued refinement, liquid biopsy could become an essential tool in personalized oncology, improving outcomes for RCC patients.
Introduction
Liquid biopsy techniques have developed rapidly over the past decade and demonstrated success in cancer detection, disease characterization, and ongoing disease monitoring.1–3 Liquid biopsies are minimally invasive and involve the characterization of tumor-derived material from body fluid and include interrogation of circulating tumor cells (CTCs), cell-free tumor deoxyribonucleic acid (DNA) (cfDNA), circulating tumor DNA (ctDNA) cell-free RNA (cfRNA), exosomes, and tumor-derived metabolites and proteins. These markers, sourced from clinical samples such as blood, urine, pleural fluid, and ascites, offer a wealth of information for understanding and managing cancer. 4 A watershed moment occurred in 2016 when the Food and Drug Administration (FDA) approved the first ctDNA test, specifically designed to identify epidermal growth factor receptor (EGFR) gene mutations in non-small-cell lung cancer patients. This approval marked a significant landmark, rendering eligible patients for targeted EGFR-tyrosine kinase inhibitor (TKI) treatment. 5 Subsequently, these techniques have transcended specific cancer types, finding applications across a spectrum of malignancies, including bladder, kidney, liver, lung, ovarian, and other tumor types.6–9
As the incidence of renal cell carcinoma (RCC) continues to rise, the need for effective diagnostic and monitoring tools becomes increasingly evident.10–12 While localized RCC is commonly treated with surgical resection, up to 40% of patients experience local or metastatic recurrence postoperatively. 13 For patients with recurrent or metastatic disease, systemic therapy with immunotherapy combinations featuring dual immune checkpoint inhibitors (ICI) or targeted therapy involving vascular endothelial growth factor receptor (VEGFR) tyrosine kinase inhibitors combined with ICI are the mainstay of contemporary frontline treatment regimens. 13 Despite advancements, resistance often develops, emphasizing the need for robust prognostic and predictive biomarkers to guide RCC therapy selection. 4 Recognizing this unmet need in precision oncology, there is a growing emphasis on exploring noninvasive tools for early diagnosis, disease characterization, and monitoring, with a particular focus on liquid biopsy applied to blood and urine samples in RCC.
This review explores technical methods and existing studies on the application of CTCs and cfDNA/ctDNA in RCC, addressing aspects of diagnosis, prognosis, and the prediction and monitoring of therapy responses. In addition, it provides a comprehensive examination of the current applications of liquid biopsy in RCC and delves into promising future directions that hold the potential for revolutionizing cancer diagnosis and management. The review further discusses prevailing barriers and outlines steps towards the broader adoption of liquid biopsy in the context of RCC.
Methodologies of liquid biopsy detection: comprehensive analysis of CTCs and cfDNA/ctDNA
CTC assays
Tumors, whether primary or metastatic, release CTCs into the peripheral blood, and the analysis of CTC involves three key steps: enrichment, detection, and characterization. 14 CTC detection has evolved significantly since the early recognition of CTC as cancer biomarkers. In 1869, Ashworth was the first to report the presence of cells similar to the primary tumor in post-mortem blood samples. 15 Initial efforts relied on Epithelial Cell Adhesion Molecular (EpCAM)-based immunomagnetic approaches, which later expanded to include size-based isolation systems such as the CellSearch system, FDA-approved in 2004 for specific cancers. Over the years, microfluidic devices, dielectrophoresis, and combined approaches have improved detection sensitivity. 16 These advancements allowed for the identification of tumor heterogeneity and enhanced the potential for CTCs to serve as real-time biomarkers in monitoring treatment responses and disease progression.
CTC enrichment
First, enrichment is classified as either morphology-based and/or immunology-based, with no standardized enrichment methodology currently adopted, whether physical or biological property-dependent methods. 17
Morphology-Based approaches
The size-based methods capture the CTCs using their diameter (around 16–20 μm), which significantly exceeds that of other blood cells (around 8–14 μm). 18 The technologies used are the isolation by size of epithelial tumor cells (ISET, Screen Cell, Paris, France), the slit filter-based (CTC-FIND), the free selection-based (AccuCyte®-CyteFinder® system), and the CanPatrol CTC™.19–22
Other methods adopt the separation by density gradient centrifugation for CTC enrichment. 23 The whole blood is centrifuged in tubes having a porous barrier and a medium with an adequate density gradient to isolate CTCs. 24 Usually, the cells with higher density sediment at the bottom of the tube (erythrocytes and leukocytes) and those with lower density (platelets, mononuclear cells, CTCs) remain at the top, thus isolated for further analysis.25,26 While this method can provide viable cells in a timely manner, its sensitivity is low. 23
Dielectrophoresis (DEP) is another evolving method for isolating CTCs following their dielectric properties, especially their polarizability. The characteristics of the cells that are used in this method are the diameter, membrane area, density, conductivity, and volume, which allow the CTCs to be moved distinctively using dielectrophoretic field strengths to select them with accuracy.14,27–29 The DEP can also be used with a field-flow fractionation (FFF), where the cells are placed in an alternating electric field and a hydro-dynamic flow to efficiently detect one tumor cell among 105 peripheral blood mononuclear cells.30,31
Finally, systems based on microfluidic chips have also been developed in recent years to isolate CTCs based on cell size, shape, and deformability. 23 The chips use 3D geometries to create specific spaces for CTCs and non-CTC cells to promote the isolation of CTCs. 32 Examples of commercial cell separation methods are the ParsortixTM Cell Separation System (ANGLE, Guildford, UK), VTX-1 Liquid Biopsy System (Vortex Biosciences, Pleasanton, CA, USA), JETTATM (Denovo Sciences, Yerevan, Armenia), and ClearCell FX System (Genomax Technology, Bangkok, Thailand).
Immunology-Based approaches
Another approach for CTC enrichment is the magnetic-activated cell sorting system (MACS) (Miltenyi Biotec GmbH, San Jose, CA, USA). First, the superparamagnetic MACS MicroBeads are coated with antibodies against CTC surface antigens, thus labeling CTCs. Then, samples are passed through a strong permanent magnet, which retains only labeled cells to enrich the CTCs. This system has a high sensitivity, detecting CTCs in 1 per 107 blood cells. 33
CTC enrichment can also be successful using the cell adhesion matrix (CAM) invasion assay, such as the Vita assayTM (Applied DNA Sciences, Stony Brook, NY, USA). 34 The rationale is to detect invasive CTCs based on their ability to bind to, invade, and ingest a CAM, which most non-tumor and dead cells cannot do. 35 The most widely used system in this domain and the first and only FDA-approved method for CTC analysis in the metastatic setting is the CellSearch® system. This system uses ferrofluid nanoparticles to separate EpCAM cells from other blood cells after centrifugation. 36 However, in RCC, the single EpCAM antibody method has a restricted enrichment ability for CTCs. Thus, other techniques have utilized carbonic anhydrase IX, XII (CAIX, CAXII), and cytokeratin antibodies in addition to the EpCAM targeting for better results.37,38 To further enhance enrichment, negative selection techniques were used, involving multiple clusters of differentiation (CD)-based antibodies, such as CD11b and CD14 for myeloid cells and CD235a for plasma B cells. 37 Interestingly, a study comparing the efficacy of the CellSearch System and ISET favored the latter for CTC isolation in RCC. 39
Advanced integrated platforms
The VERSA platform (Versatile Exclusion-based Rare Sample Analysis) is an approach to integrate CTC capture with multiplexed molecular analyses including protein analytics and molecular characterization.40–42 VERSA was developed to use exclusion-based sample preparation (ESP) methods that leverage surface tension over gravity at the microscale for CTC isolation and multi-endpoint analyses.40,42 The ESP technology leverages microscale constrictions to stabilize the positioning of immiscible fluids side-by-side, establishing an immiscible barrier between two aqueous solutions.40,42 This approach allows for the isolation of specific analytes of interest, bound to paramagnetic particles, by pulling them through the immiscible barrier. This enables the selective extraction of the target analytes from a complex sample without causing dilution, splitting, or perturbation of the sample.40–42
CTC enrichment methods each present unique advantages and limitations. Morphology-based methods, such as size-based isolation, leverage the larger size of tumor cells relative to blood cells, offering a straightforward and rapid approach. However, these methods may miss smaller or more deformable CTCs, resulting in reduced sensitivity and the risk of false negatives, especially in cancers like RCC, where CTC morphology and size can vary significantly.23,26 Immunology-based enrichment techniques, such as magnetic-activated cell sorting (MACS) and cell adhesion assays, provide high specificity by targeting cell surface antigens, enhancing sensitivity for capturing invasive and viable CTCs. Nonetheless, their effectiveness depends on the expression of specific antigens (e.g., EpCAM), which can be inconsistent in RCC, leading to potential detection gaps. This challenge is further compounded by CTC heterogeneity, limiting the applicability of single-marker approaches.33,37,38 Advanced integrated platforms, such as the VERSA platform, enable simultaneous CTC capture and molecular analysis, facilitating multi-target profiling to create a more comprehensive tumor profile. However, these sophisticated methods are often expensive and technically demanding, requiring specialized equipment and expertise, which can restrict their use in routine clinical settings, especially in resource-limited environments.40–42
CTC detection
Nucleic-Acid-Based approaches
CTC detection can be done using nucleic-acid-based methods such as the Reverse transcription polymerase chain reaction (RT-PCR) 43 quantifying the amount of CTC-specific mRNA. 44 Multiple tumor-specific genes were previously adopted as CTC markers, such as EGFR, CEA, and CKs. 23 Although this technique has a high sensitivity, false-positive results can also occur due to the expression of some CTC markers in normal cells. 45
Cytometry-Based approaches
Cytometry-based detection methods can also be used. First, immunocytochemistry (ICC) enables the detection of tumor cells using fluorescently labeled monoclonal antibodies and automated imaging systems. 23 Flow cytometry (FC) can also detect CTCs by quantifying the surface and intracellular antigens, such as cytokeratin, using monoclonal antibodies conjugated with fluorescent dyes.46,47 Finally, automated digital microscopy (ADM) and fiber-optic array scanning technology (FAST) are other cytometry-based techniques for analyzing the image of ICC-labeled tumor cells. 23
Microscopy-Based approaches
Finally, CTCs can be detected using microscopy-based detection methods, commercialized by RareCyte® (RareCyte, Inc., Seattle, WA, USA) and CytoTrack (2C A/S, Lyngby, Denmark). 23 In this technique, the isolated CTCs from whole blood are stained with immunofluorescent dyes and analyzed using automated microscopic imaging able to perform single-cell retrieval.48,49
In summary, CTC detection methods vary in approach and effectiveness. Nucleic-acid-based methods, like RT-PCR, offer high sensitivity and specificity for tumor-specific mRNA markers, allowing precise tracking of disease progression, though false positives may arise from marker overlap with normal cells.43,45 Cytometry-based techniques, such as ICC and FC, enable rapid, multi-parametric analysis of CTCs using fluorescent antibodies, providing detailed insights into cellular markers. However, these methods require large sample volumes and specialized equipment, limiting sensitivity in low CTC scenarios.23,46,47 Lastly, microscopy-based approaches (e.g., RareCyte®, CytoTrack) offer single-cell imaging and detailed morphological analysis, useful for assessing CTC heterogeneity, though they are time-intensive and require skilled personnel, reducing their practicality for high-throughput use.23,48,49 Combining different strategies may offer a comprehensive approach to address the heterogeneity of CTCs.
cfDNA/ctDNA assays
cfDNA is defined as the genome-wide DNA released by lysis of the necrotic or apoptotic cells, whereas ctDNA is the fraction of cfDNA derived from primary tumors, metastases, or CTCs. 50 Since ctDNA carries tumor genetic information with lower levels and smaller fragments than cfDNA, it was deemed more appropriate for liquid biopsies.50–53 ctDNA has a short half-life of 16 min to 2.5 h, rendering utility for real-time assessment of disease. 54 ctDNA half-life is associated with multiple factors, including encapsulation in membrane-bound vesicles, association with protein complexes, tumor type, and treatment. Concerning the samples used, the ctDNA levels were proven higher in the plasma compared to the serum, and the levels increased with tumor burden and extent of disease.55,56 cfDNA is also detectable in the urine due to its excretion by either the tumor cells or their breakdown products in the urinary tract. 57
The history of cfDNA and ctDNA as biomarkers began with their initial discovery in circulation and their potential role as non-invasive indicators of cancer. Ellinger et al. reported that the presence of cfDNA in the bloodstream was first detected more than 50 yr ago. 58 Early assays were limited to PCR-based detection, but the integration of next-generation sequencing (NGS) has transformed ctDNA analysis, enabling the identification of genetic alterations that reflect tumor evolution. A significant milestone was the 2016 FDA approval of ctDNA testing for EGFR mutations in NSCLC, which catalyzed research into ctDNA's applications across cancer types, including RCC.5,16
cfDNA assays employ several advanced techniques to analyze target DNA molecules. The first method, real-time quantitative PCR (RT-qPCR), is utilized to assess mutation and methylation levels with precision. 4 A second, more sensitive approach is digital PCR (dPCR), which includes techniques such as droplet digital PCR (ddPCR) and BEAMing. 59 Finally, DNA sequencing can also be utilized, ranging from targeted sequencing, which offers high sensitivity, to NGS, capable of performing comprehensive whole-gene sequencing (WGS) with an expansive detection range. 60
The ctDNA assay serves two primary functions. First, it is designed to detect the presence of ctDNA in the blood with the highest possible specificity and sensitivity. This test plays a crucial role in characterizing the tumor genome by identifying actionable mutations and resistance markers, as well as monitoring genomic changes throughout the course of the disease. The ctDNA test typically adheres to two key approaches: it can either target specific regions of the genome or employ untargeted techniques such as whole-exome sequencing (WES) or whole-genome sequencing (WGS). Additionally, the test can be personalized by sequencing previously collected data from the primary tumor or a baseline plasma sample, or it can be non-personalized, requiring no prior knowledge of mutations. The choice of assay depends on the test's objectives, as well as considerations of cost and turnaround time. 61
Furthermore, DNA methylation has emerged as a valuable biomarker for RCC, offering the potential for early detection, monitoring disease progression, and predicting treatment response.62,63 Research has demonstrated the promising role of cfDNA methylation for diagnosing RCC, with diagnostic accuracy approaching 100% when multiple methylation targets are combined with cfDNA quantification. A comparison of cfDNA variant detection and methylated cfDNA detection using immunoprecipitation (cfMeDIP-Seq) revealed that cfMeDIP-Seq is significantly more sensitive (100% vs. 21%).9,64 The principle behind this method is that tumor cells acquire recurrent aberrant DNA methylation distinct from that of blood and other normal tissue cells. 64 Methylation profiles obtained through cfMeDIP-Seq from RCC patients can not only differentiate cancerous cells from normal cells, but cfDNA methylation levels have also been identified as prognostic markers and potential indicators for decisions regarding adjuvant treatment.65,66
ctDNA and cfDNA assays offer significant advantages for non-invasive cancer monitoring, providing real-time insights into tumor genetics and dynamics. ctDNA, a fraction of cfDNA specifically derived from tumors, allows for highly specific cancer detection and enables the identification of actionable mutations, resistance markers, and tumor evolution through advanced techniques like digital PCR and NGS.59–61 The short half-life of ctDNA supports its utility for real-time disease assessment.59–61 cfDNA methylation further enhances diagnostic accuracy, with studies showing nearly 100% sensitivity for RCC when multiple methylation markers are combined with cfDNA quantification.9,62–64 However, these assays face limitations: ctDNA yield is often low, especially in early-stage disease, requiring highly sensitive assays and complex processing. Additionally, the instability of ctDNA and dependence on sample handling can introduce variability. cfDNA methylation assays, while highly informative, also require precise analytical conditions to avoid false positives from non-tumor sources, as background methylation can complicate data interpretation. The costs and technical demands of ctDNA and cfDNA methylation assays may further limit their routine application, particularly in low-resource settings.9,64
Role of liquid biopsy in RCC diagnosis
DNA molecules carry significant biological information, including details like fragment sizes, mutation levels, variant sites, and methylation levels. 4 These attributes make liquid biopsy, through DNA identification, a vital tool for differentiating cancer from benign conditions, identifying specific malignant tumor types, and facilitating early diagnosis4,67 (Table 1).
Diagnostic application of liquid biopsy.

AUC: area under the curve; BRM: benign renal masses; ccRCC: clear cell renal cell carcinoma; cfDNA: Circulating free DNA; cfMeDIP-seq: cell-free methylated DNA immunoprecipitation and high-throughput sequencing; CTC: circulation tumor cells; ctDNA: circulating tumor DNA; ddPCR: digital droplet PCR; DMRs: differentially methylated regions; GAs: genomic alterations; HI: healthy individuals; IM: immunomagnetic; NGS: next-generation sequencing; PCR: polymerase chain reaction; qPCR: Quantitative PCR.
Liquid biopsy has emerged as a non-invasive diagnostic tool in RCC, utilizing CTCs, ctDNA/cfDNA to distinguish between RCC patients and healthy controls showing potential in diagnosing both localized and metastatic RCC.
CTC studies have demonstrated significant advancements in capturing and analyzing these cells. In 2016, a Chinese study utilized the NanoVelcro System with CA9-/CD147-capture antibodies, significantly enhancing the efficiency of capturing CTCs in peripheral blood compared to conventional EpCAM-based methods. 68 This method showed promise in detecting RCC at various stages by improving the capture rate of CTCs. Following this, a 2017 study employed positive physical selection based on density, revealing that the acridine orange fluorescence (AO-F) positive staining rate of CTCs was 13.67% in RCC patients. Notably, the staining rate was significantly higher in metastatic patients (33.33%) compared to non-metastatic patients (8.93%). 69 This distinction underscores the potential of CTCs in diagnosing and monitoring disease progression. In 2018, another significant advancement was made using the Cytelligen CTC Enrichment kit, which reported a 91.9% positivity rate for CTCs in renal cancer patients, with an average of 8 CTCs per 7.5 ml of peripheral blood. This method outperformed the CellSearch system, indicating a higher detection sensitivity. 70
The diagnostic potential of cfDNA in RCC has also been extensively studied. In 2018, Yamamoto et al. explored this potential in a study involving 92 RCC patients and 41 healthy controls. Utilizing RT-qPCR of ACTB as the target gene assay, they found that the median levels and median cfDNA fragment size were significantly higher in RCC patients compared to healthy controls. This study reported an Area Under Curve (AUC) of 0.76, a sensitivity of 63.0%, and a specificity of 78.1%, highlighting the diagnostic capability of cfDNA. 72 Similarly, De Martino et al. (2012) demonstrated that total cfDNA levels and CpG island methylation of RASSF1A and VHL were highly diagnostic for RCC especially in ccRCC, with AUCs of 0.755, 0.705, and 0.694, respectively, underscoring the potential of methylation markers in RCC diagnostics. 35 Furthermore, Lu et al. (2016) showed that the cfDNA integrity index (ratio of longer to shorter fragments) was significantly higher in healthy individuals as compared with those in non-metastatic or metastatic RCC, with the index for the genomic and mitochondrial DNA, showing a decreasing trend from controls to metastatic RCC. They also observed that models based on combinations of cfDNA markers built by logistic regression resulted in AUCs > 0.75 in differentiating healthy individuals from metastatic and non-metastatic RCCs. 71 In 2021, Sumiyoshi et al. identified VHL mutations in cfDNA, detecting these mutations in 28.6% of patients with corresponding mutations in RCC tissue, although the sensitivity was lower than desired. 75 Similarly, Hauser et al. observed that hypermethylation of CpG islands in cfDNA was prevalent in RCC patients compared to healthy controls, suggesting its potential as a biomarker for the initial diagnosis of RCC. 77 Salinas-Sanchez et al. demonstrated that there was a significant difference observed in GAPDH cfDNA levels between RCC patients (mean 29.3 fg/ml) vs healthy volunteers (1.3 fg/ml). 78 In the USA, Lasseter et al. (2020) compared the efficacy of plasma cfDNA and cell-free methylated DNA immunoprecipitation sequencing (cfMeDIP-seq) in detecting mRCC in 40 patients. The cfMeDIP-seq method exhibited superior sensitivity, detecting all mRCC cases with 100% sensitivity compared to 21% sensitivity of cfDNA. This high sensitivity was attributed to the ability of cfMeDIP-seq to target specific methylation patterns associated with RCC, which are more stable and prevalent than cfDNA mutations. 64 Nuzzo et al. (2020) expanded on this by using cfMeDIP-seq to accurately classify patients across all stages of RCC, achieving an AUC of 0.99 in plasma samples and 0.86 in urine samples, demonstrating the robustness of methylation-based detection methods. There was no statistical association between RCC stage or histology and methylation score. 73
Recent advancements in ctDNA reseach have also further refined RCC diagnostics. RCC has low shedding of ctDNA into the bloodstream as compared to other cancer types, leading to reduced sensitivity. 79 Additionally, RCC exhibits genetic heterogeneity in space (spatial) as well as time (temporal). 80 Smith et al. observed that region-specific mutations from nine of ten tumor regions in their study were identified in plasma, indicating the role of ctDMA in overcoming this tumor heterogeneity. 81 In another study, researchers evaluated genomic and mitochondrial ctDNA levels across different stages of RCC. They developed promising diagnostic models by combining genomic and mitochondrial ctDNA.71,82 In another study, Bacon et al. (2020) revealed that 33% of patients with metastatic RCC had detectable ctDNA. The study identified the most commonly mutated genes as VHL, BAP1, and PBRM1, with a 77% concordance between ctDNA mutations and those found in tissue biopsies. Despite the promising results, the authors cautioned that cfDNA/ctDNA might not completely replace tissue biopsies in mRCC patients due to the presence of non-RCC-derived somatic clones in circulation, which could confound the results. 76 In 2021, a concordance study on one of the largest mRCC cohorts (839 patients) suggested a true complementary role of ctDNA profiling (targeted NGS panel) to tissue-based genomic profiling (targeted NGS and WES platform) in identifying multiple actionable alterations, with an increase in the frequency of some unique alterations over time. 83
In summary, liquid biopsy, through the analysis of CTCs, cfDNA, and ctDNA, holds significant promise in the diagnosis of RCC. It offers a non-invasive, highly sensitive diagnostic tool that could complement traditional tissue biopsies
Liquid biopsy and its prognostic implications in RCC
Liquid biopsy techniques were found in the literature to have a predictive ability of the grade, stage, and risk of metastasis and recurrence in patients with RCC and correlated with patient survival4,84,85 (Table 2).
Prognostic application of liquid biopsy.
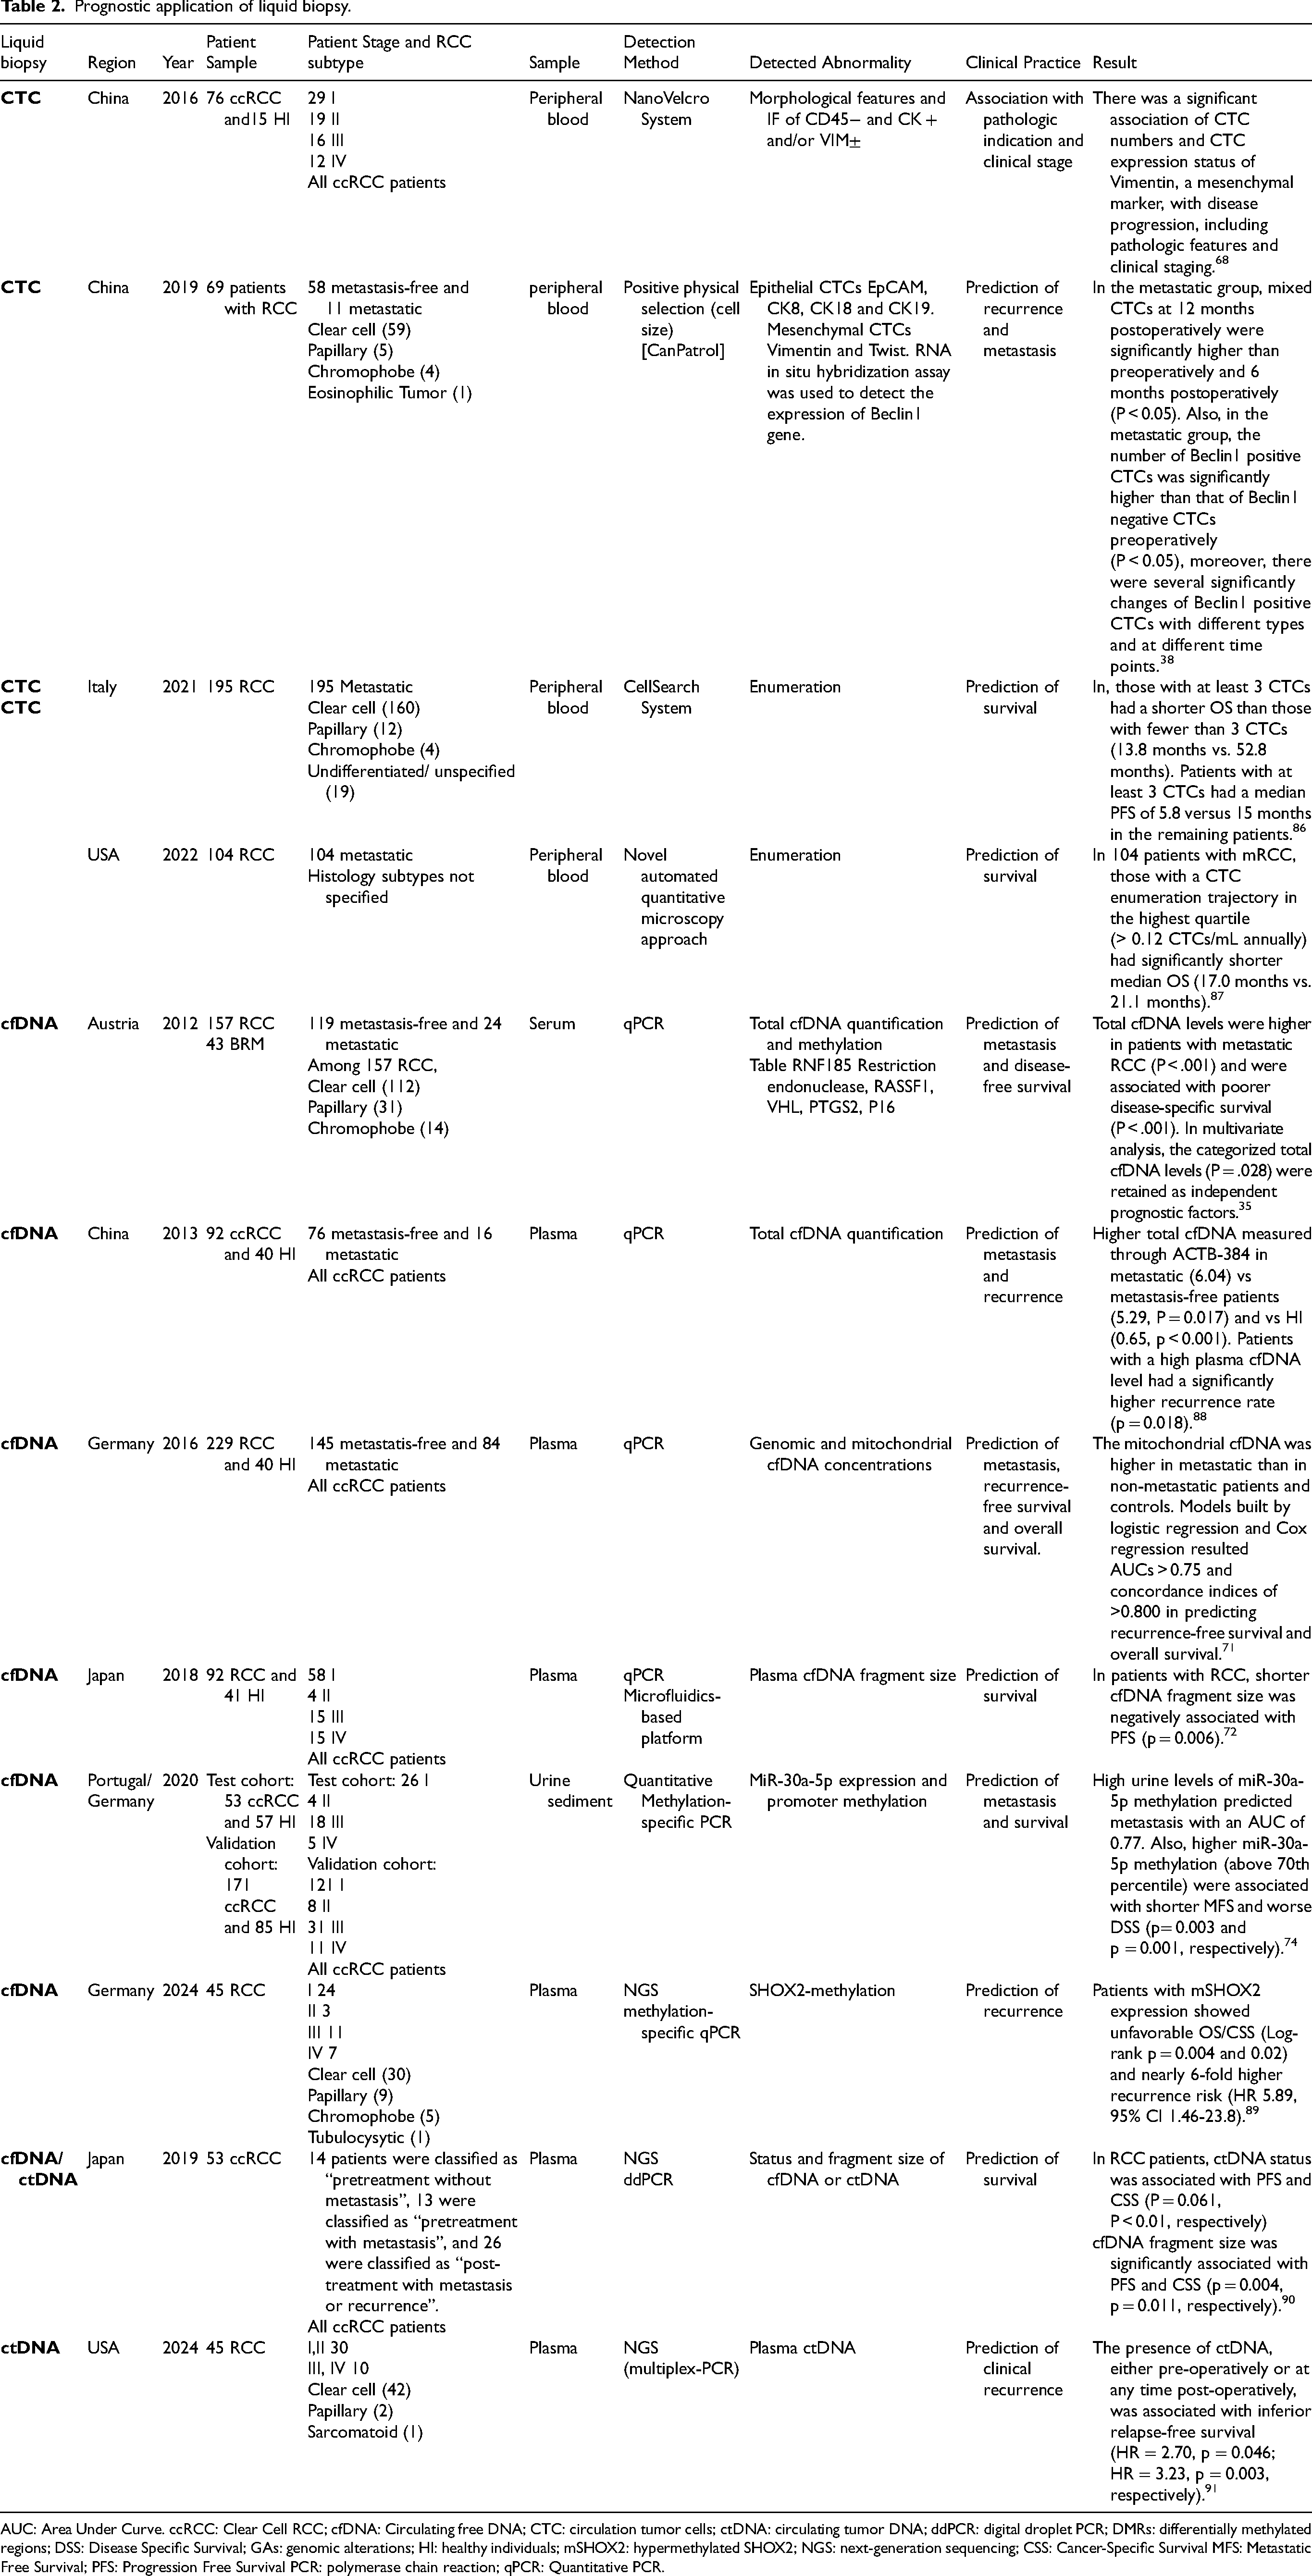
AUC: Area Under Curve. ccRCC: Clear Cell RCC; cfDNA: Circulating free DNA; CTC: circulation tumor cells; ctDNA: circulating tumor DNA; ddPCR: digital droplet PCR; DMRs: differentially methylated regions; DSS: Disease Specific Survival; GAs: genomic alterations; HI: healthy individuals; mSHOX2: hypermethylated SHOX2; NGS: next-generation sequencing; CSS: Cancer-Specific Survival MFS: Metastatic Free Survival; PFS: Progression Free Survival PCR: polymerase chain reaction; qPCR: Quantitative PCR.
Studies investigating the prognostic capabilities of CTCs, cfDNA and ctDNA have shown promising results across various stages of RCC. In 2016, a study conducted in China using the NanoVelcro System on 76 ccRCC patients (64 non-metastatic and 12 metastatic) and 15 healthy individuals (HI) revealed a significant association between CTC numbers and disease progression, including pathological features and clinical staging. The NanoVelcro platform combined with CA9-/CD147-capture antibodies showed significantly higher efficiency for capturing both CTC-mimicking renal cancer cells and RCC CTCs in peripheral blood compared to the conventional EpCAM-based method. It also enhanced the detection of mesenchymal markers like Vimentin, which were capable of stratifying clinical stages. 68 An earlier study also demonstrated a significant correlation between the detection of CTCs and positive lymph node status. 92 Moreover, Lu et al. assessed the prognostic potential of cfDNA markers and their ratios in non-metastatic RCC patients at the time of nephrectomy. They investigated three models based on combinations of conventional clinicopathological variables with cfDNA markers and found that the Concordance indices (C-indices) of these models distinctly increased compared to models based on clinicopathological data only. Certain cfDNA markers (Mitp-1, SINE-1, and the ratio APP-3/APP-2) appeared as independent factors in the models, in contrast to the clinicopathological variables, supporting the role of cfDNA in providing prognostic information. 71
Upon evaluating post-operative levels, it was observed that in patients who did not develop metastasis post-resection, the number of mixed CTCs at 12 months postoperatively was significantly lower than that of mixed CTCs preoperatively and 6 months postoperatively (P < 0.05). 38 Furthermore, a Spanish study including 82 RCC patients (70 non-metastatic and 12 metastatic) demonstrated that at diagnosis, plasma levels of GAPDH cfDNA were higher in advanced pT and TNM stages. These levels dropped following nephrectomy, and patients with higher levels both before and after nephrectomy exhibited lower OS. 78 Similarly, De Martino et al. reported a reduction in cfDNA levels after curative surgery. 35 Another study corroborated these findings by showing that cfDNA levels were lower in all patients postoperatively but increased in patients before clinical recurrence. Notably, higher preoperative cfDNA levels were observed in patients with clinically localized disease who experienced recurrence, outperforming the recurrence prediction of clinicopathologic features. 88 Additionally, a study from China using qPCR on 92 ccRCC patients and 40 healthy individuals revealed that patients with localized RCC who experienced recurrence had significantly higher plasma cfDNA levels than those without recurrence (p = 0.024). Patients with high plasma cfDNA levels had significantly higher recurrence rates than those with low plasma cfDNA levels before and after nephrectomy (p = 0.018). 88 Similarly, a recent study from US demonstrated that the presence of ctDNA, either pre-operatively or at any time post-operatively, was associated with inferior relapse-free survival (HR = 2.70, p = 0.046; HR = 3.23, p = 0.003, respectively). 91 Yamamoto et al. also studied the monitoring of clinical course using ctDNA, where they observed that overall changes in the MAF (Mutation Allele Frequency) of ctDNA generally mirrored the rise and fall of tumor burden throughout the clinical course of the disease. In one case, the MAF of ctDNA decreased after surgical resection of the primary tumor yet reemerged, coinciding with the appearance of brain metastasis. In another case, TSC1 mutation in cfDNA had been detected only before surgical resection of the primary tumor. 90
When evaluating for mRCC, multiple studies have shown that patients with metastatic RCC had higher CTC and cfDNA levels compared to metastasis-free patients.35,88 A study exploring the dynamic changes of CTCs in 69 patients who underwent radical or partial nephrectomy without preoperative distant metastasis revealed that the risk of metastasis was correlated with dynamic changes in CTC counts, particularly the variation trend of mixed CTC counts. Additionally, the number of Beclin1 positive CTCs was significantly higher in the metastatic group compared to Beclin1 negative CTCs preoperatively (P < 0.05). 38 In 2012, De Martino et al. conducted a study on 157 RCC patients and 43 benign renal masses using qPCR, finding that total cfDNA levels (RNF185) were higher in necrotic tumors (P = 0.003), patients with lymph node metastasis (P = 0.028), and distant metastasis (P < 0.001), and were associated with poorer disease-specific survival (DSS). 35 Similarly, a 2013 study from China using qPCR on 92 ccRCC patients and 40 healthy individuals showed higher total cfDNA levels in mRCC patients compared to metastasis-free patients and healthy individuals. 88 Furthermore, a 2016 study in Germany involving 229 RCC patients and 40 healthy individuals using qPCR indicated that mitochondrial cfDNA levels were higher in metastatic patients, with cfDNA integrity indices decreasing from controls to metastatic patients, effectively predicting recurrence-free survival (RFS) and OS. 71 Moreover, a 2020 study involving patients from Portugal and Germany using quantitative methylation-specific PCR found that high urine levels of miR-30a-5p methylation predicted metastasis and were associated with shorter metastasis-free survival (MFS) and worse DSS. 74
An Italian study in 2021 using the CellSearch System on 195 mRCC patients demonstrated that patients with at least three CTCs had significantly shorter OS (13.8 months vs. 52.8 months) and PFS (5.8 months vs. 15 months) compared to those with fewer than three CTCs. They also observed that patients with non-clear cell histology correlated with a higher probability of detecting at least one CTC (57.6%) compared with the clear cell phenotype (26.9%, p = 0.002). 86 Another study from the USA in 2022 using a novel automated quantitative microscopy approach on 104 mRCC patients highlighted that those with a CTC enumeration trajectory in the highest quartile had significantly shorter median OS (17.0 months vs. 21.1 months). 87 In 2018, a Japanese study on 92 RCC patients (79 non-metastatic and 13 metastatic) and 41 healthy individuals using a microfluidics-based platform showed that shorter cfDNA fragment sizes were negatively associated with PFS (p = 0.006). 72 A 2019 study in Japan on 53 ccRCC patients using NGS and digital droplet PCR (ddPCR) found that ctDNA status and cfDNA fragment size were significantly associated with PFS and cancer-specific survival (CSS) in RCC patients, with ctDNA status showing a correlation with PFS (P = 0.061) and CSS (p < 0.01). 90
In a comprehensive longitudinal study involving 457 liquid biopsies from 104 mRCC patients, the integration of CTC analysis with HLA-1 and PD-L1 expression demonstrated the potential clinical utility for enhancing the precision of treatment planning and improving outcomes for RCC patients. The study demonstrated that patients with radiographic responses showed significantly lower CTC abundances throughout treatment, and the CTC enumeration trajectory was associated with OS, with higher levels associated with worse OS. Additionally, a higher HLA-1 to PD-L1 (HP) ratio throughout treatment was associated with shorter OS. 87 Similar results were also found in a study by Bade et al. where liquid biopsy samples drawn near the time of radiographic progression had an average of 19.8 CTCs·mL−1 (range 0.5–163.1), which was significantly higher than in samples from patients responding to treatment who had an average of 2.3 CTCs·mL−1 (range 0.1–6.5, P < 0.05). They also observed that the enumeration of CK + CTCs significantly correlated with disease progression. 37 Rossi et al. suggested that the presence of EpCAM-positive, live CTCs could predict progression in individual patients with mRCC. A decrease in CTC counts was found in non-progressed patients and higher CTCs values in the progressed group indicated a failure of treatment. 93 A study by Pal et al. highlighted genomic alterations detected using ctDNA in mRCC patients treated with first-line versus later-line VEGF inhibitors. Notably, TP53 and NF1 alterations were more prevalent in later lines of treatment, potentially carrying therapeutic implications. 94 Additionally, Bacon et al. showed that the presence of ctDNA in 55 mRCC patients not undergoing systemic therapy was associated with decreased OS and PFS on first-line therapy. 76 Recently, Buttner et al. showed that patients expressing hypermethylated SHOX2 gene (mSOHX2) showed unfavorable OS/CSS (Log-rank P = 0.004 and 0.02) and nearly 6-fold higher recurrence risk (hazard ratio 5.89, 95% CI 1.46–23.8). 89
In summary, liquid biopsy techniques, whether focusing on CTCs, cfDNA, or ctDNA, have consistently demonstrated significant prognostic implications across various studies in both localized and metastatic RCC. These findings underscore the clinical utility of these assays in predicting RCC prognosis and informing treatment decisions, offering a non-invasive approach to monitoring disease progression and patient outcomes.
Liquid biopsy in predicting therapy response and disease progression in RCC
Recently, liquid biopsy has been tested as a tool for predicting the response to ICIs and anti-angiogenic therapy (Table 3). Additionally, in patients with a known history of cancer treated with definitive therapy, studies have utilized ctDNA for monitoring for recurrence. 4
Response to therapy application of liquid biopsy.

AUC: Area Under Curve. ccRCC: Clear Cell RCC. cfDNA: Circulating free DNA;CEC: Circulating Endothelial Cells;CR: Complete Response; CTC: circulation tumor cells; ctDNA: circulating tumor DNA; ddPCR: digital droplet PCR; ICI: Imunne CheckPoint Inhibitor; MAF: Mutation Allele Frequency; mRCC: Metastatic RCC; NGS: Next Generation Sequencing; PR: Partial Response;TKI: Tyrosine Kinase Inhibitor; VAF: Variant Allele Frequency; VERSA: Versatile Exclusion-based Rare Sample Analysis.
CTCs have shown significant potential in predicting response to therapy. Studies have demonstrated a reduced number of CTCs postoperatively in patients with RCC, particularly in those with high pre-operative CTC levels.19,90 For instance, the number of CTCs postoperatively significantly correlated with tumor diameter (p < 0.001) and surgical approach (p = 0.016), indicating their value in assessing surgical outcomes 41). In an Italian study conducted in 2012 involving 53 patients, the detection of CTCs and CECs (Circulating Endothelial Cells) from peripheral blood using EpCAM expression was utilized to evaluate the response to a first-line Sunitinib regimen. The CTC and CEC changes were sequentially assessed in 30 patients under first-line treatment. A rapid increase in the CEC number as early as the first cycle of therapy was associated with a decrease in CTCs in non-progressed patients, whereas a delayed CEC response was related to higher CTC values in the progressed group, indicating treatment failure. 93 In a 2021 study from the USA involving 58 samples from 29 patients, the expression of PD-L1 in carbonic anhydrase IX (CAXII) single-positive CTCs correlated with the efficacy of ICI therapy, achieving an AUC of 0.77, with 67% sensitivity and 88% specificity for detecting progressing patients. 37 Additionally, PD-L1 expression in CAXII single-positive CTCs also correlated with the efficacy of TKI therapy, with an AUC of 0.83, 100% sensitivity, and 88% specificity in a subset of 22 patients. 37
Further investigations into ctDNA/cfDNA have reinforced these findings. Feng et al. demonstrated that among patients with mRCC receiving sorafenib, cfDNA levels decreased in those with a partial response, while patients with stable or progressive disease experienced an increase. In order to test the potential of plasma cfDNA levels as a biomarker for the prediction of progression, ROC curves were plotted for W0, W4, W8, W12, W16 and W24 cfDNA levels. Using W8, progression could be predicted with a sensitivity of 66.7% at absolute (100%) specificity (AUC 0.800; cut-off value 5.019 ng·ml−1). Further, W12, W16 and W24 were able to predict progression with a sensitivity of 71.2% (AUC 0.822; cut-off value 5.48 ng·ml−1), 76.3% (AUC 0.889; cut-off value 5.738 ng·ml−1) and 80.8% (AUC 0.956; cut-off value 6.048 ng·ml−1), respectively, at 100% specificity. 95 A 2022 Italian study on 48 patients found that a cfDNA cut point of ≥2.19 ng/μl was predictive of early progression in mRCC patients on TKI therapy, with a sensitivity of 100% and specificity of 75%, while a cut point of ≤1.35 ng/μl was associated with long-term progression, yielding a sensitivity and specificity of 78% each. 96 Similarly, a 2019 Japanese study involving 53 patients demonstrated that shorter cfDNA fragment sizes were linked to significantly worse responsiveness to TKI therapy (P = 0.011), and the presence of ctDNA correlated with weaker treatment effects (P = 0.049). 90 Additionally, a study of 48 patients undergoing standard first-line treatment identified predictive cfDNA cut-points for the response to VEGFR-TKI, categorizing patients into short, intermediate, and long responders with respective PFS durations of 4.87, 9.13, and 23.1 months (P < 0.001). 96 Another study by Koh et al. involving 14 patients with mRCC confirmed a decrease in ctDNA in four out of five responders to ICI therapy and an increase in five out of six non-responders. Patients with decreasing ctDNA levels after the first administration of ICIs had significantly longer PFS (p = 0.0441). They also observed that MAF tended to decrease more frequently in responders predicting the clinical outcome prior to conventional radiographic imaging. Their findings revealed that early ctDNA dynamics could serve as a predictive biomarker for response to ICI in mRCC patients. 97 Similar findings were demonstrated in another study from the US, where mRCC patients who had CR on ICI treatment had a significantly lower ctDNA concentration than patients with a PR (p = 0.014). Also, those who progressed on subsequent scans had significantly higher ctDNA than those who maintained their response (median, 0.362% [IQR, 0.181%-2.71%] v 0.033% [IQR, 0.007%-0.077%], respectively [p = 0.026]). These findings envision that subsequent studies could validate the utility of this assay to discern appropriate candidates for discontinuation of immunotherapy. 98
In summary, liquid biopsy techniques, including CTC and ctDNA profiling, have demonstrated potential in predicting therapy response and disease progression in RCC. By providing real-time, non-invasive insights into tumor dynamics, these techniques offer valuable tools for guiding treatment decisions, monitoring therapeutic efficacy, and improving patient outcomes.
Limitations and future directions
Liquid biopsy assays, encompassing CTCs and ctDNA/cfDNA, face several limitations. The detection and analysis of CTCs are often constrained by their modest levels in patients’ blood, resulting in relatively low diagnostic sensitivity and specificity. For example, the CellSearch assay, which is widely used for CTC detection in other cancers, shows limited sensitivity in RCC due to the low expression of epithelial markers like EPCAM on RCC cells.4,99 Current CTC enrichment methods, which often rely on size-based separation or positive selection using antibodies against specific markers (e.g., EPCAM, CAIX), have varying degrees of effectiveness and can result in significant loss of target cells during processing. 99 Also, the absence of consistent protein markers limits the potential of CTC assays to correctly identify benign SRMs and subtypes of RCC.99,100
The exploration of ctDNA in RCC patients remains limited in number, particularly in those with localized disease, and the modest ctDNA levels underscore the need for future studies with larger samples and novel biomarkers offering enhanced sensitivity and specificity. 80 Additionally, cfDNA is inherently unstable and subject to rapid degradation unless protected within extracellular vesicles (EVs) or bound to proteins, which complicates its detection and analysis.99,101,102 Also, RCC tumors generally shed less ctDNA into the bloodstream compared to other cancer types due to various reasons, including hypoxic nature of RCC tumors, the presence of pseudocapsule around the tumor as well as lower tumor cell turnover rate. This leads to reduced sensitivity as the amount of ctDNA is often below the detection threshold, especially in early-stage disease. 79
Clonal hematopoiesis of indeterminate potential (CHIP) has also become crucial in interpreting liquid biopsy results with common CHIP mutations, including those in DNMT3A, TET2, ASXL1, TP53, JAK2, PPM1D, ATM, CBL, SF3B1, BCORL1, GNAS, and CHEK2.103,104 This phenomenon can confound ctDNA assays by introducing CHIP-derived mutations that may be mistakenly attributed to tumors, especially in older population.76,103 While CHIP data in RCC is limited, mutations in genes like TP53 and DNMT3A, associated with RCC, are also frequently mutated in CHIP. 105 In a study evaluating plasma ctDNA in 55 mRCC patients, the most common CHIP-related mutations were found in DNMT3A, TET2, and ASXL1, with non-RCC-related somatic expansions observed in 43% of cases. 76 These mutations can interfere with RCC liquid biopsy interpretations, posing a risk of false positives by mimicking tumor-derived alterations.76,105 Given CHIP's association with higher mortality risk in, understanding CHIP mutations in RCC-related genes. 76 Incorporating CHIP data into RCC liquid biopsy profiling could enhance molecular precision and improve clinical decision-making.
The risk of tumor progression, metastasis and its molecular pathways affect variably across histological subtypes, underscoring the need for accurate diagnostic biomarkers to guide treatment decisions.106–108 ccRCC, the most common subtype, is often associated with VHL gene mutations and alterations in the PI3 K/AKT/mTOR pathway, which can be detected through liquid biopsy, aiding in diagnosis and disease monitoring. 35 However, depending on the study, the variable expression of EpCAM in RCC, observed in only 15–40% of ccRCC cases, poses a challenge for consistent CTC detection. 93 Papillary RCC (pRCC), which accounts for about 15% of RCC, frequently exhibits MET proto-oncogene mutations, and detecting MET alterations through liquid biopsy can help inform targeted therapies. 109 While chromophobe RCC (chRCC), representing roughly 5%, is characterized by extensive chromosomal losses and mitochondrial DNA mutations. The low mutational burden in chRCC presents challenges for ctDNA detection, potentially limiting the sensitivity of liquid biopsy. 110 This molecular heterogeneity necessitates tailored liquid biopsy approaches to enhance detection sensitivity and specificity.
The lack of standardized protocols for liquid biopsy assays complicates the comparison of results across studies and hinders the development of universally accepted guidelines for clinical use. Moreover, many promising biomarkers identified in preliminary studies require validation in larger, multicenter cohorts to establish their clinical utility. For example, the use of cfDNA and ctDNA as diagnostic and prognostic tools needs further validation to delineate their effectiveness across different stages of RCC and diverse patient populations.4,99 Consequently, future research endeavors should address the role of liquid biopsy in predicting responses to combination therapy. 4
Of particular interest, KIM-1 (Kidney Injury Molecule-1) has emerged as a promising biomarker in the diagnosis and prognosis of RCC. 111 Normally expressed at low levels in the kidney and other tissues, KIM-1 becomes significantly upregulated in injured renal tubular cells. 112 Several studies have identified KIM-1 as a sensitive marker for diagnosing cRCC.113,114 Notably, KIM-1 concentrations have been found to predict RCC incidence up to five years before diagnosis. 113 Additionally, KIM-1 levels have been linked to tumor size, grade, and poorer survival outcomes, demonstrating its potential prognostic value.112,113
RCC is characterized by significant intratumoral and intertumoral heterogeneity, which poses challenges for accurate biomarker detection. If targetable mutations are not present from the tissue biopsy site, they can remain unidentified and potentially cause sub-optimal treatment. Along with testing of ctDNA, The simultaneous assessment of multiple other components of liquid biopsies, including CTCs and EVs, may help address this heterogeneity and improve the precision of RCC diagnostics and prognostics.4,9,80 Developing guidelines that integrate liquid biopsy results with complementary noninvasive tests, such as advanced imaging techniques, especially within the framework of artificial intelligence and machine learning, represents a promising avenue for enhancing diagnostic accuracy and predictive power in RCC.4,9 By addressing these limitations through technological advancements, standardization efforts, and extensive validation studies, the potential of liquid biopsy assays in improving the diagnosis, monitoring, and treatment of RCC can be fully realized.
Conclusion
Liquid biopsy represents a promising frontier in RCC management, with potential applications in early detection, treatment monitoring, and personalized medicine. However, RCC tumors present unique challenges, such as low ctDNA shedding and significant intratumoral heterogeneity, which necessitate more refined assay development. Various commercially available NGS assays, including but not limited to Guardant360® by Guardant Health, Tempus xF+, Caris Assure™, Signatera™ by Natera, and FoundationOne® Liquid CDx, provide liquid biopsy testing for somatic mutations.115–118 In our practice, we utilize liquid NGS testing at the time of tumor progression to identify actionable mutations and at diagnosis when primary tumor biopsy is difficult. These tests offer valuable insights to guide targeted treatment decisions. With further standardization of guidelines and protocols, liquid biopsy could evolve into an invaluable tool for RCC, advancing precision medicine and improving patient outcomes through more personalized and effective management strategies.
Footnotes
Abbreviations
Acknowledgements
The authors have no acknowledgments.
Author contributions
Dr Chinmay Jani: Conception, data review, Manuscript writing Dr Nour Abdallah: conception, data review, Manuscript Writing, Dr Alan Tan: Manuscript writing. Manuscript review and editing. Dr Rana Mckay: Conception, manuscript writing. review and editing.
Declaration of conflicting interests
The authors declared no potential conflicts of interest with respect to the research, authorship, and/or publication of this article.
Funding
Research reported in this publication was supported by the National Cancer Institute of the National Institutes of Health under award number P30CA023100. The content is solely the authors’ responsibility and does not necessarily represent the official views of the National Institutes of Health.