
Abstract
The impact of COVID-19 on poverty estimates is humongous. The economic tumult caused by the pandemic over the past two years has the potential to double the nation’s poverty, erasing the decade-long gains from the fight against poverty and inequality. Our calculations show that around 150–199 million additional people will fall under poverty in 2021–2022; a majority of which are from rural areas, owing to the immiserate nature of the rural economy. Further disaggregation reveals that the SC/ST, casual labour and the self-employed are the most impacted groups. Bihar, Chhattisgarh, Madhya Pradesh, Uttar Pradesh and Odisha are the most affected states facing poverty ranging from 50% to 80% in the rural area and 40% to 70% in the urban area. Our analysis also identifies the rippling effect of poverty on the inter-group disparities in India.
Introduction
The outbreak of the novel coronavirus has led to mass havoc, fuelling a global health and economic crisis in millions of deaths, lockdown of industries, large scale job cuts and consequential catastrophic income shocks. The gloomy picture painted by the current recession, the first time since the Great Depression, is the making of both demand and supply-side shocks resulting from the pandemic and its subsequent lockdown. It is only rational to assume that recovery and subsequent return to normalcy will be uncertain and an uphill job unless there is a large-scale exogenous stimulus from the government. Considerable studies have reported the social and economic impact of the pandemic, with wider attention on macro indicators such as GDP contraction, employment, income and consumption loss (Das & Patnaik, 2020; Dutta et al., 2020; Kumar, 2020; Walter, 2020). However, a comprehensive macro and micro-level investigation into the impact of the pandemic on poverty is due.
The World Bank’s latest forecast (Lakner et al., 2021) for the economic pushback of the pandemic in the year 2020 stands at 119–124 million of the global population falling into extreme poverty (those living under $1.90 per day), of which around 60% belong to South Asia. The International Labour Organization (ILO, 2021) estimated around 140 million of global employment loss in the year 2020. The reported loss in labour income is around 8.3% which is close to 4.4% of the global gross domestic product. The reported figures also indicate that the ‘greatest labour income loss, amounting to 12.3%, was experienced by lower–middle-income countries’ (ILO, 2021, p.10). Sumner et al. (2020) on assuming different levels of contractions in per capita consumption (5% to 20%) have shown that up to 400 million new poor living under $1.90 per day will be added in FY2020–2021. Their estimates show that in the most favourable scenario of 5% contraction in per capita consumption, the overall addition of poor people living under $1.90 per day is 84 million and with 20% contraction, the number of additional poor could go as high as 419 million. For India, their estimates show that the increase in absolute poor living below $1.90 per day is around 35.4 million at 5% contraction in per capita consumption and around 178 million with 20% contraction in per capita consumption. The suggested estimates, however useful, are limited to only showing the aggregate figures. Considering the diverse nature of the Indian subcontinent, further segregation is essential for capturing the catastrophic essence of the COVID-19.
In India, the lockdown accentuated crisis caused several industries to collapse and shut down, leaving millions of informal workers stranded. A telephonic survey of 4000 workers across 12 states by Azim Premji Foundation (2020) in collaboration with the Centre of Civil Society shows that 80% of the workers in urban areas reported employment loss, while 50% of the remaining reported income losses or even no salary disbursement. The adverse effect was rather magnified, coming at the back of an industrial sector experiencing a declining trend in growth and value since 2017–2018 (Ministry of Statistics and Programme Implementation, 2021). Centre for Monitoring Indian Economy (CMIE) estimates shows that there is a net loss of 7 million jobs between February 2020 and February 2021 (Vyas, 2021). The biggest loss in jobs is suffered by the non-farm workers (11.6 million) followed by salaried employees (4.2 million), daily wage earners (4.2 million) and businesspersons (3 million). However, the mere loss of jobs is only one aspect of the bigger picture of impoverishment and poverty. One must further delve into the condition of employment and subsequent re-employment. The CMIE report further states that overall, there has been a decline in the condition of employment. The employment (particularly re-allocated one) was not as fruitful as compared to the employment from the pre-crisis times. Workers experienced a decline in the number of working hours and wage cuts in their reinstated jobs. In essence, informality and precarity of the jobs have increased, with nearly half of the salaried workers moving into the informal sector (Azim Premji University, 2021). As a consequence, there was a fall on an average of 12% in household income during 2020–2021 (Vyas, 2021). It should be noted here that this is an average figure, and the actual fall of income among the middle and the lower strata is bound to be much higher.
COVID-19 crises in India were perceived primarily as a phenomenon restricted to the urban confines of the country, but its economic ills were quickly spread to the rural sector by the means of backward and forward economic linkages between the sectors. The unplanned and hastily executed lockdown of the year 2020 not only led to a mass urban-rural exodus but also brought the agriculture and allied activities at standstill, leaving millions of rural workers stranded and distressed (Azim Premji University, 2020; National Bank for Agriculture and Rural Development [NABARD], 2020). The urban restrictions in terms of movement of labour, primary, intermediate and final goods, particularly perishable goods (horticulture and others), severely affected rural income and production (Food and Agriculture Organization [FAO], 2020). For instance, horticulture plantation had faced major distress due to its perishable nature and depressed demand, leading to no or little market for the produce. The increased harvest and transportation cost, fall in general prices and market closures, amongst other factors had caused farmers to lose thousands of crores (₹70,500 crores for rabi season alone) in the initial phase of lockdown (Babu & Raj, 2020). In Maharashtra, the closure of the Agriculture Produce Market Committee (APMC) even resulted in farmers dumping their produce in garbage containers (Jadhav, 2020). Narayanan (2020) found that the closure of APMC resulted in disruption in food supply chain, incurring losses to the producers. Besides, there were already signs of collapse in agricultural prices, which predates the COVID outbreak. Growth in rural wages was subdued, particularly for agricultural labour in both nominal and real terms. According to Himanshu (2019), the real wage growth of agricultural labourers was 0.87% per annum between May 2014 and December 2018, whereas it was only 0.23% per annum for non-agriculture labourers. According to Dev and Sengupta (2020, p. 18), a survey done by NABARD in the year 2017 had shown that ‘only 23% of rural income is from agriculture (cultivation and livestock) if we consider all rural households. Around 44% of income is from wage labour, 24% from government/private service and 8% from other enterprises.’ This means that the non-farm sector is a major source of income in rural areas. Hence, any adverse impact of the pandemic on rural manufacturing and services ought to depress wage income, and further depress rural demand.
Furthermore, in the year 2021, the onset of the second wave of COVID-19 and its subsequent misery raised further uncertainty regarding the health of the Indian economy. Although, at this time, the lockdown was not imposed at the national level in the manner it was imposed last year, in terms of stringency and duration, yet the impact in terms of loss of lives and hence the loss of livelihood is severe. The second wave witnessed never-ending queues in front of hospital gates, constancy of ambulance sirens going off in the vicinity, masses running pillar to post in a bid to arrange for essential drugs and oxygen taking centre stage. This time both rural and urban areas are severely affected by the crises. Federation of Indian Chambers of Commerce and Industry (FICCI) survey shows that around 58% of the businesses reported high impact and another 38% reported moderate impact of the state-level lockdown of April–May 2021 (FICCI, 2021). The report also states that unlike the last year, the weak demand for goods and services are not just constraint to the urban areas but rural India too reported compression of demand this time. Around 37% of the businesses reported high impact and another 34% reported moderate impact on their sales in the rural market. Due to the weak demand, around 40% of the companies have also experienced a utilization rate of less than 50% of their installed capacity. As per the CMIE’s (Vyas, 2021) consumer pyramid household survey, there was a loss of 22.3 million jobs between the months of April and June, of which daily wage earners were the worst hit. Out of 22.3 million jobs lost, 17.2 million were daily wage workers, 5.7 million were businesspersons and 3.2 million were salaried workers.
With the increasing job informality and unemployment, exceedingly high out-of-pocket expenditure (OOP) health expenditure and the apprehensions of the third wave restricting household spending, the second wave can result in compounding problems of poverty and impoverishment for the country. Further, given the other challenges that the businesses and people are facing, the economy is most likely to experience a lower GDP growth rate than it was expecting at beginning of the year. Most multilateral and international agencies have therefore revised their 2021–22 growth predictions for India considering the impact of the second wave of COVID-19 induced crisis. The World Bank revised its estimates of Indian GDP forecast to 8.3% from their earlier estimates of 10% for the year 2021–2022. ICRA forecast of GDP growth for India is at 8.5% for the current year. RBI (2021) revised estimate of GDP growth is 9.3% from its earlier forecast of 10.5% for the year 2021–2022.
In the fear of revised downward predictions, the economic slowdown and lack of vaccinations hold a direct impact on the welfare of the people. The people who are poor, vulnerable and living around the poverty line are the ones who are expected to disproportionally bear the brunt. This article, essentially, is an attempt to quantify the impact of COVID-19 on poverty estimates for different social groups, religions and states in India.
Method and Data
For assessing the impact of lockdown on the poverty estimates, we have used the method discussed by Sumner et al. (2020). Sumner et al. (2020) has used three different scenarios of contraction in per capita income/ consumption because of lockdown, that is, 5%, 10% and 20% and used these in calculating post-COVID-19 poverty figures. We have used two levels of contraction in per capita income or consumption, that is 5% and 10% for assessing the impact of COVID-19 crises on the poverty estimates in India for the year 2021–2022. These scenarios are not arbitrary but are based on our assumption of the net impact of COVID-19 induced crises on the income of the people. CMIE (Vyas, 2021) estimate shown that in the year 2020–2021, there was an average income loss of 12.5% when the economy shrank by 7.3%. In the year 2021–2022, despite the second wave of COVID-19, the economy is forecasted to grow at the rate of 8.3% on Y-O-Y basis. However, given the fact that the growth (decline) in GDP is not uniformly shared by all the sections of the population; the trickle-down approach barely leaves the poor with any fruit to reap. The Economic crisis is characterised by poor getting poorer; the poor and the marginalised indispensably bear the disproportionate burden of the recession. Thus, the net loss of income is expected to be ranged somewhere between 5% and 10% from the pre-covid level of income, that is, 2019–2020 (ignoring extremities).
The data set used for the calculation of pre- and post-COVID-19 poverty is Periodic Labour Force Survey (PLFS) 2018–2019. The choice of this data is owing to the unavailability of consumer expenditure survey data 2017–2018 which is yet to be released. The use of PLFS information on consumption expenditure may act as a potential upward bias for our estimates given the fact that consumption expenditure of Employment and Unemployment survey tend to be lower as compared to the Consumption Expenditure Surveys (CES), as has been observed in the past (Kannan, 2014). Comparing the PLFS 2017–2018 consumption expenditure with leaked consumption expenditure figures of CES 2017–2018, we have found that the mean monthly consumption expenditure of PLFS is ₹300 lower as compared to the CES in rural areas and ₹1,000 lower in urban areas. However, the same leaked report reveals that the real consumption expenditure was lower in both rural and urban areas in the year 2017–2018 as compared to the year 2011–2012. This indicates an average rise in impoverishment during the year. As the main objective of this study is to evaluate the differential impact of the crisis across various socio-economic groups, we have decided to go ahead with using the PLFS data set.
The simple headcount ratio method of measuring poverty has been used for estimating the poverty. The headcount ratio represents the proportion of poor people in the population. Poor people are those whose household’s monthly per capita expenditure (MPCE) falls below the poverty line. The article has used the Rangarajan committee’s estimates of poverty line for the year 2011–2012 for estimating the COVID induced increase in poverty. Consumer price indices for the rural and urban areas (Base year, 2011–2012) have been used for updating the poverty line of the year 2011–2012 for the years 2019–2020 and 2021–2022. The article has assumed that there are no substantial changes in income and its distribution in the year 2019–2020. The assumption is essential to make 2018–2019 consumption figures equivalent for the year 2019–2020.
For the estimating pre- and post-COVID-19-induced poverty figures, we have used unadjusted and adjusted household’s MPCE. The unadjusted household’s MPCE are pre-COVID-19 consumption figures as reported in the periodic labour force data set. The adjusted MPCE has been calculated after subtracting the assumed level of contraction in consumption from the unadjusted MPCE. The differences between the post-contraction and pre-contraction poverty figures are the impact of the fallout. These resultant proportions have been used to assess the impact of the pandemic across castes, religions, economic groups and states of India.
Before proceeding further, it is imperative to note the limitations of the method adopted. The same has been discussed extensively in the Sumner et al. (2020). The first limitation is the inherent use of a range of contraction in consumption. The actual level of contraction in consumption in a response to contraction of GDP is conditional upon the government’s responsive actions, the precise income shock, data availability and the duration of the crisis. Second, the method has assumed a uniform level of contraction in consumption across different segments of the society, whereas we expect the lower rung of the population, both socially and economically, to be affected disproportionately as compared to the other population. Third, the article has assumed that the level of GDP contraction is equivalent to the level of income/consumption contraction which might not be probable. Sumner et al. (2020) have mentioned that positive and negative growth rates asymmetrically affect households’ welfare. Last, there is no denying that there are crucial non-monetary impacts of poverty extrapolated by the crisis in the field of health, education, mental well-being and living status that are not captured in our range of estimates.
Impact of COVID-19 on Poverty Estimates in India
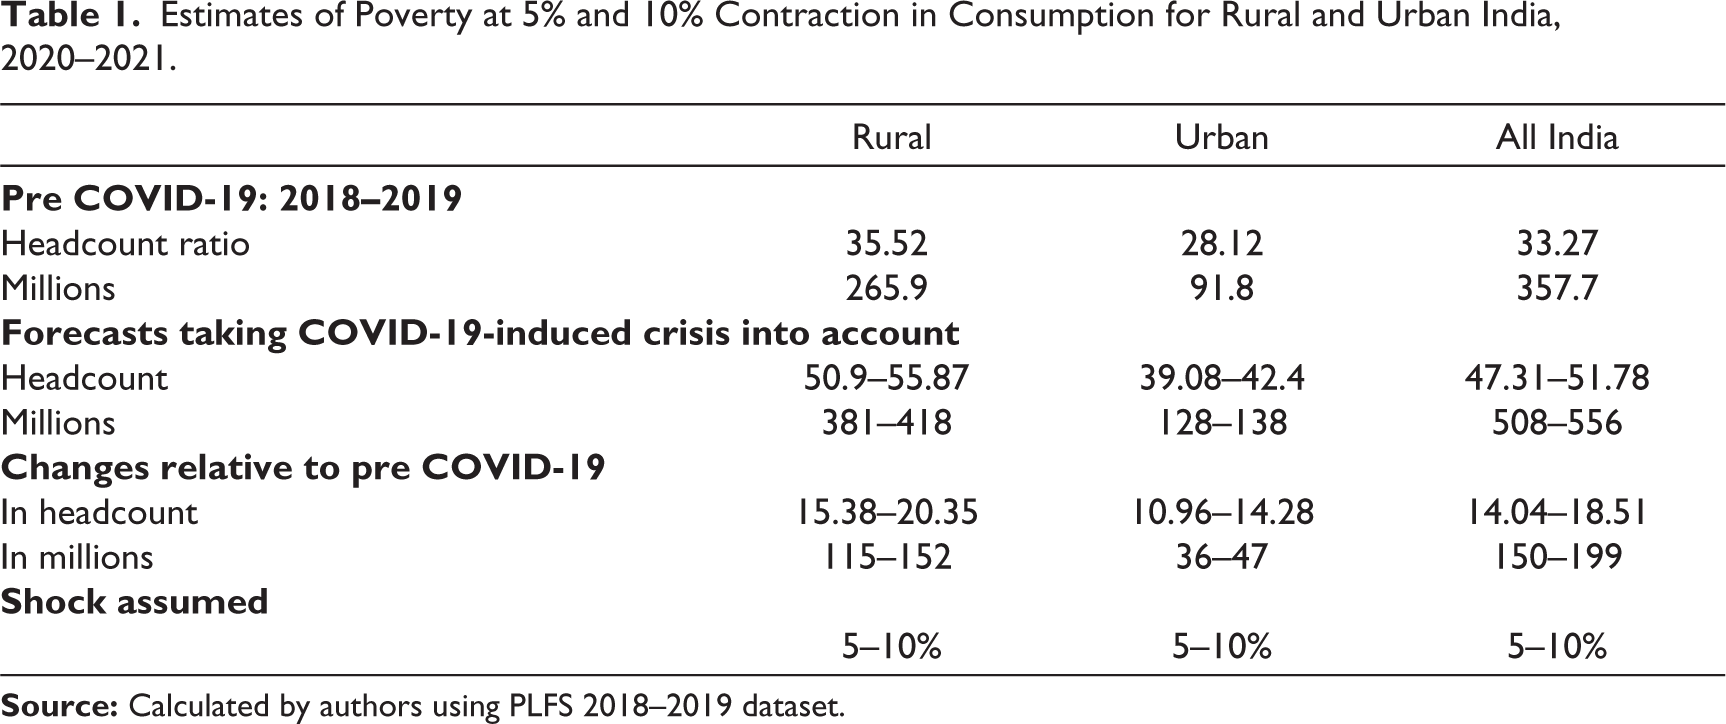
Table 1 presents our estimates of headcount ratios and an absolute number of poor based on the two assumed scenarios of contraction in per capita consumption separately for rural and urban areas. The table shows that the total number of people living below the poverty line would expand by 150 to 199 million, reaching to an absolute number of 508 to 556 million due to the COVID-19 crises. Our estimates suggest that a 5% and a 10% level of contraction in consumption in the rural area would lead to an additional influx of 115 and 152 (population in million) respectively into poverty. This means a 15.38 and 20.35% increase in poverty incidence at the 5 and 10% consumption shock respectively. In pre-COVID times, around 35% (265 million people) of the rural population were poor. However, this number is expected to rise to roughly 381 to 418 million for the FY2021–2022. For Urban India, under the same levels of contractions, there is an expectant 36 to 47 million additional people to fall under poverty, with the total headcount ratio reaching 39.08% to 42.4%. The contractions would lead to an increase in urban poverty incidence by 10.96% and 14.2%. At all India level, around 150–199 additional million people will become poor due to COVID-19 crises, while those already are poor will be pushed deeper into poverty.
Estimates of Poverty at 5% and 10% Contraction in Consumption for Rural and Urban India, 2020–2021.
Estimates of Poverty at 5% and 10% Contraction in Consumption Across Caste for Rural and Urban India, 2020–2021.
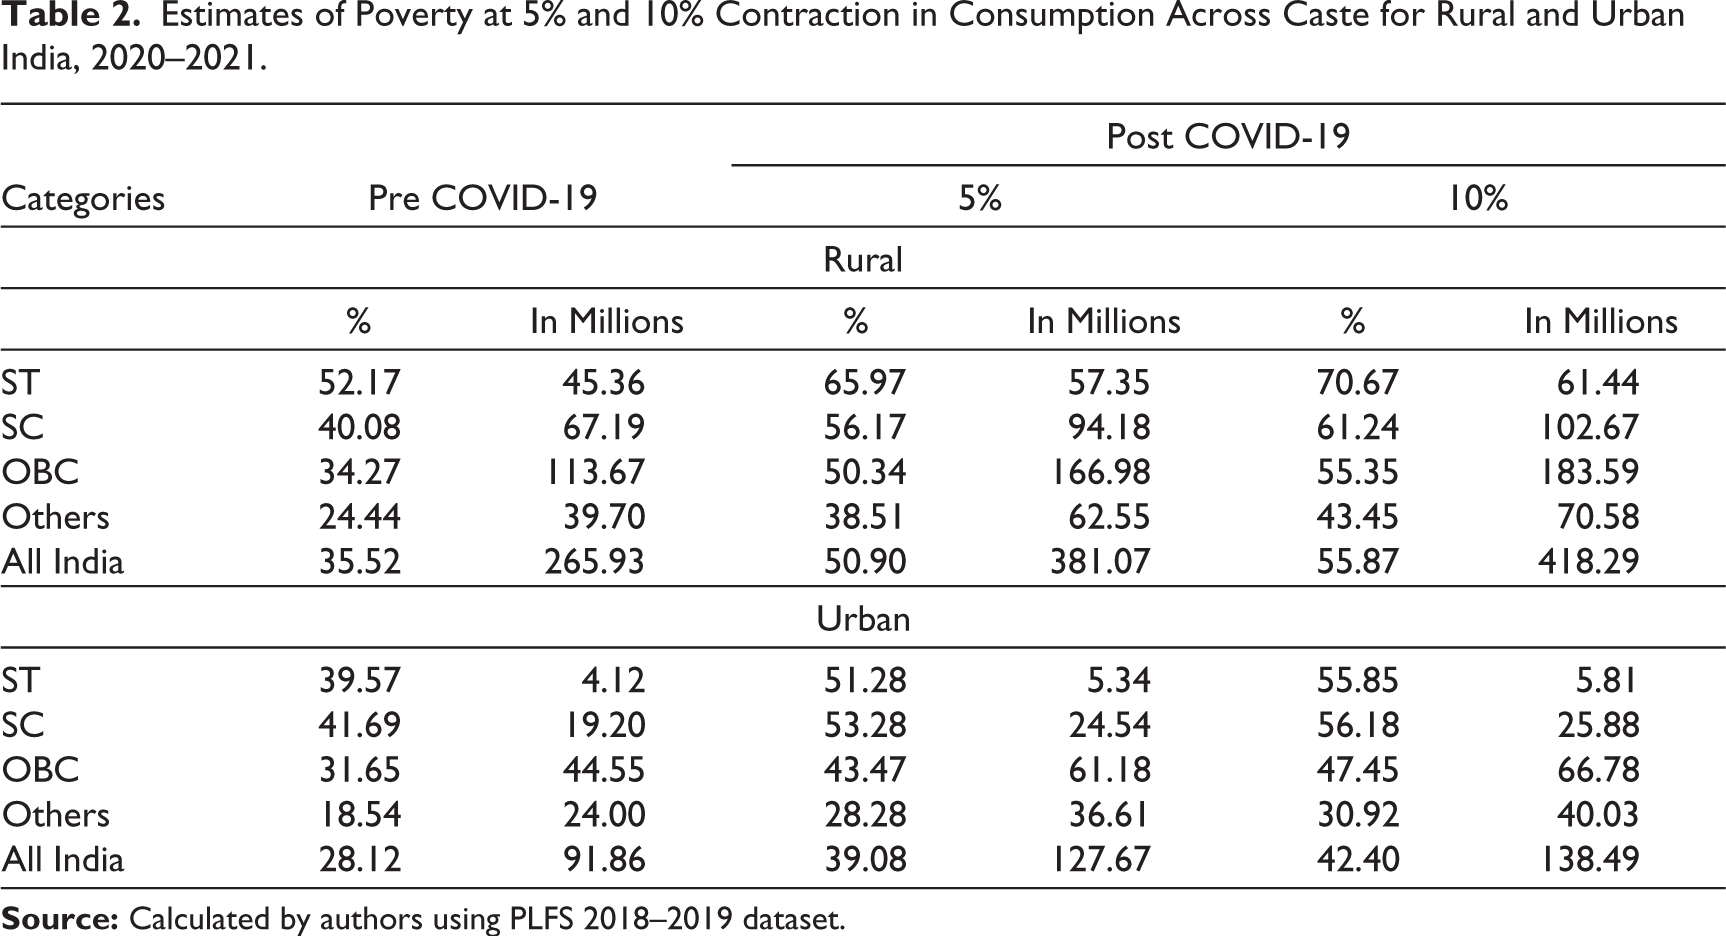
Across the social categories, around 52% of the ST, 40% of the SC and 24.44% of the ‘other category’ group living in rural areas were poor in the pre-COVID-19 time. Similarly, the majority of the SCs (41.69%) and STs (39.57%) in the urban sector are poor compared to 18.54% of ‘other category’ individuals. The same pattern can be seen post contraction as well with SC/ST having a significantly higher share of their population in poverty. Table 2 shows that around 55% to 70% of the SC/ST population is expected to live under poverty as a result of job and income loss arisen due to the COVID-19 crises as compared to 30% to 43% of the ‘other category’.
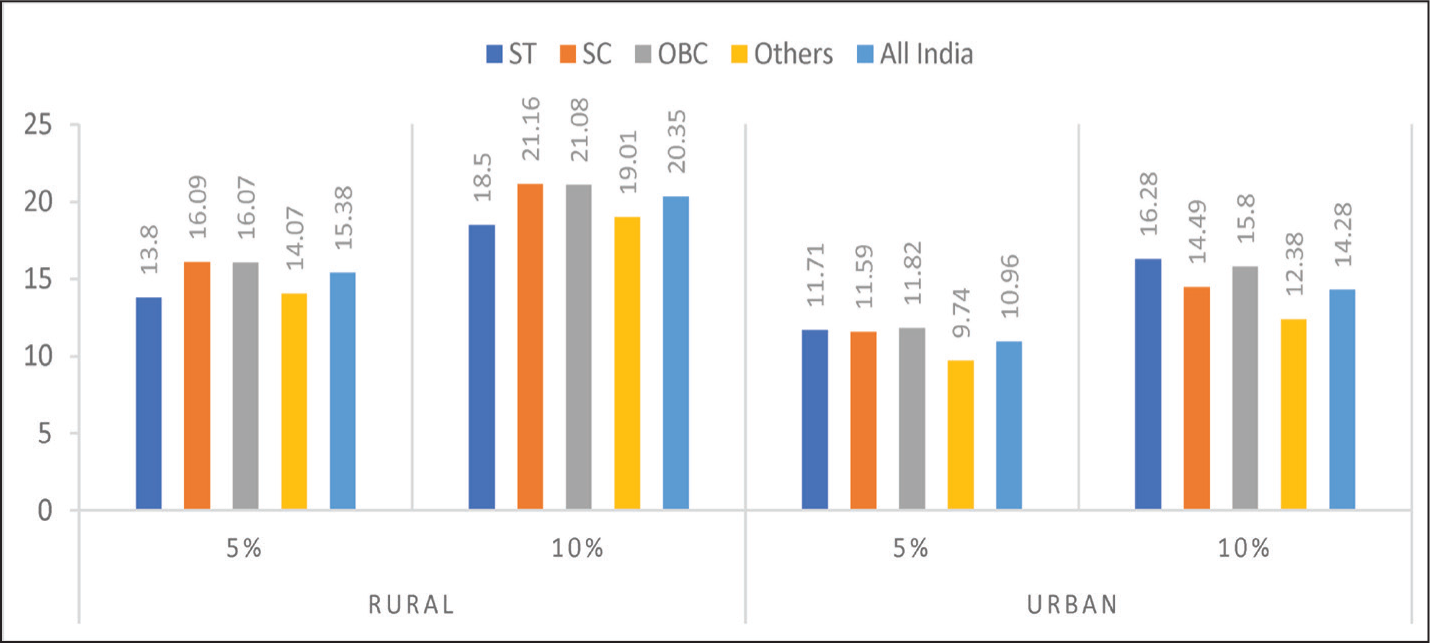
Figure 1 represents the impact of the crisis measured by the differences between the headcount post-contractions and pre-COVID-19 levels. The figure shows that a higher percentage of people from the marginalised group is expected to fall into poverty as compared to the other groups due to the crises in both rural and urban areas. The COVID-19 induced poverty may also further lead to a widening disparity across SC/ST and non-SC/ST groups. For instance, in the urban area under the assumption of 5% contraction, 11.71% of additional ST people will fall under poverty compared with 9.74% of ‘other category’ people, leading to an inter group differential of 1.97. At 10% contraction, this differential rises to 3.90, more than double of what it was at 5%. In the rural sector, the said differential is less alarming. However, it is worth noting that the pre-COVID-19 distribution of poverty is skewed towards the SC and ST categories, and any contraction in income further augments the existing disparity.
Another point to note is that a higher percentage of SC/ST/OBC people becomes poor, compared with any other group in both rural and urban areas. This is reflective of the social divide/caste hierarchy and prevailing inequality in which majority of SC/ST/OBC people are poor, near-poor and vulnerable to poor in the country wherein a relatively higher proportion of ‘other category’ are better off. The term ‘poor, near-poor, moderately poor’ and ‘vulnerable to poor’ represent the expression that the distance farther away from the poverty line is directly related to the population’s vulnerability to poverty. This notable characteristic of India’s poor profile has been indicative of the ever- persistent economic divide between its major caste groups (Mehta & Shah, 2003; Mutatkar, 2005; Sundaram & Tendulkar, 2003). Majority of the poor in the country belong to SC and ST communities faring the ever-going injustice and cumulative exploitation borne over decades. In the year 2011–2012, SC and ST together constituted around 43% of the total poor person in the rural areas and 27% of the total poor in urban areas (own calculation using CES 2011–2012). The observed differences across social groups due to COVID-19-induced poverty reckons under the premise that the historically marginalized sections, due to their poor social and economic profile, are bound to endure deprivation over many coming years. To be specific in terms of economic inequality wherein the larger concentration of a certain group around the poverty line would certainly prove alarming for the group in an event of a crisis. As per the average income earned across the groups, one can infer that compared to the ‘Other category’ group, SC/ST are more vulnerable to any potential threat of poverty. For example, in year 2011, the average annual household income earned by the SC and ST households were 0.8 times and 0.7 times lower than the national average. The average annual income of a household in India was ₹1,11,222 per annum (Bharti, 2018). Not just income distribution, wealth ownership in India has also been favouring OBC and ‘Other category’ people since centuries. The latest NFHS (2015–2016) data shows that 45.9% of STs and 26.6% of SCs belonged to the lowest wealth quintile compared to only 8.93% and 18.33% of ‘Others’ and OBCs respectively.
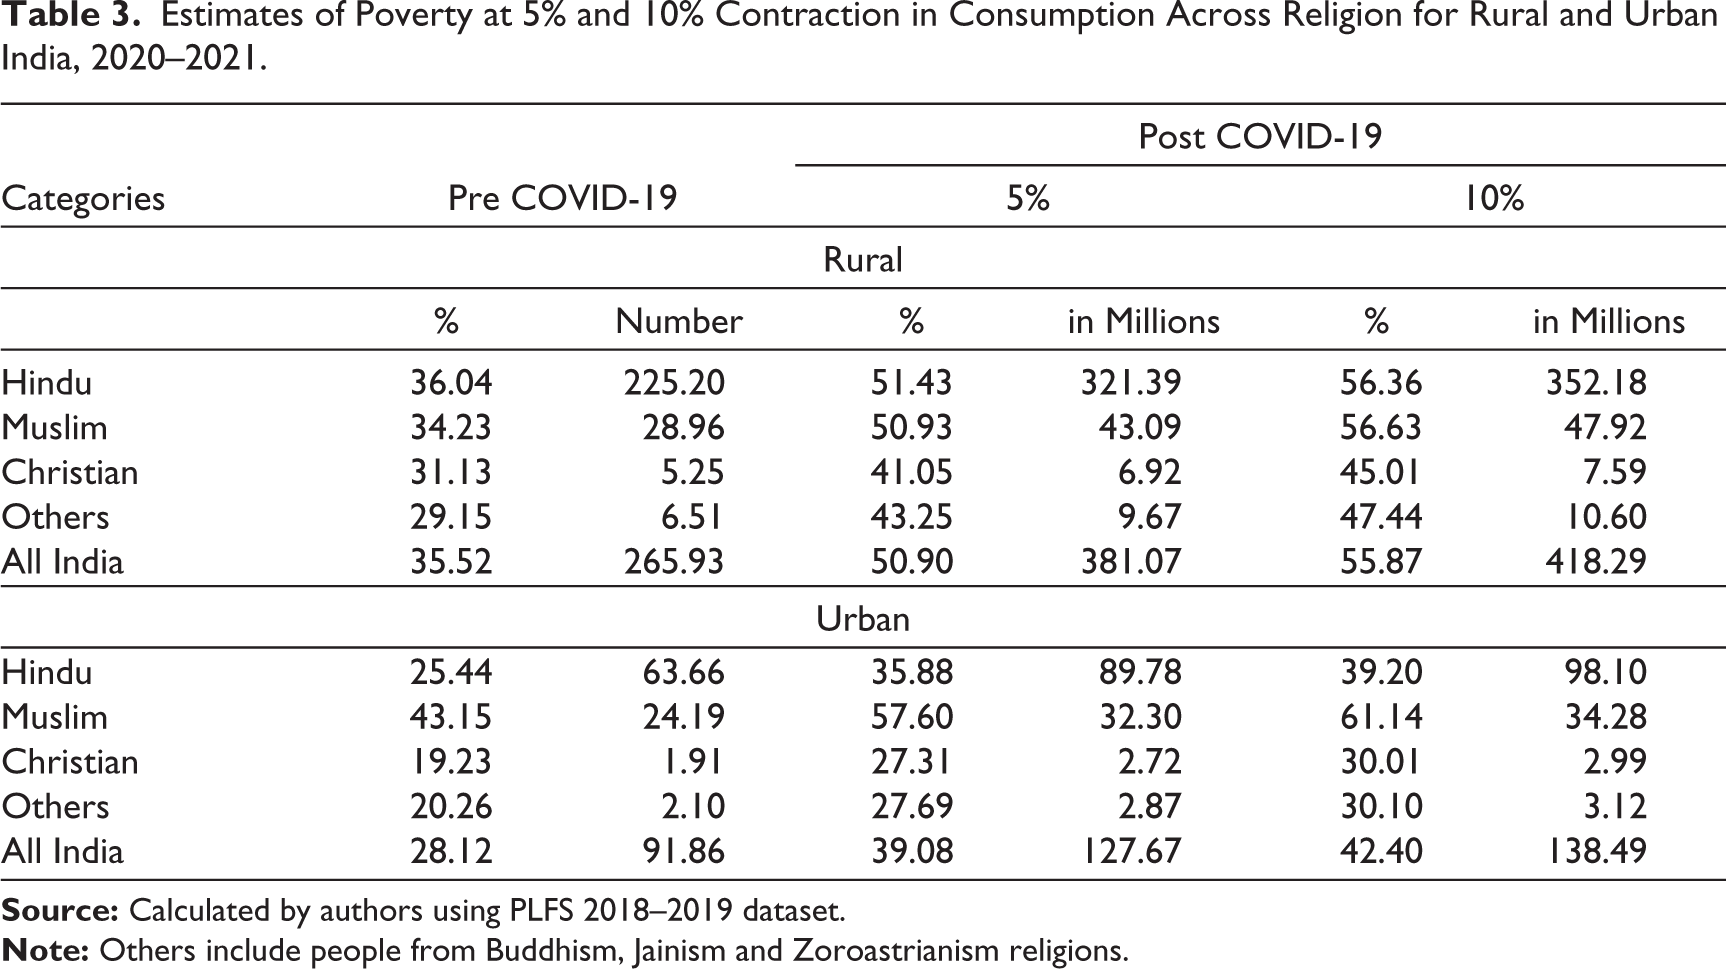
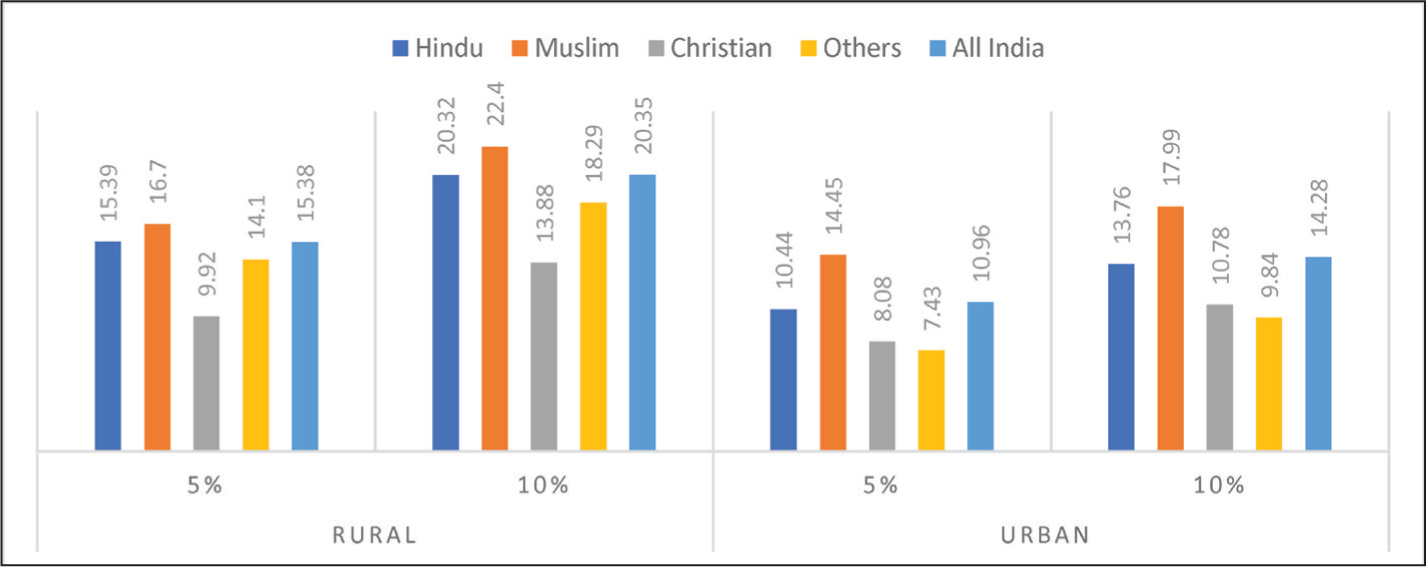
Across religious groups, general wide disparity in poverty, both pre- and post-crisis, can be seen across the Hindus and Muslims in the urban areas. Table 3 shows that around 34% and 43% of Muslims in rural and urban areas respectively were poor compared to 36% and 25% of Hindus across the same area before the crises. While the inter-religion disparity across religious groups seems not-so-alarming in rural areas, significant variation can be seen in the urban sector. The least proportion of Christians are poor compared to all other religious groups. Muslims, the second-largest religious group, and the largest religious minority in India do fairly unwell when it comes to social indicators including poverty. The table shows that in the worst scenario, as high as 61% of the urban Muslims are at risk of poverty aftermath crisis compared to 39% of urban Hindus and 30% of urban Christians. Although the inter-group disparity is more evident in urban areas, in absolute terms it is the rural sector at the max risk of the fallout of people into poverty. The highest impact of the crisis is seen in rural areas and within the Islamic group in which additional 22% of people fall into poverty under the worst scenario compared with 20% of Hindus and 13.88% of Christians (Figure 2). Overall, the impact of the crisis as moving from a 5% to 10% scenario in the rural (urban) sector, reveals an increase in group differential (between Hindu and Muslims) from 1.31 to 2.08 (4.01 to 4.23), roughly double increase between the groups.
Estimates of Poverty at 5% and 10% Contraction in Consumption Across Religion for Rural and Urban India, 2020–2021.
Muslims in India have been the most backward and deprived religious community facing persistently high poverty. Reasons owing to the differing poverty impact can be regarded as differences in occupation, wealth and asset ownership, and education. The average educational level of Muslims has remained the lowest among all other communities, while Jains and Christians top the chart. In the year 2014, only 3.8% of Muslims attained higher education compared to 8.4% of Hindus and 12.1% of Christians (Thorat & Ahmad, 2015). Additionally, based on a report by the All-India Survey of Higher Education 2017–2018, Muslim enrolment in higher education is only 5%, compared to other religious groups (Ministry of Human Resource Development [MHRD], 2019). The concentration of Muslims in petty self-employed jobs is highest and lowest in the category of regular salaried jobs. As per PLFS 2018–2019, only 10.64% of the urban Muslims are engaged in regular salaried jobs against 17.82% Hindus and 18.05% of Christians. The disparity is also corroborated by the finding that only 7.80% of Muslims in urban areas acquired higher education- lowest among all other groups. High drop-out rates, low socio-political representation, poor socio-economic status and limited employment opportunities among the Muslim population posits challenges for inclusion and betterment of the community.
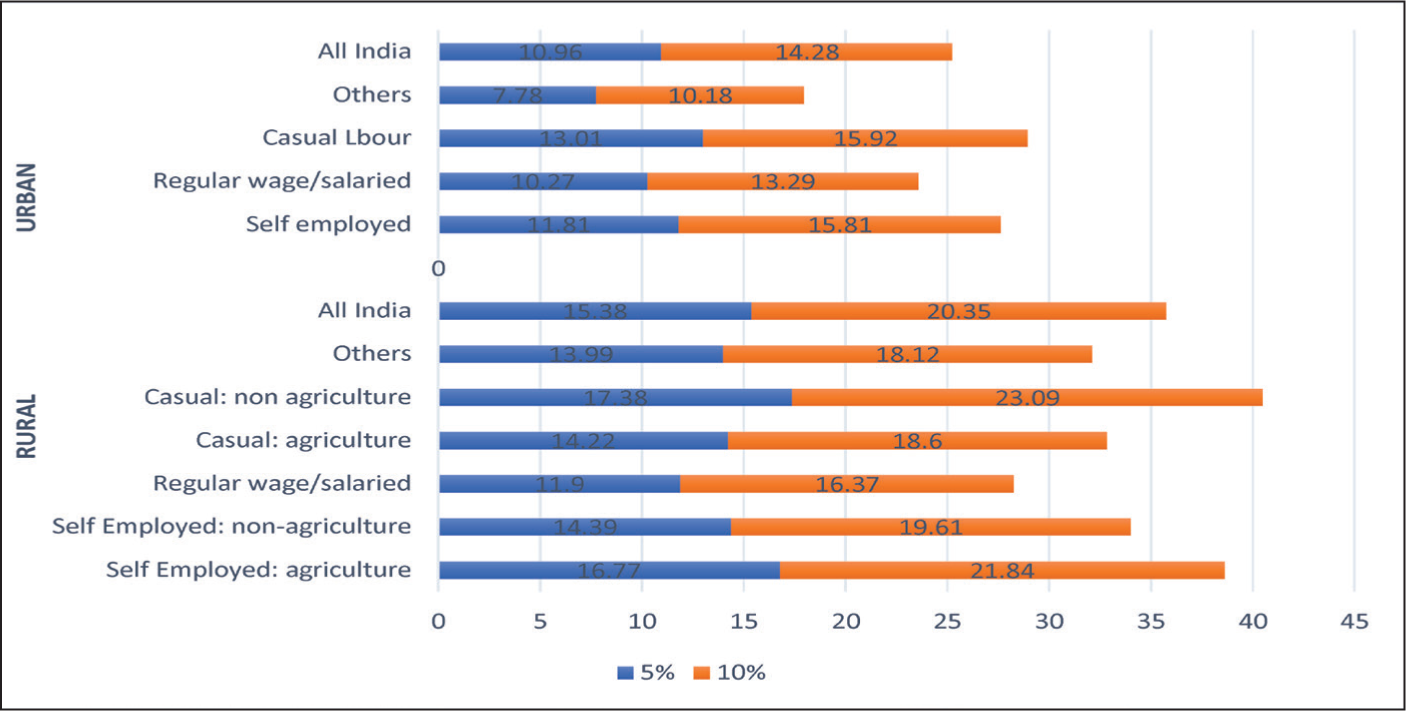
Estimates of Poverty at 5% and 10% Contraction in Consumption Across Economic Groups for Rural and Urban India, 2020–2021.
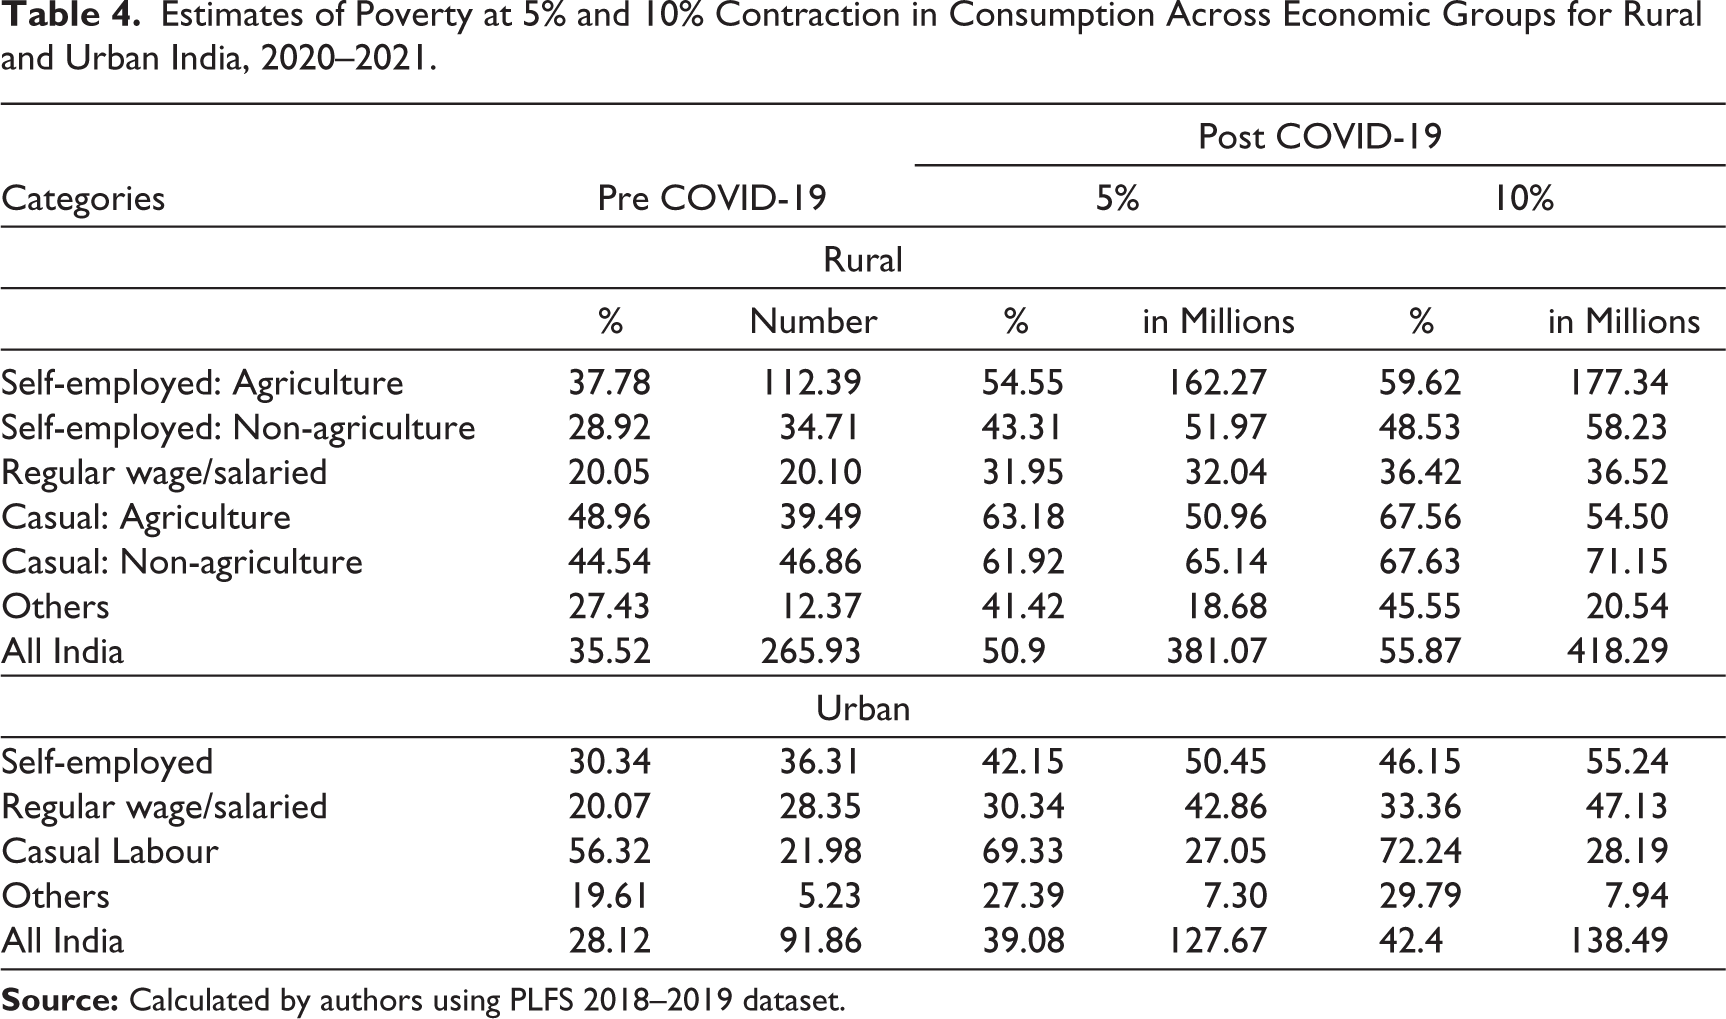
In a pre-COVID-19 time, rural poor largely consist of casual labourers and small marginal farmers, which together account for more than 70% of the rural poor. Table 4 shows that 49% of the casual agricultural and 44.54% of casual non-agricultural labours, followed by 37.78% of the self-employed agricultural households in rural areas were poor in the pre-crisis period. A similar pattern is seen in the post-crisis scenario wherein the poverty headcount for casual labourers and farmers is expected to go as high as 67% and 60% respectively. In the urban area, casual labour accounting for 12% of all households, suffered from the highest poverty rate (56%) in pre-COVID-19 time followed by self-employed households managing small petty shops and businesses. The aftermath of the crisis is expected to push up to 70% to 72% of the casual labour households and 42% to 46% of the self-employed households into poverty and impoverishment. Further, it can be seen that the rural impact of the crisis is higher than the urban counterpart. It is only at the lowest scenario (at 5%) that casual non-agricultural labour households in rural and casual labour in urban areas bear the same impact, leading to an additional 13% of people in each category to fall into poverty (Figure 4). Figure 3 also reveals that the most vulnerable to poverty are farmers and non-agricultural casual labour in the rural, and self-employed and casual workers in the urban areas. Around 17% to 23% additional non-agricultural contractual workers fall into poverty, leading to headcount ratios for this group as high as 61.92% to 67.6% in post shock relative to other groups when compared to prior the shock in the rural areas (Table 4). This indicates that while in pre-Covid time, the substantive non-agricultural casual population was classified poor (44.54%), a greater population of this group was vulnerable to poor (close to the poverty line) that even moderate consumption shocks (5%) can cause a steep increase in this population falling in poverty (bringing it at par with post crisis headcount of casual agricultural labours). Further, within-group disparity reflected by varying degrees of impact across economic groups in the urban India is higher than that of the rural. At the highest assumed contraction, the coefficient of variation of impact across economic groups in urban areas is 0.21 while for rural, it is 0.39. Last, the inherent nature of having a regular stream of income places the ‘Regular Salaried’ households in the relatively better-off group irrespective of the level of contractions. However, in absolute numbers around 17–22 million people from regular salaried households (12% to 16% of total regular salaried households) are expected to descend to poverty due to prevalent pay cuts and job losses.
Thus, the analysis reveals that the high impact bearer group in rural areas are self-employed agricultural households and non-agricultural casual labour. In the urban areas, casual workers are the most vulnerable group. Farm distress, rural indebtedness, lack of infrastructures, small, marginal scattered landholdings, ineffective minimum support prices, adverse terms of trade and corporatization of agriculture are contributing factors for vulnerability for such labourers in rural area (Bhoi & Dadhich, 2019; Swain & Nayak, 2018). In the urban area, it is mostly the informal nature of jobs, depressed earnings and little to no social security that places the casual workers at the brink of market uncertainties and vulnerabilities (Sastry, 2004).
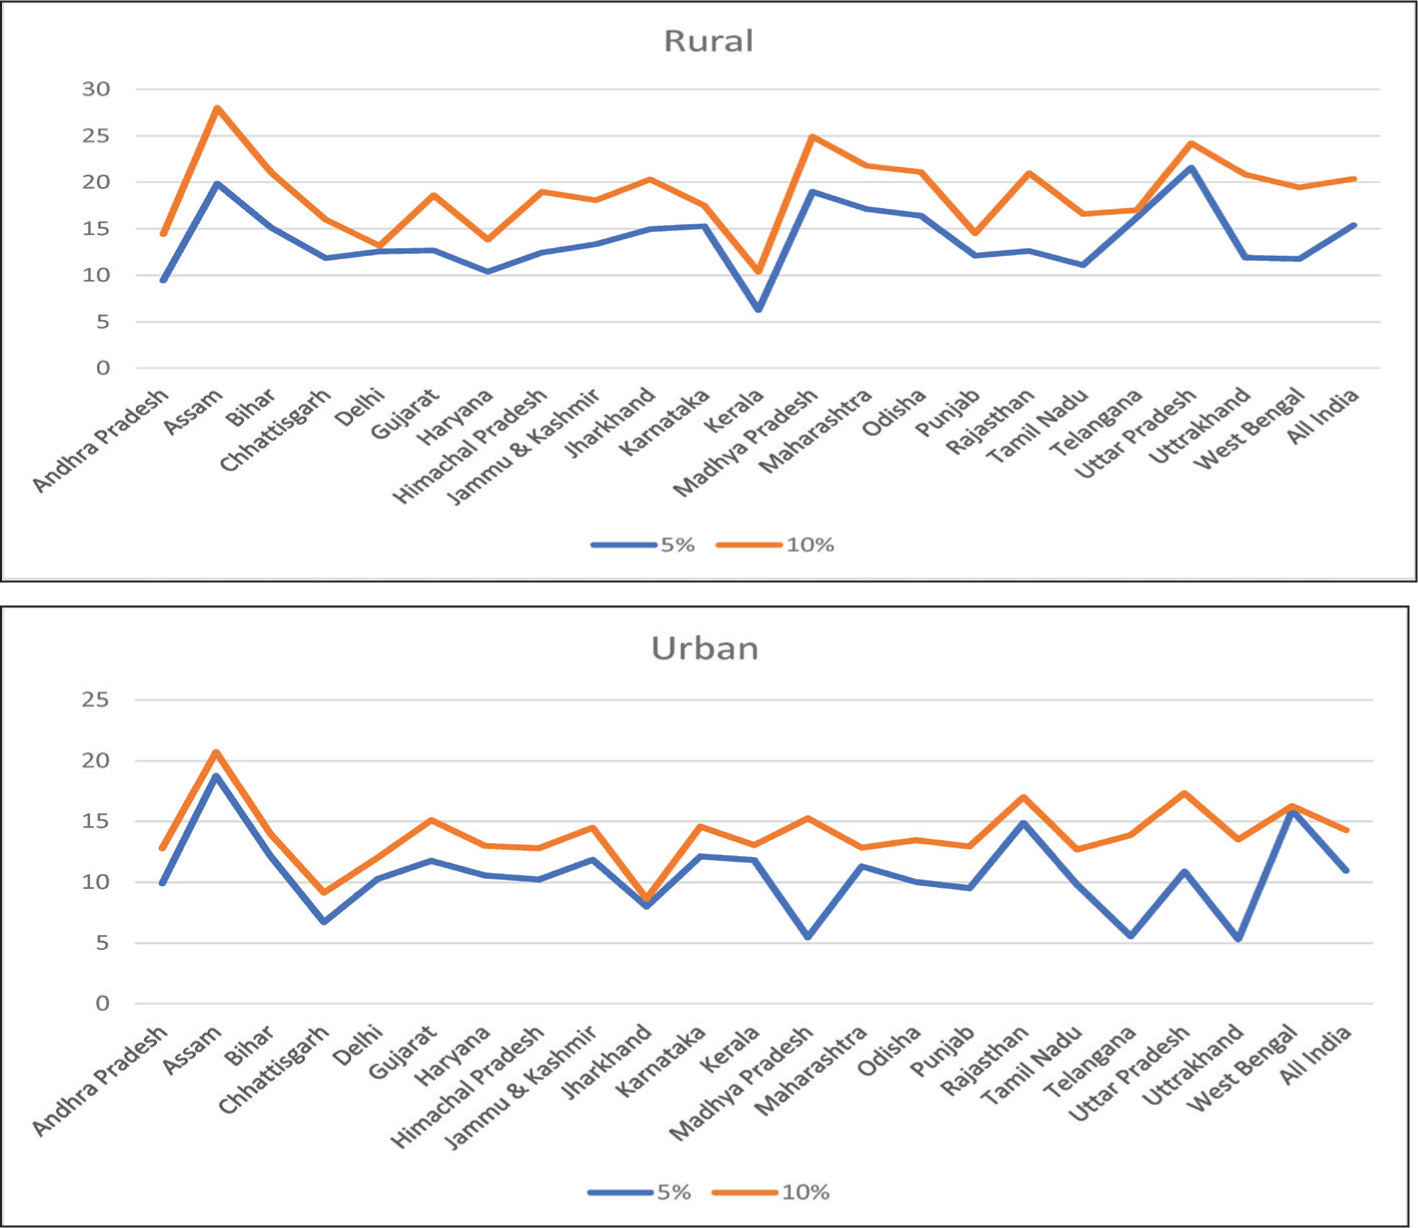
Across states, Bihar, Chhattisgarh, Madhya Pradesh and Uttar Pradesh have higher post contraction poverty as compared to other states in both rural and urban areas. Table 5 shows that the post contraction poverty estimates for these states is as high as 50% to 80% in the rural areas, while in the urban areas, estimates range between 40% and 70% higher than the national average at all levels of contractions. These states have also had higher incidence of poverty in the pre-Covid time.
Estimates of Poverty at 5% and 10% Contraction in Consumption Across States in India, 2020–2021.
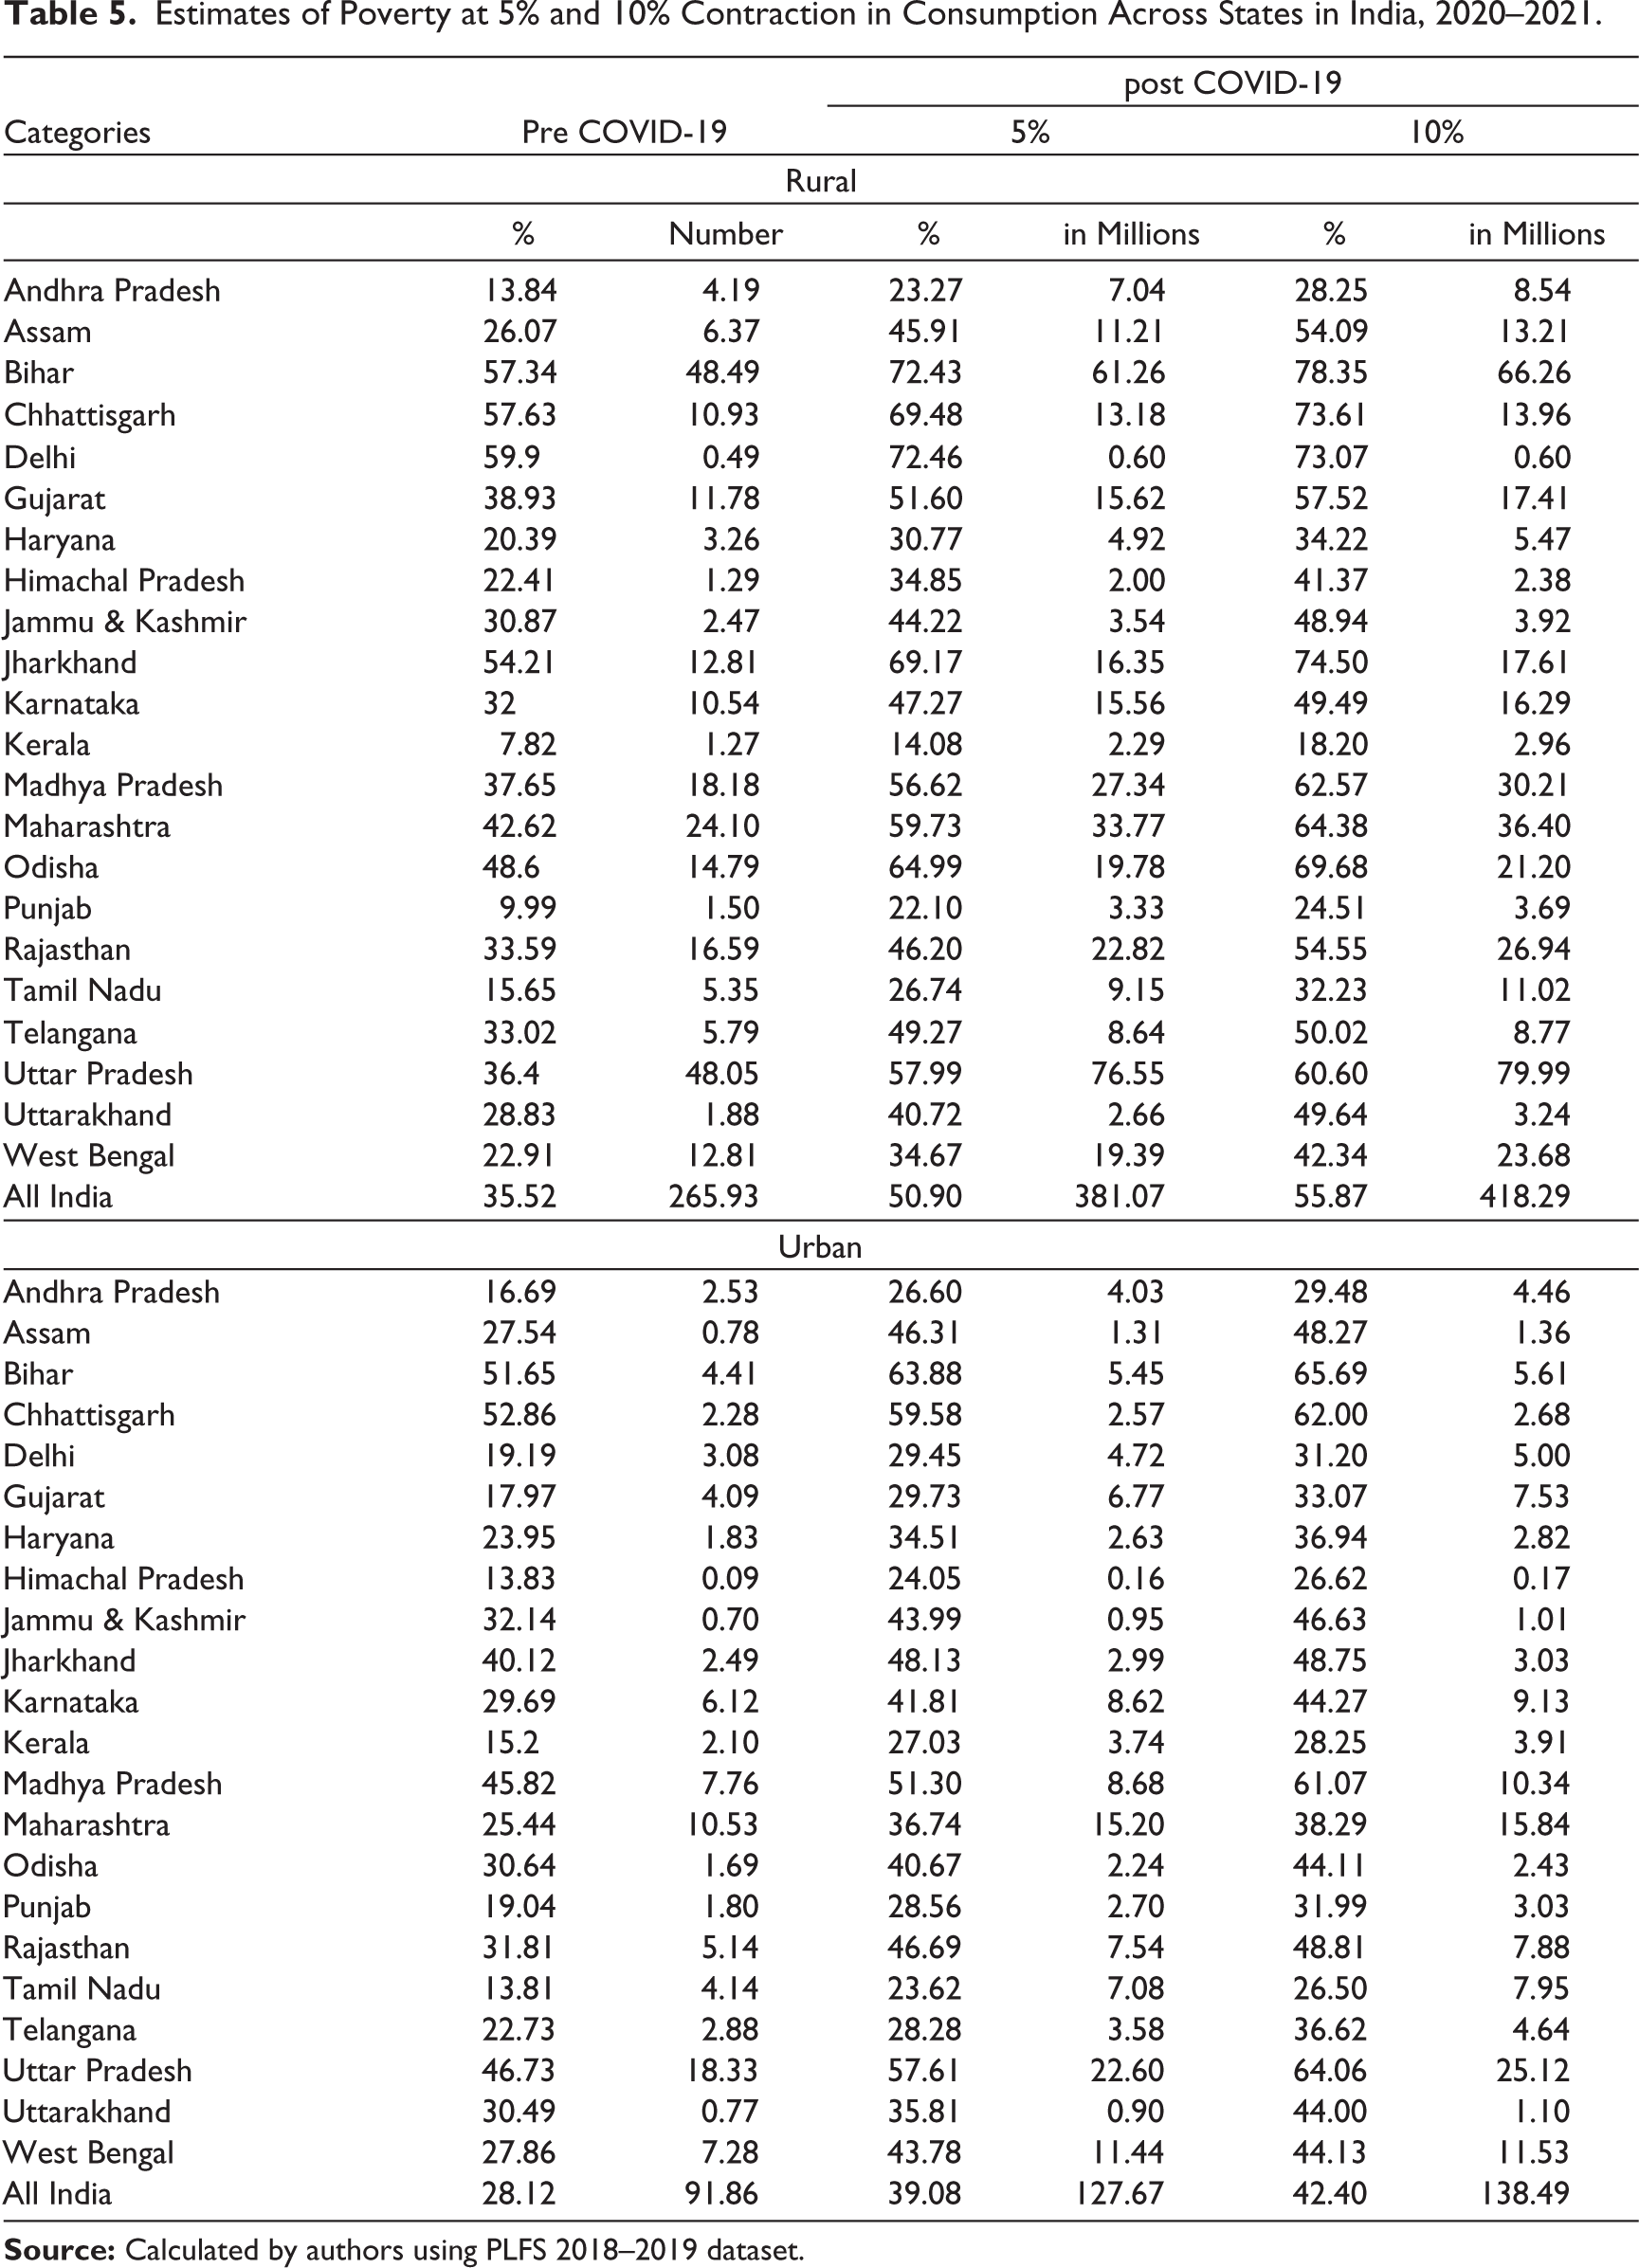
Figure 4 shows that the impact measured in terms of additional people falling below the poverty line is significantly lower in Kerala, Punjab, Andhra Pradesh and Tamil Nadu than the country’s average in both rural and urban areas. However, in contrast, states such as Assam, Bihar, Uttar Pradesh and Madhya Pradesh perform worse than the all-India average in both areas. One probable reason for these states to be the ‘high impact bearing states’ is their low per capita income and having a large number of people near the poverty line. High inter-regional (within states) inequity in terms of per capita income and growth in per capita income further explains their position relative to other states (Chauhan et al., 2016; Dubey et al., 2017).
Further on, two critical observations can be made at the lowest level of assumed contraction. First, few states display poverty impact which is higher than the national average under the lowest level of assumed contraction (5%) and not at the worst scenario of 10%, depicting severely skewed within-state income disparity. These are Bihar, Jharkhand, Odisha in rural India, and Uttar Pradesh and Odisha in urban India. One plausible explanation in the case of Bihar, Jharkhand and Odisha is their heavy rural-dominated geography and considerably low urban workforce; low urbanization is directly related to low average incomes. Second, there are states such as Maharashtra, Madhya Pradesh, Karnataka and Uttar Pradesh revealing high rural–urban variation wherein rural areas are highly vulnerable to poverty-prone areas while their urban counterparts are relatively better-off. One peculiar case is Maharashtra bearing 17% to 21% additional rural inhabitants who’d succumb to poverty compared with 11% to 13% of urban Maharashtrians. We may attribute the observed pattern to a relatively better-off urban sector in Maharashtra homing 40% of its total workforce, possessing higher than India’s average level of earnings, education and work status. Besides, Maharashtra along with Gujarat also tops the chart as the two most unequal states with Gini’s Index as high as 0.441 and 0.443 respectively (Gradín, 2018). Hence, the rural–urban differential coupled with low rural incomes is indicative of intra-regional disparities within these states such that the income distribution is highly skewed ergo majority of the rural people in these states are located close to the poverty line.
Conclusion
Our estimates have shown that an additional influx of 150–199 million people into poverty due to the ongoing COVID-19 crisis at 5% to 10% of assumed contractions in per capita consumption expenditure. The analysis further suggests that the rural–urban divide is prominent and the impact is spread unevenly across both sectors. Projecting the proposed contractions on the two sectors reveals that the urban sector will have a lesser impact on the poverty estimates. This is attributed to a better socio-economic profile of the urban population as compared to the rural population. The estimates show that in the second scenario of a 10% contraction in GDP, nearly four-fifth of SC/ST fall into poverty compared to half of the people from the other groups. Similar results are estimated for the religious minorities, with Islam at the maximum potential of fallout, followed by Hindus, Christians and others. Amongst the household type, casual labour households in the urban sector are the most impacted group, followed by self-employed and regular salaried. Additionally, the low-income states bear the highest incidence of poverty, followed by the middle-income states due to the crises. The marked income inequity in the low-income states will increase in post COVID-19 contractions. In the high-income states, the brunt of COVID-19 is seen in rural areas due to a large number of the rural population living near the poverty line and majorly because the area lacks employment and livelihood opportunities.
Our estimates suggest implications of an ever-diverging gap between the haves and the have nots in the country. Much of these gaps are consequent of social exclusion and marginalization processes that restrict capabilities among certain sections of our population. It is, therefore, crucial to investigate deeper into these societal nuances and identify policies to enhance the capabilities of the weaker sections of our society. A well-regulated universal education program with mandatory schooling laws (up to at least senior secondary level) will be a step in right direction. The quality of employment in India is another factor responsible for its incessant nature of poverty. More than 70% of the employment is informal, majority of it being seasonal and low-paying. We see that around 32% of the urban informal workers are earning below the minimum wage and around 10% are earning below the poverty line income level (Ram & Yadav, 2021). Therefore, it is essential to revise the minimum wage and introduce the ameliorated version of ‘living wage’.
A rising number of poor can lead to demand shocks in the economy, leading to further contractions in GDP growth. Therefore, the identification of poor and vulnerable groups is the need of the hour, followed by directed interventions under the ambit of National Food Security, Direct Benefit Transfer and other social security programmes prevent such groups from further falling deeper into poverty. A large fiscal stimulus along with intermediate informal employment insurgency through MGNREGA and other employment generation programmes are urgent to rein the adverse impact of COVID-19 on the welfare of the masses.
Footnotes
Declaration of Conflicting Interests
The authors declared no potential conflicts of interest with respect to the research, authorship and/or publication of this article.
Funding
The authors received no financial support for the research, authorship, and/or publication of this article.