
Abstract
Urban sprawl remains an impediment to sustainable development, generating inefficient land-use, escalating infrastructure costs and environmental degradation. Urban Growth Boundaries (UGBs) are widely adopted to encourage compact growth, but their effectiveness depends not only on curbing outward expansion but also on the morphological qualities of development within the boundary. Existing evaluations often emphasise boundary compliance, overlooking internal urban morphology. This study develops a multidimensional, spatial-analytic framework to evaluate the performance of Melbourne’s UGB between 2000 and 2020. By integrating Shannon’s entropy, Local Indicators of Spatial Association (LISA), and landscape metrics, the analysis quantifies spatial dispersion, land-use homogeneity, and settlement patterns using Landsat imagery. The results show that sprawl persists despite containment, with relative entropy increasing from 0.84 to 0.88, edge expansion emerging as the dominant growth mode, and fringe local government areas characterised by dispersed, mono-functional, and poorly accessible development. In contrast, inner areas retained compact, mixed-use, and transit-accessible forms. The study introduces a three-tier morphological typology linking spatial forms to differentiated planning responses. By aligning measurable spatial outcomes with UGB objectives, the study demonstrates how integrated spatial metrics can serve as a diagnostic tool for assessing containment policy performance, detecting emerging sprawl trajectories, and supporting adaptive, spatially differentiated growth management strategies.
Keywords
Introduction
Cities worldwide are rapidly expanding, often in a dispersed, low-density pattern and characterised by car-dependent development, commonly referred to as urban sprawl. Despite its adverse effects on sustainability, urban sprawl remains a pervasive form of urban growth driven by increased population, speculative land markets, and development pressures (Soltani et al., 2025). This often leads to environmental degradation, increased infrastructure costs, loss of agricultural land, and social segregation, making it a key policy concern (Shao et al., 2021).
Planning paradigms have increasingly prioritised compact city model to mitigate the negative externalities of urban sprawl (Isinkaralar, 2023). To foster compact development and alleviate urban sprawl, one of the planning instruments is the Urban Growth Boundary (UGB) (Liu et al., 2022). The UGB is a regulatory tool that designates geographical limits on how far out the city can expand by concentrating urban development within a defined boundary (Yang et al., 2021).
However, empirical studies have documented unintended consequences of UGB, such as leapfrog development, escalating housing costs due to restricted supply, and politically influenced revisions that undermine long-term planning objectives (Qi et al., 2024), raising concerns about whether UGBs reliably achieve their intended outcomes. Moreover, most evaluations of UGBs remain narrowly focused on boundary compliance, neglecting whether the development within the boundary reflects the intended urban morphology.
This limitation is widely recognised in the planning evaluation literature, which argues that policy effectiveness should be assessed by linking planning objectives to observable outcomes rather than compliance alone (Faludi, 2000). Outcome and impact-oriented evaluation further emphasises examining the tangible spatial effects of planning instruments (Laurian et al., 2010; Shahab et al., 2017). This implies that UGB effectiveness be evaluated not only by whether growth stays within the boundary but by the extent to which urban morphology shifts toward compactness, functional mix, and accessibility (Jun, 2004; Tan et al., 2022).
Recent research has advanced urban morphology through quantitative metrics derived from buildings, blocks, and spatial footprints, supporting land-take estimation and diachronic assessment of physical change (Jehling and Hecht, 2022; Lagarias and Stathakis, 2025; Tümtürk et al., 2025). Morphological configurations have also been linked to socioeconomic conditions and household resource use (Alam and Banerjee, 2025; Venerandi et al., 2024). Despite these advances, the integration of urban morphology into spatial policy evaluation remains limited (Amer et al., 2021).
Policy-outcome evaluation requires spatially explicit indicators that translate planning objectives into measurable variables and allow temporal assessment of alignment with policy intent (Grădinaru et al., 2017). This indicator-based approach operationalises the evaluation of containment instruments by assessing whether urban growth morphology shifts in line with policy intent.
Alongside morphology-based evaluations, recent studies have assessed UGB effectiveness using human-activity datasets (e.g. location check-ins and mobility traces) to capture functional responses to containment policies (Long et al., 2021). While these approaches provide valuable insights, their temporal availability and sampling biases can limit consistent multi-decadal assessment. This study, therefore, contributes a complementary, morphology-based evaluation using consistently available spatial datasets over two decades, enabling a policy-relevant diagnosis. Additionally, urban form studies often use isolated metrics and lack integration across the multidimensional nature of urban morphology (Silva and Vergara-Perucich, 2021).
This study addresses this gap by adopting a multidimensional morphology-based analytical framework to evaluate the effectiveness of UGB. It spatially examines UGB by detecting changes in city expansion and further investigates the dimensions where its performance is most contested, including dispersion, land-use homogeneity, settlement pattern, and public transport accessibility. By linking policy outcomes to spatial patterns, this approach offers a scientifically grounded method for assessing the extent to which planning objectives are achieved in practice. In this context, we examine whether the UGB was effective in reducing sprawl by taking a case study of the Melbourne Metropolitan Area.
Melbourne, the capital of Victoria, Australia, has experienced rapid population growth from 3.33 million in 2001 to 4.83 million in 2021 (Australian Bureau of Statistics, 2021a), driving extensive suburban expansion. Melbourne implemented a UGB policy to foster compact growth (State of Victoria, 2002). Achieving the UGB’s objectives depends not only on where growth occurs but also on how it manifests spatially. Melbourne’s persistent sprawl dynamics mirror challenges in metropolitan regions globally, making it a relevant case for evaluating urban containment policies (Liu et al., 2022).
Evaluating spatial planning instruments requires moving beyond stated intent to examining whether objectives translate into observable spatial outcomes. Outcome evaluation frameworks emphasise spatially explicit indicators to identify alignment with, or divergence from, policy goals (Grădinaru et al., 2017). In this context, a morphology-based diagnostic is particularly relevant for UGBs because their core rationale is to influence the physical structure of urban growth.
The main objective of this research is to evaluate the effectiveness of the UGB in achieving its intended morphological outcomes across the Melbourne Metropolitan Area, as outlined in Plan Melbourne 2017–2050, particularly those promoting compact, accessible, and mixed-use development. The study applies a multidimensional morphology-based framework, combining Shannon’s entropy, Local Indicators of Spatial Association (LISA), and landscape metrics to analyse two decades of spatial transformation. The study quantifies metropolitan-scale spatial change from 2000 to 2020 and examines how sprawl outcomes vary across LGAs, recognising that containment effects may be uneven across jurisdictions within the same metropolitan policy setting. The resulting typology of urban forms offers a diagnostic tool to inform adaptive and differentiated policy directions for managing urban sprawl. In doing so, it moves beyond compliance-based assessments to demonstrate how integrated morphology-based analytics can link spatial patterns with planning outcomes, offering both methodological and policy-relevant contributions.
Theoretical framework: Urban sprawl morphology
Spatial planning policy outcomes can be understood as the spatial effects that planning instruments aim to produce and can be evaluated through observable patterns in urban form (Grădinaru et al., 2017). The theoretical premise is that spatial planning instruments influence where and how urban development occurs, accumulating into measurable morphological outcomes. This framing aligns with outcome-oriented and morphology-based evaluation approaches that trace planning intent through quantitative indicators of urban form (Jehling et al., 2018; Jehling and Hecht, 2022).
As a spatial planning instrument, UGBs are intended to reduce spatial dispersion and foster a more compact, infill settlement pattern within the delineated boundary, thereby controlling sprawl (Jun, 2004). However, urban sprawl is a multifaceted and contested notion, without a universally accepted definition (Tikoudis et al., 2022), which complicates its assessment. Sprawl is often operationalised through single indicator proxies, most prominently density-based measures, and SDG 11 ‘Sustainable Cities and Communities’, which defines sprawl as urban land expansion outpacing population growth (United Nations, 2015). The widespread reliance on population density as an indicator of sprawl is increasingly viewed as insufficient (Martellozzo and Clarke, 2011) as density alone fails to capture the complexity of urban form (Dadashpoor and Shahhossein, 2024).
Beyond single proxies, sprawl is assessed using composite indicators and pattern-based metrics of the spatial arrangement of development, complemented by public transport accessibility and travel mode choice (Lee, 2024; Salem and Tsurusaki, 2024; Shi et al., 2023). The present study follows Pradhan et al. (2025), who provide an explicitly policy-oriented morphological framework by systematically synthesising sprawl scholarship to identify a comprehensive set of complementary urban-form dimensions that spatial planning instruments seek to influence.
Theoretical framework illustrating the morphological dimensions of urban sprawl.
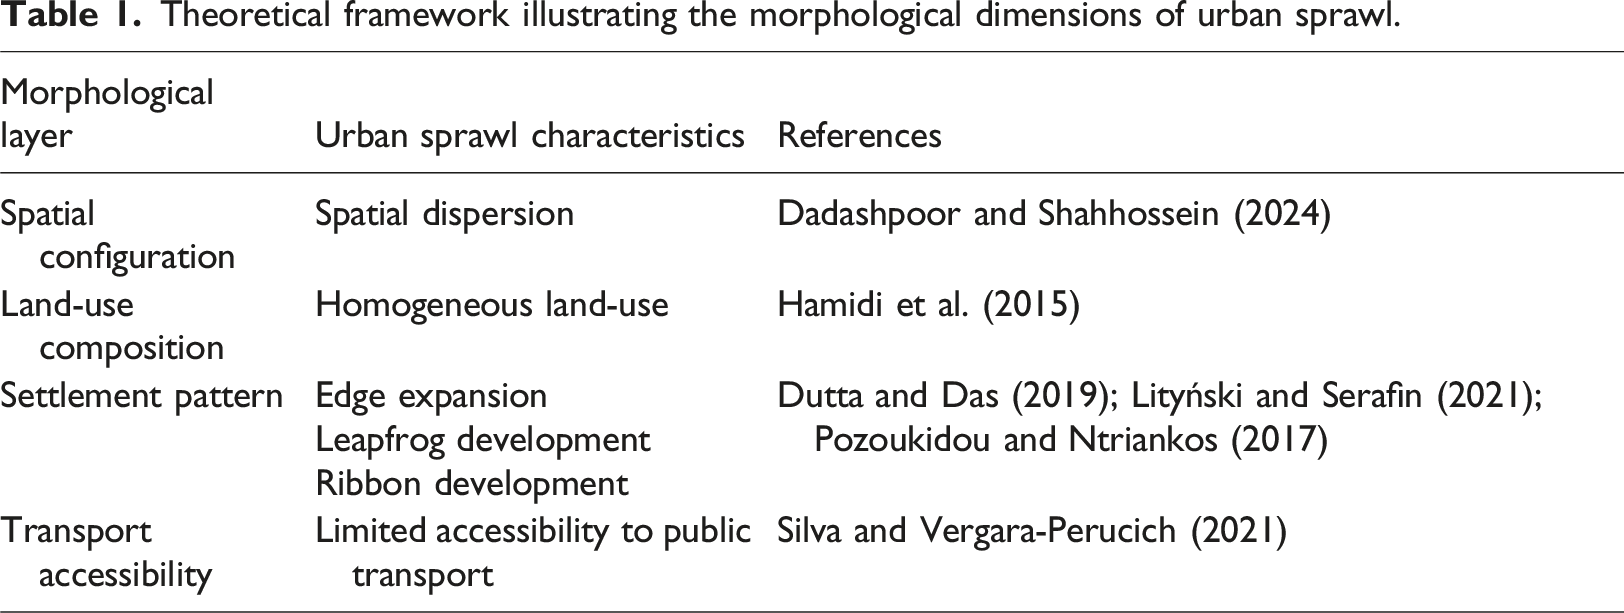
Complementary methodological streams widely used in sprawl studies include entropy-based dispersion measures (Kumar et al., 2020), spatial autocorrelation statistics to detect local clustering (Feng et al., 2019), landscape-metric approaches to characterise settlement patterns (Lityński and Serafin, 2021), and accessibility-based diagnostics associated with car-dependent urbanisation (Silva and Vergara-Perucich, 2021).
Study area
Melbourne Metropolitan Area
The Melbourne Metropolitan Area comprises 31 Local Government Areas (LGAs) and covers 9992.5 km2 (Figure 1). Melbourne, the capital of Victoria, is situated in southeastern Australia. The total population of metropolitan Melbourne is 4,917,750 (Australian Bureau of Statistics, 2021a), which is projected to increase to 8.4 million in 2051 (State of Victoria, 2019). Study area context showing the Melbourne Metropolitan Area and Local Government Areas used as the spatial units of analysis (adapted from Department of Transport and Planning, State of Victoria, 2024a).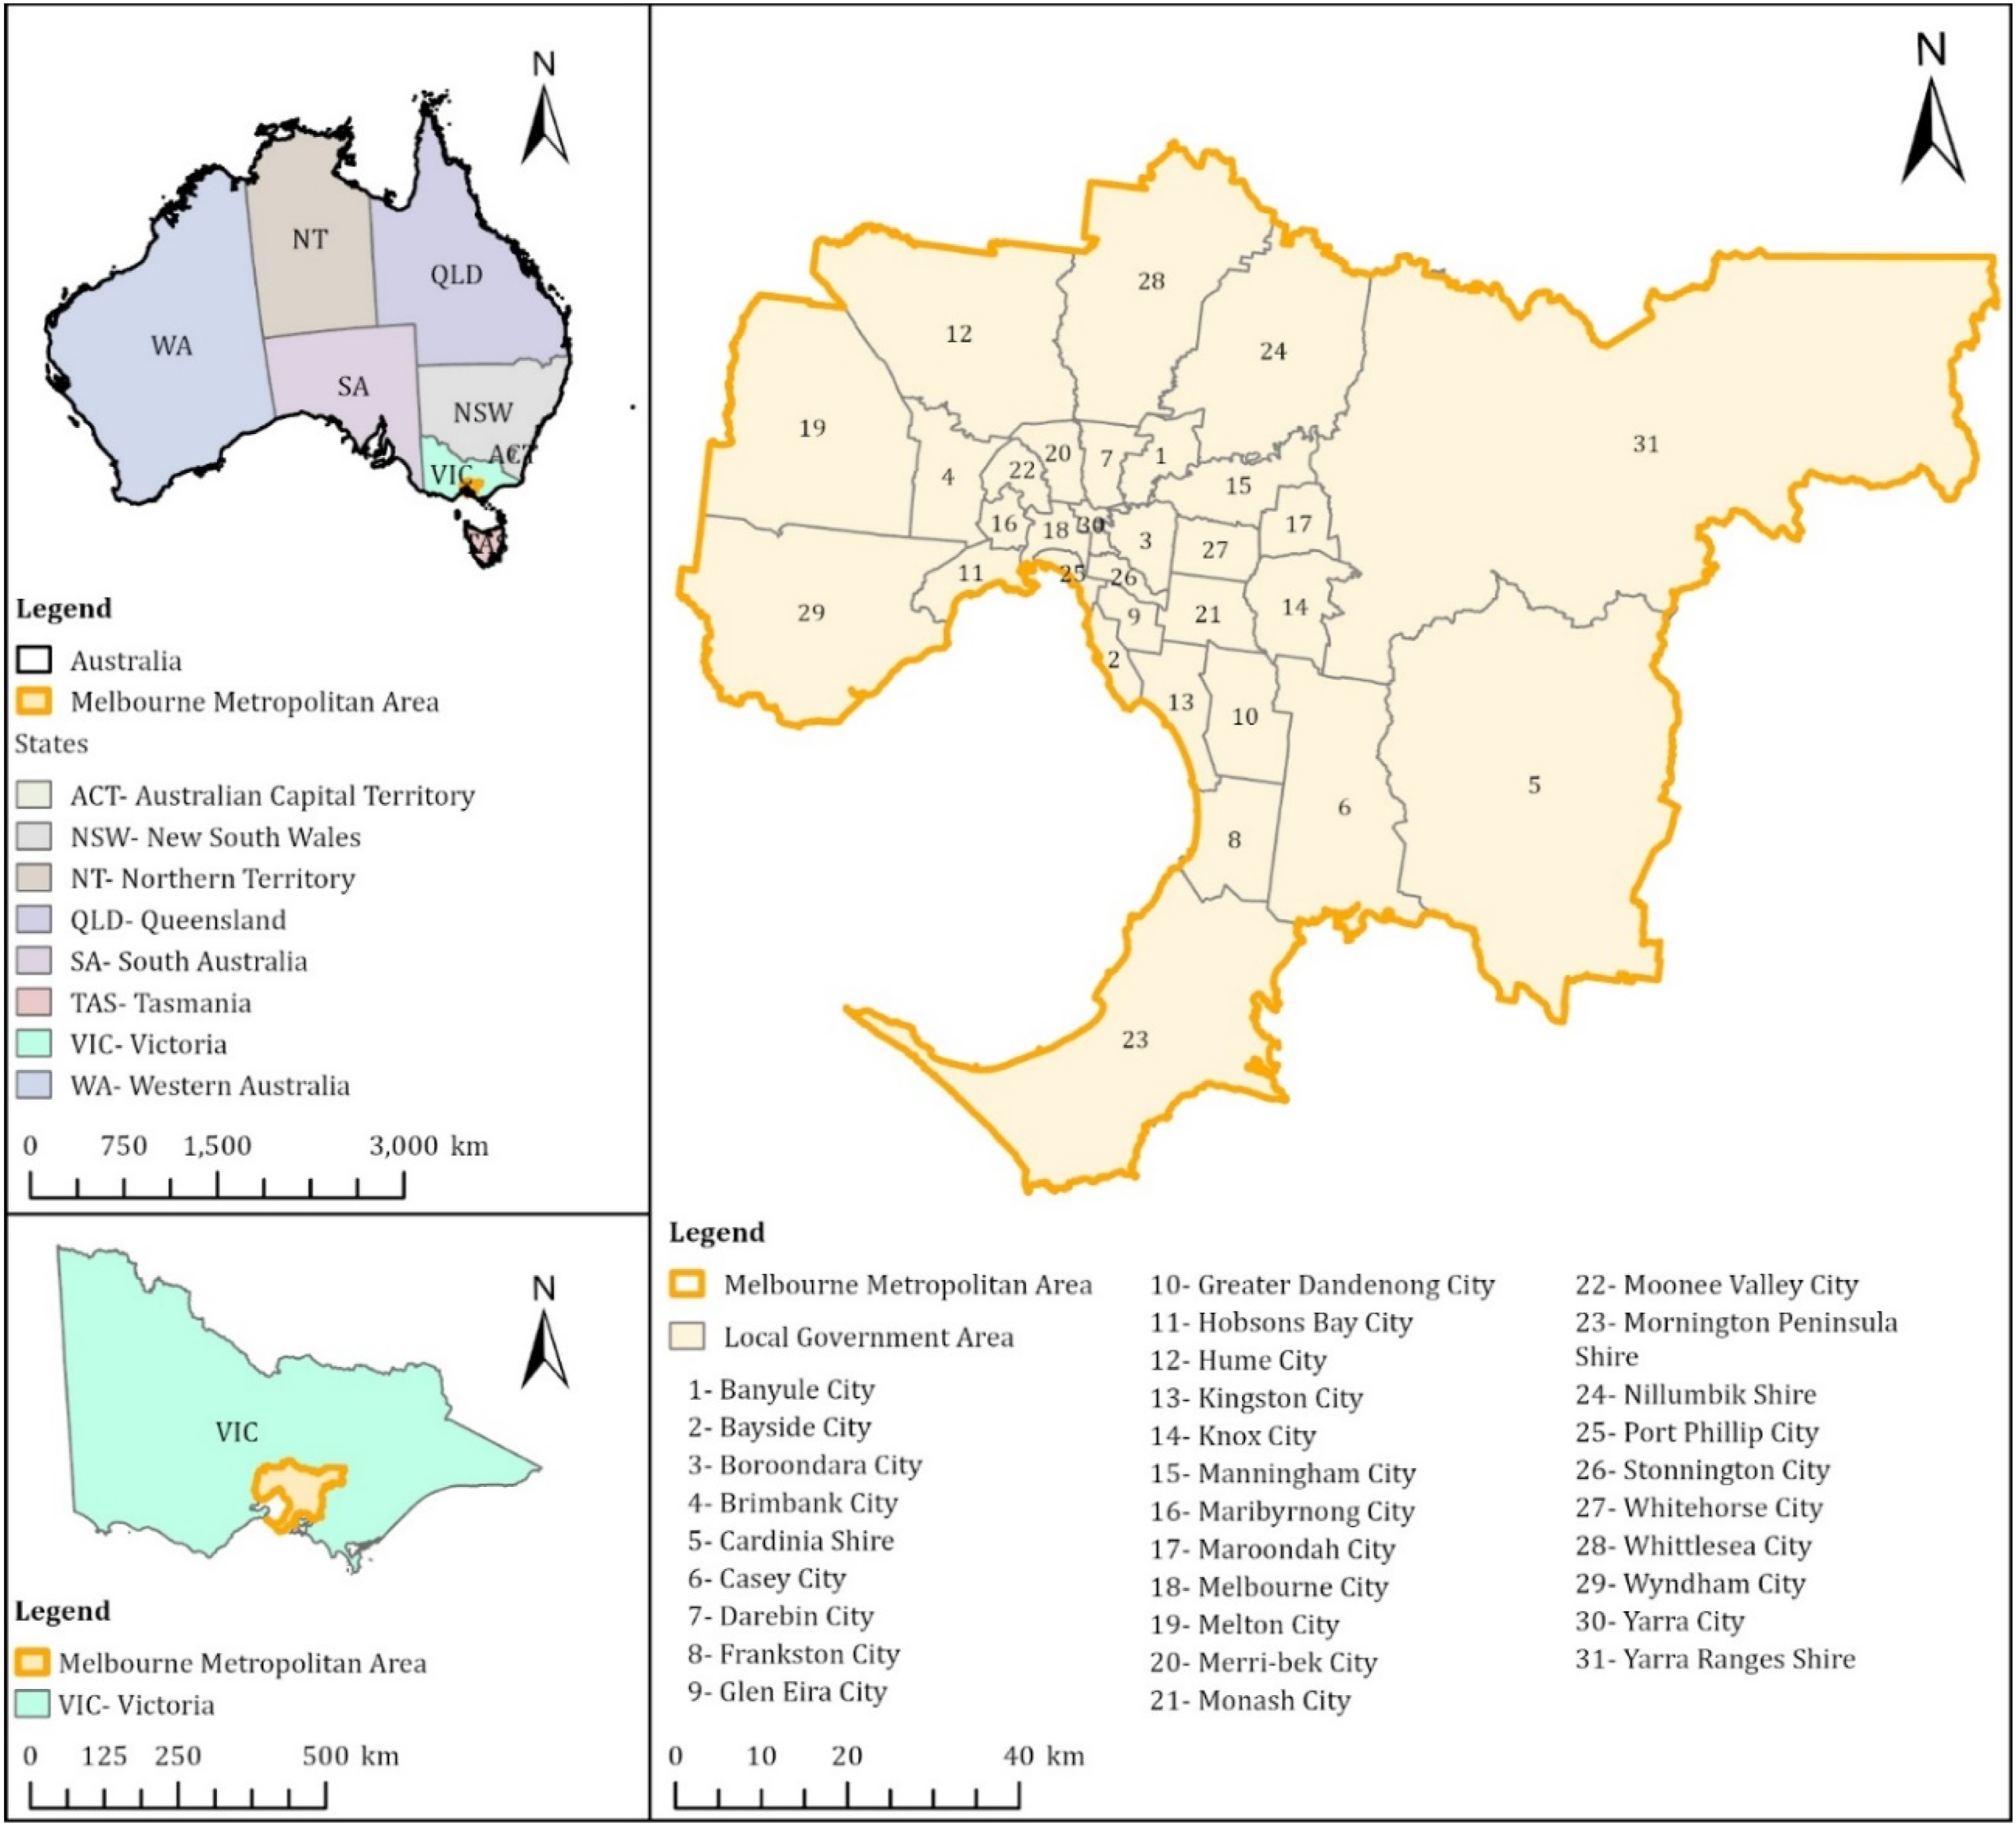
Urban Growth Boundary (UGB), Melbourne
Evolution of metropolitan strategies and UGBs in Melbourne (2002–2017).
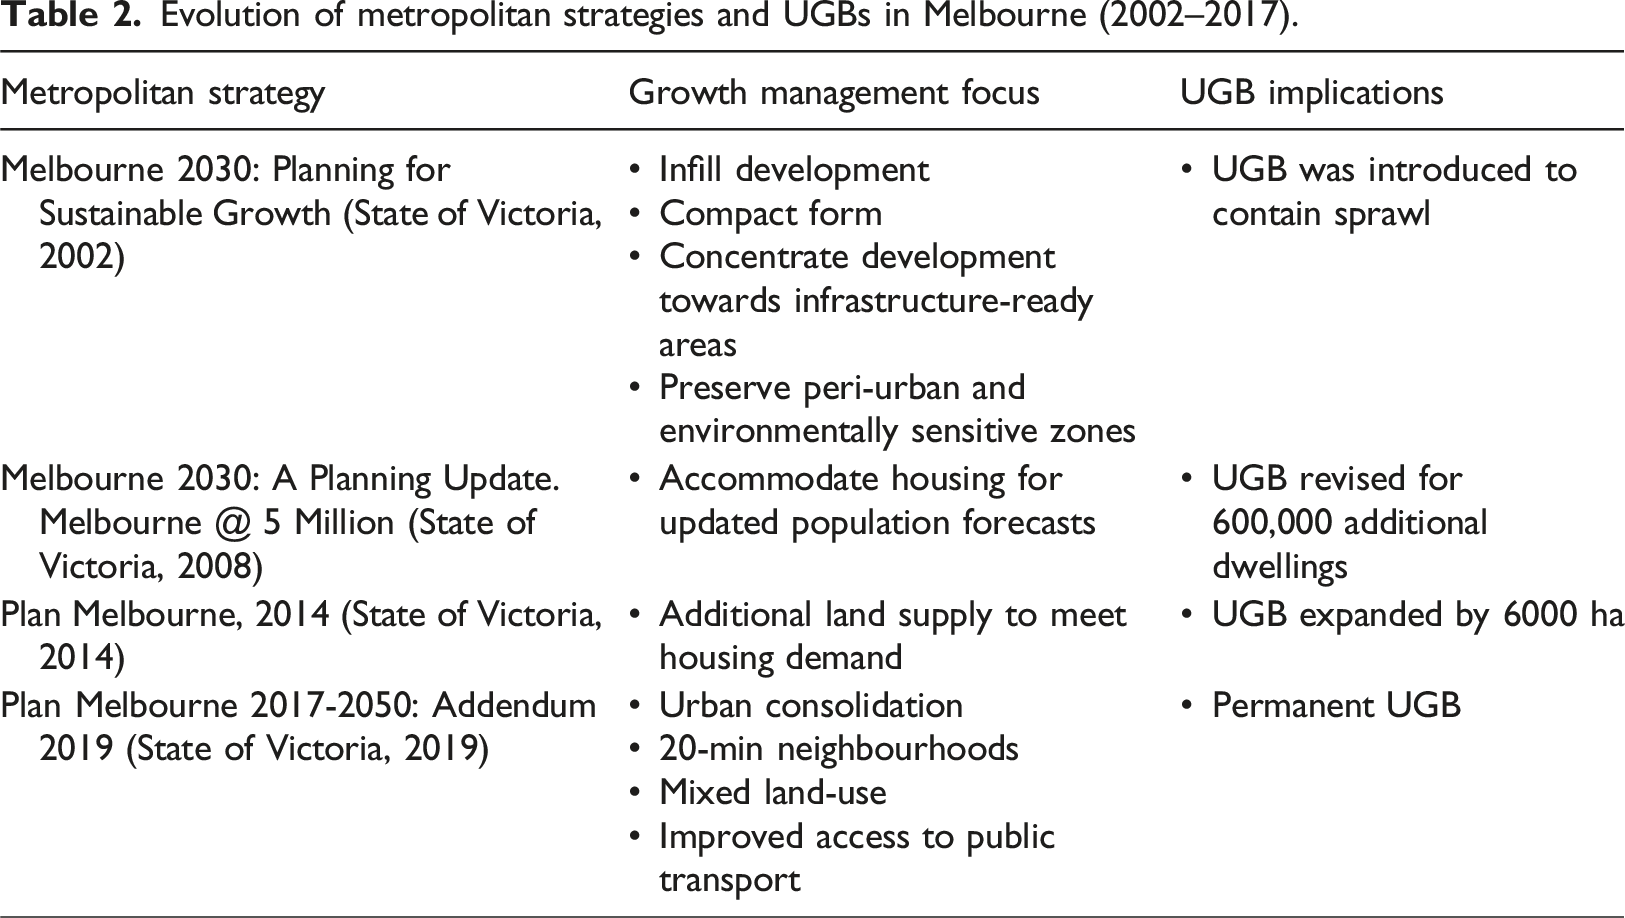
The current strategy, Plan Melbourne 2017-2050 (Addendum 2019), reaffirms the UGB as the permanent outer limit of urban growth under Policy 2.1.1 (State of Victoria, 2019). The strategies collectively aim to achieve outcomes such as compact urban growth, infill development, land-use diversity, and enhanced transit accessibility, which represent the intended outcomes of the UGB.
Methodology
This study evaluates the effectiveness of Melbourne’s UGB to contain urban sprawl and promote compact growth, infill development, mixed land-use, and improved public transport accessibility. To assess these objectives, a multidimensional urban morphology framework is employed, illustrated in Figure 2. The analysis operationalises UGB objectives through four morphological layers, including spatial configuration, settlement patterns, land-use composition, and transport accessibility. Each layer is examined using spatial methods and supported by spatial and/or temporal data. Methodological framework for evaluating the effectiveness of Melbourne’s UGB using urban sprawl morphology indicators.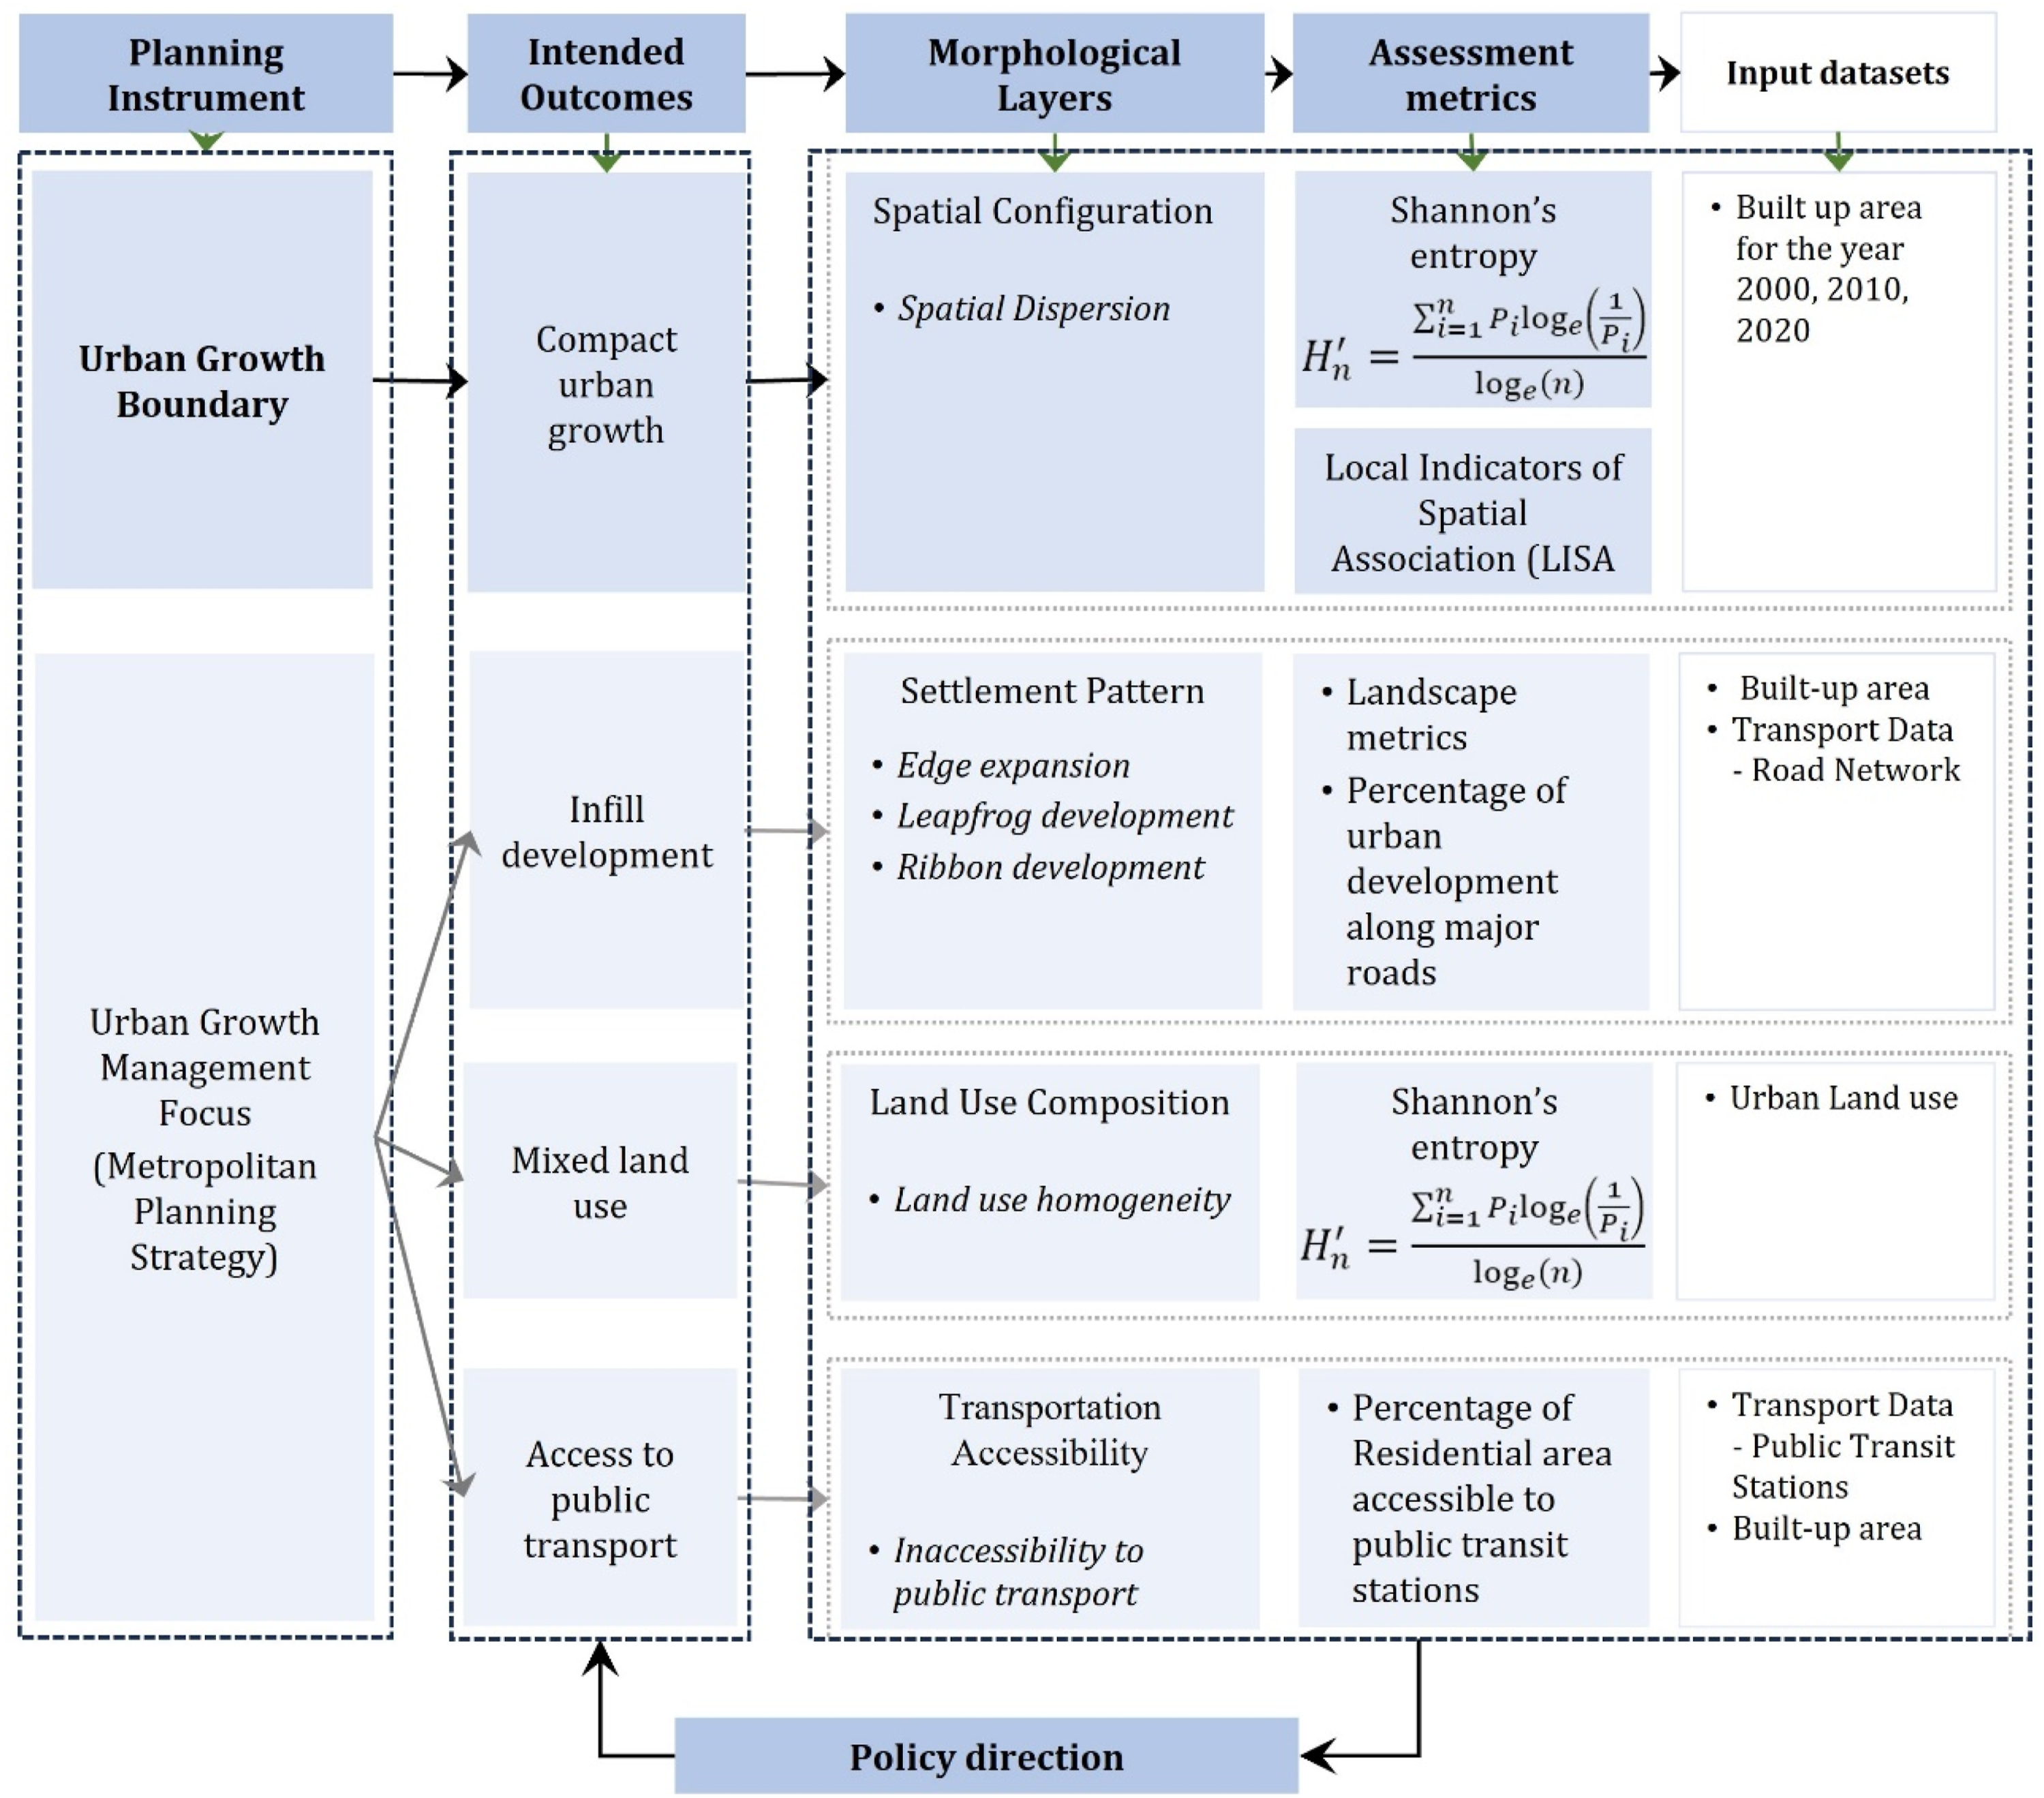
UGBs are intended to limit outward spatial expansion. Therefore, changes in the spatial dispersion of the built-up footprint constitute the primary morphological indicators (Oertel et al., 2024). Moreover, Landsat imagery constitutes the primary data input due to its public availability and consistent temporal and spatial coverage. Ancillary datasets, such as urban land-use and transport data, are subject to licensing and availability constraints and are therefore used only as supplementary layers. Consequently, indicators are derived from the Landsat-based built-up product, with non-open datasets incorporated for interpretation and computed for the most recent year (2020).
Spatial dispersion is quantified using Shannon’s entropy and Local Indicators of Spatial Association (LISA) based on built-up area data for the years 2000, 2010, and 2020, capturing the cumulative urban expansion before and after major UGB revisions, allowing for an effective decadal spatial assessment. Additional morphological dimensions derived from the theoretical framework (Table 1) are integrated into the analysis. Settlement patterns are evaluated using landscape metrics and road-proximity analysis. Land-use homogeneity is measured through Shannon’s entropy applied to urban land-use data. Public transport accessibility is computed as the share of residential built-up area within transit catchments. Analysis is conducted at the LGA scale because metropolitan objectives are implemented through municipal planning schemes and local statutory decisions, enabling comparison across jurisdictions. Further methodological details are provided in Section 4.2.
Data acquisition
The study draws on spatial datasets across three domains: built-up areas, urban land-use, and transport. These datasets underpin the assessment metrics shown in Figure 2.
Built-up area
Built-up area data for 2000, 2010, and 2020 were derived from Landsat satellite imagery, obtained from the United States Geological Survey (USGS). Details of the imagery are provided in Section S1, Figure S1, and Table S1 in the Supplementary Material.
To delineate built-up areas, multiple spectral indices were computed for each temporal dataset, enabling the systematic exclusion of vegetation, water bodies, and bare soil. These indices include the Normalised Difference Built-Up Index (NDBI), Normalised Difference Vegetation Index (NDVI), Normalised Difference Water Index (NDWI), and Bare Soil Index (BSI) (Table S2 in the Supplementary Material). Accuracy assessment against 500 Sentinel-2 reference samples indicated that the Landsat-derived built-up layer is reliable for subsequent sprawl analysis (PA 83.46%, UA 96.4%, OA 89.8%, Kappa 0.80), with 10.2% disagreement mainly due to quantity (7.0%) rather than allocation (3.2%) (Table S3, S4 in the Supplementary Material).
Urban land-use
Urban land-use data were obtained from the Australian Statistical Geography Standard at the mesh block level (Australian Bureau of Statistics, 2021b). Each Mesh Block, comprising approximately 30 to 60 dwellings, was assigned a dominant land-use category. This study included only those Mesh Blocks associated with urban functions, specifically residential, commercial, educational, medical, and industrial categories (Figure S2 in Supplementary Material).
Transport data
The dataset for the public transit stations was obtained from the open data portal of Transport Victoria (Department of Transport and Planning, State of Victoria, 2024b) (Figure S2 in Supplementary Material). These data were used to derive transit catchments for the accessibility analysis (Figure 2).
Data analysis
Building on the acquired datasets, this section outlines the analytical methods used to assess UGB effectiveness. The assessment is structured around four dimensions: spatial dispersion, settlement pattern, land-use homogeneity, and transport accessibility.
Spatial dispersion
Spatial dispersion was assessed using Shannon’s entropy, a widely applied metric (Kumar et al., 2020; Siabi et al., 2025). Shannon’s entropy captures the degree of randomness in the spatial arrangement of built-up areas. In this study, entropy is used to evaluate whether Melbourne’s growth over time is becoming more evenly spread across the metropolitan region or increasingly concentrated, directly reflecting the intended effect of the UGB, which is to limit the outward spread. To improve comparability across time and reduce sensitivity to the Modifiable Areal Unit Problem (MAUP), Shannon’s entropy was expressed in its relative (normalised) form, yielding values bounded between 0 and 1.
Shannon’s relative entropy value (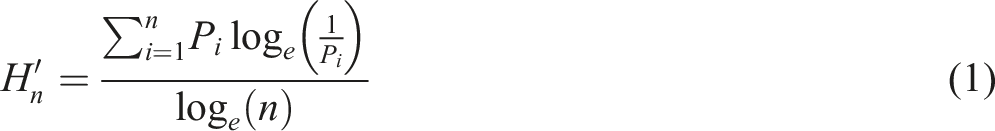
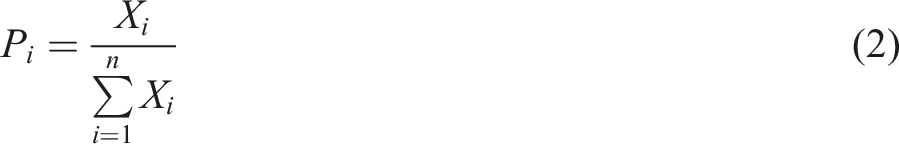
Here, X i represents the built-up area in the ith grid cell and n is the total number of grid cells within the analysis extent.
To calculate Shannon’s relative entropy for the Melbourne Metropolitan Area, the study area was divided into a grid of 500 m × 500 m cells, and the built-up area (X i ) was obtained for each grid cell. This resolution was chosen based on evidence that landscape heterogeneity and entropy measures are scale-dependent, with pattern variation changing across spatial units (Díaz-Varela et al., 2009, 2016). Empirical comparisons indicate that 500 × 500 m grids balance detailed intra-urban differentiation with computational feasibility, making them suitable for city-scale analysis (Luo et al., 2021). The proportion of built-up area within each grid cell P i was calculated using equation (2). Shannon’s relative entropy was then computed directly from the distribution of built-up area across all grid cells within the metropolitan extent for each year. The values range from 0 to 1, where 0 indicates maximum spatial concentration, and 1 reflects uniform dispersion (Dagne et al., 2025).
However, entropy alone cannot reveal where dispersion or concentration occurs within an LGA. Local Indicators of Spatial Association (LISA) was therefore applied using Local Moran’s I, which measures similarity in built-up density between each cell and its neighbours, and identifies statistically significant local clusters and outliers (Anselin, 1995; Feng et al., 2019). LISA was implemented in ArcGIS Pro using the Cluster and Outlier Analysis tool for each 500 m × 500 m grid cell. Spatial clusters were derived, where High-High (HH) clusters represent built-up cells surrounded by other built-up cells, indicating compact areas. Low-Low (LL) clusters represent low-built-up cells surrounded by low-built-up cells, capturing dispersed development. High-Low (HL) outliers denote isolated built-up cells within non-built-up areas, and Low-High (LH) outliers reflect non-built-up gaps within predominantly built-up areas.
Settlement pattern
Common urban sprawl settlement patterns such as leapfrog development, ribbon development, and edge expansion were assessed using relevant landscape metrics. Built-up area obtained from the Landsat images was processed using FRAGSTATS 4.3 (Keita et al., 2021). The metrics included Number of Patches (NP), Patch Density (PD), Largest Patch Index (LPI), Edge Density (ED), Mean radius of Gyration (GYRATE_MN), Mean Euclidean Nearest Neighbour Distance (ENN_MN), and Contagion Index (CONTAG) (Table S5 in the Supplementary Material). Ribbon development was additionally assessed using a proximity analysis, measured as the percentage of built-up area within 250 m of major roads to indicate linear growth along transport corridors. Together, these measures offer a comprehensive evaluation of the settlement pattern in the Melbourne Metropolitan Area.
Land-use homogeneity
Urban sprawl is also marked by homogeneous land use. This was measured using modified Shannon’s relative entropy (equations (1)–(2)). In this context, X i denotes the area of land-use type i, n is the total number of land-use categories, and P i is the proportion of the study area occupied by land-use type i. The resulting relative entropy ranges from 0 to 1, where values closer to 0 indicate homogeneity, while values approaching 1 signify greater land-use diversity. Shannon’s relative entropy for land-use homogeneity was computed directly from the land-use area proportions within each LGA, enabling a comparative analysis across the Melbourne Metropolitan Area.
Transportation accessibility
Public transport accessibility was measured using service-area catchments of 400 m around bus and tram stops and 800 m around train stations, reflecting typical walkable distances (El-Geneidy et al., 2014). For 2020, accessibility was computed as the percentage of built-up residential area within these catchments. Restricting the denominator to residential developed land reduces bias from LGA size differences and non-urban land inclusion (MAUP), supporting cross-LGA comparability.
Results
Spatial configuration
The results reveal a pattern of outward urban expansion from Melbourne’s core towards the periphery (Figure 3). This trend is evident in the fringe LGAs, where development extended beyond earlier UGB boundaries. Successive revisions of the UGB largely accommodated this expansion, thereby reinforcing the sprawl pattern that the policy was initially designed to prevent. Built-up areas for (a) 2000, (b) 2010, and (c) 2020; illustrating successive UGB revisions (2002, 2008, 2014) aligned with the progression of urban expansion.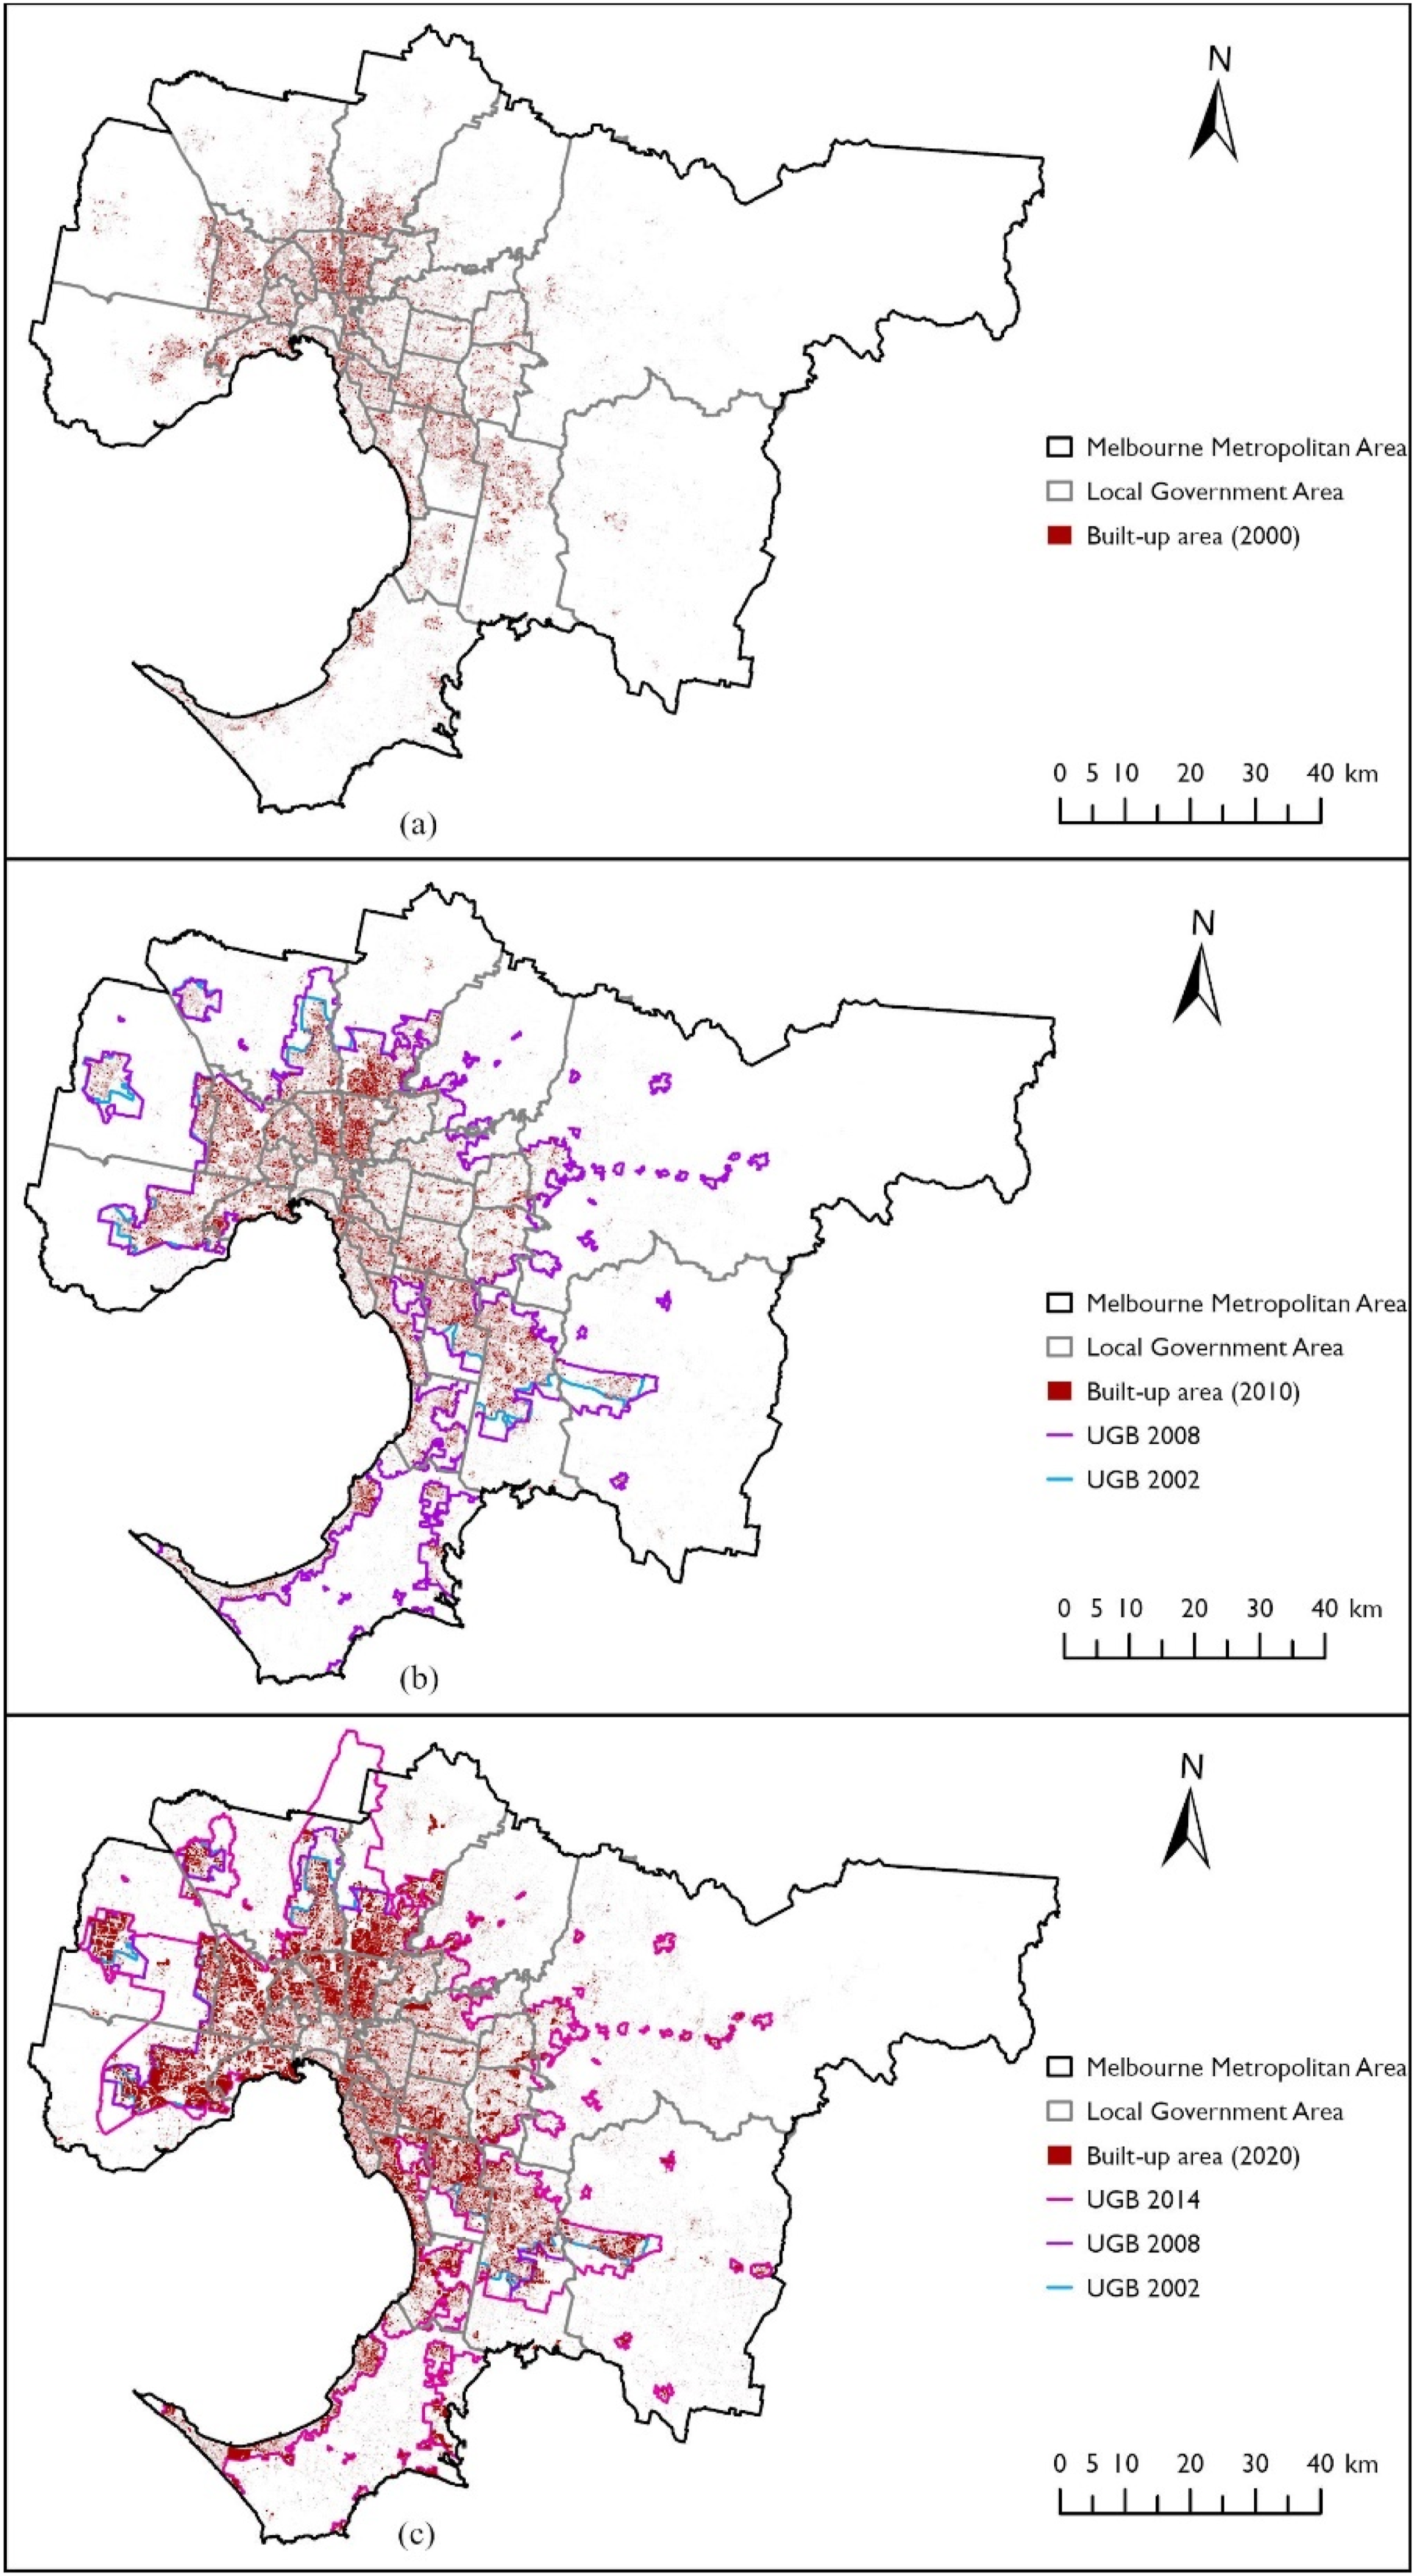
Spatial dispersion
The results for spatial dispersion demonstrate a general trend of increasing entropy values over time. Relative entropy for the Melbourne Metropolitan Area increased from 0.84 (2000) to 0.85 (2010) and 0.88 (2020), indicating increasingly dispersed built-up development.
LISA results show compactness in inner LGAs and sprawl at the fringe. High-High clustering dominates inner LGAs such as Glen Eira and Merri-Bek, whereas Low-Low clusters were more extensive in fringe LGAs such as Melton and Cardinia (Figure S3, Table S6 in the Supplementary Material). Overall, this indicates consolidated built-up cores alongside fragmented expansion at the edge.
Settlement pattern
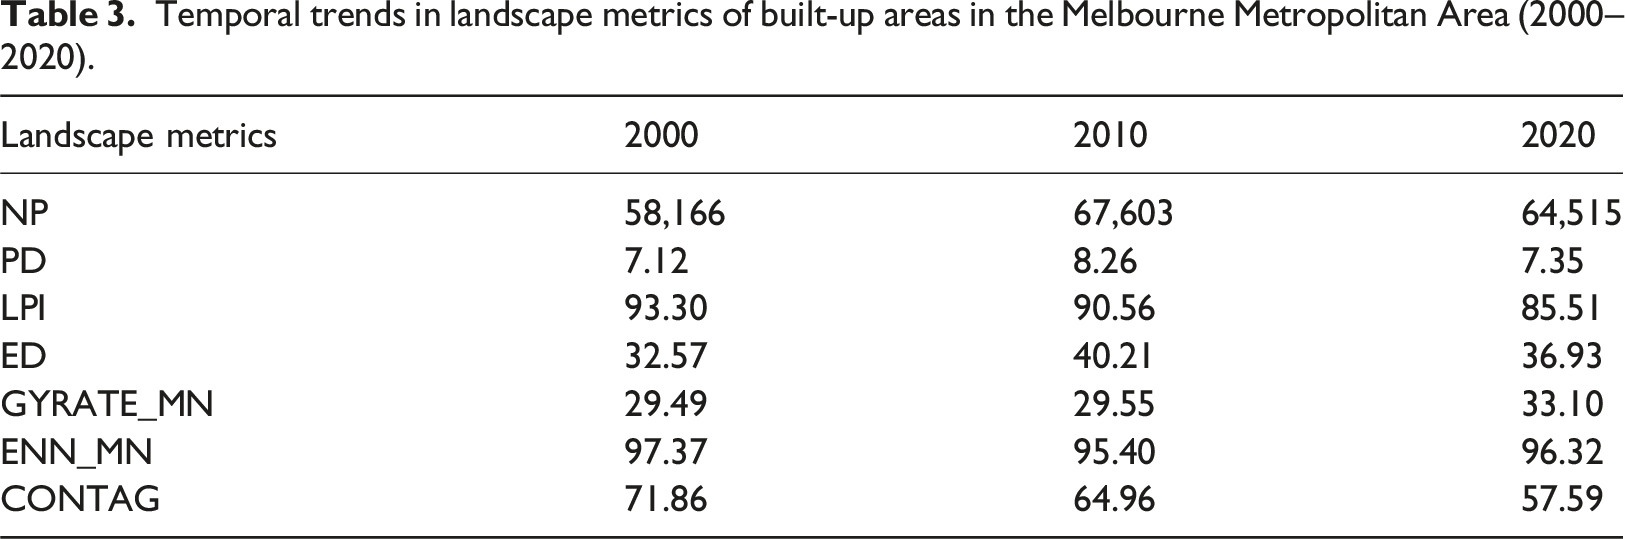
Temporal trends in landscape metrics of built-up areas in the Melbourne Metropolitan Area (2000–2020).
Ribbon development is indicated by high proximity to major roads and elongated patch shapes. In Stonnington, built-up area within 250 m of major roads remained high (86.19% in 2000, 85.02% in 2020; Table S7 in the Supplementary Material). SHAPE_MN declined slightly (1.22 to 1.18) but stayed elevated, while GYRATE_MN and ED trends reflect linear extension. Collectively, these metrics confirm ribbon development as a secondary yet persistent form of sprawl.
Leapfrog development, though not dominant, persists in fragmented form. NP increased from 58,166 (2000) to 67,603 (2010) before declining to 64,515 (2020), indicating fewer new isolated patches. CONTAG fell sharply (71.86 to 57.59), reflecting greater fragmentation, while ENN_MN remained stable (97.37 m to 96.32 m), suggesting isolation has not worsened significantly. Overall, reduced cohesion indicates moderate leapfrogging, particularly at the fringe.
Despite the UGB’s intent to concentrate growth and promote infill development, the persistence of edge expansion, ribbon growth, and leapfrogging indicates that outward expansion still dominates.
Land-use composition
Land-use homogeneity
Shannon’s relative entropy for metropolitan land-use composition is 0.40, indicating a largely homogeneous structure dominated by residential use. The land-use distribution and entropy analysis across Melbourne’s LGAs reveal significant variations in land-use composition. Melbourne City shows the highest diversity (0.82), followed by Greater Dandenong (0.67) and Maribyrnong (0.63), signifying a balanced mix of uses. Whereas Nillumbik (0.07), Manningham (0.13), and Yarra Ranges (0.16) exhibit the lowest entropy values, reflecting homogeneity, dominated by residential functions. LGAs such as Hume, Monash, Darebin, and others exhibit moderate entropy values, indicating the emergence of mixed-use patterns (Table S8 in the Supplementary Material).
Marked disparities are observed in land-use composition, with central LGAs showing higher entropy and more diverse urban functions, while outer LGAs near the UGB remain more homogeneous (Figure S4 in the Supplementary Material). This contrast indicates that the UGB has had a limited impact in promoting mixed-use development in peripheral and newly developing areas.
Transportation accessibility
Inaccessibility to public transport
Inner LGAs like Melbourne and Glen Eira exceed 90% transit catchment coverage, while outer LGAs, including Cardinia, Melton, and Wyndham, remain below 45% (Table S9; Figure S5 in the Supplementary Material), revealing significant accessibility gaps in fringe areas. Despite the UGB’s intent to support compact, transit-accessible growth, fringe LGAs retain limited transit access and likely higher reliance on private vehicles.
Discussion
Based on the findings, the discussion addresses three issues. It interprets changes in Melbourne’s sprawl morphology from 2000 to 2020 and their implications for UGB effectiveness. It then examines LGA-level variation and limits of a uniform containment policy. Finally, it synthesises the indicator results into a morphology-based typology that translates observed patterns into policy-relevant categories for growth management.
Urban sprawl morphology and the Urban Growth Boundary
The analysis of Melbourne’s urban morphology from 2000 to 2020 highlights a persistent gap between the UGB’s intent and the spatial outcomes. Introduced to manage sprawl and promote compact, transit-oriented development, the UGB has achieved only partial success. Quantitative indicators point to increasing dispersion. Shannon’s relative entropy rose from 0.84 to 0.88, GYRATE_MN increased (29.49 to 33.10), and LPI fell (93.30% to 85.51%). These shifts confirm outward spread and fragmentation rather than consolidation. Outer LGAs such as Nillumbik and Yarra Ranges remain over 90% residential with land-use entropy values as low as 0.07, underscoring entrenched mono-functional patterns. At the same time, accessibility to public transport remained uneven, with inner LGAs retaining high levels of service, while outer LGAs exhibited limited coverage and weak integration with new growth.
These findings contribute to the growth-management debate that containment can limit outward expansion yet still coincide with persistent sprawl when consolidation is not actively supported. UGBs are often understood as necessary but insufficient constraints whose effects depend on complementary planning and infrastructure settings (Jehling et al., 2018; Tan et al., 2022). In this respect, the results of this study are consistent with evidence that UGBs can deliver mixed outcomes, including limited or uneven intensification and continued pressure for dispersion (Burke et al., 2025; Saganeiti et al., 2024). Notably, successive UGB revisions (2002, 2008, 2014) appear to have enabled continued urban expansion, explaining the persistence of edge growth despite the policy’s containment intent. Evidence from this research indicates that Melbourne’s continued reliance on residential zoning, fragmented transit provision, and lack of coordinated infill investment risks rendering the UGB more symbolic than functional.
Differentiated morphologies and the limits of uniform policy
The morphological diversity across Melbourne’s LGAs demonstrates the limitations of uniform policy approaches. Inner LGAs such as Glen Eira, Stonnington, and Yarra demonstrate strong clustering, diverse land-use, and high transit access. These conditions are conducive to sustainable intensification. In these areas, planning should reinforce mixed-use zoning, vertical infill, and enhance walkability and public transport networks.
In contrast, outer LGAs like Melton, Wyndham, and Nillumbik exhibit dispersed settlement forms, homogenous land-use, and limited accessibility. This suggests that LGAs respond differently to the same containment policy, and outer areas in particular require coordinated growth staging and transport-servicing to reshape dispersed expansion (Siedentop et al., 2022).
Middle LGAs, including Hume and Greater Dandenong, exhibit hybrid characteristics such as moderate clustering and improved land-use diversity, yet transit integration remains incomplete. These areas could benefit from synchronised infrastructure delivery and planning. They are strategically important transition zones where targeted interventions can prevent fragmented fringe-style growth while supporting corridor-based consolidation (Jehling et al., 2018).
A morphology-based model for urban sprawl management
To guide spatially differentiated interventions, this study proposes a morphology-based typology, along a compact-dispersed continuum, linking morphology to targeted policy responses. The purpose of the typology is to translate multiple indicators into a practical structure for monitoring and intervention, rather than treating dispersion, land-use mix, and accessibility as separate outputs.
Transit-integrated compact areas
• Morphological Profile: Low spatial dispersion, strong clustering, diverse land-use, high public transport access, and predominantly infill development. • Exemplified by:– Glen Eira, Stonnington, and Yarra. • Policy focus: Reinforce vertical infill and preserve functional diversity through mixed-use zoning. Expand pedestrian, cycling, and transit networks to maintain compactness while limiting outward expansion.
Hybrid growth zones
• Morphological Profile: Moderate dispersion and clustering, emerging land-use diversity, variable transit access, and combination of infill and edge expansion. • Exemplified by Monash, Merri-Bek, Hume, and Greater Dandenong. • Policy focus: Support mid-rise densification along transport corridors, rezone for mixed-use centres, and redevelop underutilised sites. Improve intermodal connections and align land-use with transit investment. Encourage decentralised employment to reduce functional separation.
Fragmented fringe areas
• Morphological Profile: High spatial dispersion, weak clustering, low land-use diversity, limited transit access, and fragmented and leapfrog development. • Exemplified by Melton, Wyndham, and Nillumbik. • Policy focus: Phase growth with infrastructure delivery to prevent further fragmentation. Reinforce the UGB and explore exclusion zones. Invest in core transit routes and first/last-mile solutions. Pilot mixed-use neighbourhoods and local employment hubs to increase land-use diversity and reduce car dependency.
This typology transcends simplistic urban-suburban dichotomies and enables spatially differentiated planning. By explicitly linking morphology to policy levers, it supports a more operational evaluation of UGB effectiveness that focuses on whether settlement structure is shifting toward consolidation, diversification, and accessibility improvements.
Methodological limitations
While the adopted methods provide valuable insights into urban sprawl morphology, certain methodological limitations should be acknowledged. Although Landsat imagery provides consistent long-term coverage, its moderate spatial resolution (30 m) may introduce built-up classification error, affecting Shannon’s entropy and landscape metrics. The analysis was also constrained by data availability and temporal consistency, as detailed urban land-use and public transport station datasets were not available in comparable formats for all study years. The public transit accessibility measure is catchment-based and does not capture service frequency, multimodal connectivity, or the quality of pedestrian infrastructure. While the study applied a consistent spatial framework and standardised procedures across the metropolitan area to reduce MAUP effects, some sensitivity to spatial aggregation may remain as inherent MAUP effects. Despite these limitations, the applied methods offer a meaningful basis for evaluating the morphological effectiveness of the UGB.
Conclusion
This research applied a spatially explicit, morphology-based framework to examine Melbourne’s urban sprawl evolution between 2000 and 2020. It evaluated whether the UGB supported the compact, accessible, and mixed-use development outcomes envisioned in Plan Melbourne 2017-2050. By adopting a multidimensional perspective, the study assessed how the spatial growth aligned with these intended policy outcomes across the metropolitan region.
The results indicate that despite the presence of the UGB, expansion has continued largely through edge development, accompanied by ribbon and some leapfrog patterns. While inner LGAs retained compact and diverse forms, outer areas exhibit higher spatial dispersion, low land-use diversity, and limited public transport access. The findings confirm a discrepancy between the UGB’s intended objectives and the actual morphological outcomes. This demonstrates that containment policy alone is insufficient to deliver metropolitan-wide consolidation and that urban form outcomes remain spatially uneven across LGAs.
A key contribution of this research is a framework for assessing the multidimensional morphology of urban sprawl. The framework integrates spatial indicators of land-use, settlement patterns, and transit access to diagnose urban form evolution under containment policy. It supports clearer interpretation of how different dimensions of sprawl evolve simultaneously and where policy outcomes diverge across space.
To support planning responses, the study introduces a morphology-based typology enabling context-sensitive planning interventions. The typology translates complex spatial evidence into policy-relevant categories that help distinguish consolidated areas, hybrid zones, and fragmented fringe conditions requiring differentiated interventions. While developed for Melbourne, the framework is scalable and transferable, offering potential applicability in other metropolitan contexts facing similar urbanisation pressures.
The research offers a forward-looking diagnostic for understanding how sprawl may evolve under current planning regimes. By assessing the morphological consequences of past planning efforts, the study helps identify where future growth is likely to fragment, concentrate, or demand intervention. The findings suggest that the effectiveness of instruments like the UGB is contingent upon cross-sectoral policy coordination that couples land-use regulation with infrastructure planning, service delivery, and strategic investment. This diagnostic perspective supports proactive governance by enabling planners to recalibrate urban containment strategies.
While the study primarily focuses on the morphological dimensions of urban sprawl, it does not account for other drivers of urban development, such as socio-economic conditions, market dynamics, lifestyle preferences, technological advancements, and political influences. Methodological limitations include potential classification inaccuracies from Landsat imagery and limitations in capturing fine-grained spatial variation. Although the metropolitan and LGA-level scale provides insights into regional patterns, it may overlook localised morphological nuances. Future research could address these limitations by integrating broader contextual factors, using higher-resolution data, conducting neighbourhood-scale analyses, and incorporating socio-political drivers and involving stakeholder perspectives to better comprehend urban change.
This study demonstrates how urban morphology, operationalised through integrated spatial metrics, provides a reproducible diagnostic for evaluating planning interventions over time. By linking morphological outcomes with policy objectives, it contributes to evidence-based approaches for managing urban sprawl and offers a transferable framework to guide metropolitan regions toward more compact, efficient, and sustainable urban forms.
Supplemental material
Supplemental material - A multidimensional morphological diagnosis of urban sprawl in the context of Melbourne’s Urban Growth Boundary
Supplemental material for A multidimensional morphological diagnosis of urban sprawl in the context of Melbourne’s Urban Growth Boundary by Kriti Pradhan, Abbas Rajabifard, Jagannath Aryal, and Joep Crompvoets in Environment and Planning B: Urban Analytics and City Science
Footnotes
Acknowledgements
The first author (K.P.) is supported by the University of Melbourne and KU Leuven for her Joint PhD research and is awarded research scholarships from both institutions. The authors would like to thank Mark Allan for his valuable feedback and suggestions during the preparation of this manuscript.
Author contribution
Kriti Pradhan: Conceptualisation, methodology, investigation, data curation, and writing – original draft; Abbas Rajabifard: Writing – Review and editing, supervision, and funding acquisition; Jagannath Aryal: Methodology, writing – review and editing, supervision and funding acquision; Joep Crompvoets: Writing – review and editing, supervision, and funding acquisition.
Funding
The authors disclosed receipt of the following financial support for the research, authorship, and/or publication of this article: The first author (K.P.) is supported by the University of Melbourne and KU Leuven for her Joint PhD research and is awarded research scholarships from both institutions.
Declaration of conflicting interests
The authors declared no potential conflicts of interest with respect to the research, authorship, and/or publication of this article.
Data Availability Statement
Data are available upon request.
Supplemental material
Supplemental material for this article is available online.
Author biographies
References
Supplementary Material
Please find the following supplemental material available below.
For Open Access articles published under a Creative Commons License, all supplemental material carries the same license as the article it is associated with.
For non-Open Access articles published, all supplemental material carries a non-exclusive license, and permission requests for re-use of supplemental material or any part of supplemental material shall be sent directly to the copyright owner as specified in the copyright notice associated with the article.