
Abstract
Labour market areas (LMAs) are functional regions where job workers and employers interact to exchange labour services, playing a crucial role in regional economic analysis and policy-making. Accurate LMA definitions help ensure that regional boundaries reflect actual labour market dynamics. However, most existing methods for defining LMAs are susceptible to threshold values, which can vary significantly across regions due to differences in spatial and commuting interaction patterns. When region-specific thresholds are not well aligned with local commuting patterns, existing methods tend to generate unstable solutions, reflected in large variation in fitness values across algorithm repetitions and misallocations in which regions would perform better if placed in a neighbouring LMA, through stronger cohesion without a substantial loss in self-containment. This undermines the reliable identification of labour market structures. To address these challenges, we developed the Adaptive Simulated Annealing for Autonomous Labour Market Delimitation (AdSA-ALMD) algorithm. The method preserves labour market boundaries by using soft constraints to guide threshold selection, thereby reducing solution variance and minimising misallocations. Our method integrates simulated annealing with an adaptive cooling schedule, allowing efficient exploration of the solution space. Additionally, a penalty-based fitness function guides threshold adjustments, ensuring the resulting thresholds reflect the underlying commuting patterns. We validated our methodology using simulated data and micro-level journey-to-work data from the 2016 Census provided by the Australian Bureau of Statistics. Across both simulated and empirical applications, the method produced regionalisations with stronger cohesion without a substantial loss in self-containment, and fewer misallocations, relative to the Travel-to-Work Area algorithm, the Grouping Evolutionary Algorithm, and a recent Multi-step Approach. The use of soft constraints enables the approach to accommodate varying commuting structures without requiring region-specific tuning. Overall, the results demonstrate that AdSA-ALMD yields reproducible labour market delineations that reduce sensitivity to threshold specification while preserving alignment with observed commuting interactions.
Keywords
Introduction
LMAs are functional regions (Brown and Holmes, 1971) defined by the interactions between job seekers and employers, where labour services are exchanged and local employment relationships are formed. Labour markets are practical tools for analysing the economic landscape of the region and for designing, implementing, and monitoring socio-economic policies at the regional level (Martínez-Bernabeu and Casado-Díaz (2022); Casado Díaz and Coombes (2011); Wicht et al. (2020)). The precision of regional analyses and the effectiveness of the corresponding public policies rely on the delineation of regional boundaries that accurately represent the functional spatial reality of the area (Martínez-Bernabeu and Casado-Díaz, 2022). Defining these boundaries helps ensure that labour market policies are effectively targeted, fostering economic growth and social well-being in the region.
LMAs are composed of basic geographic units (BGUs), such as suburbs, postal areas, and local government areas. These units are grouped to form LMAs that maximise internal cohesion, the interactions between the BGUs within the LMA, while minimising interactions with BGUs outside the LMA (Goodman, 1970). This ensures a significant proportion of people live and work within the same area (self-containment).
Effective LMA delineation requires a careful balance between internal cohesion and self-containment, while also ensuring a minimum population threshold and geographic contiguity among the constituent regions. This challenge was addressed using various methodological approaches, including exact and approximate optimisation techniques.
Exact optimisation methods aim to optimise a global objective function by systematically exploring the entire solution space to identify the globally optimal solution. These methods guarantee the discovery of the best solution, but they are often computationally infeasible for large-scale problems, especially when the number of BGUs or constraints increases. For instance, Kim et al. (2015) demonstrated that the time required for linear programming approaches to define LMAs grows exponentially with the number of BGUs, leading to long computation times that make exact methods impractical for labour market partitioning in large datasets. As a result, exact methods are rarely employed in practice for complex labour market delineation tasks.
In contrast, approximate optimisation methods prioritise computational efficiency while balancing solution quality and feasibility. These methods also optimise a global objective function by exploring a portion of the solution space, balancing exploration and exploitation to identify near-optimal solutions in a computationally efficient manner. They have proven highly effective for labour market delineation (Martínez-Bernabeu and Casado-Díaz (2022); Fowler and Jensen (2020); Martínez-Bernabeu et al. (2020); Flórez-Revuelta et al. (2008); Alonso et al. (2015)) because they efficiently navigate high-dimensional solution spaces by strategically sampling and refining solutions rather than exhaustively searching all possibilities. By identifying near-optimal solutions in a fraction of the time required by exact approaches, they are well-suited for real-world applications involving large and complex datasets.
Objective functions are fundamental to optimisation, as they define the criteria for evaluating and improving solutions. In labour market delineation, these functions shape regional groupings based on desired properties. A widely used approach for delineating functional regions involves maximising global cohesion while simultaneously enforcing constraints such as self-containment, minimum population, and geographic contiguity (Martínez-Bernabeu and Casado-Díaz (2022); Fowler and Jensen (2020); Martínez-Bernabeu et al. (2020)). The objective is to produce internally cohesive regions that also meet predefined minimum thresholds for each constraint. However, the effectiveness of this method is highly sensitive to the selection of threshold values. In the absence of a universally accepted or data-driven approach for determining optimal thresholds for a given study region, the resulting labour market delineations may fail to accurately reflect the underlying labour market dynamics. This can lead to spatial configurations that are either fragmented or overly constrained, often requiring manual post-hoc adjustments. Such limitations undermine the practical utility and interpretive validity of the delineated labour market areas.
Another objective function used in optimisation methods for labour market delimitation is modularity (Mu and Yeh (2020); Shen and Batty (2019)), a concept from network theory (Newman and Girvan, 2004), which quantifies community structure by comparing internal interaction links within regions to their expected values in a null model. Studies such as Fusco and Caglioni (2011) and Farmer and Fotheringham (2011) have successfully applied modularity to define LMAs based on commuting flows. However, Lancichinetti and Fortunato (2011) and Lambiotte (2010) report that modularity has a resolution limit problem; if the resolution parameter is not sufficiently tuned, aggregation may result in merging of small communities at low resolution and the splitting of large communities at high resolution. Additionally, modularity was originally developed for social networks and does not inherently account for spatial constraints, which are critical for labour market delineation. Consequently, without modifications to address spatial proximity, modularity-based approaches may produce overly large or fragmented LMAs, reducing the overall accuracy and utility of the delineation process (Martínez-Bernabéu and Casado-Díaz, 2021).
Most LMA delimitation methods rely on approximate optimisation techniques, which may produce suboptimal regional configurations that require manual adjustment. To address this limitation, Martínez-Bernabeu and Casado-Díaz (2022) proposed the Multi-Step Approach (MSA), a three-stage framework designed to improve both computational efficiency and regional coherence. In the pre-processing stage, a simple hierarchical clustering procedure is applied to force mergers between areas with very strong commuting flows. This reduces the number of BGUs, prevents dominant commuting ties from being broken, and improves the efficiency of the subsequent optimisation. The reduced system is then regionalised using a Grouping Evolutionary Algorithm (GEA) by Casado-Díaz et al. (2017), which searches for globally coherent LMA configurations by evolving groupings directly in the solution space. Finally, the post-processing stage applies a greedy local optimisation to refine the initial GEA solution. In this step, each BGU is assessed for misallocation. A unit is considered cohesion-misallocated if it borders another LMA to which reassignment would increase its interaction strength, and self-containment-misallocated if joining a neighbouring LMA would improve its self-containment, optionally without substantial loss of cohesion. The algorithm reallocates such units when this improves local indicators while still satisfying the required constraints on population size and self-containment, and it may also revisit some mergers introduced during pre-processing. Although this multi-layered approach yields improved accuracy and reliability in LMA delineation, its complexity arises from the integration of multiple algorithms and the fine-tuning of parameters. Despite these challenges, the method has proven effective in recent studies, highlighting its robustness in tackling complex LMA delimitation tasks.
This study proposes an automated approach for delineating labour market boundaries by optimising global cohesion, self-containment, population size, and geographical contiguity within each labour market. The optimisation is performed using simulated annealing (Kirkpatrick et al., 1983), a widely used metaheuristic approximation technique. Simulated annealing is inspired by the physical process of annealing in metallurgy, where materials are gradually cooled to achieve a state of minimum energy. In optimisation, simulated annealing allows the algorithm to explore a broad solution space by increasing the acceptance probability for ‘bad’ solutions early in the algorithm process and decreasing this acceptance probability as the algorithm progresses. This mechanism helps the algorithm avoid getting stuck in local minima and escape poor solutions.
This iterative process makes simulated annealing particularly effective. In this study, it is preferred over other approximate optimisation techniques for exploring large and complex solution spaces, which is essential for tasks like LMA delimitation. To improve the performance of the basic simulated annealing approach, this study introduces adaptive cooling schedules. These schedules adjust the cooling rate dynamically based on the algorithm’s acceptance behaviour. When the algorithm consecutively rejects solutions, the temperature adapts to encourage broader exploration. Conversely, prolonged acceptance of new solutions slows the cooling process, allowing the search to be refined. This adaptive mechanism enhances the algorithm’s abilities and improves convergence towards a global, near-optimal solution.
A key feature of this approach is the integration of constraints as penalty terms within the objective function. In this study, we tune the penalty function parameters directly, rather than assigning separate weights to each penalty component. Because the penalty terms are of comparable magnitude to the global cohesion, adjusting their internal parameters provides a practical and interpretable way to control their influence without adding extra hyperparameters. Although alternative weighting schemes could be used, their effects are straightforward: increasing a weight increases the influence of that constraint and decreasing it reduces it. Our approach focuses on direct calibration of the penalty-function parameters, yielding stable, high-performing solutions while keeping the optimisation framework parsimonious and transparent. Existing methods often rely on strict constraints, such as cohesion-based approaches that produce overly compact regions or modularity-based techniques that suffer from resolution challenges, merging small LMAs at low resolutions and fragmenting large LMAs at high resolutions. Moreover, these methods typically lack a mechanism for selecting threshold values, often applying fixed settings across all regions. This is problematic, as thresholds that perform well in one region may fail in another due to differences in commuting behaviour. In contrast, the proposed method achieves a balanced trade-off between cohesion, self-containment, and the population size of the labour market by treating constraints as flexible penalty terms. This flexibility allows the algorithm to select thresholds that reflect each region’s commuting patterns. By aligning these constraints with local cohesion and self-containment structures, it markedly reduces misallocations; cases in which a BGU would achieve higher cohesion, without a meaningful loss of self-containment, if reassigned to an adjacent LMA. Consequently, the overall accuracy of labour-market delimitation is improved. To evaluate its effectiveness, this study compares its outcomes with those of three established approaches: Coombes and Bond (2008), Martínez-Bernabeu et al. (2012), and Martínez-Bernabeu and Casado-Díaz (2022).
The remainder of this paper is structured as follows. The Data section provides a comprehensive description of the datasets utilised in this study, including both simulated and real-world data. The Methodology section outlines the formal research framework and details the analytical procedures employed. The Results and Discussion section presents the application of the proposed approach to real-world data, including a comparative analysis against three existing methods. It also includes validation using simulated data, accompanied by a corresponding comparison with the same benchmark methods. Finally, the Conclusions section synthesises the key findings and highlights the principal insights gained from the study.
Data
This study conducts a comprehensive comparative analysis of four methods, including three existing approaches and the proposed method, using both simulated and real-world data. The key input to the algorithms is a non-symmetric origin-destination matrix, denoted as W. In this matrix, W
ij
represents the number of individuals residing in BGU G
i
and working in BGU G
j
within a specified country or state of interest,
Simulated Data
Three origin-destination matrices of 14 BGUs were simulated from pre-allocated LMAs under three self-containment scenarios: high, medium, and low self-containment. Subsequently, the performance of four distinct methods was evaluated across the three self-containment scenarios to ascertain their efficacy. A detailed description of the data simulation process is provided in the section Validation with Simulated Data.
Real data
To analyse real-world labour market dynamics, this study utilised data from the Multi-Agency Data Integration Project (MADIP), which was renamed to the Person Level Integrated Data Asset (PLIDA) in 2023 (Australian Bureau of Statistics, 2025), developed by the Australian Bureau of Statistics (ABS). MADIP is a comprehensive data asset that integrates a wide range of government datasets, including personal-level information from the ABS Census. The integrated dataset used in this study represents approximately 4% of the total labour force in Queensland, Australia, and covers the entire geographic region of the state. Variables from the 2016 Census, such as usual residence and place of work, were used to construct the commuting flows matrix W, considering Statistical Area Level 2 (SA2) as BGUs. The 2016 Census was selected to avoid distortions in commuting patterns caused by the COVID-19 pandemic, which may have affected the 2021 Census data through increased rates of remote work, temporary business closures, and reduced mobility. SA2s represent medium-sized regions in Australia, typically with populations ranging from 3000 to 25,000 people, designed to represent a community that interacts together socially and economically (Australian Bureau of Statistics, 2021a).
Methodology
To provide context for our approach, we begin with a brief overview of the existing LMA delineation methods. This summary helps clarify how these methods are implemented in our study and establishes a basis for comparison. Following this, we describe our proposed method in detail, highlighting how it extends and differs from the existing approaches.
Overview of existing methods
This section briefly examines three primary approaches for demarcating labour markets: (a) the Travel-to-Work Area Algorithm (TTWA) (Coombes and Bond, 2008), (b) the Grouping Evolutionary Algorithm (GEA) (Martínez-Bernabeu et al., 2012), and (c) the Multi-step Approach (MSA) (Martínez-Bernabeu and Casado-Díaz, 2022). These methods are widely recognised in both existing literature and practical applications. The TTWA is historically the most prevalent, followed by the GEA, while the MSA represents the most recent advancement in the field.
Travel-to-Work Area Algorithm
The TTWA algorithm is a method for defining labour market boundaries using journey-to-work data. It groups BGUs into proto-TTWAs, which are self-contained labour market areas, ensuring that most people both live and work within the same region. The algorithm iteratively refines these areas by analysing commuting flows and adjusting boundaries until all regions meet predefined parameters for population size and self-containment.
The TTWA algorithm uses two parameters: self-containment and size. Each area must meet the minimum levels for both parameters, minimum self-containment (SCmin) and minimum population (Popmin). If an area does not meet or exceed both target values, that is, target self-containment (SC tar ) and target population size (Pop tar ), it can still qualify if its self-containment and size are at least as strong as an area that meets one target value and the minimum value for the other parameter.
For the simulation study, a minimum population size of 3000 was adopted, consistent with the minimum requirement for SA2 regions. A target population size of 25,000 was used to ensure comparability with the Australian Statistical Geography Standard (ASGS). This threshold aligns with the definition of Statistical Areas Level 3 (SA3s), which are the smallest building blocks used by the ABS when constructing official LMA boundaries. By using a population size consistent with the ASGS design, our delineation operates at the same spatial scale as the current ABS framework, allowing our results to be compared directly with the existing ABS-identified LMAs. The analysis examined various minimum self-containment thresholds, 0.55, 0.65, and 0.75, with a target self-containment level of 0.75.
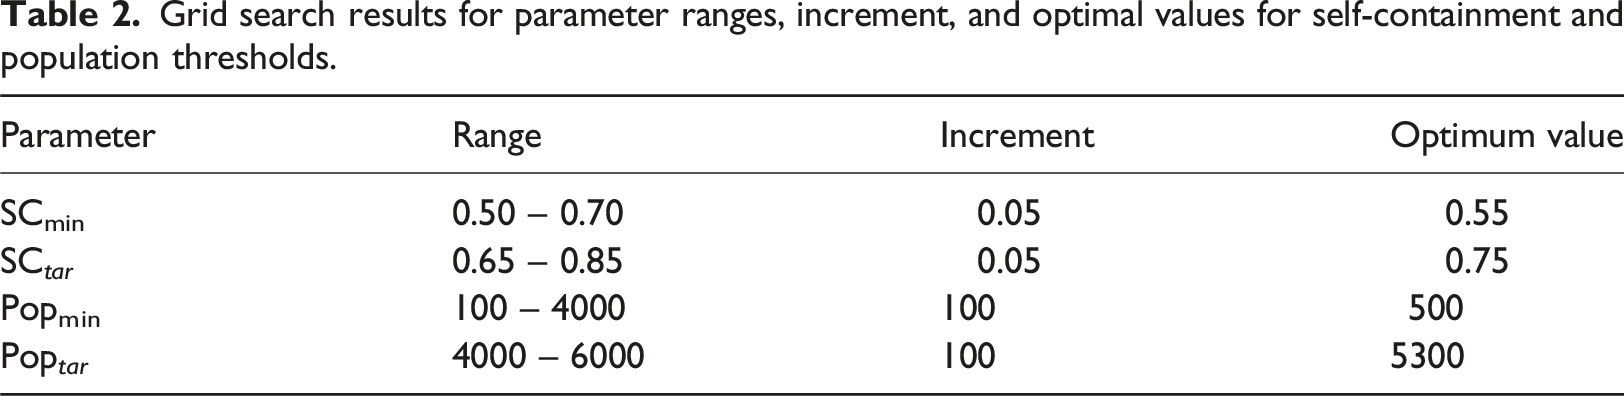
For the real-world data analysis, a sample representing approximately 4% of the total population was used. To identify appropriate population size parameters, a grid search was conducted across multiple combinations of minimum and target population thresholds (the details of this parameter search are presented in Table 2). The combination that produced the highest GCI scores was selected, consisting of a Popmin of 500, a Pop tar of 5,300, an SCmin of 0.55, and an SC tar of 0.75.
Grouping Evolutionary Algorithm
Drawing inspiration from the principles of natural selection and genetic inheritance, the Evolutionary Algorithm (EA) has become a powerful computational technique for optimisation and problem-solving across various fields, including labour market delimitation. Its ability to generate robust solutions to complex optimisation challenges makes it highly effective in addressing the intricacies of labour market delineation.
In the context of labour market delimitation, the objective is to identify a set of LMAs that optimally balance the criteria defined by a fitness function. This fitness function is designed to maximise global cohesion while ensuring that LMAs satisfy constraints related to self-containment, population size, and geographical contiguity.
The optimisation process begins by generating 10 initial solutions using a sub-algorithm called Stochastic Hierarchical Agglomeration. These initial solutions are then used to generate new candidate solutions by applying the 10 operators described in Martínez-Bernabeu et al. (2012), from which the 10 best solutions are selected. Unlike the original study, where one random operator is applied at a time to generate a new solution, we apply all 10 operators to each solution to obtain the best new solution. In the next step, each of the 10 candidate solutions is further modified using the same set of 10 operators, resulting in a new set of solutions. From this set, the 10 best solutions, those with the highest fitness values, are selected to proceed to the next iteration. This iterative process continues, with the operators being applied to the selected solutions and the top 10 retained at each step, until the termination criterion is met.
In our implementation, the optimisation process is terminated when the improvement in the fitness function remains below a threshold ϵ GEA for a consecutive number of iterations. For consistency with the Martínez-Bernabeu et al. (2012) formulation, we set ϵ GEA = 0, which corresponds exactly to the original stopping rule based on the absence of improvement in the best solution. Empirically, this required approximately 600 seconds for the simulated data and around 3600 seconds for the real data.
Multi-step approach
The MSA represents the most recent advancement in delineating labour markets, offering a solution to the challenges inherent in previous methods that necessitate manual corrections to refine labour market boundaries.
The MSA framework comprises three layers. It integrates the Grouping Evolutionary Algorithm (GEA) proposed by Casado-Díaz et al. (2017), a state-of-the-art regionalisation method designed to address the computational complexity inherent in traditional EAs. Unlike conventional EAs, GEA executes multiple evolutionary processes in parallel, significantly enhancing computational efficiency and enabling a more comprehensive exploration of the solution space. This parallelisation facilitates the simultaneous evaluation and refinement of multiple regionalisation solutions, thereby reducing computational time while improving both the quality and diversity of the generated solutions.
The first layer of the MSA implements a hierarchical aggregation of BGUs based on commuting flows, prioritising the merging of adjacent units with strong mutual dependencies. Specifically, pairs of BGUs with connectivity exceeding a threshold of 1 − SCmin are iteratively merged. For this study, a threshold of 0.1 was used, which is the minimum value at which merging occurred. After each iteration, commuting flows and adjacency structures are updated accordingly. This pre-processing step helps to reduce the likelihood of self-containment-based misallocations in the subsequent layer by ensuring that strongly interconnected units are grouped together early in the process. The second layer performs the actual regionalisation. While the preprocessing stage involves only a few preliminary mergers, the second layer applies the GEA of Casado-Díaz et al. (2017) to the aggregated BGUs to derive an optimal territory partition based on cohesion and self-containment criteria. This version of the GEA differs Martínez-Bernabeu et al. (2012) formulation by applying elitism only to the best solution in each generation, while selecting the remaining P − 1 solutions with probability proportional to their fitness, thereby reducing selective pressure and lowering the chance of becoming trapped in local optima. We explored a range of GEA parameter settings and found that, with sufficient execution time, different configurations tended to converge to the same regionalisation. However, the following configuration produced the most stable and high-quality solutions for our dataset, yielding superior regionalisations more consistently than the alternatives we tested. Specifically, we used a 6 × 2 grid of subsets, with three regionalisations per subset. The probability of recombination between subsets was set to 0.001. In each iteration, one operation was applied to each subset, yielding 12 operations per iteration. A stopping criterion of approximately 2 hours of computation time was used. Finally, the third layer applies a greedy local optimisation procedure that carries out two key tasks. First, it reallocates misallocated BGUs based on self-containment, allowing reductions in global cohesion when doing so improves local or overall self-containment. Second, it dismembers LMAs that display high self-containment but low cohesion, typically resulting from the fusion of smaller yet functionally independent regions, and reallocates their constituent BGUs accordingly. This final stage resolves residual inconsistencies and ensures that the resulting LMAs are behaviourally coherent.
Adaptive Simulated Annealing for Autonomous Labour Market Delimitation
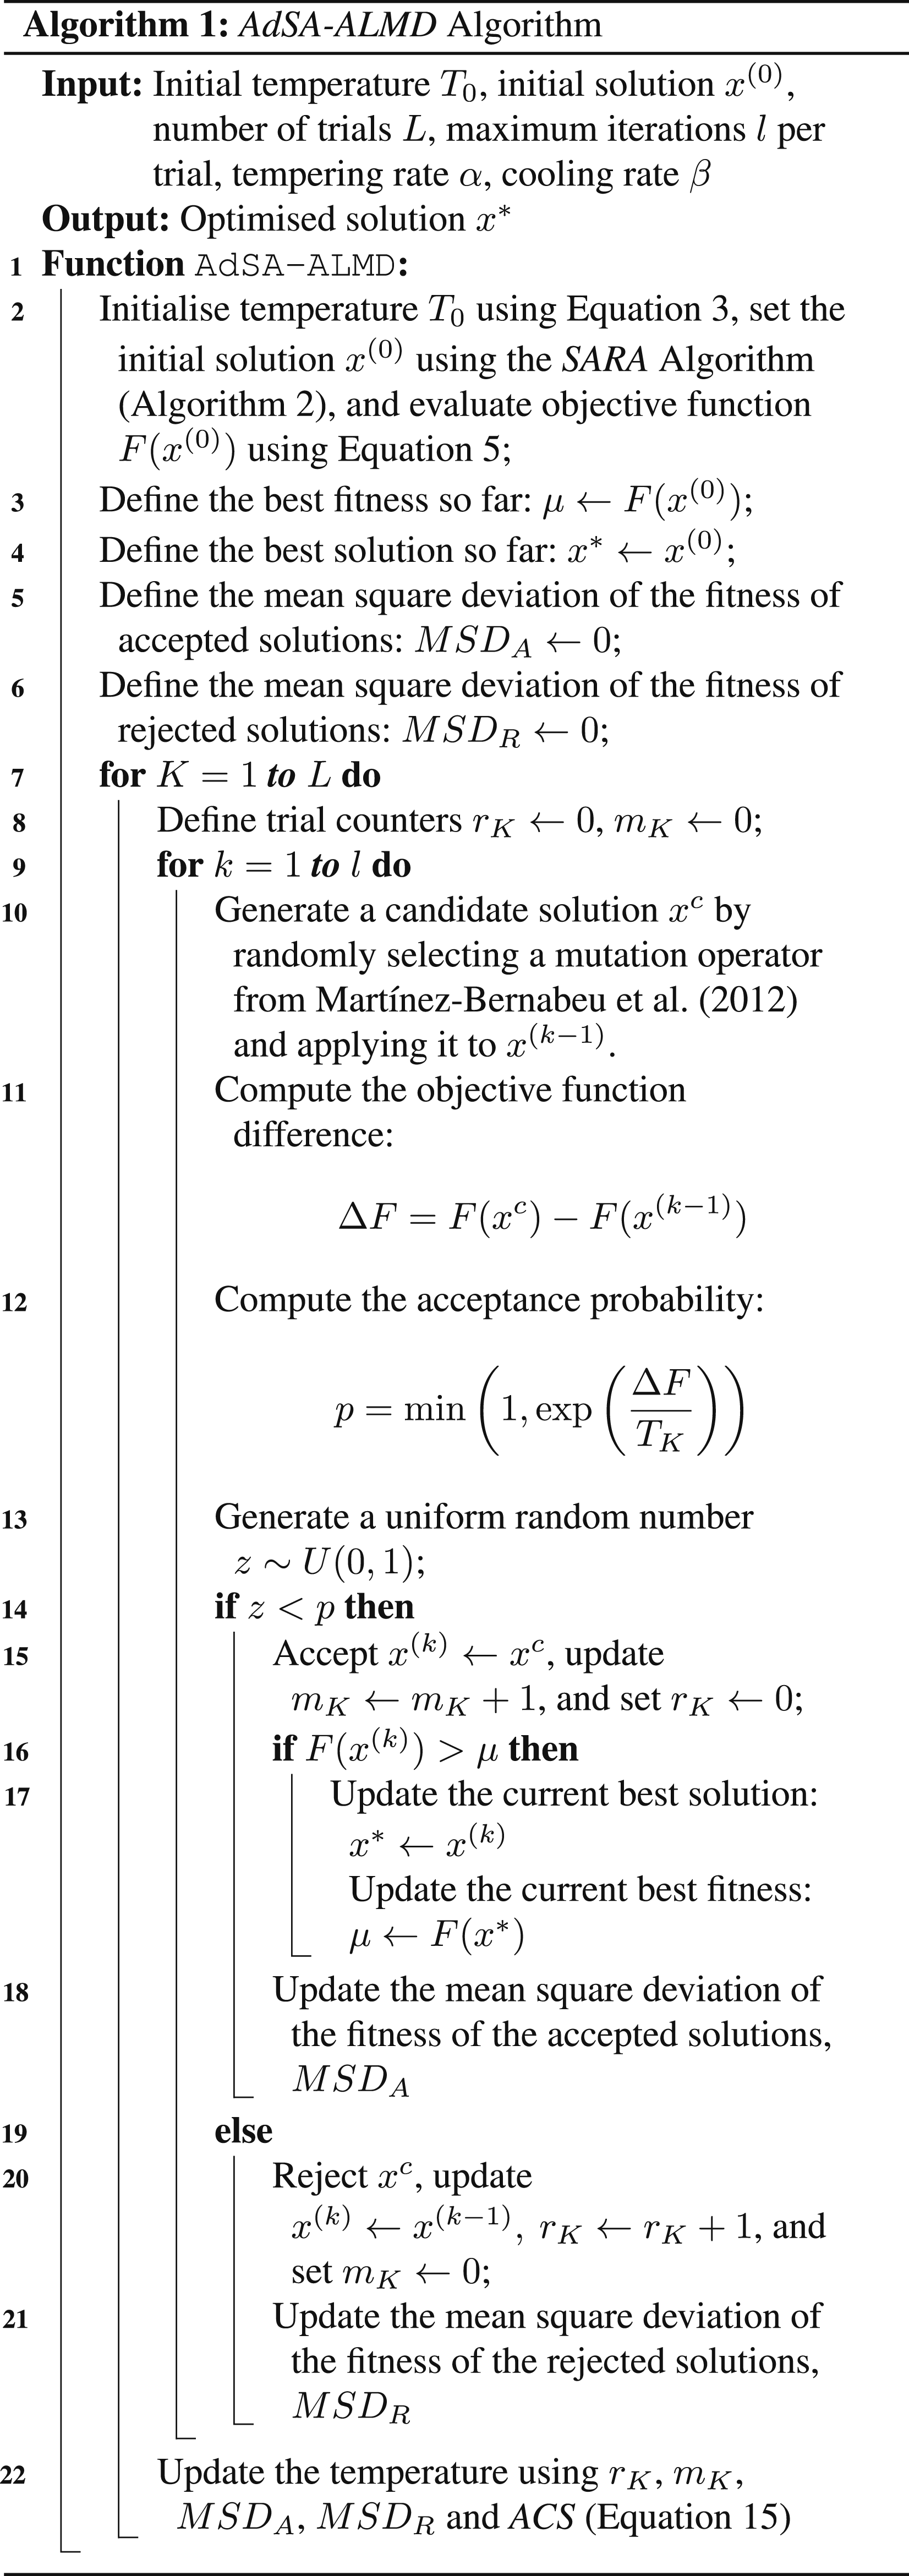
This study develops a methodology for autonomously identifying labour market regions using Simulated Annealing with an Adaptive Cooling Schedule (ACS). The method is called Adaptive Simulated Annealing for Autonomous Labour Market Delimitation (AdSA-ALMD). This approach addresses the complexities of the problem, which involves grouping BGUs in a way that maximises intra-regional cohesion while simultaneously balancing self-containment, population size, and geographical contiguity.
Simulated Annealing is a powerful metaheuristic optimisation algorithm inspired by the annealing process in metallurgy (Kirkpatrick et al., 1983). In this process, materials are heated and gradually cooled to alter their physical properties by allowing atoms in the material to arrange themselves in lower-energy crystalline structures. Simulated Annealing leverages the concept of reaching low-energy states by slow cooling to effectively explore solution spaces and find optimal or near-optimal solutions to complex optimisation problems, allowing for more flexible exploration of the solution space.
The algorithm begins with a high temperature, a parameter that controls the acceptance of new solutions. At high temperatures, Simulated Annealing accepts both improving and worsening solutions, allowing it to escape local minima that might trap other algorithms. As the algorithm progresses, the temperature decreases according to a cooling schedule, making it increasingly selective and favouring solutions that improve the objective function. This gradual cooling balances exploration and exploitation, enabling Simulated Annealing to converge toward a globally optimal or near-optimal solution.
A key enhancement in this study is the introduction of a new adaptive cooling schedule, which dynamically adjusts the rate of temperature based on the search progress. Unlike fixed cooling schedules, which follow a predetermined rate, adaptive cooling responds to the landscape of the solution space, slowing down when necessary to refine promising solutions and speeding up when exploration is required. This flexibility improves convergence, prevents premature stagnation, and enhances the quality of the solution.
The acceptance of new solutions is governed probabilistically, based on the change in the objective function and the current temperature. While better solutions are always accepted, worse solutions are accepted with a probability that decreases as the temperature drops. This probabilistic mechanism, combined with adaptive cooling, strengthens Simulated Annealing’s ability to navigate complex optimisation landscapes effectively.
In the following subsections, the initial solution, initial temperature, perturbation scheme, objective function, adaptive cooling schedule, and termination criterion will be discussed in detail. The steps for the algorithm are shown in Algorithm 1.
Initial solution
Initial solution representation.
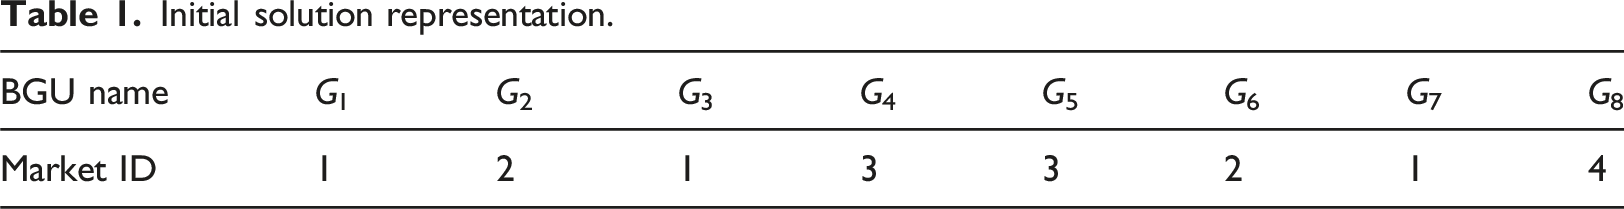
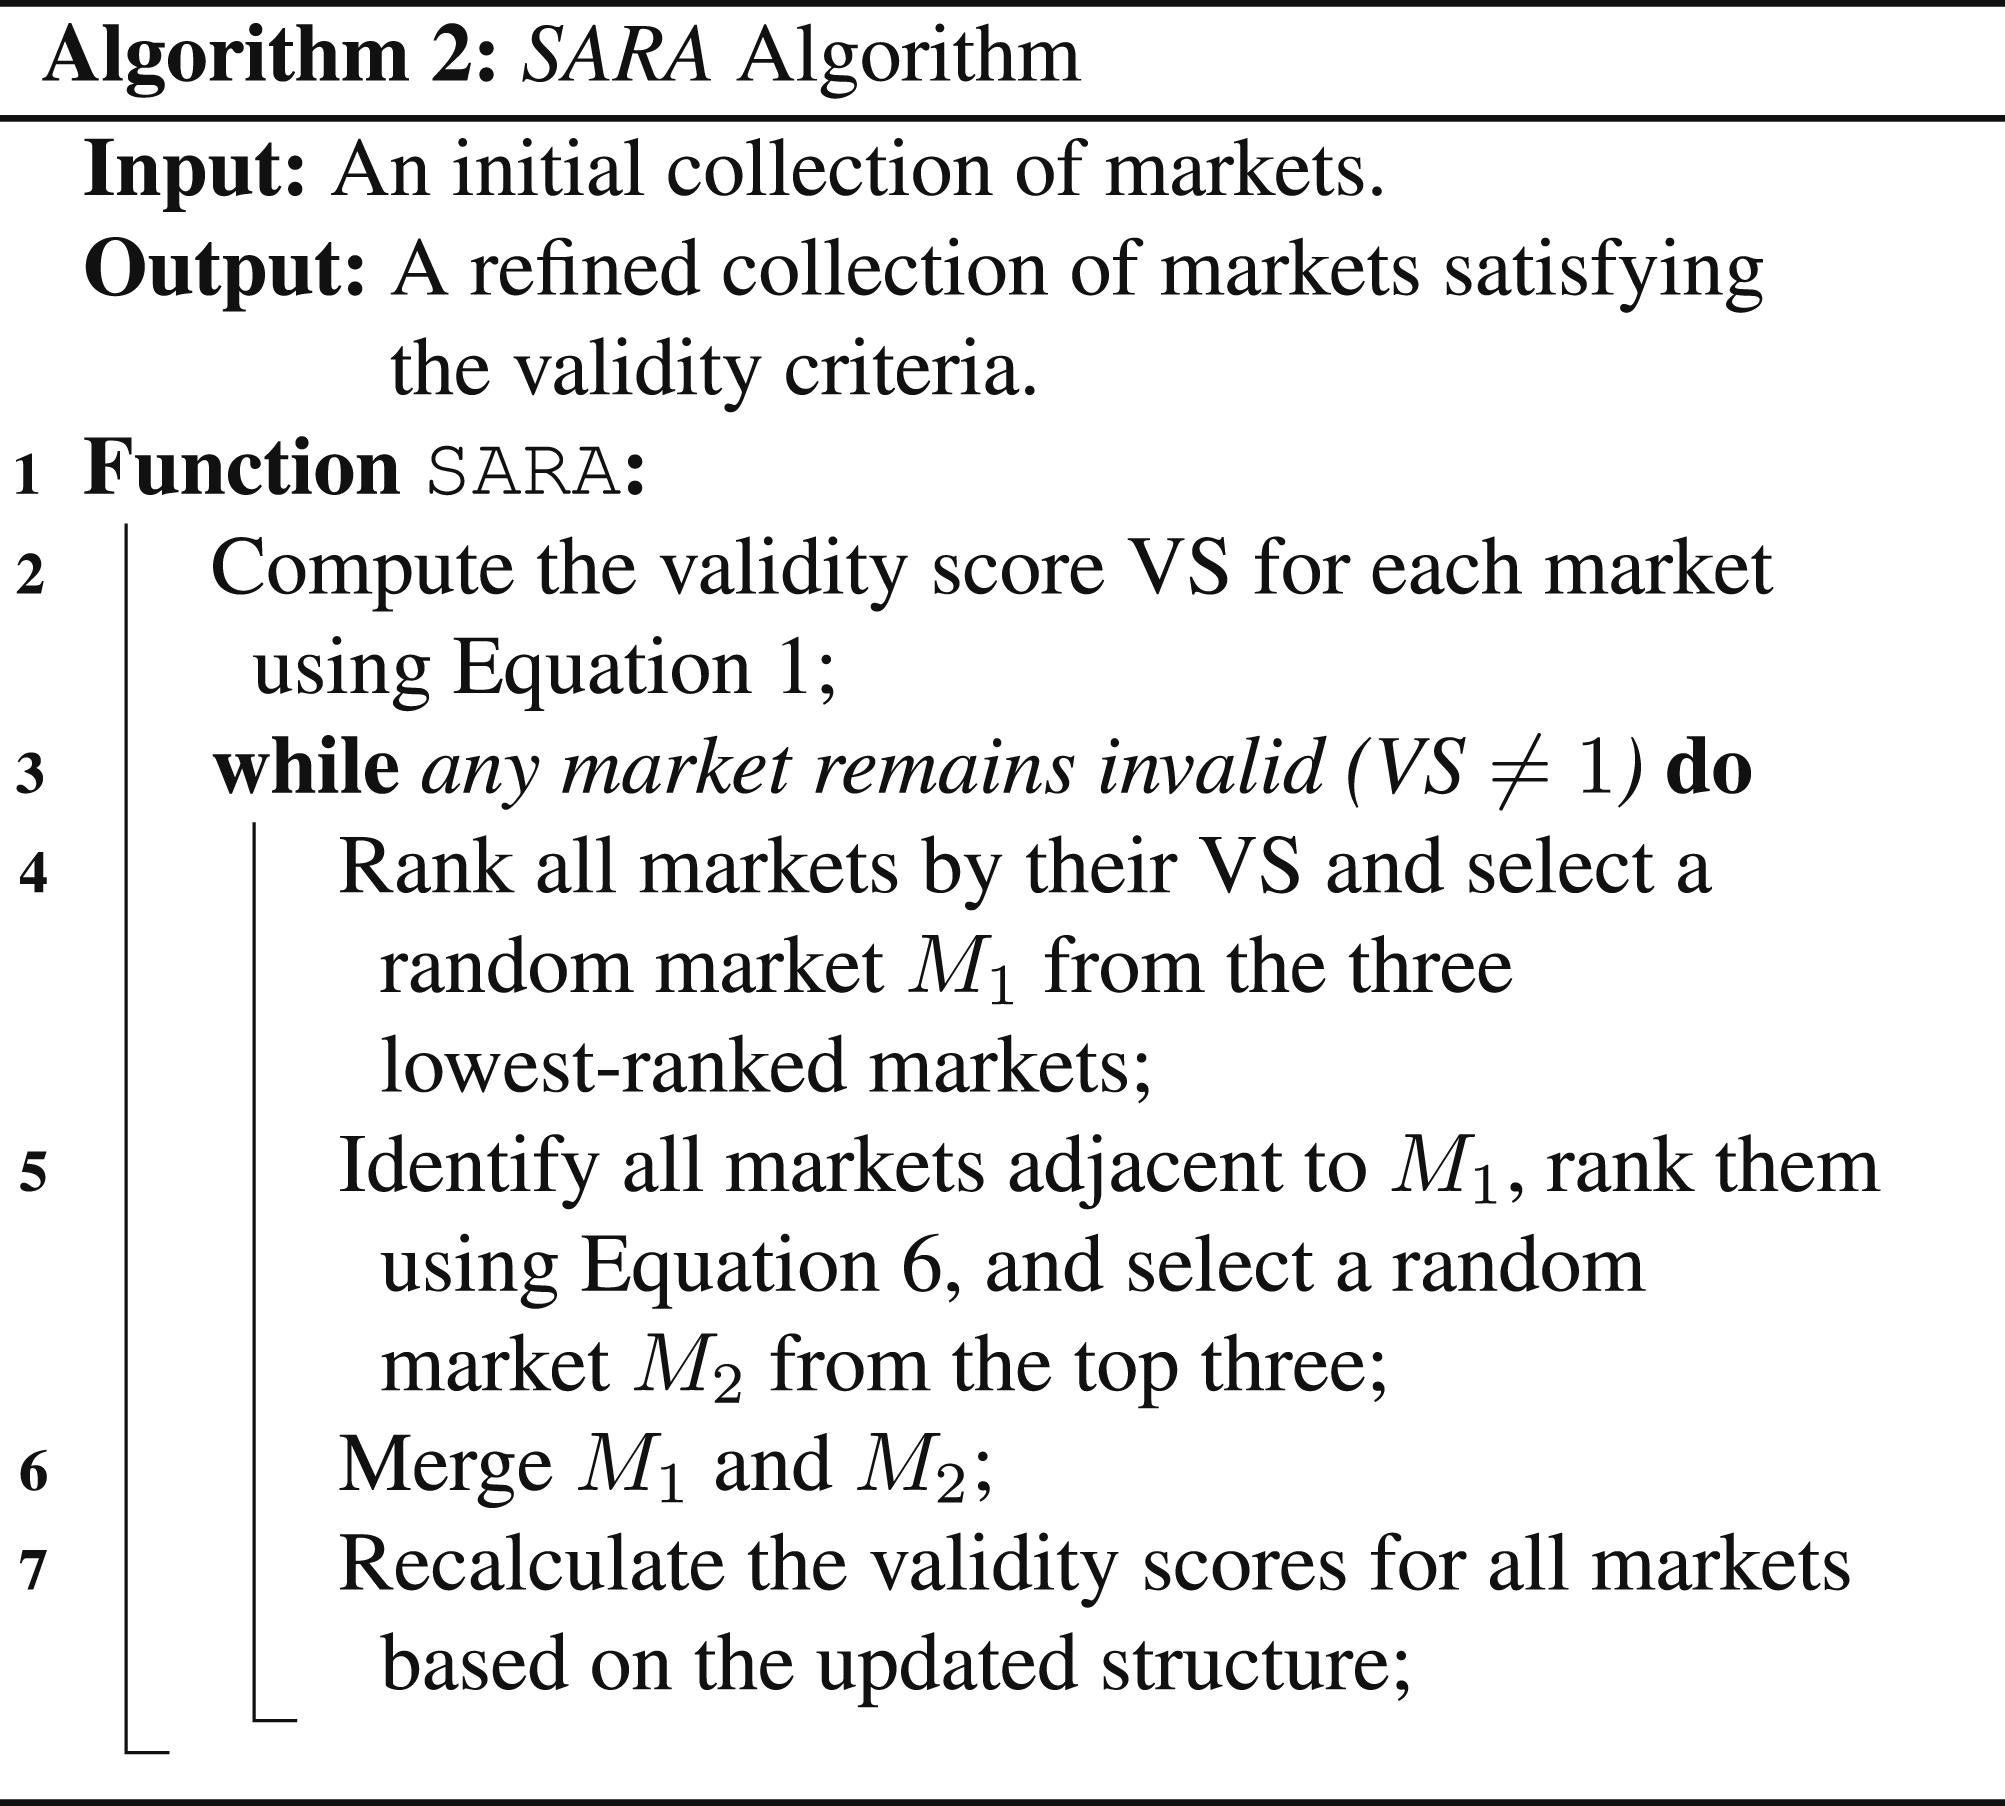
Spatially Adaptive Random Aggregation
The Spatially Adaptive Random Aggregation (SARA) approach enhances the stochastic hierarchical agglomeration (SHA) method introduced by Martínez-Bernabeu et al. (2012), by incorporating additional randomness to generate diverse and spatially coherent initial solutions. This is particularly beneficial for clustering algorithms that rely on a random initial solution. In this method, starting from an initial partition, a market with a low degree of validity is iteratively selected and merged with a related, adjacent market. This process continues until all markets satisfy the problem’s constraints. By combining randomness with spatial contiguity, SARA ensures that the generated initial clusters exhibit both variability and meaningful structure, creating a solid foundation for the subsequent optimisation process. The detailed steps for the SARA algorithm are outlined in Algorithm 2.
The validity score (VS) for assessing market validity is defined as shown in equation (1). If any market is deemed invalid, that is, if its VS is not equal to 1, the SARA algorithm is applied to obtain a valid solution. • SCmin is the threshold value for minimum self-containment; • Popmin is the threshold value for minimum population size; • 

Initial temperature
The initial temperature (T0) is determined using a probability-based acceptance criterion, ensuring that a large portion (e.g. 80%, i.e. P
o
= 0.8) of unfavourable moves are accepted at the start. This method, commonly used in simulated annealing (Kirkpatrick et al., 1983), estimates T0 as follows: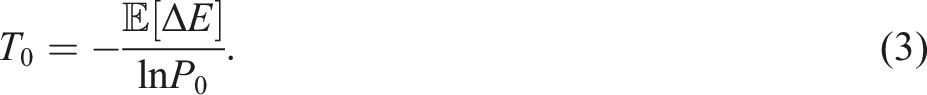
Perturbation scheme
A perturbation scheme in simulated annealing refers to the mechanism by which a given solution is modified to generate neighbouring solutions, ensuring a balance between exploration and exploitation. In the proposed AdSA-ALMD, the perturbation mechanism is designed to efficiently explore alternative regional configurations while ensuring that solutions remain spatially contiguous and economically coherent. Traditional perturbation methods often introduce random modifications that can disrupt feasibility, leading to fragmented or unrealistic LMAs.
We address this issue by incorporating group-based operators by Martínez-Bernabeu et al. (2012) into our perturbation scheme, ensuring that proposed solutions are feasible. These include merging related groups using a greedy heuristic, creating new groups by expanding from border elements, and dismantling groups by reallocating their elements to adjacent ones. Other operators adjust group boundaries by excluding or including border elements, transferring subsets between groups (segregation and annexation), randomly reassigning border elements, and exchanging elements between neighbouring groups. Together, these operators offer a versatile framework for refining group configurations and enhancing the search for optimal solutions.
Objective function
To facilitate the description of the subsequent methodological steps, the following notational conventions are adopted:
Let

In this study, the objective function is designed to maximise global cohesion, which evaluates how well each BGU aligns with its assigned cluster, ensuring that geographically adjacent regions with strong internal connectivity are grouped together. The global cohesion is optimised while incorporating penalty terms that enforce constraints on minimum self-containment and population size, thereby ensuring meaningful and functionally coherent regionalisation. As the penalty function inherently regulates the number of clusters by enforcing these constraints, an explicit term for cluster count optimisation is unnecessary. This formulation ensures that the resulting regionalisation is both methodologically robust and practically relevant, satisfying all predefined constraints. The objective function F for regionalisation x is given by: • GCI(x) represents the global cohesion index for the regionalisation x; • P(x) is the total penalty for violations of the constraints on self-containment and population size for regionalisation x; • 
Global Cohesion Index
The Cohesion Index (CI) for a BGU provides a quantitative measure of how well that BGU integrates within its designated labour market. For a specific region 
The Global Cohesion Index (GCI) is a comprehensive measure that evaluates how well all BGUs within a territory integrate with their assigned labour markets, and which can be defined as follows:
For clarity and consistency, we refer to equation (8) as the base fitness function, as it is used by both the GEA and MSA algorithms and therefore serves as the common performance measure in our comparison. This involves multiplying the GCI by m, where m denotes the number of identified labour markets.
The base fitness function for the regionalisation x is expressed as follows:
Penalties for constraint violations
Penalty terms are used in place of rigid constraints to provide greater flexibility in the optimisation process. While hard constraints typically exclude any solution that fails to meet a strict threshold, this approach can overlook solutions that are only marginally infeasible but may otherwise lead to better regional outcomes. By incorporating penalty terms, the optimisation is able to consider such near-feasible solutions, thereby enabling a more balanced exploration of the solution space.
In this study, penalty terms are introduced for two key criteria: self-containment (PSC(x)) and population size (PPop(x)). If, after applying these penalties, a solution still yields a high level of global cohesion, it indicates that the improvement in cohesion outweighs the associated penalties. In such cases, the corresponding threshold values are treated as the effective minimum thresholds for defining valid regionalisations. This approach enables the algorithm to adaptively determine acceptable trade-offs between cohesion and constraint satisfaction, resulting in more optimal and realistic configurations.
The total penalty P for the regionalisation x is the sum of the self-containment and population size penalties, as follows:
These penalty terms PSC(x) and PPop(x) are defined below.
Self-containment penalty
A key feature of labour market delineation is to maximise interactions within each labour market and minimise interactions across labour-market borders. This is measured by self-containment of incoming and outgoing flows.
There are two types of self-containment: the supply-side self-containment (SC
SS
) and the demand side self-containment (SC
DS
). SC
SS
and SC
DS
for market M
s
can be defined as follows:

In general, self-containment is commonly determined by selecting the minimum value between SC
SS
and SC
DS
. Self-containment of a market M
s
can be defined as follows:
The self-containment penalty ensures that each labour market has a sufficient balance between its demand and supply. The self-containment ratio SC(M
s
) of a labour market M
s
is compared against a predefined minimum threshold SCmin. To avoid very small penalty values when SC(M
s
) is close to SCmin, the penalty was adjusted using a scaling function. The self-containment penalty is computed as follows: • SC(M
s
) is the self-containment ratio of labour market M
s
; • SCmin is the minimum self-containment threshold which is commonly set at 0.7 (Coombes et al. (1986); Flórez-Revuelta et al. (2008); Casado Díaz and Coombes (2011); • r is a scaling exponent (typically set to 3 or 4), controlling the steepness of the penalty increase.
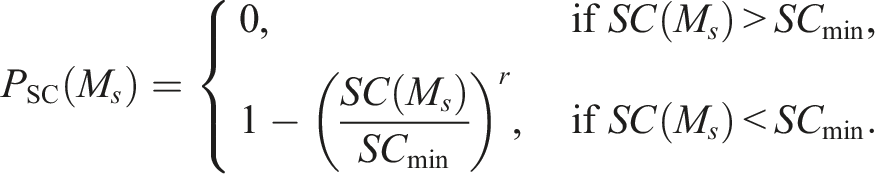
This formulation ensures that smaller deviations from the threshold do not result in negligible penalties, while larger deviations incur stronger penalties.
Population size penalty
The population size penalty ensures that each labour market has a minimum viable population size. The penalty function is designed similarly to the self-containment penalty, comparing the actual population Pop(M
s
) of a labour market M
s
against the minimum required population Popmin. The population penalty is computed as follows: • Pop(M
s
) is the population size of labour market M
s
; • Popmin is the minimum population size threshold for a labour market; • r is an exponent (typically 3 or 4), controlling the sensitivity of the penalty.
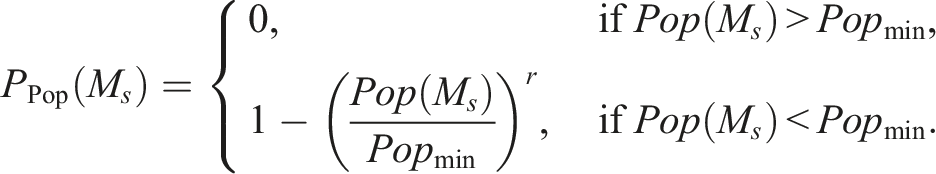
This penalty ensures that no labour markets fall below the minimum population size, with larger violations resulting in stronger penalties.
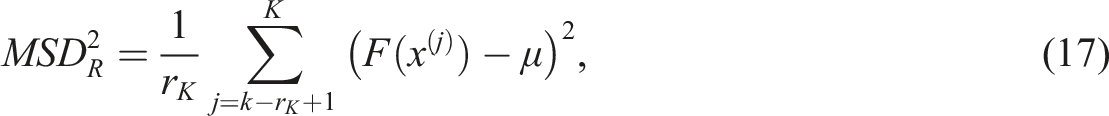
Adaptive Cooling Schedule
While conventional Simulated Annealing uses a monotonic cooling schedule, where the temperature decreases steadily over time, it may fail to escape local minima in the later stages of the search when the temperature becomes too low. Also, accepting many solutions consecutively can lead to an excessive reduction in temperature, causing the algorithm to converge too quickly and potentially miss better solutions. This limitation can lead to premature convergence, where the algorithm settles into suboptimal solutions. To address this issue, this study introduces the Adaptive Cooling Schedule (ACS), inspired by insights from the algorithm’s performance analysis. ACS dynamically adjusts the temperature based on the algorithm’s progress and the characteristics of the search path.
The proposed ACS distinguishes itself by dynamically adjusting the temperature based on the variability of objective function values from previous solutions relative to the best objective function value at that stage. This adaptive mechanism ensures a more responsive and efficient search process, improving convergence towards optimal solutions. Tracking fitness variation is crucial for adapting to the temperature, as it directly reflects the diversity of new solutions compared to previous ones. A high variation indicates meaningful exploration, while a low variation suggests stagnation, necessitating an adjustment in temperature to either encourage further exploration or refine the search within promising regions.
In this study, the temperature is adapted according to the following formula:
The temperature for trial K + 1 updated as follows: • T
K
is the temperature for trial K; • MSD
A
is the mean squared deviation of the fitness values between consecutive accepted solutions and the current best fitness; • α is the coefficient controlling the increase in temperature (0 < α < 1); • MSD
R
is the mean squared deviation of the fitness values between consecutive rejected solutions and the current best fitness; • β is the coefficient regulating the reduction in temperature (0 < β < 1); • m
K
is the number of consecutive accepted solutions; • r
K
is the number of consecutive rejected solutions.
The mean squared deviation of the fitness of the accepted solutions • μ is the current best objective function value; • F(x(j)) is the fitness of solution x(j) at trial K.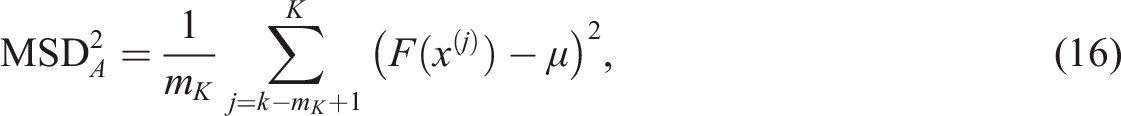
Termination criterion
Termination criterion ensures that the algorithm converges to a satisfactory solution within the specified constraints. In this study, the algorithm terminates when a predefined stopping condition is satisfied, that is, when the differences in consecutive objective functions are within ϵ AdSA−ALMD . Our preliminary test found that setting the maximum number of trials L = 1000 was sufficient when ϵ AdSA−ALMD = 0.
Results and discussion
Application to real-world data
In this section, the proposed AdSA-ALMD method was applied to real-world data and evaluated against three existing approaches: TTWA, GEA, and MSA. All codes were written in R (R Core Team, 2024), and the methods were run in the ABS DataLab environment (Australian Bureau of Statistics, 2021b) using 8 CPUs with 64 GB of memory.
A key challenge in implementing these methods lies in selecting appropriate parameter values for SCmin, Popmin, SC tar , and Pop tar . The parameter settings used for one geographic region often aren’t optimal for another, as patterns of regional interaction can vary significantly across different regions. Therefore, a sensitivity analysis is recommended to determine the most suitable parameter settings for the study region.
Grid search results for parameter ranges, increment, and optimal values for self-containment and population thresholds.
It was also observed that the GCI is more strongly influenced by the Popmin and SCmin parameters while exhibiting comparatively lower sensitivity to the Pop tar and SC tar . This insight motivated the design of a simulation study to investigate how variations in SCmin and Popmin affect regionalisation. This study is described in detail in the section Validation with Simulated Data.
The parameter settings identified as optimal through the grid search in Table 2 were used to implement the methods in this paper. According to the 2016 ABS geographic boundaries, Queensland comprises 528 SA2 regions. However, in this study, the analysis was conducted on n = 520 BGUs, resulting in 520 × 520 origin-destination (W) and adjacency (A) matrices. The reduction in SA2s is due to the merging of uninhabited regions (often characterised by national parks, remote or inaccessible landscapes, or restricted areas with no recorded residential or workplace population) into neighbouring SA2s. This merging was based on geographic proximity to ensure logical and coherent integration into the surrounding labour markets, with physical distance considered to preserve spatial continuity.
Additionally, several island SA2s in Queensland are geographically isolated and lack direct connections to neighbouring areas. Due to their separation, these regions could not be included in contiguous labour markets based solely on spatial proximity. Instead, they were allocated to labour markets based on observed commuting patterns.
Comparison of regionalisation results across four methods: TTWA, GEA, MSA, and the proposed AdSA-ALMD.
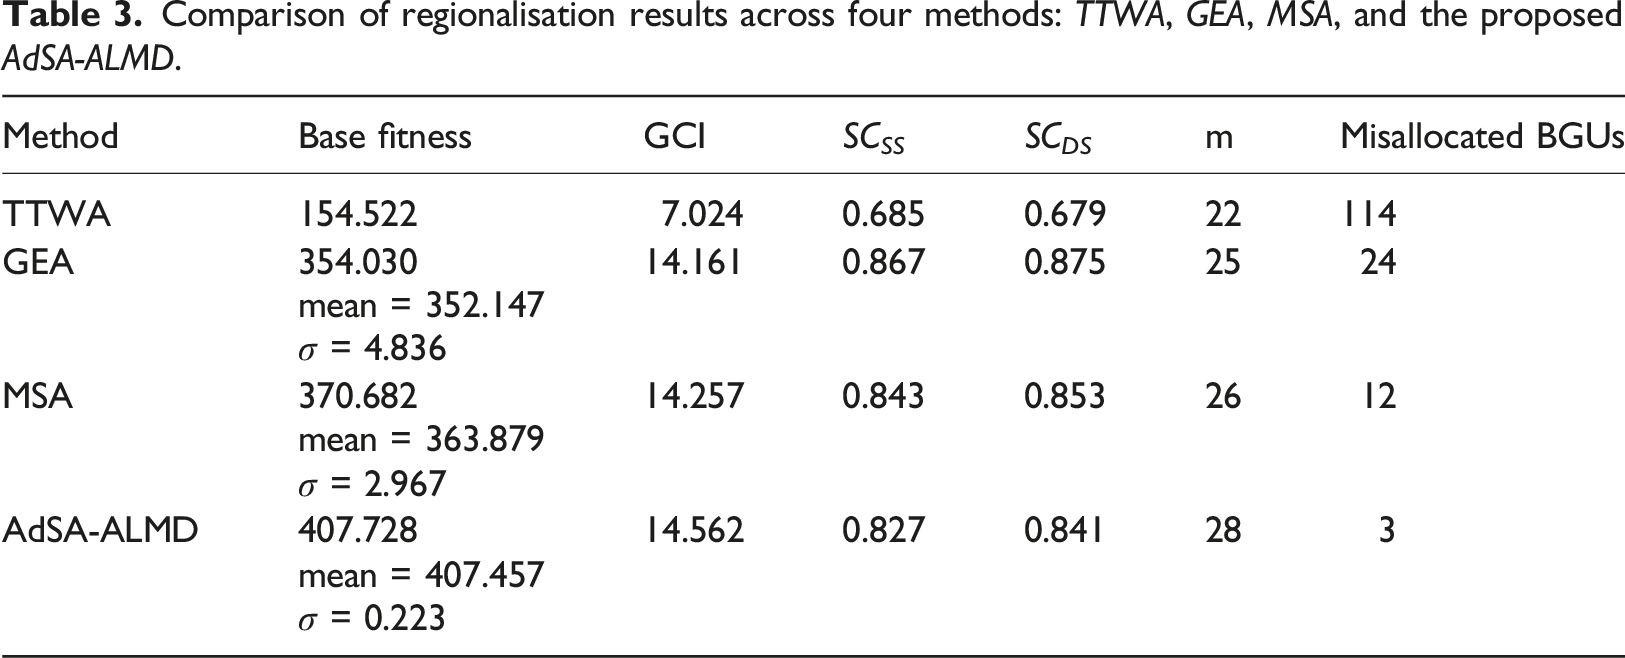
Based on the results reported in Table 3, the AdSA-ALMD approach consistently attains higher base fitness values and GCI scores compared with the alternative methods, while avoiding substantial reductions in self-containment (SC SS and SC DS ). In addition, the method yields a higher number of labour market areas (m) alongside fewer BGU misallocations, indicating a more coherent and functionally consistent regionalisation. To complement the summary indicators presented in Table 3 and to provide a clearer assessment of the structural characteristics of the resulting labour market areas, the supplementary material provides additional descriptive statistics in Table S1. These include the minimum, first decile, median, and maximum values of self-containment, population size, and land area. Together, these results help assess whether the observed improvements in cohesion arise from more appropriate boundary adjustments rather than from excessive fragmentation induced by the relaxation of constraints. This interpretation is supported by the inclusion of explicit penalties on population size within the optimisation framework, which regularise the solution space and prevent fragmentation, ensuring that cohesion gains reflect substantive boundary adjustments rather than the creation of arbitrarily small regions. Nevertheless, the resulting labour market boundaries should be interpreted as conditional on the specification of the penalty terms and are therefore not unique; alternative but reasonable formulations may lead to slightly different configurations while preserving the overall balance between cohesion and self-containment. Although land area distributions are also reported, meaningful comparisons are more challenging in the Australian context. Larger LMAs often encompass sparsely populated rural regions, whereas smaller LMAs generally correspond to densely populated urban areas, meaning that variation in land area primarily reflects underlying settlement patterns rather than differences between the methods.
A core feature of AdSA-ALMD is its ability to adjust these constraint thresholds in response to the characteristics of the evolving regionalisation. This feature addresses an important limitation of the MSA approach, namely, its limited capacity to account for differences in commuting patterns across regions. By adjusting threshold parameters in line with the underlying commuter structure, AdSA-ALMD improves generalisability and can be applied across diverse regional settings without requiring manual calibration. In contrast, the rigidity of the MSA approach yields lower fitness values and greater solution variance than the proposed AdSA-ALMD method.
The GEA performs even worse than MSA in base fitness, fitness variance, and BGU misallocations, resulting primarily because it lacks the additional local refinement layer included in MSA, making it more susceptible to premature convergence and less capable of correcting poor assignments during optimisation.
The TTWA method shows the lowest fitness among all compared approaches. This is expected, as TTWA is designed solely to minimise the number of individuals commuting across labour market boundaries. It does not account for the internal cohesion within regions, that is, the strength of intra-regional commuting ties. For contexts where internal cohesion within regions is essential, the results show that AdSA-ALMD offers opportunities to directly incorporate it into regionalisation to greatly improve the GCI.
The Misallocated BGUs column in Table 3 summarises the variation in the number of misallocated BGUs across the methods. The AdSA-ALMD method shows a relatively low proportion of misallocated BGUs across repeated runs, indicating that its optimisation framework tends to converge to solutions comparable to those of other methods. Figure 1 illustrates the spatial differences between two of the best solutions produced by the method. These differences are minimal and occur primarily along the borders of labour market regions. This is expected, as BGUs near boundaries often exhibit commuting flows to multiple neighbouring regions, making their assignment more susceptible to slight variations during the optimisation process. Such variations typically stem from the algorithm’s stochastic elements, such as the probabilistic acceptance of moves. On average, only about 3 out of 520 BGUs (approximately 0.6%) shift between clusters in different high-quality solutions, highlighting the stability and reliability of the regional boundaries identified by AdSA-ALMD. To provide additional visual context, visualisations of the best labour market boundaries obtained from the four methods are shown in the Figures S1–S4 in the supplementary material. Comparison of regional boundaries between two solutions. Map (a) illustrates the regionalisation from the first solution, while map (b) depicts the boundaries from an alternative solution, highlighting how the boundary region shifts between different labour markets.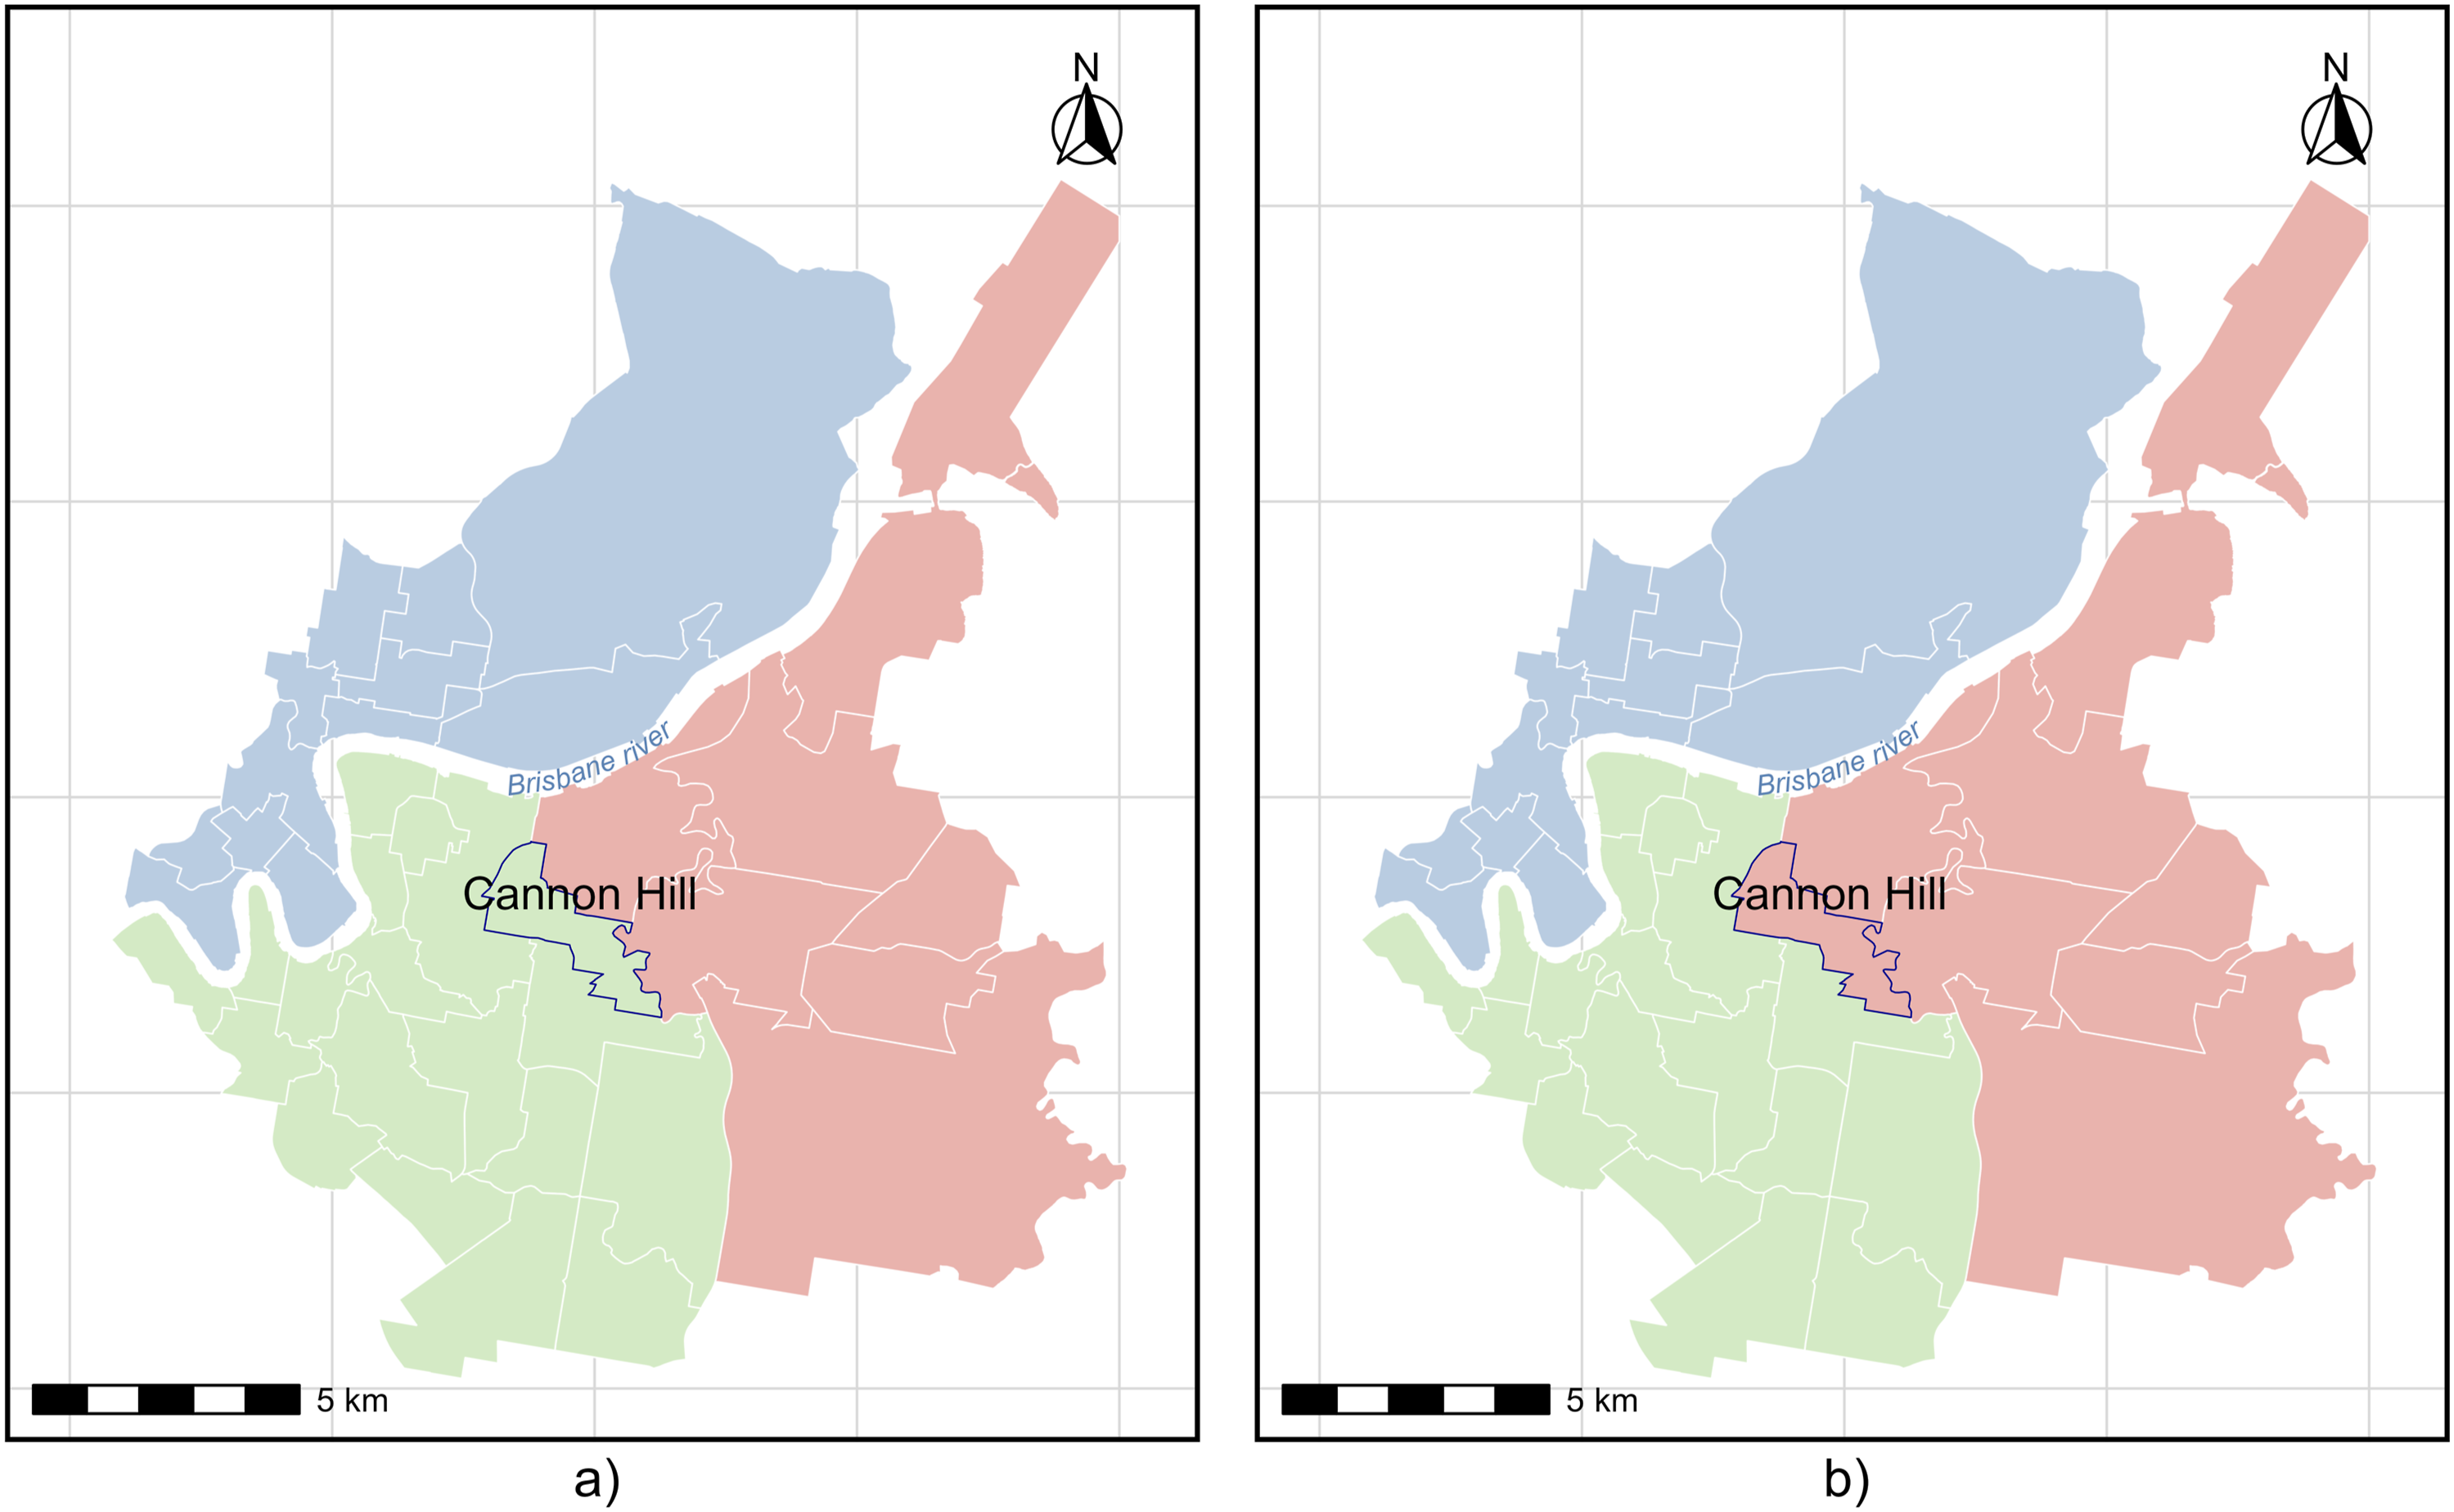
While experimental results indicate that the runtime across all three methods is broadly comparable, the value of AdSA-ALMD lies in its ability to generate more consistent regionalisations, reduce misallocated BGUs, and minimise sensitivity to manually chosen threshold parameters. These methodological improvements, rather than gains in runtime, constitute the primary rationale for proposing an alternative to existing LMA delimitation methods.
Validation with simulated data
This simulation study was motivated by insights from the initial grid search on the real data, which revealed that the final outcomes are sensitive to the minimum population size and self-containment thresholds. To investigate how different methods respond to these parameters and to better understand how such variations might affect real-world applications, we designed a controlled simulation study. In this setup, we fixed the Popmin, Pop tar , and SC tar , while varying the SCmin threshold across three levels: 0.55 (the optimal value identified in the grid search), 0.65, and 0.75. This allowed us to assess the robustness and adaptability of each method under varying constraint conditions.
The simulation study was conducted using three synthetic datasets, each represented as an origin-destination matrix, to evaluate the performance of the methods across varying patterns of regional interaction. The aim was to assess their generalisability to a broad range of regions characterised by different commuting patterns. Each dataset consists of 14 BGUs with populations ranging from 3000 to 25,000 residents, reflecting the ABS SA2 design criteria. The total population in each dataset was fixed at 140,000. In each BGU, we considered that only 64.6% of the population were employed, as described in Australian Bureau of Statistics (2024). To simulate different levels of regional integration, the datasets were constructed to represent high, medium, and low self-containment scenarios. BGUs were initially grouped into predefined LMAs. In the high self-containment scenario, BGUs within each LMA were assumed to be strongly integrated, with most commuting occurring internally. The medium and low self-containment datasets were created similarly, with adjustments made to reduce internal commuting and increase cross-boundary flows.
High self-containment (1.0–0.75)
It is characterised by tightly integrated regions where internal interactions dominate and external dependencies are minimised.
Moderate self-containment (0.75–0.65)
It reflects a more balanced interaction pattern, with moderate internal cohesion and external dependencies.
Low self-containment (0.65–0.55)
It exhibits weaker internal cohesion with more external dependencies.
Summary of simulation study results for the TTWA, GEA, MSA, and AdSA-ALMD methods applied to three datasets with varying minimum self-containment thresholds.
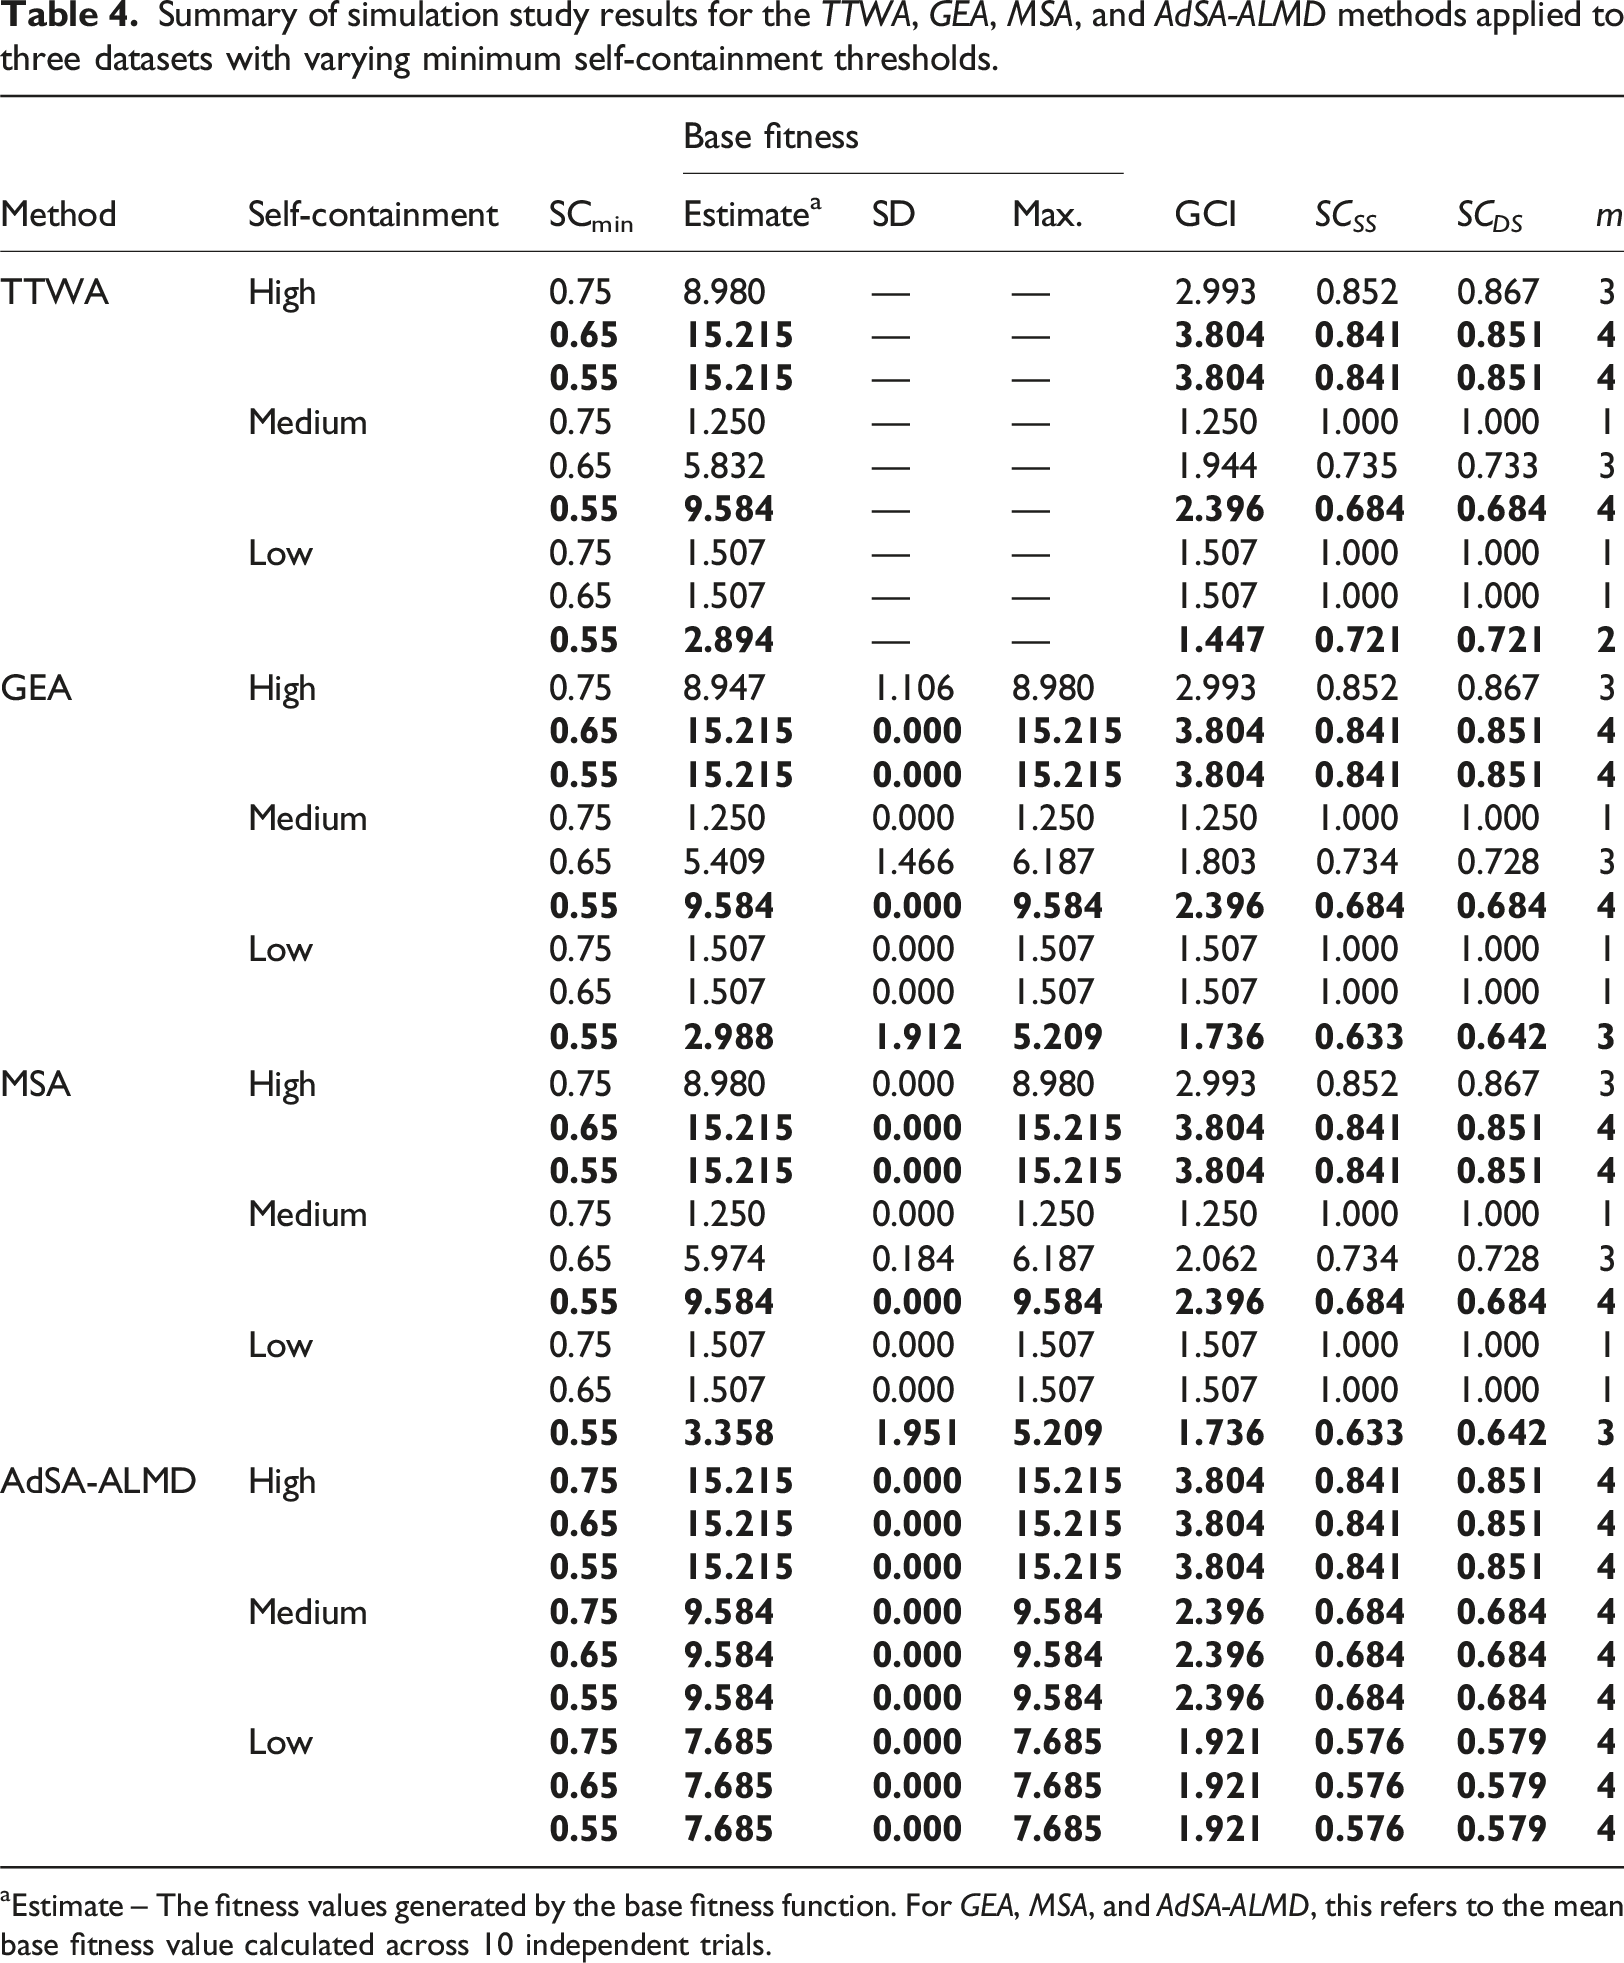
aEstimate – The fitness values generated by the base fitness function. For GEA, MSA, and AdSA-ALMD, this refers to the mean base fitness value calculated across 10 independent trials.
The best-performing results, defined as the regionalisations that exhibit the expected regional patterns for each method, are highlighted in bold in Table 4. The findings show that the optimal value of SCmin varies across the three datasets for methods, except for AdSA-ALMD, which maintains consistent performance. This variation highlights that SCmin is highly sensitive to the commuting structure of a given region; thresholds that work well in densely interconnected areas may not be the best fit in regions with more spatially dispersed commuting flows. TTWA, GEA, and MSA use a fixed SCmin for all regions. In contrast, AdSA-ALMD allows SCmin to vary by region, so it offers opportunities to produce regionalisations that may align better with the underlying geography. This was one of the primary motivations for the simulation study: to test the robustness of each method under varying constraint settings and different regional interaction patterns.
The results highlight that selecting an appropriate value for SCmin and Popmin can improve the quality of regionalisations. When these parameters are not well aligned with the underlying data, manual tuning or post-processing is often necessary, which may affect the consistency and efficiency of the delineation process. Furthermore, identifying the optimal threshold typically requires extensive trial and error, placing a significant burden on researchers and policymakers, particularly when working across diverse geographic contexts. In contrast, the AdSA-ALMD method exhibits reasonable robustness to variations in SCmin and Popmin and performs steadily across regions with high, medium, and low levels of interaction. This feature reduces the need for manual parameter calibration and supports generalisability across varying spatial and commuting structures, making it a more practical and scalable solution for real-world applications.
The SD column in Table 4 reports the standard deviation of fitness values across trials, offering insights into the stability of each method. A lower standard deviation indicates greater consistency in performance. The TTWA method demonstrates strong internal consistency, as its deterministic, step-by-step selection process reliably produces the same outcome when parameters are held constant. However, this rigidity comes at a cost: the method is highly sensitive to parameter changes, where even minor adjustments can lead to substantially different solutions. While this ensures stability within a fixed configuration, it reduces the method’s adaptability across varying conditions and datasets.
In contrast, the GEA, MSA, and AdSA-ALMD methods rely on optimisation algorithms that incorporate elements of randomisation and iterative exploration. As a result, their solutions are not guaranteed to be unique and may vary across runs. The robustness of these methods can therefore be assessed by the extent of variation in their results: high fitness variance may signal instability and suggest the need for further refinement. The results show that both GEA and MSA exhibit notable variance, which appears to arise from their difficulty in identifying threshold values appropriate for the study region.
By comparison, AdSA-ALMD achieves zero variance across trials, indicating a high degree of stability. This consistency stems in part from the robust performance of the simulated annealing framework, which effectively balances exploration and exploitation during the optimisation process. The method’s design, particularly its dynamic threshold selection and cooling schedule, further enhances convergence without compromising the search space. By adjusting the self-containment and population size thresholds in response to the search process, AdSA-ALMD tends to produce robust and reproducible solutions, ensuring both reliability and generalisability across diverse spatial and commuting scenarios.
Percentage of misallocated BGUs across varying levels of self-containment scenarios under different SCmin thresholds.
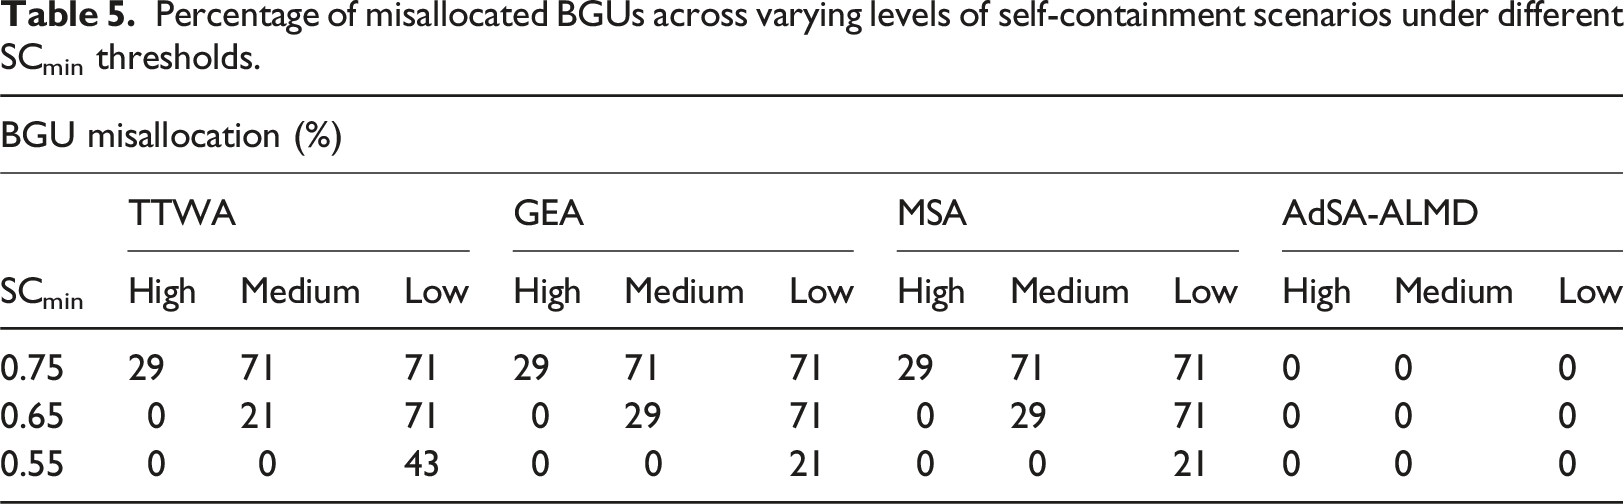
A clear pattern emerges from the misallocation analysis. All three existing methods achieve zero misallocation in the lower triangle of the table under specific conditions, whereas the upper triangle consistently shows higher rates. This reflects the limitations of the methods in capturing commuting patterns in regions with weaker internal cohesion and stronger external dependencies. These misallocations are primarily driven by regional disparities and the sensitivity of the methods to threshold settings. Notably, achieving zero misallocation requires thresholds that align with the intensity of regional interactions, a task that AdSA-ALMD handles with greater precision than the other methods.
Conclusions
Accurately defining labour market boundaries is crucial for the production and dissemination of labour market statistics, which support a wide range of socio-economic analyses and inform policy decisions. As stakeholders increasingly face the challenges of expansive territories, varying spatial resolutions, and dynamic commuting patterns, developing new methods or refining existing ones to autonomously identify LMAs using advanced techniques has become essential for generating more accurate and meaningful delineations.
This paper introduces the AdSA-ALMD algorithm, which addresses a key limitation of existing approaches, their limited generalisability across regions with varying commuting patterns. Most existing methods struggle to identify suitable parameters for a given region and therefore often require manual adjustments after delimitation. In contrast, AdSA-ALMD leverages the strengths of simulated annealing to effectively balance exploration and exploitation while dynamically identifying optimal threshold values based on the spatial and commuting characteristics of each region. Results from both synthetic datasets and micro-level journey-to-work data from the 2016 Australian Census demonstrate that if high cohesion and self-containment are the main goals of regionalisation, AdSA-ALMD consistently outperforms established methods, including the Travel-to-Work Area Algorithm, Grouping Evolutionary Algorithms, and recent Multi-step Approach. It produces labour market regionalisations with higher internal cohesion, stronger self-containment, and more stable outcomes across multiple runs. Furthermore, by autonomously tuning its parameters, the method is highly transferable and can be applied across diverse regional and national contexts without requiring manual calibration.
Our study uses 2016 census data specifically to avoid COVID-related disruptions, during which the proportion of working-from-home (WFH) workers was relatively small. Consequently, WFH behaviour in this period largely appears as noise and has minimal influence on commuting-based cohesion or the resulting spatial configuration of LMAs. However, as WFH uptake grows, its potential impact on cohesion and the spatial shape of LMAs will become increasingly relevant, warranting further consideration in future work.
While AdSA-ALMD provides a robust framework for labour market delineation, the current study is limited to commuting data alone. This presents a constraint, particularly in regions where additional factors beyond travel-to-work patterns shape labour market dynamics. Future research will aim to extend the methodology by incorporating complementary dimensions such as industry composition, employment specialisation, and the spatial structure of metropolitan areas. Integrating these elements will enable a more comprehensive and accurate representation of functional labour markets.
Supplemental material
Supplemental Material - Adaptive simulated annealing for autonomous labour market delimitation
Supplemental Material for Adaptive simulated annealing for autonomous labour market delimitation by Jamintha Samarakoon, Helen Thompson, Edwin Lu, and Gentry White in Environment and Planning B: Urban Analytics and City Science
Footnotes
Authors’ note
Any other identifying information related to the authors and/or their institutions, funders, approval committees, etc. that might compromise anonymity.
Acknowledgements
The author would like to thank the Australian Bureau of Statistics for providing access to the 2016 Census journey-to-work data used in this study. Appreciation is also extended to A/Prof Gentry White, Prof Helen Thompson, and Edwin Lu for their valuable guidance and feedback throughout the research process. Additional thanks to the QUT Centre for Data Science, colleagues, and reviewers for their support and contributions.
Ethical considerations
Ethical approval for the use of this data was granted under a Human Ethics Low Risk Application for the project titled Automated Methods for Identifying Labor Market Areas (Approval Number: 8044; Approved Version Number: LR 2024-8044-17,199). As the data used were secondary and fully de-identified, informed consent was not required.
Consent to participate
This study did not involve direct interaction with human participants and was conducted using journey-to-work data from the 2016 Australian Census, provided by the Australian Bureau of Statistics.
Funding
The authors disclosed receipt of the following financial support for the research, authorship, and/or publication of this article: This research was supported by the Australian Bureau of Statistics (ABS 2020.325).
Declaration of conflicting interests
The authors declared no potential conflicts of interest with respect to the research, authorship, and/or publication of this article.
Data Availability Statement
The data used in this study are derived from the 2016 Australian Census journey-to-work dataset, provided by the Australian Bureau of Statistics. Access to this data is subject to the ABS’s data access policies and requires approval.
Supplemental material
Supplemental material for this article is available online.
Author biographies
References
Supplementary Material
Please find the following supplemental material available below.
For Open Access articles published under a Creative Commons License, all supplemental material carries the same license as the article it is associated with.
For non-Open Access articles published, all supplemental material carries a non-exclusive license, and permission requests for re-use of supplemental material or any part of supplemental material shall be sent directly to the copyright owner as specified in the copyright notice associated with the article.