
Abstract
In the United Kingdom, town centres face significant economic and social challenges, with amenities playing a crucial role in their vitality. However, no existing study has thoroughly investigated the relationship between amenities and footfall, a key measure of place vitality. This research addresses this gap by examining which amenities drive footfall in UK town centres. The study employs the random forest modelling, to analyse data from OpenStreetMap (OSM) and footfall data from 960 counters across the United Kingdom. Our findings reveal that OSM data can effectively predict footfall, highlighting the importance of diverse amenities. Key amenities identified include hotels, pedestrian ways, and retail establishments. Furthermore, the study identifies critical inflection points where the presence of certain amenities significantly boosts urban vitality. These insights offer valuable guidance for urban planning and development, suggesting that a mix of diverse amenities at appropriate levels can enhance the attractiveness and vitality of town centres.
Introduction
The topic of what a successful town centre is has sparked many debates and a vast array of toolkits, reports, and academic outputs over the years. Notwithstanding the difficulty of defining the ideal composition of town centres, their perpetual state of evolution and change goes hand-in-hand with major economic and social challenges that affect their vitality and viability. The present paper does not aim to further unpack the ambiguities and complexities of creating viable town centres (see Ntounis et al., 2023 for a summary). Instead, its focus lies on identifying the conditions that reflect a town centre’s dynamic nature and hybridity, as well as its ability to attract or divert people based on a plethora of amenities that are pertinent in the urban environment (Jones et al., 2016). The purpose of this research is to deepen our understanding of which features or amenities in town centres contribute to their vitality, as measured by daily footfall.
In the UK context, the multiple ‘waves’ of retail decentralisation (Schiller, 1986) and the subsequent proliferation of online shopping have severely altered the perception and belief of what a successful town centre is and have rendered traditional retail centre hierarchies at ‘the very best blurred’ (Jones and Livingstone, 2018: p. 51). In this vein, several authors (Ballantyne, 2022; Dolega et al., 2021; Mumford et al., 2021) have highlighted the irregularities and inconsistencies of uniform approaches to classify town centres based solely on retail. Furthermore, the COVID-19 pandemic has also led to an analytical (re)framing of the post-pandemic town centre, which necessitates reflected action and collective decision-making in order to deal with the associated complex geographical and societal vulnerabilities that people and businesses face. The ongoing climate emergency has also exemplified the need for mitigation and adaptation to environmental changes and a future shift towards more digitally led and less carbon-demanding town centre usage (Grimsey et al., 2020) has been deemed imminent. As such, there is an urgency and demand (as exemplified by many policy responses) to transform town centres as viable multifunctional places that cater for their users and local communities and create amenable conditions for commercial, leisure, cultural, touristic, and residential activity.
Many existing studies on urban vitality focus on modelling street activity intensity related to footfall, often examining factors like schools, bus stops, open spaces, and residential services. However, these studies typically consider a limited range of amenities and demographic and morphological factors (e.g. Han et al., 2024). While some research posits the impact of amenities on urban vitality (e.g. Parker et al., 2017), this relationship remains underexplored. To address this gap, this research aims to identify which amenities can predict footfall in UK town centres by answering the research question: ‘What amenities can help predict footfall in city/town centres in the United Kingdom?’
This study utilises the volunteered geographic information (VGI) dataset, OpenStreetMap (OSM). OSM is a global dataset encompassing a wide range of amenities, making it ideal for the analysis. Footfall data was collected from 960 counters across the United Kingdom. The average daily footfall data for each counter during 2022 serves as the outcome variable. From OSM, we screened and collected 222,299 unique polygonal areas corresponding to 132 predictor variables (amenities and other features) relevant to town centres. In this study, we employ the random forest (RF) algorithm to identify important features that can predict footfall in UK town centres.
In this context, the following sections will outline the desirable amenities for town centres and explore how these amenities impact the vitality of a town centre, as measured by footfall. This will be followed by sections on the methodology, findings, and conclusions.
Literature review
How can footfall assist our understanding of town centre vitality?
Town centres are routinely understood as areas where ‘many different urban activities coalesce and coexist in a distinct place’ (Thurstain-Goodwin and Unwin, 2000), with varying central points, such as landmarks, shopping centres, transport hubs, green areas, public spaces, and anchors other than retail (hospitals, universities, and innovation districts) that attract a significant number of people. To assess the vitality of town centres, ‘footfall’ serves as a proxy indicator of human activity, closely linked to the concept of ‘urban vitality’ (Kang et al., 2021; Zhang et al., 2021), a critical factor in addressing the decline of town centres in the United Kingdom (Parker et al., 2017). Footfall counts, representing the actual measurement of daily, weekly, and monthly visitor patterns, have the potential to reveal emerging changes in town centre activity and identify the specific features of these places that influence footfall.
Footfall research has gained increasing momentum in recent years (Chen et al., 2023; Enoch et al., 2022; Lee, 2020; Mumford et al., 2021; Philp et al., 2022) as a responsive measure for the analysis of the: - Macro-level environment, such as broader economic trends of the Internet (Singleton et al., 2016) and the global challenge of COVID-19 (Angel et al., 2023; Enoch et al., 2022). - Meso-level environment such as examining the influence of housing/employment density and land use diversity (Arellana et al., 2020) and the convergence of common social activities, rhythms, and patterns within town centres (Dargan, 2022), and - Micro-level characteristics such as a location’s functional and morphological features (e.g. trees, sidewalks, street quality, anchor stores, and transport hubs) that shape connectivity and attractiveness (Philp et al., 2022).
Dargan (2022) argues that footfall is a performance measure for places that acts as an evidence-based diagnostic of people’s daily life, allowing for the examination of place-based interventions that can change the fabric of a location. Place change is of course dependent on the provision of spaces of interest and functions that can uncover the temporal, rhythmic and dynamic patterns of urban movement within distinct human activity zones (Chen et al., 2023). Thus, understanding the dynamism of footfall counts can reveal important insights on potential development and provision of amenities that can enhance or alter the characteristics of a location and its built environment (Angel et al., 2023; Lee, 2020). Footfall, in this regard, can provide unique classifications of town centres based on their: - Activity volumes and signature patterns throughout the years (Mumford et al., 2021). - Archetypical representation of retail-oriented mobilities in the micro-context (Philp et al., 2022). - Ability to bounce back from shocks such as Internet retailing (Singleton et al., 2016) and COVID-19 (Enoch et al., 2022).
It follows, therefore, that footfall volumes and patterns can become a useful predictor of a town centre’s potential to encourage, sustain, or abandon altogether specific amenities that fit their current temporal, rhythmic urban patterns of activity. Several studies have investigated the factors driving footfall (AbedRabbo et al., 2022; Hart et al., 2014; Philp et al., 2022; Wahlberg, 2016), identifying various types of urban ‘amenities’ as significant elements that attract people to town centres. Whereas footfall data are mostly available to larger urban areas that can afford them and tend to suffer from infrastructural limitations (particularly when using GPS sensors) (Enoch et al., 2022; Philp et al., 2022), they can accurately reflect routine rhythms and activities that are connected to places of interest (Sirenko et al., 2024). Thus, understanding what amenities are framing these patterns of activity becomes of paramount importance for town centres.
Amenities provision in town centres
The multifunctional character of town centres as places to live, shop, work, play, and commute necessitates maintaining a high level of place-specific consumer, historical, cultural, natural, and social assets that are publicly available and easily accessible, hence providing individuals with opportunities for social interaction (Öner, 2017). Amenities can be understood as town centre liveability and attractiveness factors, as their creation, provision, and maintenance are an essential prerequisite for attracting residents, firms, knowledge workers, creatives, tourists, etc. For example, the repopulation of town centres was largely assisted by a targeted provision of amenities in close proximity that satisfy utilitarian everyday needs and provide convenience, security, happiness, and a sense of location satisfaction (Mouratidis and Yiannakou, 2022).
Thus, amenities are often seen as drivers of reurbanisation that account for significant local density changes in the core and edge of centres. Furthermore, amenities concentration (including job opportunities) in multiple central locations is seen as critical for creating functional polycentricity (Wei et al., 2021) within an urban area. The 15-min city can be seen as a hub of such polycentricity, whereby the provision of relevant consumer, cultural, leisure, education, and natural amenities alongside with transport amenities such as open spaces, cycling lanes, and transport hubs can help towards a fairer access to urban life via multimodal transport patterns (Zhang et al., 2023). However, town centres that offer an amenity-rich assortment often necessitate dwellers to pay a premium in the housing market as the desirability to live in such an area is seen as a lifestyle opportunity (Comber et al., 2020). Such conditions though can have adverse consequences for poorer residents, as they are pushed out from the inner centre, and thus find themselves unable to access important amenities, including employment, a phenomenon described as the decentralisation of poverty (Zhang and Pryce, 2020).
Whereas amenities are considered static features in a location, their usage, and nature changing throughout the day, creating interesting temporal patterns within areas of interest (Graells-Garrido et al., 2023). In this regard, the diversity and availability of amenities can play a complementary role to a range of business, study, leisure, and mobility activities that can be enhanced by the digital element (e.g. working from your phone or computer from a café). The potential complementarity of digital and material activities is thus directly related to the higher availability, density, and agglomeration of amenities within central locations (Graells-Garrido et al., 2023; Macdonald et al., 2022). Moreover, provision of ecological and natural amenities within the centre can generate spillover effects in other more consumer-oriented amenities (Long and Shi, 2021). Additionally, smaller town centres need to possess a basic supply of amenities (grocery store, school, restaurant, and a durable goods retailer) to encourage residents to ‘stay local for their everyday activities’ (Elldér et al., 2022: p. 136), which contributes to more walking and cycling opportunities. Thus, generating opportunities to increase sustainable mobility and pedestrian trip generation is an overarching goal in the design and provision of desired amenities within town centres (Sevtsuk, 2021).
Research gaps
Given the significance of amenities, it is plausible that they play a crucial role in a town centre’s vitality and viability. Footfall, as a performance measure, can indicate how certain amenities can significantly enhance town centre priorities, including retail and non-retail offerings, recreational spaces, anchors, merchandising, diversity, and activities (Parker et al., 2017). Numerous studies have explored the relationship between amenities and footfall or other vitality-related factors, such as street activity intensity or town centre attractiveness (AbedRabbo et al., 2022; Han et al., 2024; Hart et al., 2014; Philp et al., 2022; Wahlberg, 2016). The types of amenities can be categorised as follows:
Retail amenities
These include shopping malls, markets, chain stores, and independent shops offering a range of merchandise and consumer goods. Retail options are often regarded as the most significant driver of footfall (Hart et al., 2014; Wahlberg, 2016).
Leisure amenities
Leisure amenities provide residents and visitors with entertainment and tourism options, such as restaurants, cafes, cinemas, parks, public spaces, tourist attractions, and hotels.
Accessibility amenities
These encompass transport infrastructure, such as public transport stations, bus stops, parking lots, and amenities that enhance walkability, such as pedestrian pathways and cycling lanes. Many studies have identified accessibility as a critical factor (Hart et al., 2014; Philp et al., 2022).
Service amenities
Essential services such as banks, post offices, and healthcare facilities are important amenities in town centres. Hart et al. (2014) found these services to be highly valued by town centre visitors.
Work amenities
Amenities that support daily work and study, including offices and educational institutions, also attract footfall from professionals and students (Han et al., 2024).
While other factors, such as the physical condition, layout, ambiance, safety, and social interactions within town centres, can influence footfall, urban amenities consistently emerge as key determinants. However, beyond the broad categories of retail and service amenities, there is limited understanding of the specific types of amenities and their impact on urban vitality, particularly as measured by footfall.
This led to our research question: ‘What amenities can help predict footfall in city/town centres in the United Kingdom?’ By addressing this gap, we aim to enhance the understanding of how specific amenities contribute to urban vitality.
To address this gap, we turn to the VGI dataset, OpenStreetMap (OSM). OSM is a global dataset that includes a wide range of amenities, making it suitable for our analysis. OSM data has been extensively used in various fields, such as humanitarian crises, city planning, geosciences, Earth observation, environmental sciences, and navigation systems (Atwal et al., 2022; Vargas-Munoz et al., 2020). Its applications include land cover/use classification, navigation plotting, detection of buildings and roads, 3D city modelling, and location-based map services (Vargas-Munoz et al., 2020). Additionally, OSM data has been employed to model and predict important socio-economic indicators of places (Feldmeyer et al., 2020) and for retail classification (Macdonald et al., 2022). However, it has not yet been used to predict footfall.
What is OpenStreetMap?
OSM is a collaborative project founded by Steve Coast in England in 2004, with the goal of creating the largest geospatial database by combining local geographic knowledge from people worldwide (Brovelli and Zamboni, 2018). The project quickly spread around the globe, eventually becoming the largest geospatial database in the world (Neis and Zielstra, 2014). One reason for its rapid growth is that the data are freely available to the public under the Creative Commons Attribution-ShareAlike 2.0 license, which allows for data use and distribution under the same license (Girres and Touya, 2010).
The three main types of geographic spatial objects available in OSM are single nodes as points of interest (POI), lines such as roads, and polygons such as certain buildings and areas. OSM data are considered valid for both direct use, such as map navigation and urban analysis, and derived use, such as the production of thematic maps (Brovelli and Zamboni, 2018).
OSM’s success is due to its Wikipedia-like production model. This collaborative model attracts a huge pool of contributors, which now number over eight million unique contributors according to the official website, and allows them to collect and generate topographic data without professional surveyors and equipment (Mooney and Minghini, 2017). This trend, also known as VGI or geographic citizen science, was made possible by the emergence of Web 2.0 and the availability of low-cost, high-quality, and high-accuracy location-based features in smartphones (Brovelli and Zamboni, 2018). Contributors are free to create their own tags for places, making OSM more responsive and flexible compared to authoritative professional datasets, especially in many parts of the world where official authoritative datasets are missing (Girres and Touya, 2010; Minghini and Frassinelli, 2019; Mooney and Minghini, 2017).
However, the main criticism of OSM is that geographic data were mainly created by citizens without formal qualifications, with only 25% of participants in a survey having professional GIS experience (Brovelli and Zamboni, 2018). The data quality on OSM is expected to be comparatively lower, and spatial conflicts in the data can only be resolved manually. Another problem is the sparsity of data, with semantic information and descriptive attributes about places being very sparsely recorded (Atwal et al., 2022). Due to the lack of standards, the information is also very heterogeneous, with high discrepancies between rural and urban areas, making comparison and analysis complicated and challenging (Atwal et al., 2022; Girres and Touya, 2010; Neis and Zielstra, 2014).
Another concern is the dynamic nature of town centres, which undergo frequent changes in retail businesses, requiring continuously updated geographic data. Although OSM may not always capture these changes immediately, it remains the most regularly and consistently updated geographic database, particularly in urban areas (Bennett, 2010; Vargas-Munoz et al., 2020), making it a suitable resource for this research.
Method
Data collection
Outcome variable
Footfall data was collected from 960 footfall counters across the United Kingdom (Figure S1 and S2 in the Supplementary Material), each with coordinates provided by MRI OnLocation (formerly Springboard). The outcome variable is the average daily footfall data for each counter during the year 2022. In 2022, the average daily footfall was recorded at 8,630.98 counts per day, indicating the number of people detected by the counter.
While footfall data provides valuable insights into urban activity, it is important to acknowledge some limitations. The data may not fully capture the diversity of urban areas across the United Kingdom, as many smaller, yet significant, locations are often not included in these datasets. Additionally, the costs associated with installing and operating footfall counters can limit their deployment, potentially affecting the comprehensiveness and representativeness of the data. These factors should be considered when drawing conclusions from the footfall data.
Predictor variables
Despite its limitations, OSM has attracted many researchers who have analysed its quality, including completeness, consistency, and accuracy. Although the quality of OSM may be lower than authoritative professional datasets due to its crowdsourced nature, it is suitable for specific purposes and user demands (Minghini and Frassinelli, 2019). We used from place features to indicate ‘amenities’ in the town centre areas. ‘Place features’ in OSM refer to various geographical and infrastructural elements that are mapped and classified within the dataset such as buildings, transport infrastructure, natural features, public services, commercial and recreational amenities, and cultural and historical sites.
One of the advantages of the OSM dataset is the highly accurate data available in the populated areas of cities (Brovelli and Zamboni, 2018). Our study focuses on the populated town/city centres of the United Kingdom, making OSM data suitable due to the relatively rich data available in the populated urban areas. Brovelli and Zamboni (2018) also found that the completeness of geographic objects improves with their size. Consequently, this study utilises polygon data of OSM place features and their corresponding land use areas (measured in m2) to predict footfall, as these are more comprehensive than simple point-of-interest (POI) counts. The decision to use size rather than counts is based on the understanding that the size of amenities, such as retail centres, plays a crucial role in attracting people, as these larger spaces offer not only functional transactions but also diverse and comprehensive experiences (Jones and Livingstone, 2018).
To collect the necessary data, a 400-m radius (approximately a quarter mile) was established for all 960 counters, following the buffering method recommended by Song and Knaap (2007). This approach was chosen over using the actual parameters of classified town centre areas because many areas contain multiple counters, making it unsuitable to use the same predictive variables for different outcome variables. Additionally, the varying sizes and shapes of retail centres in the United Kingdom 1 lead to inconsistencies in predictive variables. By focussing on circular buffer areas, this study ensures consistency and provides a foundation for future research.
A review of the literature identified a radius range of 300 to 600 m as appropriate (Schläpfer et al., 2015). A 400-m radius was chosen because it aligns with a 5-min walking distance and is optimal for transit ridership (Guerra et al., 2012; Pongprasert and Kubota, 2017). This radius is also sufficient for capturing built environmental characteristics (Townsend and Zacharias, 2010). Using the ‘osmdata’ package in R, we then gathered all place features within each counter area, defined as the circular area with a 400-m radius from the counter coordinates.
The data from OpenStreetMap were screened with primary features (https://wiki.openstreetmap.org/wiki/Map_features). User-generated categories that do not belong to the primary features were not selected. In total, 222,288 unique polygonal areas were collected. Some primary features that do not appear in the dataset or are not in polygonal format were not included (such as routes). Twenty-five primary features were included. Some polygons are in more than one primary feature. Those polygons were assigned based on primary features that are more specific than features that are broader. The authors set the order as follows: retail and amenities primary features (craft, shop, amenity, and healthcare), leisure and tourism features (sport, historic, tourism, and leisure), artefacts (barrier, man-made, public transport, and telecom), large establishments (emergency, military, power, and aeroway), buildings (office and building), and areas and infrastructure (boundary, highway, waterway, water, place, natural, and land use). An example of the counter area in Manchester can be found in Figure 1. OpenStreetMap place features in a counter area of Manchester.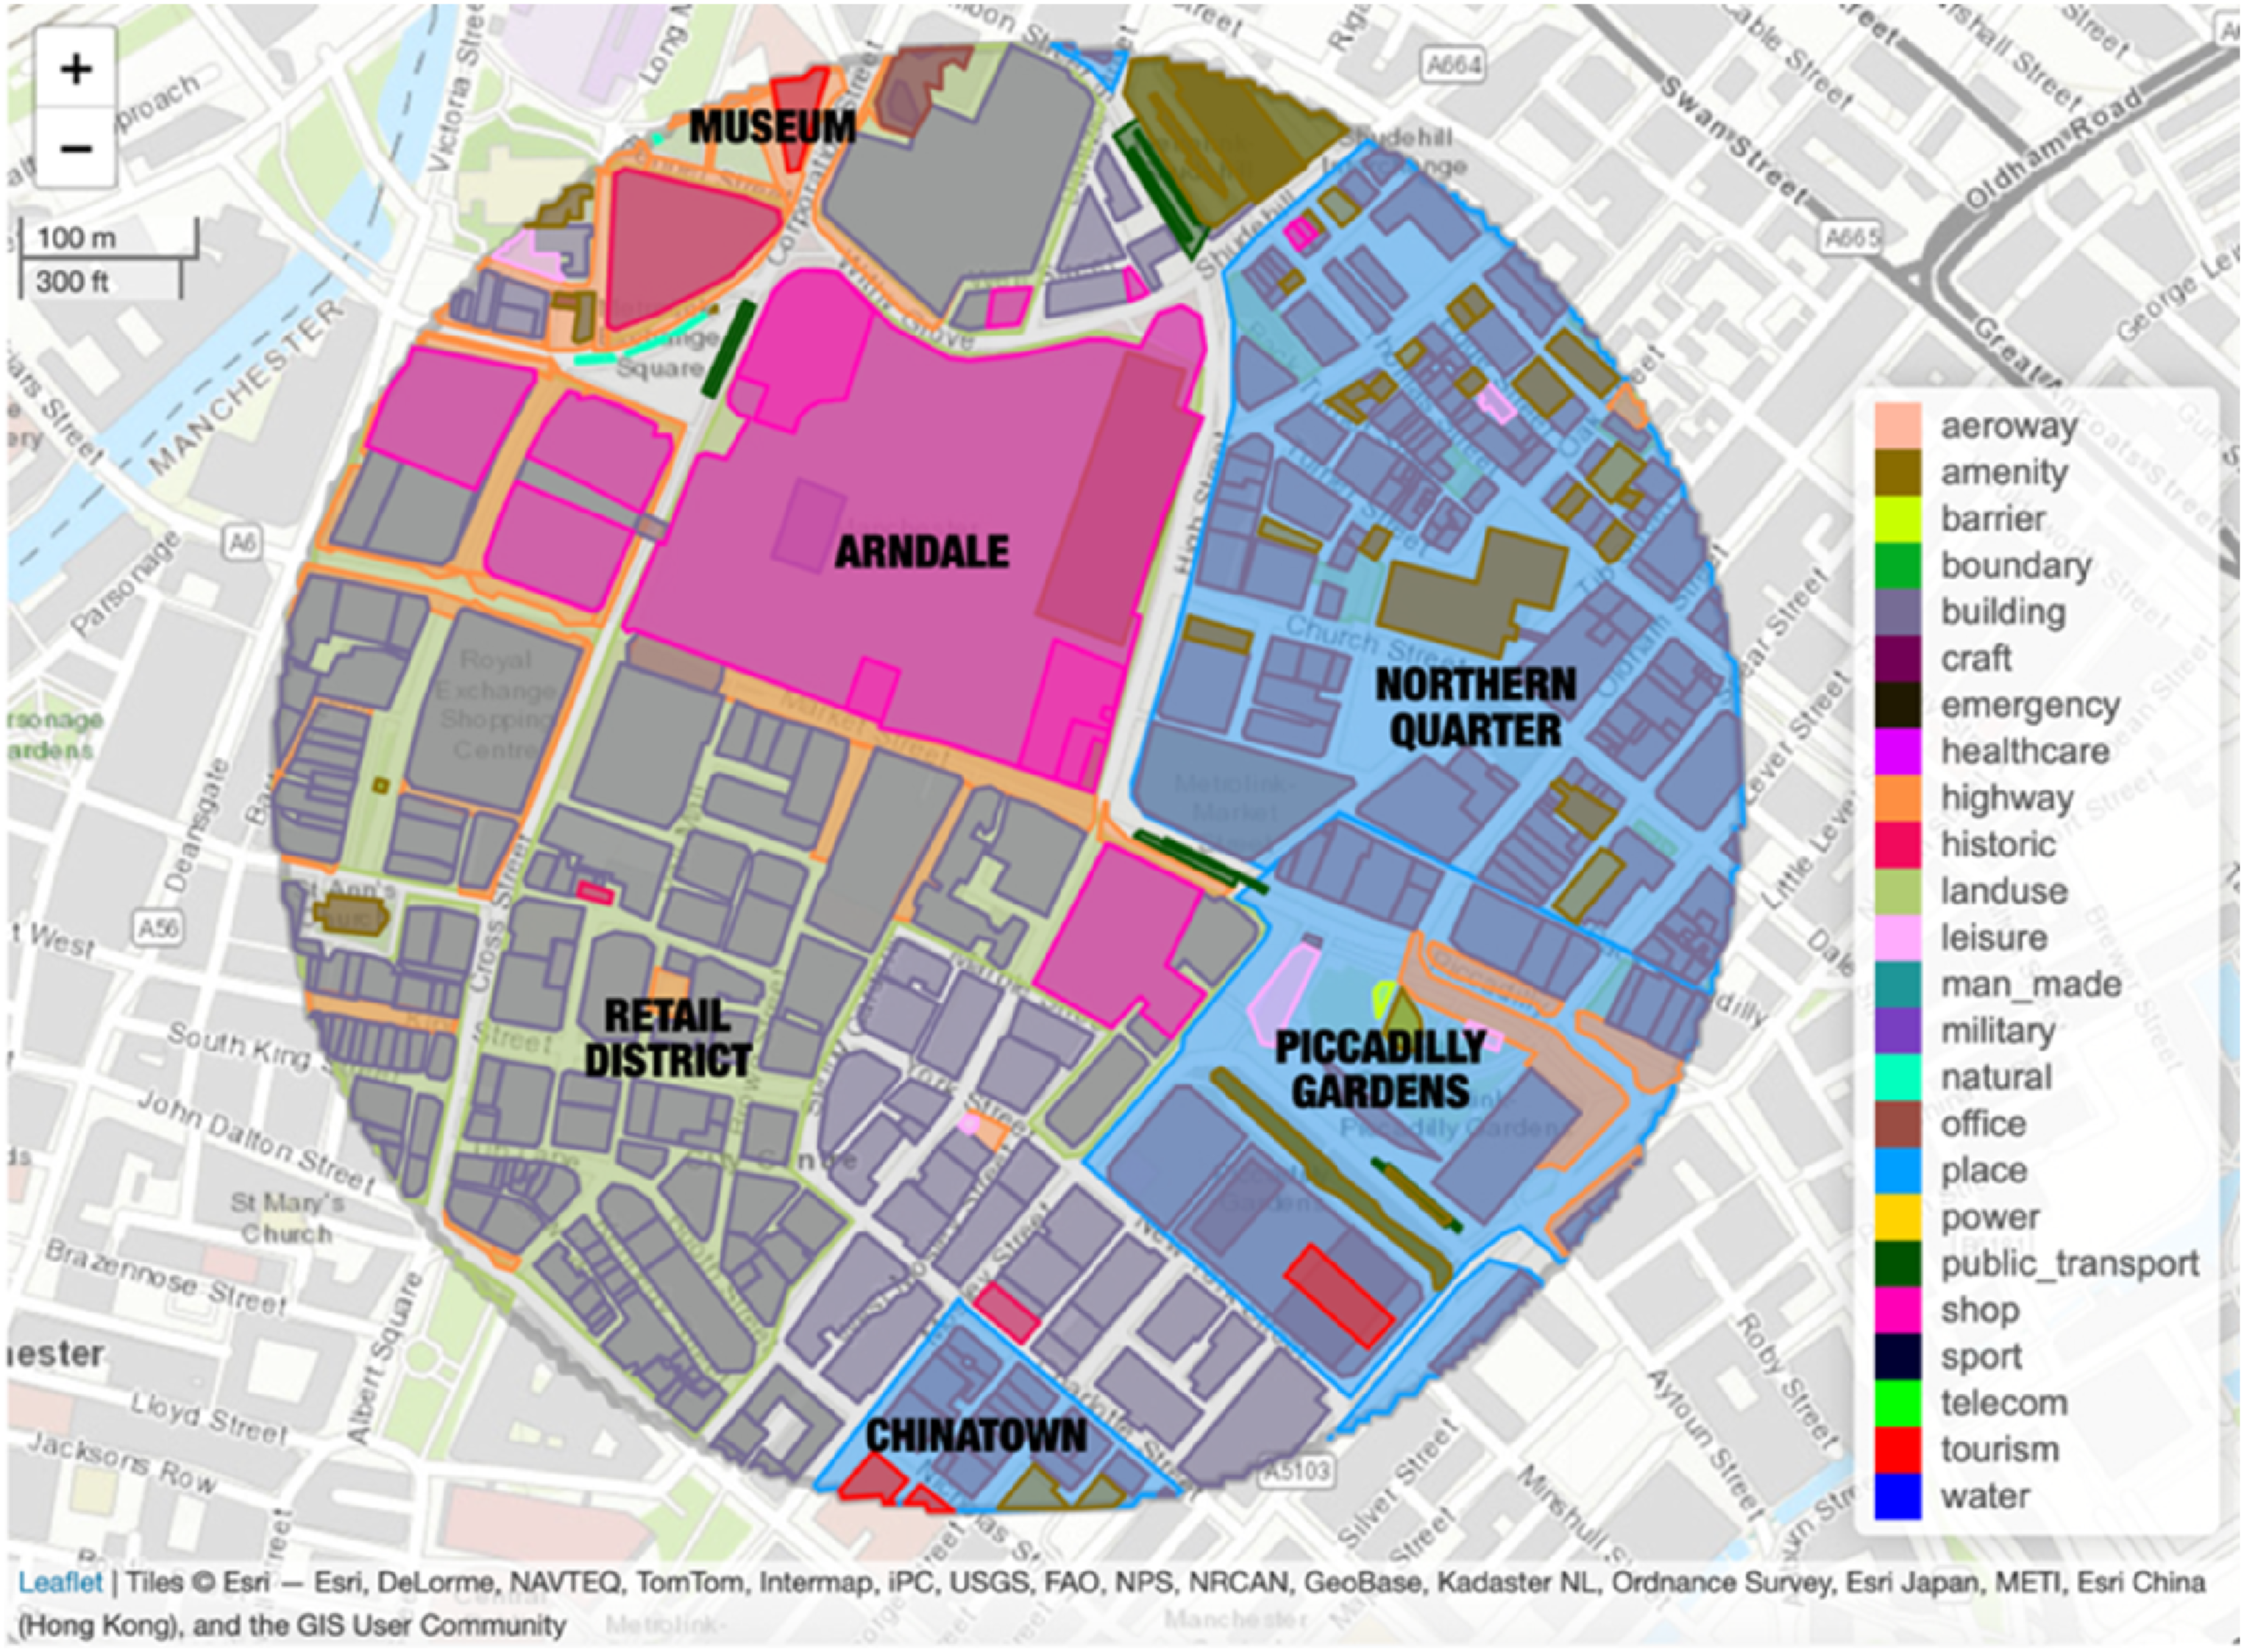
Figure 1 illustrates a counter area in the city centre of Manchester. The bright pink area indicates the shops (primary features are italicised) in the top-left (Manchester Arndale). The left side of the area with large, green-shaded polygons denotes the retail land use, while the blue-shaded area on the right side (Northern Quarter and Chinatown) is the named neighbourhoods (place). This area also has several buildings (grey) and urban amenities (olive green), such as a car park in Northern Quarter. There are also a few tourism sites (red), such as the National Football Museum and a few hotels, and some leisure spots (light pink), such as Piccadilly Gardens.
In OSM, each primary feature includes a variety of secondary features. For example, under the primary feature ‘amenity’, secondary features such as cafe, restaurant, and parking can be found. Similarly, the primary feature ‘shops’ includes secondary features like clothes, beauty, and shoes, among others. It is important to note that there were originally 1,370 secondary features across 25 primary features, but only a select few passed the screening process to become meaningful predictor variables.
To identify these meaningful secondary features, we used a two-step screening process. First, secondary features that appeared in fewer than 10% of the counters were combined as a unified primary feature. The second step involved calculating the variance of areas for each remaining secondary variable. Secondary features with near-zero variance, ones with less than 10% of unique values relative to the number of samples and a 95/5 frequency ratio of the most common value to the frequency of the second most common value, were excluded and thus combined as unified primary variables. This process resulted in 132 predictor variables, termed ‘place features’, consisting of 18 primary features and 114 secondary features. The total area of these combined features in each counter area was used as independent variables in the model.
Modelling using machine learning
Due to the heterogenous nature of OSM data, we used machine learning techniques to predict footfall. Compared to traditional linear modelling approaches, machine learning algorithms can explore multilevel factor interactions and detect non-linear associations (Han et al., 2024). These algorithms are also more flexible, with fewer statistical assumptions and no requirements on data distribution (Taecharungroj, 2021). One widely used machine learning technique is random forest (RF) modelling. RF is a tree-based bagging algorithm known for its effectiveness and robustness (Feldmeyer et al., 2020). It integrates many decision trees into a forest and provides a prediction based on a majority vote. RF can efficiently analyse large datasets with many input factors, handle missing and categorical variables, manage unequal distribution, and detect interactions and non-linear relationships without the need for detailed specifications (Taecharungroj, 2021). Therefore, in this study, we employ the RF algorithm to answer the research questions.
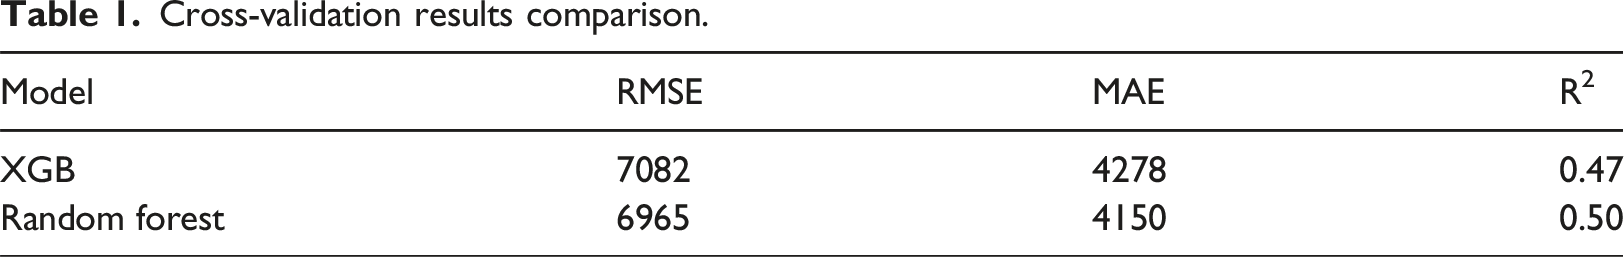
The first step in creating a model that predicts average daily footfall was to split the dataset of 960 counters into training and test sets. The train/test ratio was set at 80:20. The footfall variable was separated into five strata to ensure that the train and test sets included all quintiles of footfall. To determine the best tree-based algorithm, we compare RF with another tree-based eXtreme Gradient Boosting (XGB) model. Five-fold cross-validation was repeated 10 times on the training set to produce average performance metrics, including root mean square error (RMSE), mean absolute error (MAE), and R-squared (R2).
Cross-validation results comparison.
To answer the research question, we utilised two techniques, namely, relative importance and accumulated local effect (ALE) plots of place features. The relative importance technique was employed to determine which place feature is the most significant predictor of footfall. The ALE plot method was employed to depict the impact of a specific feature on the predicted results, taking into account the local relationship between the feature and the outcome. These plots are crucial for detecting the non-linear influences of place features on average footfall.
Findings
Random forest results – Importance of amenities on predicting footfall
The relative importance of place features in OpenStreetMap is depicted in Figure 2. The important values were obtained by measuring the total decrease of node impurities resulting from splitting on the predictor variable, as indicated by the residual sum of squares. These values were then scaled to 100. Relative importance of place features on footfall.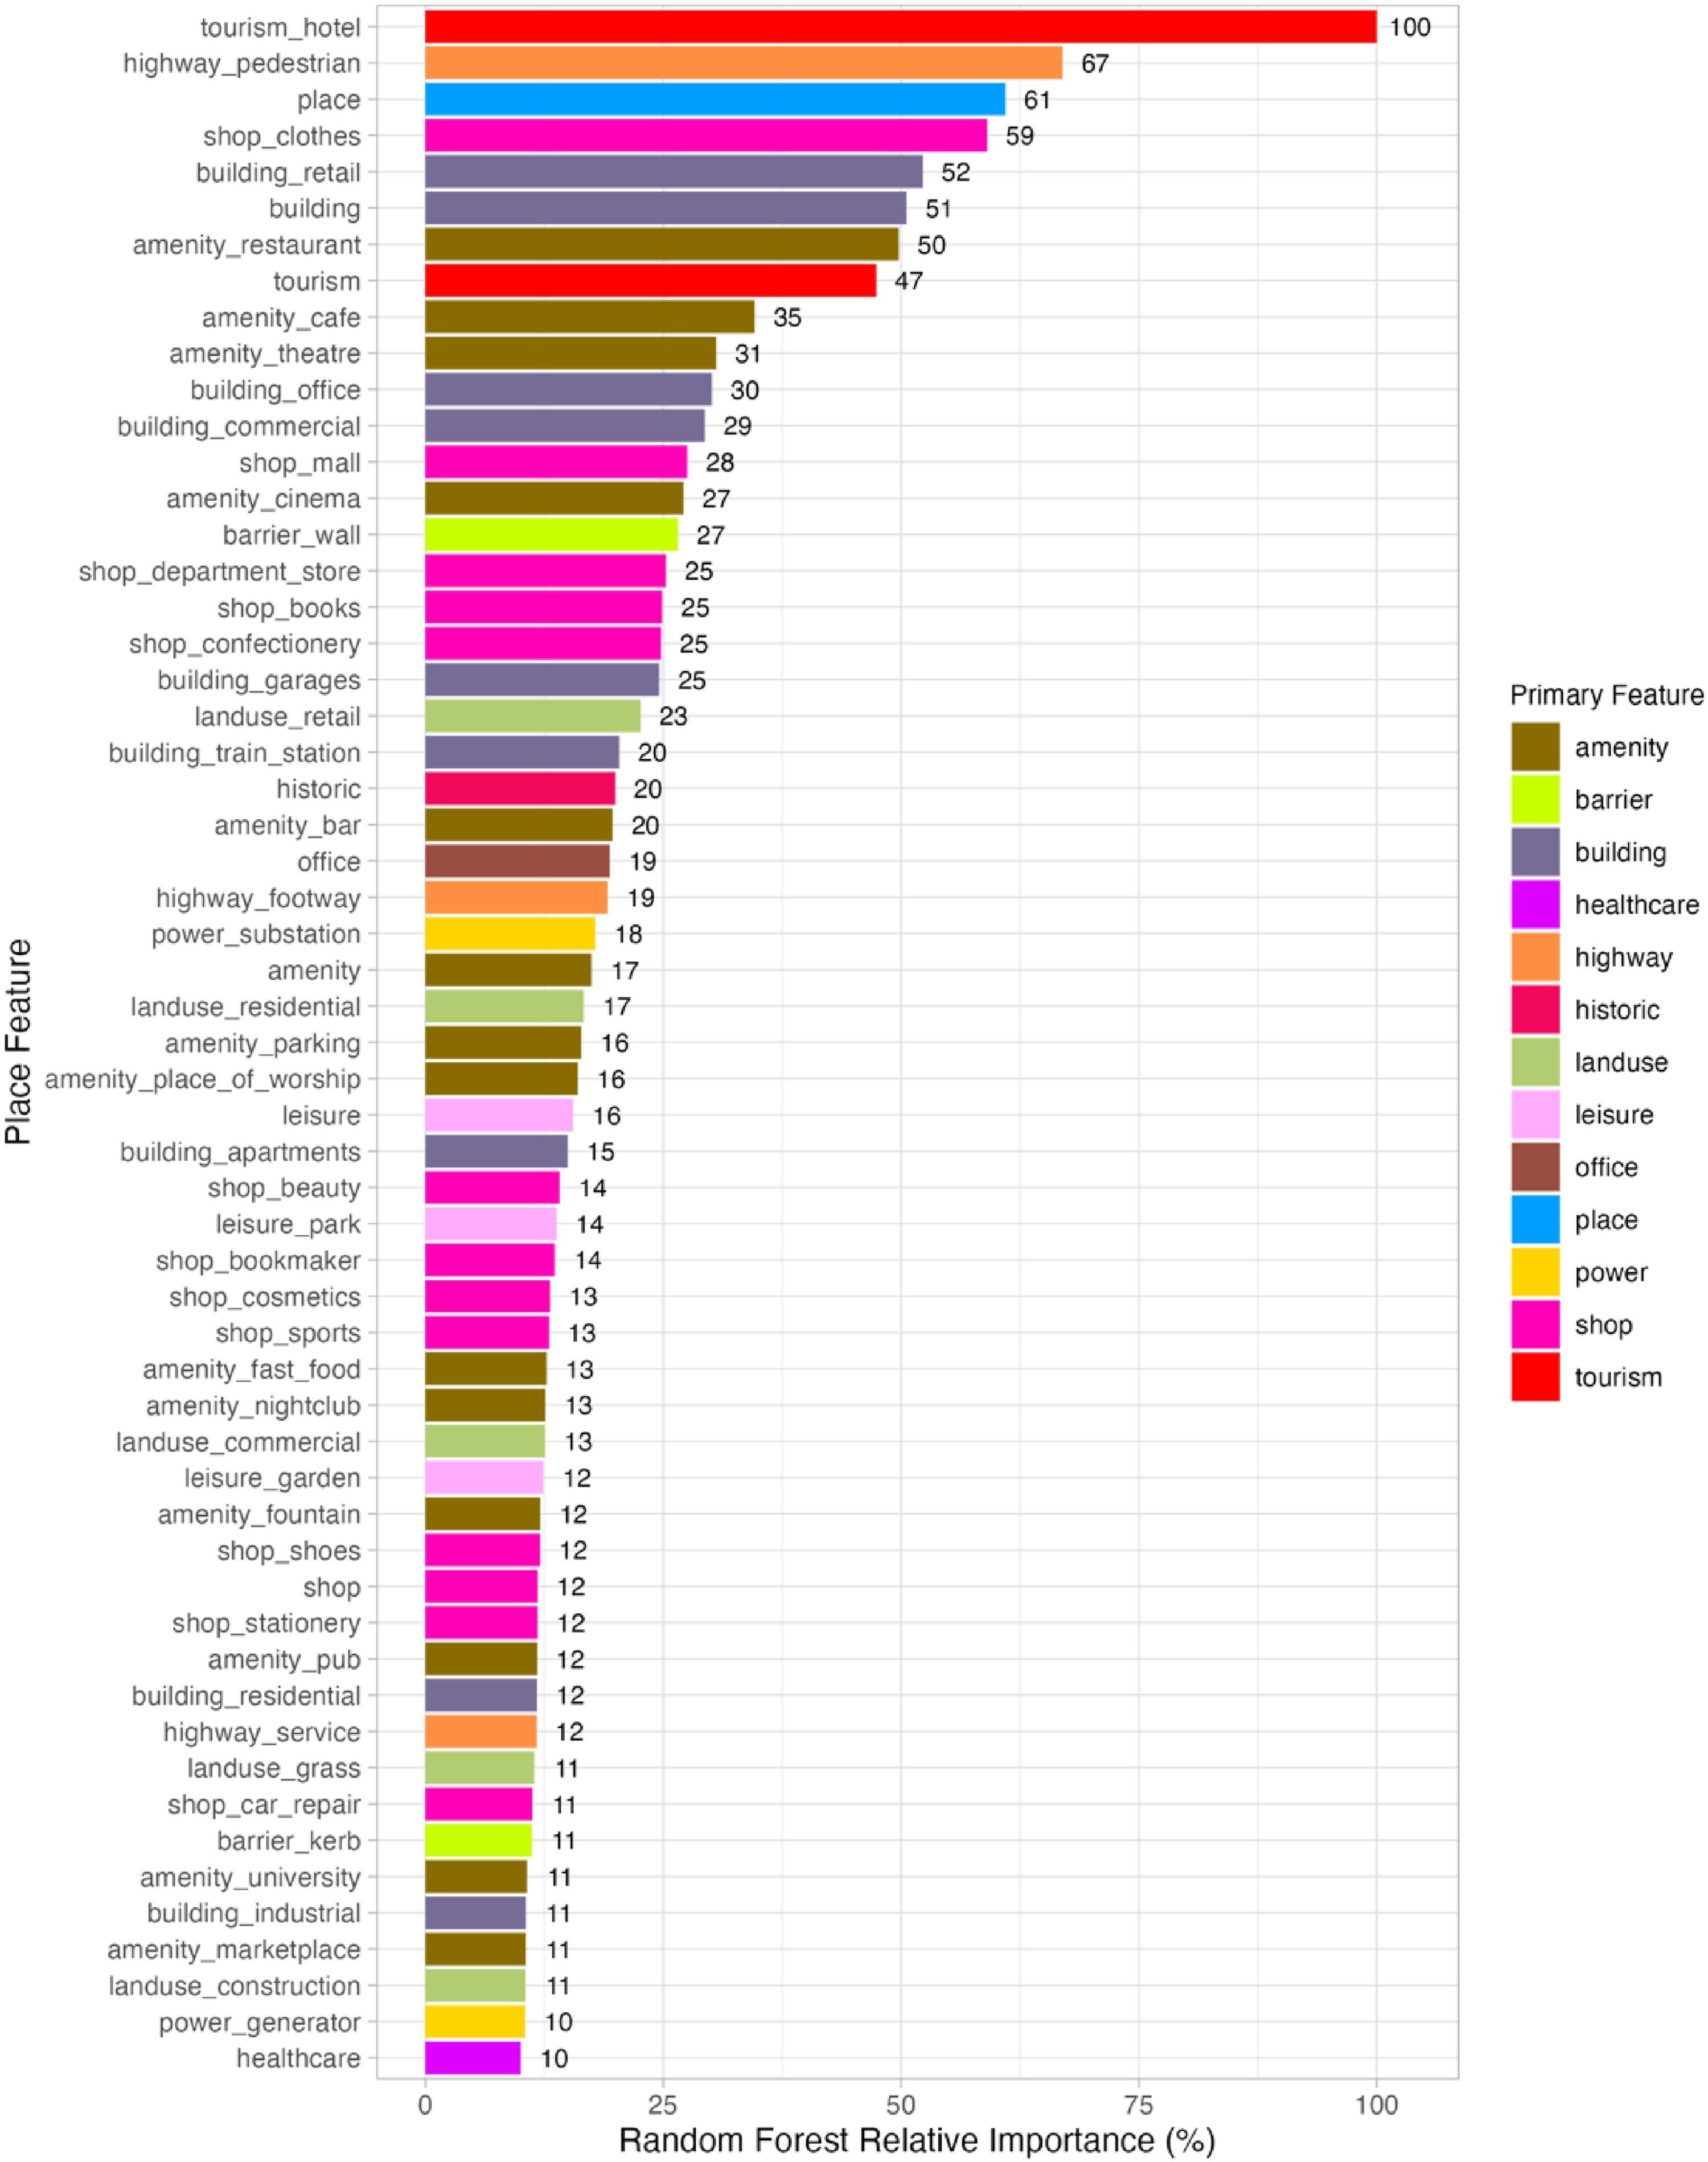
Figure 2 displays the relative importance of place features in predicting footfall of town centres based on their combined area sizes in m2 in OpenStreetMap. It is evident from the figure that hotels (tourism) are the most important predictor of footfall in the area (100%) followed by pedestrian ways (67%). Pedestrian ways are tagged as ‘pedestrian’ in the ‘highway’ primary feature and are described by the OpenStreetMap website as ‘a road or an area mainly or exclusively for pedestrians in which some vehicle traffic may be authorised’ 2 . Two areas with the largest combined areas of tourism and pedestrian ways can be found in the Figure S3 Supplementary Material.
The third most important place feature in predicting footfall is ‘place’, which includes suburban, town, neighbourhood, locality, and square areas (61%). This feature is used in OSM to indicate that a particular location is known by a particular name, both for significant settlements and notable unpopulated, named places 3 .
Retail amenities also rank highly in the model, with clothing stores taking the fourth place (59%), followed by overall retail buildings (52%). From seventh to twentieth places, with relative importance higher than 20%, the most significant features are mostly related to retail, leisure, and commercial activities, such as restaurants (50%), cafes (35%), malls (28%), cinemas (27%), and bookstores (25%). Some other notable land use features with high relative importance are walls (27%) and garages (25%). However, certain primary features, such as sport, natural, craft, man-made, public transport, and telecom, have relative importance lower than 10%.
ALE plots – relationships between amenities and footfall
The results from the ALE plots provide insightful relationships between place features and footfall within the counter areas. One notable finding, as illustrated in Figure 3, is the significant influence hotels have on predicted footfall. The ALE plot for hotels displays a marked ‘hockey stick’ shape, indicating that when the total area occupied by hotels exceeds approximately 18,000 sqm, there is a substantial surge in predicted footfall. Conversely, smaller combined hotel areas do not significantly affect footfall, highlighting a critical threshold for impactful influence. ALE plot for hotels, with area in m2 as the predictor variable.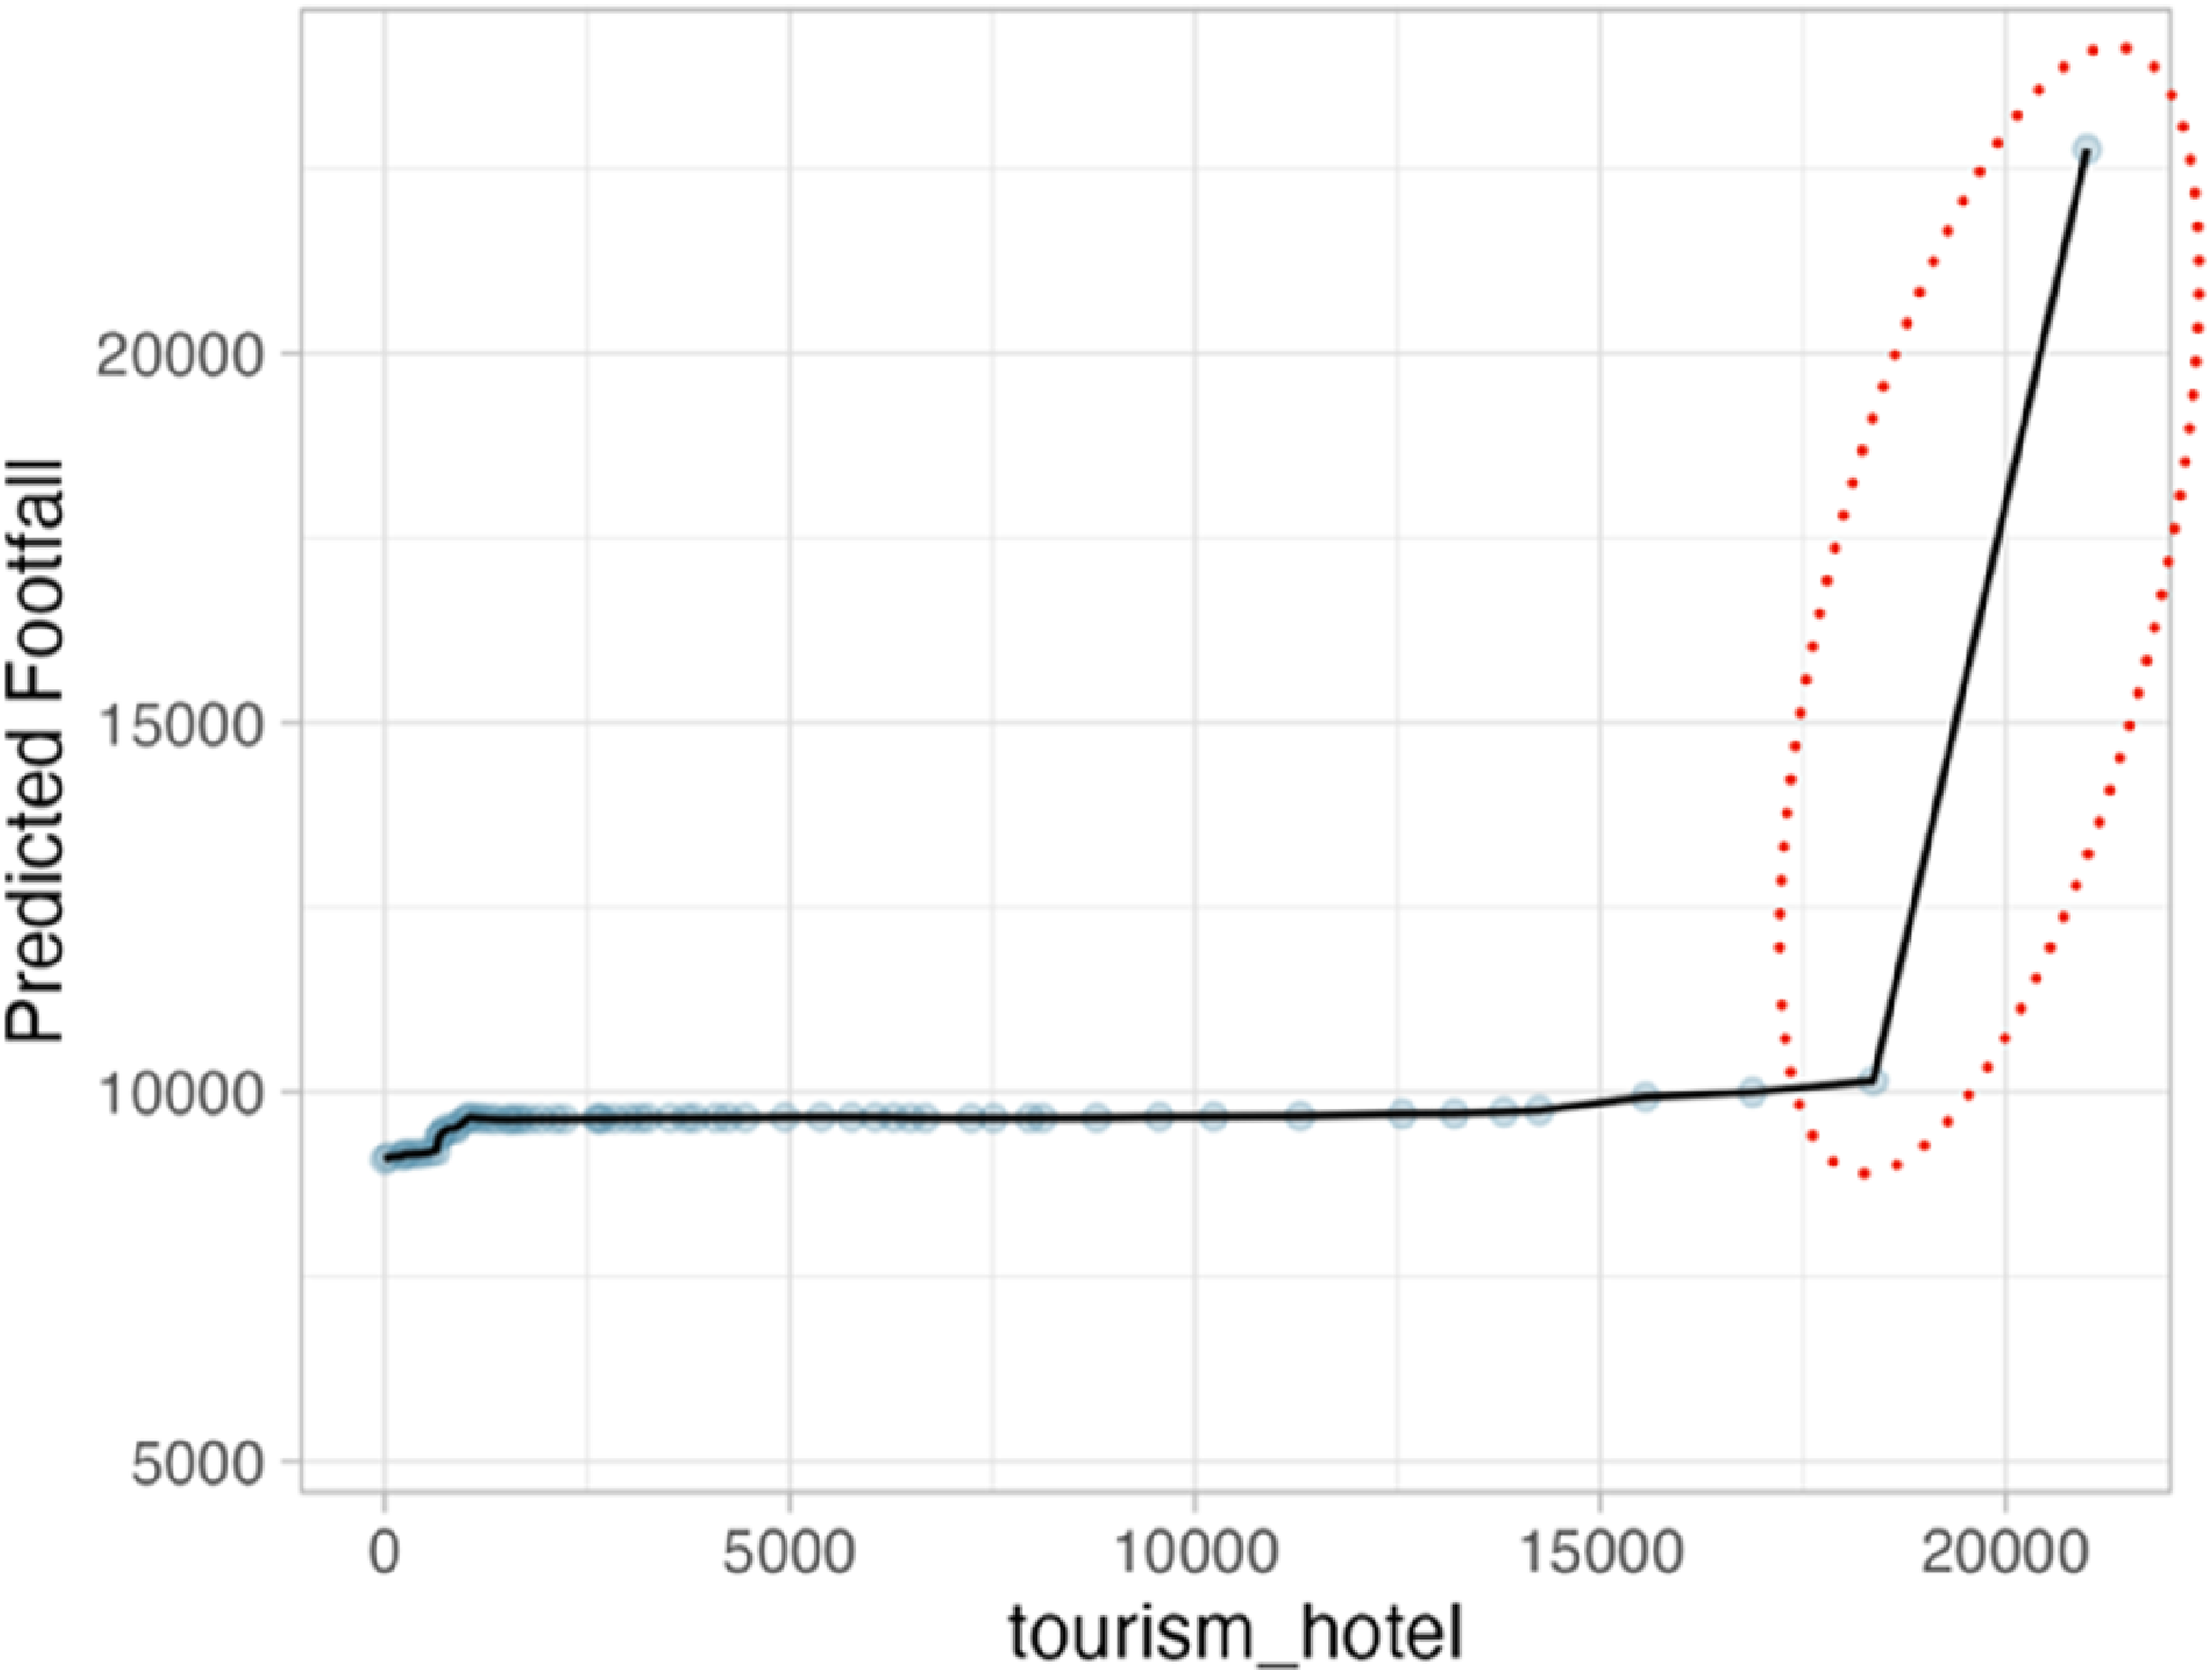
Figure 4 further elaborates on the diverse relationships between various place features and footfall, with findings ranging from linear to non-linear associations. While certain features like general buildings, theatres, and malls show a relatively straightforward linear relationship, other features exhibit more complex patterns. Across these plots, a recurring theme is the identification of ‘inflection points’ – specific feature sizes where there is a discernible jump in footfall, such as 18,000 sqm for hotels, 19,000 sqm for pedestrian ways, and 1,100 sqm for clothing shops. These points, identified and circled in dotted red lines on the plots, represent critical thresholds beyond which the presence of the feature significantly boosts predicted footfall. ALE plots for 2nd to 26th most important place features.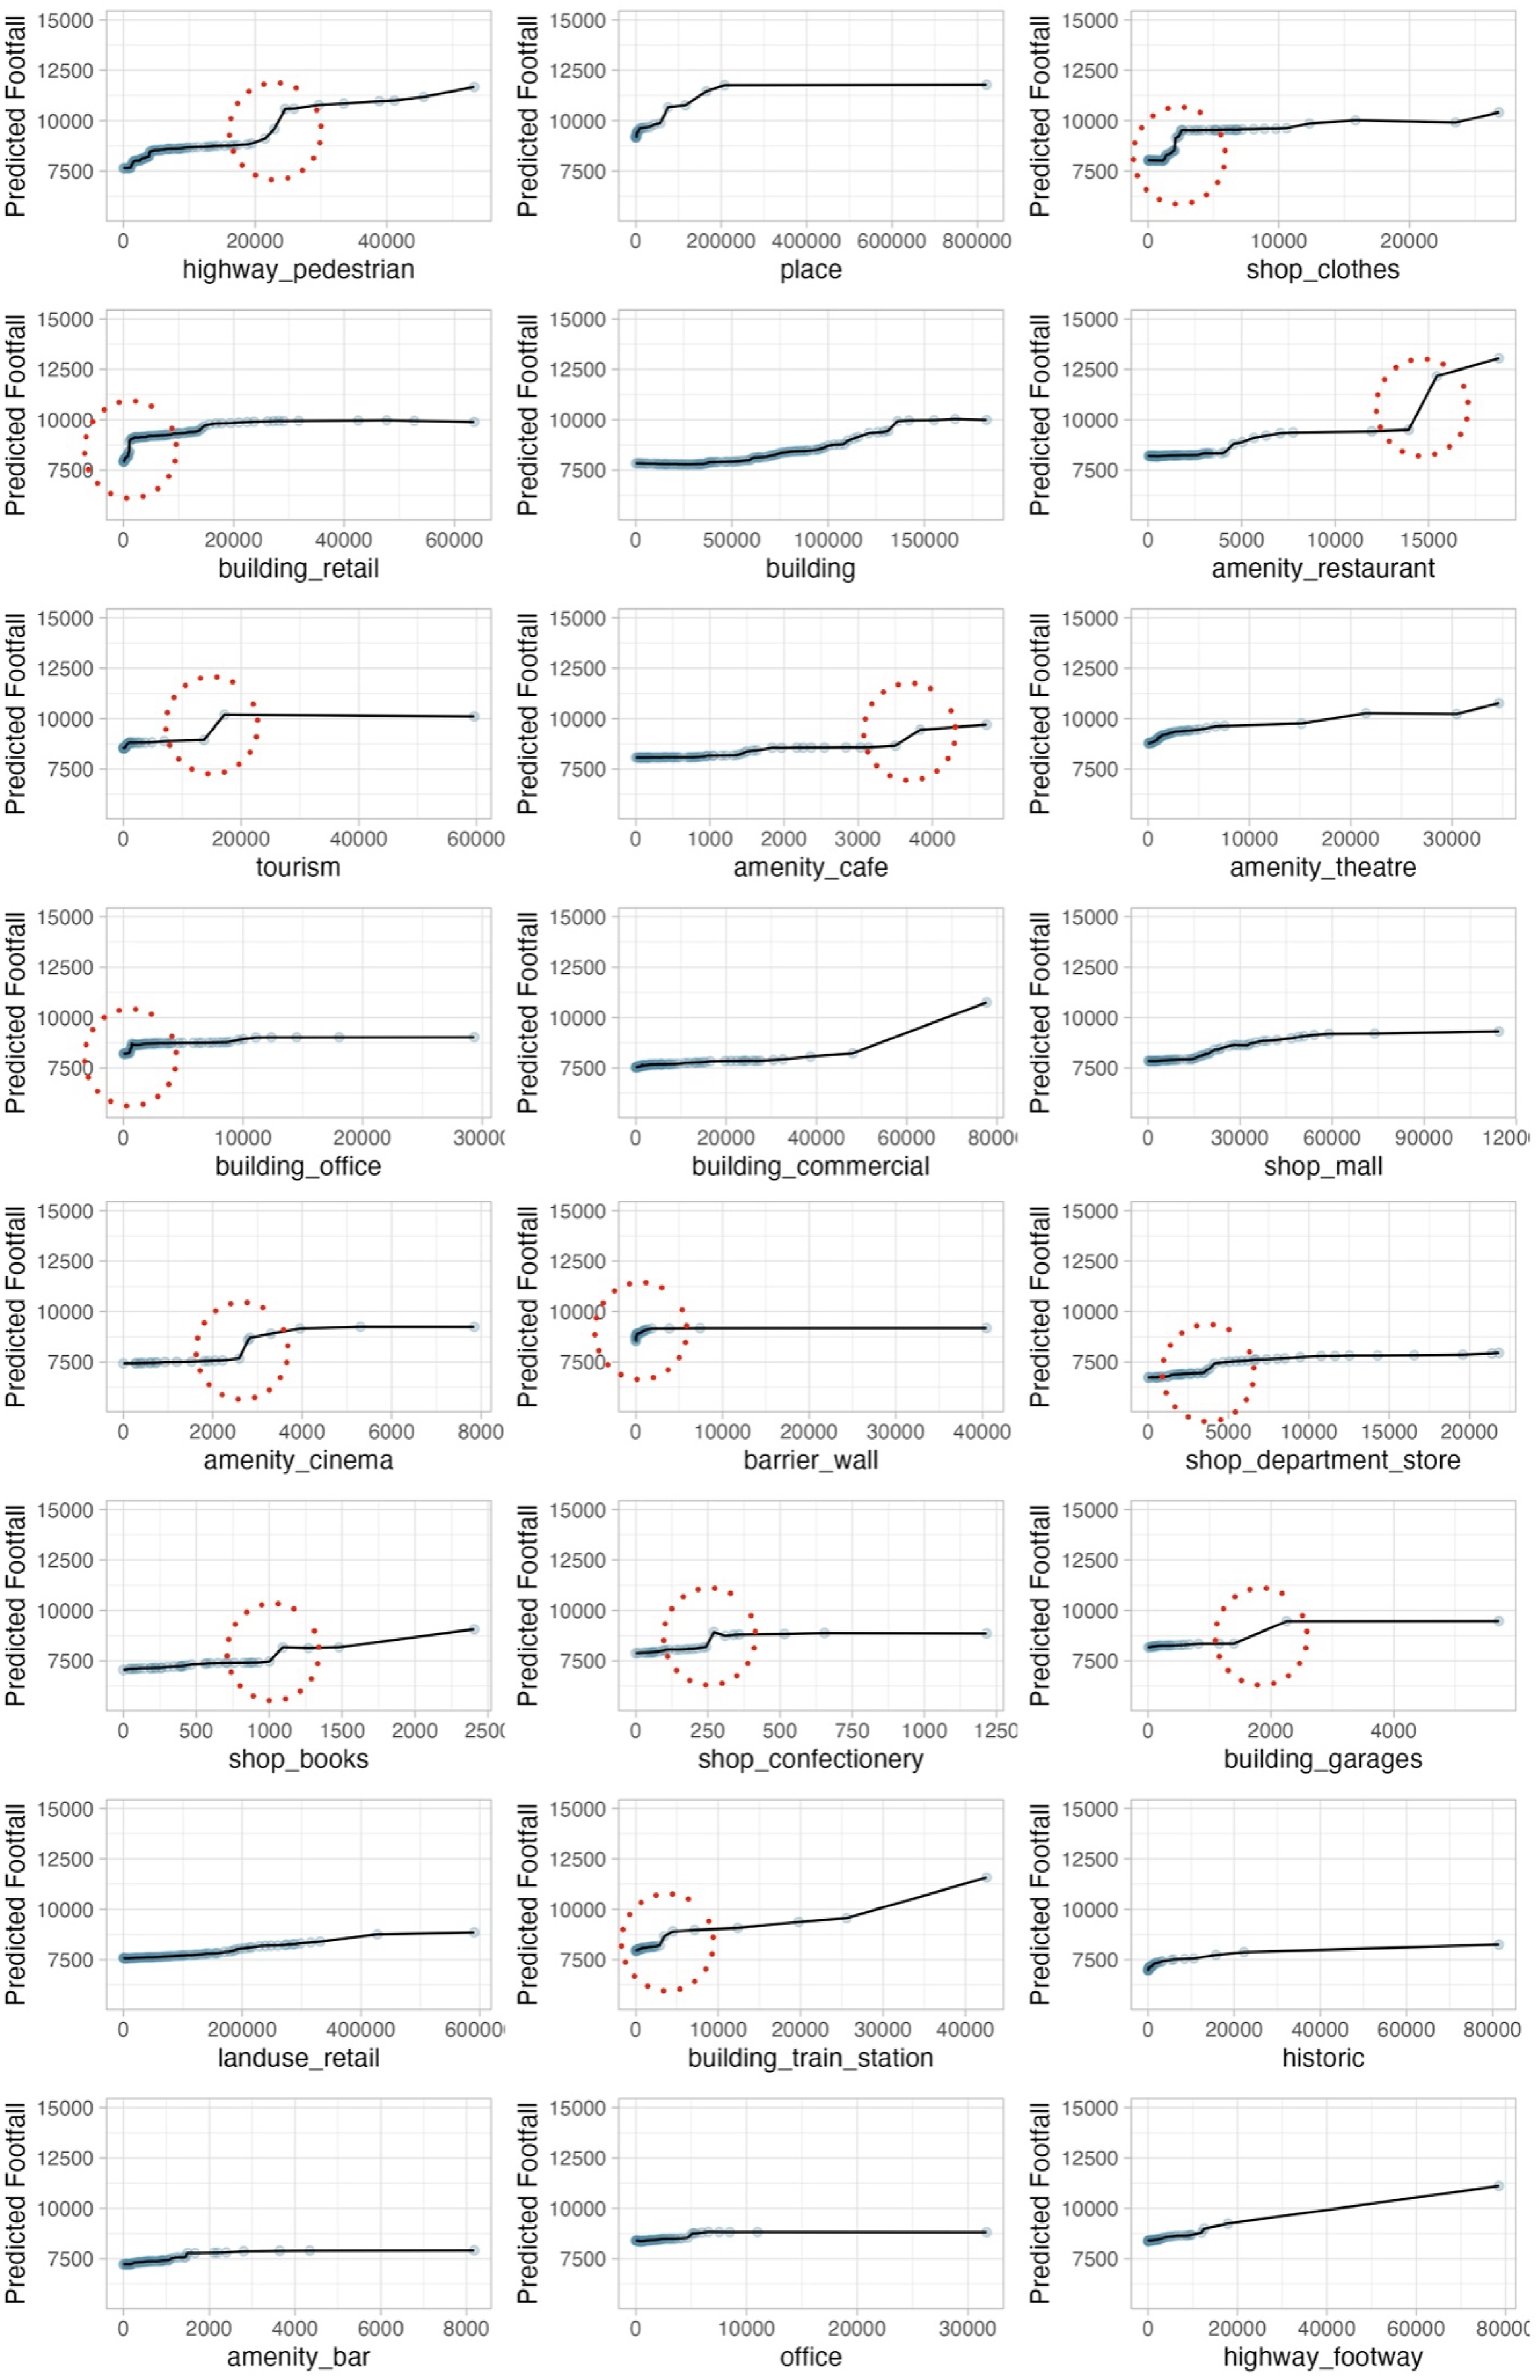
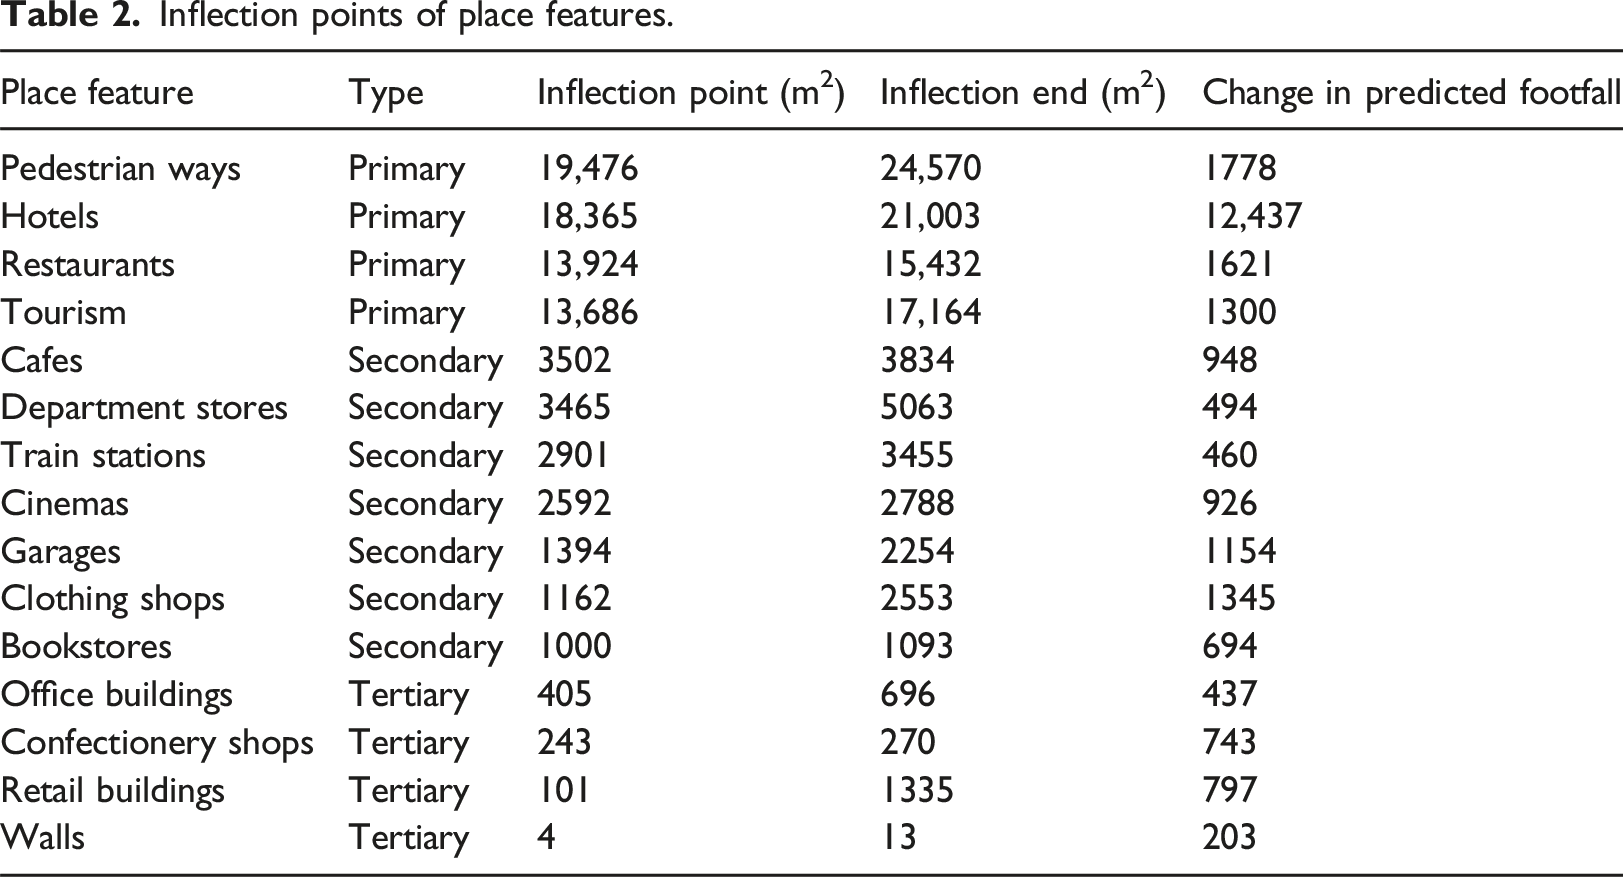
To systematically capture these dynamics, Table 2 summarises the inflection points across 15 place features, detailing the critical sizes that lead to increases in footfall and categorising these features into three levels of scale and impact: 1. 2. 3. Inflection points of place features.
Discussions and conclusion
In addressing the research question, ‘What amenities can help predict footfall in city/town centres in the United Kingdom?’, our random forest modelling results demonstrate that amenities, represented as OpenStreetMap (OSM) place features, significantly predict footfall in UK town centres, explaining 67% of the variance in the testing set (R2 = 0.67). The relative importance analysis reveals that the top 10 place features contributing to footfall predictions are hotels, pedestrian ways, named places, clothing shops, retail buildings, general buildings, restaurants, tourism sites, cafes, and theatres, each with a relative importance higher than 30%. Unlike the study by Han et al. (2024), which focused on a limited set of functional factors, our research utilised a comprehensive set of 132 place features, providing a broader and more detailed understanding of the relationship between amenities and urban vitality.
Further analysis using ALE plots confirms the non-linear relationships between these amenities and footfall, as well as identifying thresholds that define the boundaries of these effects. Notably, our study highlights ‘inflection points’, where predicted footfall surges once the size of amenities reaches a certain level. This categorisation of place features into primary-, secondary-, and tertiary-scale amenities provides a comprehensive understanding of their impact on urban vitality, while further showcasing the multidimensionality of town centre performance (Ballantyne et al., 2022; Parker et al., 2017) with regards to improving a centre’s functional, structural, and social amenities.
Primary scale amenities, such as hotels, pedestrian ways, restaurants, and tourism sites, offer large-scale experiential non-retail attractions (Parker et al., 2017) that predict significant footfall. However, the influence of hotels on footfall is notable only at extreme densities, exceeding 20,000 m2, as seen in metropolitan centres like the counter areas near Leicester Square in London, which also record the highest daily footfall. Below this threshold, hotels do not significantly increase footfall, suggesting that while hotels are strong predictors in high-density areas, they may not be as effective elsewhere. In contrast, pedestrian ways and restaurants, despite having inflection points at higher levels, demonstrate a more consistent positive relationship with predicted footfall across various contexts. These amenities may therefore serve as better indicators for towns and cities of different scales.
Secondary-scale amenities, including clothing shops, cafes, cinemas, department stores, and bookstores, contribute to the diversity of the town centre and are termed ‘vibrant amenities’ in a study by Taecharungroj and Millington (2022). These amenities need to be present at a sufficient level (between 1,000 and 5,000 sqm.) to notice a significant increase in footfall. Tertiary-scale amenities, while not as impactful on footfall individually, should still be present to support the overall urban environment. These include office and retail buildings, confectionery shops, and structural features like walls. Ensuring a balanced presence of these amenities can help maintain a steady flow of visitors and contribute to the overall vitality of town centres.
The importance of secondary and tertiary-scale amenities is evident in their role in explaining the ‘dead mall syndrome’ in the United Kingdom. Historically, purpose-built shopping malls were designed to attract hedonic shoppers and revitalise city centres. However, many of these malls are now struggling to survive and are adapting to current trends (White et al., 2023). Notably, while shopping malls – the primary focus of ‘dead mall syndrome’ – exhibit a gradual positive correlation with predicted footfall, this relationship is ‘bounded’. Specifically, beyond 60,000 m2 of retail space, there is no observed improvement in predicted footfall. These findings highlight the significant yet limited impact of retail space. Although large malls can effectively attract visitors to town centres (Jones and Livingstone, 2018), the evidence suggests that bigger is not always better.
These findings also correspond with recent trends in which vacant retail spaces in shopping malls are being repurposed to enhance connectivity with town centre areas and replace traditional retail offerings with leisure and entertainment options (White et al., 2023). The research supports these new practices in the town centre, where integrating shopping malls with open-air areas enhances pedestrian accessibility, leading to higher predicted footfall. The emphasis on leisure and entertainment, reflected in the addition of amenities such as restaurants, cafes, and theatres – associated with higher footfall in ALE plots – may contribute to the revitalisation of declining town centres.
Research implications
Volunteered geographic information partially predicts footfall
This research is an original study that explores the use of VGI from OSM to predict footfall in town centres across the United Kingdom. The study reveals that despite some errors, with a mean absolute error of approximately 4000, the model produces a reliable R2 value of 67%. This indicates that the model has good predictive power and provides valuable insights into the relationship between VGI and footfall. The findings of this research open new avenues to explore the potential of VGI from OSM to analyse and predict other desirable outcome variables of cities and places, such as traffic patterns, pedestrian movements, and consumer behaviours. Moreover, the study further highlights the analytical potential of footfall as a measure of attractiveness (Mumford et al., 2021).
Diversity of amenities drives footfall
This study addresses the research gap concerning the comprehensive impact of amenities on urban vitality. The results of this study demonstrate that footfall in urban areas is driven by the diversity of place features, rather than a single or a few features alone, echoing the findings by Taecharungroj (2021). The relative importance of the random forest model and the subsequent ALE plots reveal that the predictive power of any single place feature is limited. For instance, despite having the highest relative importance, hotels alone cannot significantly increase footfall especially at the low levels. Instead, a combination of diverse place features is required to generate high footfall. This highlights the importance of a comprehensive and multi-faceted approach to urban planning and development that incorporates a variety of place features to create attractive and vibrant urban spaces.
Inflection points that boost urban vitality
Previous research by Parker et al. (2017) suggested that the availability and diversity of amenities can revitalise UK town centres, but it lacked detailed exploration and quantification of these effects. This study used RF modelling to identify important features and their relationship with footfall. Confirming non-linear relationships Han et al. (2024), the ALE plots revealed ‘inflection points’ that differentiate amenities based on their scale and impact. The findings indicate that some amenities, termed tertiary-scale amenities, need only to be present to affect footfall. However, other primary- and secondary-scale amenities require significant size to trigger an increase in footfall in town centres. These inflection points can serve as benchmarks for urban planning and development.
Practical implications
Our study is conducive to present discussions surrounding the future of town centres in the United Kingdom, and how they can become more resilient and attractive. By using footfall and its relationship with place amenities as an indicator of a place’s adaptive resilience (Enoch et al., 2022), our findings show the potential for town centres to accommodate a variety of uses beyond retail (Dolega et al., 2021) in absolute terms. Additionally, our findings can be used as a baseline for scenario planning to start visioning the ideal town centre, and how potential mixed uses and amenities can be better adapted to each place’s local conditions (Ibert et al., 2022). In this regard, our classification of place features can be a useful tool to spatial planners who are willing to ‘develop a culture of strategic improvisation’ conditions (Ibert et al., 2022: p. 7), as well as to place managers who wish to assess the relative impact of certain place amenities in their search to maintain a certain level of diversity in their town centres (Taecharungroj and Millington, 2022). Finally, understanding the relative importance of place features in conjunction with the relationship between function and scale (Ballantyne et al., 2022) in the town centre ecosystem allows for a better appreciation of the businesses, services, and amenities that may be needed in places. The potential for footfall to highlight how places are used (Mumford et al., 2021) in the context of place amenities can thus empower local people and communities to have a say in redesigning their town centres (Grimsey et al., 2020), and potentially contribute to their sustainability.
Conclusion and limitations
In this study, we provide an exploratory approach for predicting fluctuations in footfall, by measuring the relative importance of place features and amenities in UK town centres. In our analysis, we further accentuate the value of increased diversity of uses in the existing town centre environment and the relative impact of certain amenities on town centre vitality. Whereas the study is a first step towards assessing the importance of amenities in an urban context, it is not without its limitations. Firstly, we wish to caution researchers undertaking similar work on the overemphasis of certain sectors over others as a measure of attractiveness. Broxterman and Kuang (2019) warn about such emphasis in a similar work where they estimate a preference index for amenities based on travel demand, and our findings also highlight an overemphasis on tourism development as a major proxy for an increase in footfall. These effects raise concerns over subjectivity and skewness of the data set, as visitors will be attracted to walk to locations with special traits (Carlino and Saiz, 2019) and also add information about them in OSM. Secondly, the analysis did not consider additional factors beyond amenities, such as the variety of retail centres (Philp et al., 2022), weather conditions (Rose and Dolega, 2022), and intangible elements like atmosphere (AbedRabbo et al., 2022), which have also been identified as influencing footfall. Thirdly, the data used in this study presents another limitation. While the research outlines many limitations associated with OSM, additional constraints arise from the use of a 400-m radius buffer as the most suitable method (Song and Knaap, 2007). Although this method is convenient and standardised, more refined techniques for creating the camera area could provide greater accuracy, albeit with increased complexity. Fourthly, the dependent variable, footfall, is contingent upon the presence of footfall counters. Consequently, significant urban areas without these counters were excluded from the study, which could affect the comprehensiveness of the findings. This limitation indicates the need for caution in generalising the results, as they may not fully represent all relevant urban areas. Finally, the feature selection for modelling in this study was based on data induction guided by previous studies. Other studies might select different features for modelling, which could lead to varying results. Furthermore, the modelling approach used in this research is just one of many techniques that can address the research problem. Future research could benefit from exploring alternative techniques and datasets to enhance the understanding of the topic.
Supplemental Material
Supplemental Material - What amenities drive footfall in UK town centres? A machine learning approach using OpenStreetMap data
Supplemental Material for What amenities drive footfall in UK town centres? A machine learning approach using OpenStreetMap data by Viriya Taecharungroj, and Nikos Ntounis in Environment and Planning B: Urban Analytics and City Science.
Footnotes
Acknowledgements
The authors would like to thank MRI OnLocation and their Director of UK sales Jonathan Burnett, for the kind use of their UK footfall data, the Liverpool BID company and their CEO Bill Addy for their permission to use the map of Church Street, Liverpool, and Dr Christine Mumford and Prof. Cathy Parker for their support and help during data curation and analysis.
Declaration of conflicting interests
The author(s) declared no potential conflicts of interest with respect to the research, authorship, and/or publication of this article.
Funding
The author(s) received no financial support for the research, authorship, and/or publication of this article.
Supplemental Material
Supplemental material for this article is available online.
Notes
References
Supplementary Material
Please find the following supplemental material available below.
For Open Access articles published under a Creative Commons License, all supplemental material carries the same license as the article it is associated with.
For non-Open Access articles published, all supplemental material carries a non-exclusive license, and permission requests for re-use of supplemental material or any part of supplemental material shall be sent directly to the copyright owner as specified in the copyright notice associated with the article.