
Abstract
The rise in home/hybrid working post-pandemic across multiple countries has been linked to significant shifts in housing demand away from urban centres. This paper explores evidence for this shift through changes in the value placed on public transport services in house prices. We analyse changes across 74 travel-to-work areas in England using data from 2.6 million house sales listings combined with novel measures of public transport accessibility to employment (PTAE). Multilevel hedonic models capture changes in willingness-to-pay for PTAE at the Travel-to-Work Area level with meta-analysis models used to analyse variations between and within cities. Overall, there was a reduction in willingness-to-pay for PTAE post-pandemic but this was confined to smaller cities and those with lower housing affordability. Within cities, reductions were greater in locations better served by public transport and with greater potential for home/hybrid working though the latter was also confined to smaller cities and those with lower affordability. Results align with evidence on increasing trends of counter-urbanisation in the UK and Europe and pose challenges for future sustainable urban development policies but also highlight the variations between urban contexts.
Introduction
One of the enduring impacts of the global COVID-19 pandemic appears to be a marked rise in home or hybrid working arrangements where employees work solely or partly from home (Darby et al., 2022). Many European countries show significant increases, particularly in north-western Europe and the Nordic countries (Eurostat, 2024). Similar trends have been observed in Australia, Canada and the US (Adrjan et al., 2024). Home/hybrid working had been on an upward trend pre-pandemic (Chatterjee and Crawford, 2021) but workplace restrictions imposed during the pandemic meant that many more people experienced this than previously and that appears to have driven a marked, durable increase. In the UK, for example, the proportion of the workforce working from home at least once a week was 25–40% across 2022, up from 12% in 2019 (ONS, 2020, 2023).
The impacts of this shift on urban areas are still unfolding, but they are potentially far-reaching. There are direct reductions in demand for office property as well as co-located retail/leisure services (Glaeser, 2022) and additional feedback effects through public transport systems. After dramatic revenue losses during the pandemic itself (Federal Transit Administration, 2024; Nikolaidou et al., 2023), public transport providers now face a longer-term loss of income from reductions in commuting, undermining service viability, potentially leading to a vicious cycle of decline. This would further erode the competitive advantage which urban areas enjoy through the scale of their labour markets (Gordon et al., 2015).
Change is also being felt in the housing system where reduced commuting frequency opens the possibility for households to live further from urban centres in lower-density locations less well-served by public transport. This threatens to undermine some of the central policies to promote more sustainable ways of living of recent years which have emphasised increasing densities around public transport hubs (OECD, 2018) and localised access to services through active travel in the X-minute city (Stevenson et al., 2025). Shifts in housing demand from cities to peri-urban and rural areas have been reported in studies in Europe and Australia (Argent and Plummer, 2022; Gallent and Madeddu, 2021; Stawarz et al., 2022; Vogiazides and Kawalerowicz, 2022).
Willingness-to-pay for public transport accessibility to employment (PTAE) can provide an important lens on this process. Although there is some variation across the extensive international literature (Higgins and Kanaroglou, 2016; Mohammad et al., 2013), good PTAE is generally reflected in higher house prices. Any weakening of this effect post-pandemic would be an important indication of the likely future direction for urban development. In particular, understanding how change varies across the urban landscape will be important for urban policy and planning. Impacts may be greater in cities with less affordable housing since the ‘push’ factor will be that much greater in those locations. We might also expect variations within cities, with effects greater in neighbourhoods where more people have the potential to shift to home/hybrid working.
The overall aim of this paper therefore is to analyse whether the housing market value of PTAE in the UK fell post-pandemic and to explore variations between and within cities. Few studies have examined this change to date, often restricted to single-city analyses (Yang et al., 2023). The key contribution of this paper is to examine change across a diverse set of urban areas by combining a number of extensive, high-quality datasets. For house prices, we draw on a large database of online sales listings from one of the UK’s largest online property platforms, (Zoopla Hometrack, 2023). For public transport accessibility, we use a novel open dataset, constructed from public transport schedules for every bus/tram stop, train station and ferry in the UK (Verduzco Torres and McArthur, 2022, 2024). We cover all the 74 Travel-to-Work Areas across England with populations above 200,000.
The structure of the rest of the paper is as follows. The Background section summarises the literature on the housing market value of public transport access, describes changes in commuting behaviour post-pandemic and sets out reasons this might impact on house prices. The Data and Methods section provides details on data and modelling approach. Results are then presented, followed by a discussion and conclusions.
Background
Housing market value of PTAE
Accessibility has long been recognised as a key determinant of value in urban land markets according to urban rent theory where access to employment plays a central role. Initial models (Alonso/Muth) viewed land prices as determined by accessibility to a central business district (CBD) where all employment was located (Brueckner, 2011; Duranton and Puga, 2015). Land prices were higher closer to the CBD since that meant lower commuting costs. In selecting residential locations, households therefore traded-off better access for less housing space. Smaller housing units around the core could keep housing costs down but this came at the expense of higher densities and accompanying disamenities such as noise. The monocentric model has given way to more polycentric urban forms (Berry and Kim, 1993) and accessibility measures now factor in decentralisation of workplaces along with operational and topological character (G. Ahlfeldt, 2011; G. M. Ahlfeldt and Wendland, 2016). Additionally, it has been recognised that the relationship between accessibility to employment and house prices may be non-monotonic, given that high accessibility is also associated with disamenities such as noise, congestion and crime (Osland and Pryce, 2012). Nevertheless, accessibility to employment remains an important driver of land and housing prices.
Many empirical studies find a positive relationship between public transport services and house prices though systematic reviews report considerable variation in effect sizes with some even reporting negative associations (Debrezion et al., 2007; Higgins and Kanaroglou, 2016; Mohammad et al., 2013). The literature has attributed this variation to a number of factors including potential misspecification issues. Many studies oversimplify public transport benefits as, for instance, distance to the nearest station, overlooking service frequency or range of destinations served (Costa et al., 2022; Higgins and Kanaroglou, 2016).
The rise of home/hybrid working post-pandemic
Home/hybrid working had been rising prior to the pandemic, bringing with it associated changes in work-related travel. The average number of commuting trips per person was declining in many countries with commuting distances rising, helped by better transport (public and private) as well as more flexible work schedules (Chatterjee and Crawford, 2021). However, the pandemic restrictions on mobility and workplace access produced a sharp increase in proportions with experience of home/hybrid working (Aksoy et al., 2022). In one UK study, 11% reported always/often working at home pre-pandemic but, during the June 2020 lockdown, the figure was 48% (Felstead and Reuschke, 2020). While numbers fell back after the lifting of travel restrictions, they remain well-above pre-pandemic levels (ONS, 2023). In an analysis of UK job vacancy listings, Darby et al. (2022) identify an upward trend in references to ‘hybrid working’ arrangements, suggesting that this will be an enduring change.
Shifts in work patterns are closely related to changes in travel behaviour. A US study from 2022–23 found 42% of respondents use public transport less than they did before COVID-19; of these, 62% view the change as permanent (Smith et al., 2025). A report on the long-term effects of COVID-19 on transport notes that, while bus usage in Britain recovered after 2022, it had not returned to pre-pandemic levels by late 2023 (Kendall et al., 2024).
Home/hybrid working is very uneven across income levels and occupations. In the US, just 12% of workers in the lowest-earning income decile worked from home in 2021, compared to 38% in the highest (U.S. Census Bureau, 2023). Similarly, just 5% of workers in production, transportation and material-moving occupations worked from home, compared to approximately 28% in management, business, science and arts (U.S. Census Bureau, 2023). In the UK, only 8% of people earning below £15,000 per annum report hybrid working, compared with 38% of those earning above £40,000 (ONS, 2022a). ‘White-collar’ occupations are far more likely to report home/hybrid working than others (ONS, 2023). The occupations with the highest levels of working exclusively from home are professional occupations (27%), associate professionals (22%) and managers, directors, and senior officials (21%). These groups also have the highest rates of hybrid working (44%, 39% and 43%, respectively). In contrast, only 3% of those in elementary occupations report hybrid working, and just 1% work exclusively from home.
Implications for urban housing markets
One immediate impact of this shift is to enable households to widen their housing search areas (Gallent and Madeddu, 2021). The same total commuting cost (in time and money) can be applied to fewer but longer journeys, potentially bringing lower-cost or more desirable peri- and ex-urban housing areas within reach. In the UK, Gallent et al. (2023) note a considerable growth in housing demand in rural and peri-urban areas in 2020 and 2021 although there are some signs of a reversal since the peak of the pandemic (Hamiduddin and Gallent, 2024). Similar outward migration patterns from cities have been reported in other international studies in Europe and Australia (Argent and Plummer, 2022; Stawarz et al., 2022; Vogiazides and Kawalerowicz, 2022).
Willingness-to-pay for PTAE provides a potential lens on this process but there have been limited studies to date (Yang et al., 2023). Most of the evidence derives from studies for one or a few cities, using varying approaches and data (Yang et al., 2023) yet there are reasons to expect some variation. In cities which have higher housing market pressures or lower housing affordability relative to wages, we might expect to see a stronger impetus for outward migration and hence greater reductions in willingness-to-pay for PTAE. In larger cities, by contrast, the greater spatial extent of the city may limit scope for out-migration as the distance to locations offering very different environments is correspondingly greater. Impacts may also vary between cities depending on the level of public transport provision. Where relatively little commuting was done by public transport before the pandemic, we might see less reduction in willingness-to-pay for PTAE post-pandemic. In general, larger cities will also enjoy an advantage here as their scale and greater congestion tends to support better public transport infrastructure.
We might also expect variations within cities because the rise in home/hybrid working is so uneven across incomes and occupations, as noted above. Where a neighbourhood has few people with increased opportunity for home/hybrid working, we would not expect to see as much change in the value attached to PTAE. Similarly, where residents in a neighbourhood may have made little or no use of public transport for commuting before the pandemic, we should not expect to see any change.
Summary and research questions
In general, there is international consensus on the positive relationship between public transport accessibility to employment and property prices (Cervero and Kang, 2011; Cordera et al., 2019; Mulley et al., 2016). The rise in home/hybrid working post-pandemic is likely to weaken this relationship, though impacts may vary between and within cities. The hypothesised changes are summarised in the following research questions:
Has the housing market value of public transport accessibility to employment (PTAE) reduced post-pandemic in English cities?
Is the reduction greater in smaller cities, those with lower housing affordability and those with greater reliance on public transport for commuting pre-pandemic?
Within each city, is the reduction greater for neighbourhoods where people are more likely to be able to switch to home/hybrid work and/or those where there was greater reliance on public transport for commuting pre-pandemic?
Data and methods
Data
Geographies
We conduct our analysis for the 74 largest Travel-to-Work Areas (TTWAs) in England using UK Government 2011 definitions (ONS, 2015). TTWAs are the most appropriate units as they form relatively self-contained labour market areas. We focus on larger TTWAs partly to ensure we have sufficient data in each and partly because smaller urban areas are unlikely to have substantial public transport networks in the first place. We restrict analysis to TTWAs with at least 200,000 population in 2020 and a minimum of 6000 property listings over the 4 years of the analysis. We label those with a population above 650,000 as ‘large’ (N = 20).
Neighbourhoods are defined by 2011 Lower Super Output Areas (LSOAs) – statistical units with a population of 1000–2000 (ONS, n.d). Across the 27,704 LSOAs included in the analysis, median population is 1628 (IQR: 414) and median surface area 0.42 km2 (IQR: 0.76 km2).
Property characteristics
We use a database of UK house sales compiled from the Zoopla property listings website, accessed under licence through the Urban Big Data Centre (Zoopla, 2023). Zoopla is one of the largest online property listings companies in the UK (Livingston et al., 2021). Listings include asking price at the time the listing closed plus property characteristics including property type and size as well as location (latitude/longitude) and end date. Registered sale prices are available for England (HM Land Registry, 2024) but do not include property characteristics and there is no common identifier to link them with listings. We have however linked records for one major TTWA for 2018–2022, finding correlations between listing price and registered sale price above 0.99 in every year (Supplemental Materials [SM], Table S1).
Listings are allocated to LSOAs and TTWAs using latitude/longitude. We restrict listings to those with valid property characteristics and an end date in either of the 2-year periods 2018–19 (pre-pandemic) or 2021–22 (post-pandemic), giving seasonal balance. We exclude 2020 as the early months of the pandemic led to the effective closure of the housing market. We have a total of 2.7 million listings across the 74 TTWAs. Removing outliers (log price more than 1.5 times the interquartile range above/below upper/lower quartile for that size of property in that TTWA) reduces the dataset by 3.1%, and leaves 1.3 million listings each for pre- and post-pandemic periods. Property size has five categories (0/1/2/3/4+ bedrooms) and type four (detached/semi-detached/terraced/flat). We deflate sales prices using the December 2023 GDP deflator at market prices (ONS, 2024a).
Public transport accessibility to employment (PTAE)
PTAE measures are taken from a novel set of accessibility measures for Great Britain, constructed from open public transport schedule data for 2022. The measures combine information on services for every bus/tram stop, railway station or ferry terminal in Britain with information on all employment locations as well as other destination services and amenities. The resulting suite of accessibility measures is made available through the ‘AccessUK’ R package; full details and visualisations in (Verduzco Torres and McArthur, 2022, 2024). They are particularly suited to our task because they combine comprehensive detail on service levels with fine geographic detail and multiple time thresholds. Here we focus on accessibility to employment specifically because that is the domain we expect to be most directly affected by the post-pandemic labour market changes. Employment data come from 2020. Although this does not perfectly align with the timings for our housing listings, we see little change in employment over the period 2018–22; across our 74 TTWAs, the average correlation of employment in 2020 with that in 2018–19 and in 2021–22 is 0.986 in both cases (see details in SM, Table S2).
PTAE measures follow a cumulative specification for multiple travel time thresholds, that is, number of jobs reachable by public transport within 15/30/45/60/75/90/105/120 minutes. Rather than using a single arbitrary threshold, we use Principal Component Analysis to produce a smaller number of orthogonal principal components (PCs) capturing most of the variance (Zhang and Castelló, 2017). We retain the first two PCs, accounting for 90.4% of variance. PC1 is dominant (75.1% of variance), drawing more or less equally on all time thresholds, reflecting a general measure of PTAE (SM, Table S3). PC2 is very much secondary (15.4% of variance) and is heavily weighted on the 15/30-min thresholds, identifying locations with more (or less) access to opportunities in very close proximity.
Other neighbourhood characteristics
The 2021 Census records the proportion of people using public transport to commute to work for 2021 LSOA boundaries. We reaggregate these to 2011 boundaries using the ONS (2022b) lookup. UK Government figures show the propensity for home/hybrid working for different occupations at the national level (ONS, 2023). The 2021 Census provides numbers in each occupation for 2021 LSOAs, again reaggregated to 2011 LSOAs. National rates of home/hybrid working for each occupation are applied to estimate the potential for home/hybrid working for each 2011 LSOA. Population densities are the estimated 2020 LSOA populations (2011-based) divided by area (km2) (ONS, 2021).
TTWA housing affordability
The UK Government produces official housing affordability measures for local authorities (LAs), based on the ratio of local house prices to local wages (ONS, 2024b). We reaggregate LA measures for 2023 to TTWAs. Low affordability TTWAs are those with house price-to-wage ratios above the median for our set of 74 TTWAs. There is little relationship with size; 9/20 large TTWAs had low affordability compared with 28/54 smaller TTWAs.
Analysis
Hedonic models for TTWAs
The analysis uses hedonic pricing models (Rosen, 1974) to estimate the value placed on PTAE in property prices, and how this changed post-pandemic. For each TTWA separately, we model (log) price as a function of property characteristics as well as neighbourhood or locational (LSOA) characteristics, acknowledging the hierarchical structure through a multilevel modelling approach. Multilevel models can capture spatial effects common in house prices (Chasco and Gallo, 2013). Empirical studies have reported strong similarities in estimates between multilevel and spatial multilevel models (Comber et al., 2020; Glaesener and Caruso, 2015) so we do not seek to capture additional spatial relationships.
LSOA characteristics include the two PTAE measures (PC1/PC2) as well as population density. We control for density separately because public transport provision is often greater in more urbanised locations with higher population concentrations which may be associated with various urban amenities and disamenities. PC1 has a positive correlation with density in every TTWA which varies little with size (SM, Figure S1). For PC2, the relationship is much weaker and varies more between TTWAs though still positive on average.
Our base hedonic model (Model 1) is shown in formula (1):
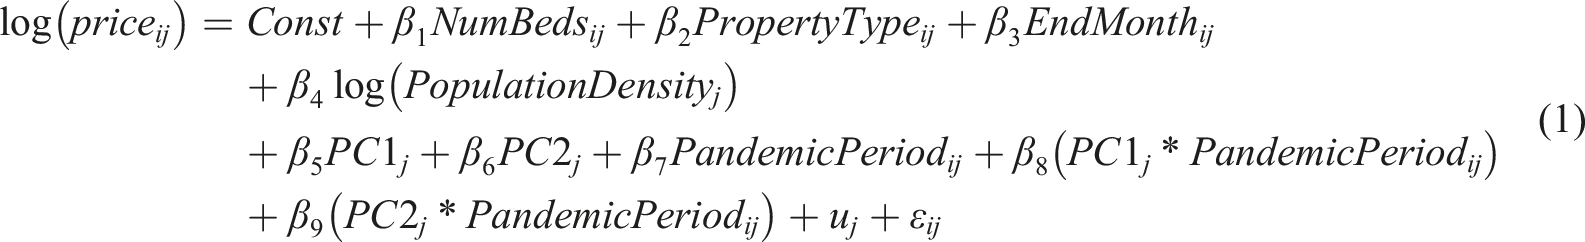
• log (priceij) – log of sale price for property i, LSOA j.
• Const – constant
• NumBeds – number of bedrooms (categorical)
• PropertyType – property type (categorical)
• EndMonth – end-month of listing to capture seasonality (categorical)
• log (PopulationDensity) – log (base 10) of population density of LSOA
• PC1/2 – the PTAE PCs
• PandemicPeriod – dummy variable for pre-/post-pandemic
• uj – random intercept for LSOA
• εij – error term for property
The base model captures overall changes in the valuation of PTAE in the housing market but our theory leads us to expect greater impacts in neighbourhoods with higher propensity for home/hybrid working and/or greater reliance on public transport before the pandemic. We therefore estimate three further models, using dummy terms to identify LSOAs above the median on one or both measures, and including interactions with PC1 and its interaction with the post-pandemic dummy. We do not extend the interactions to PC2 since it accounts for a relatively low proportion of variance and has low correlation with use of public transport for commuting (see below). Formula (2) shows the formula for Model 2 using the home/hybrid working dummy (HW); Model 3 for greater reliance on public transport (PT) and Model 4 for the intersection (HW.PT) are identical in structure.
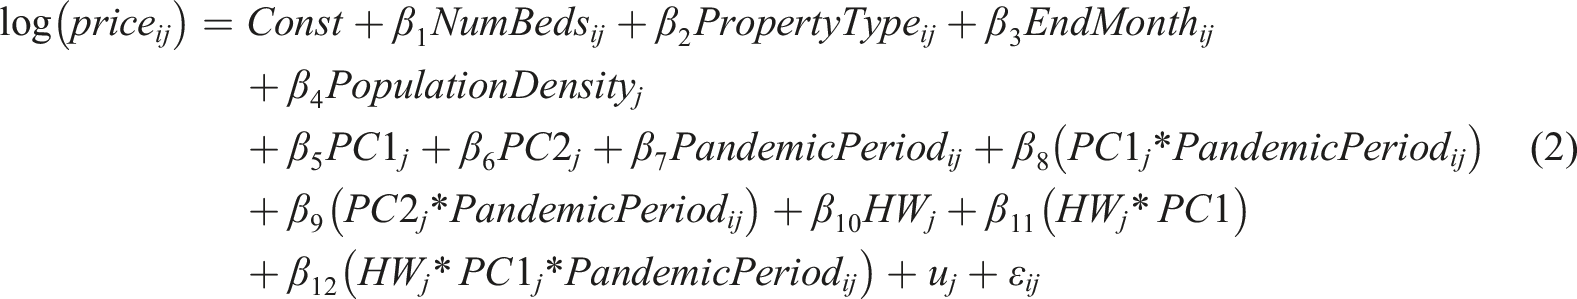
• HW – propensity to homeworking in the LSOA above the median for the TTWA (HW model only);
• PT – percentage of people travelling to work by public transport in the LSOA above the median for the TTWA (PT model only); and
• HW.PT – both HW and PT together (HW.PT model only).
A number of diagnostics were examined to assess model fit and performance (SM, Table S4). All models converged successfully, with no singular fits detected and no evidence of zero inflation. A small number of TTWAs showed signs of overdispersion; 9 in Model 1, 3 in Model 2, 6 in Model 3 and 10 in Model 4. Marginal R2 values ranged from 0.68 to 0.73. Conditional R2 values were consistently around 0.80 across all models.
Variations between TTWAs
To summarise variations between TTWAs, we could have constructed a single multilevel model with a third level for TTWA and multiple interaction terms to permit the effects of property and locational characteristics to vary between each. This was computationally challenging given the scale of the data and the number of interactions. Instead, we use meta-analysis techniques developed for the synthesis of results across diverse studies (Borenstein et al., 2009) to test explicitly for variations in relation to key TTWA characteristics such as size or housing affordability. Meta-analysis models usually draw data from different studies where data sources and/or model specifications vary significantly. Their application here is made much more robust by the fact that we have identical data and models for each TTWA.
To summarise results on variations between cities, we use separate meta-analysis models for the pre-pandemic premium for PTAE (

•
•
• xjk – Moderator k for TTWA j (e.g. size and affordability)
• βk – Meta-regression coefficients
• νj ∼ N(0, τ2) – Normally distributed TTWA-level random effect
• εj ∼ N(0, sj2) – Sampling error
We conduct checks to ensure that one or two cities are not having an undue influence on overall results in meta-analyses. Diagnostic tests for influence were conducted (e.g. Cook’s distances and covariance ratios) (Viechtbauer, 2010). When we excluded potentially influential cities from the analysis, the coefficients remained largely unchanged. Results reported here are for the full set.
Code transparency and reproducibility
All analyses were conducted in R Version 4.3.1. Multilevel models for TTWAs were fitted using the ‘lme4’ package (version 1.1.35.1) while meta-analyses were conducted using the ‘metafor’ package (version 4.8.0). All code is available from GitHub (https://github.com/michalisgeorg/Housing-transport-access-England). All data sources are open except Zoopla which can be accessed by UK-based academics through UBDC under an End User Licence.
Results
PTAE and commuting by public transport
To check whether our measures of PTAE (PC1/2) are likely to be reflected in house prices, we look at the relationship between each of these and commuting behaviours. As city size increases, more people tend to use public transport to commute to work although even in the largest English cities, it is rarely above 10% (SM, Figure S2); the proportion using public transport occasionally will of course be higher. This supports our decision to focus on larger TTWAs in the first place.
PC1 was noted above as the dominant component in our principal components analysis, giving a generalised measure of PTAE across multiple travel time thresholds. It clearly has a much stronger relationship with commuting behaviours (SM, Figure S3). There is a positive correlation in almost every TTWA, confirming that people in LSOAs with higher PTAE overall are more likely to commute by public transport. This is quite consistent across city size. With PC2 which captures specifically variations in access to nearby employment, there is no overall positive relationship and much more variation between cities. It may be that people are walking or cycling when employment opportunities are very nearby, or they are using private transport to access more distant employment. On this basis, we would expect PC1 to be more highly valued in the housing market pre-pandemic and to be more affected by the post-pandemic changes.
The housing market value of PTAE pre- and post-pandemic
Pre-pandemic willingness-to-pay for PTAE – meta-analysis models.
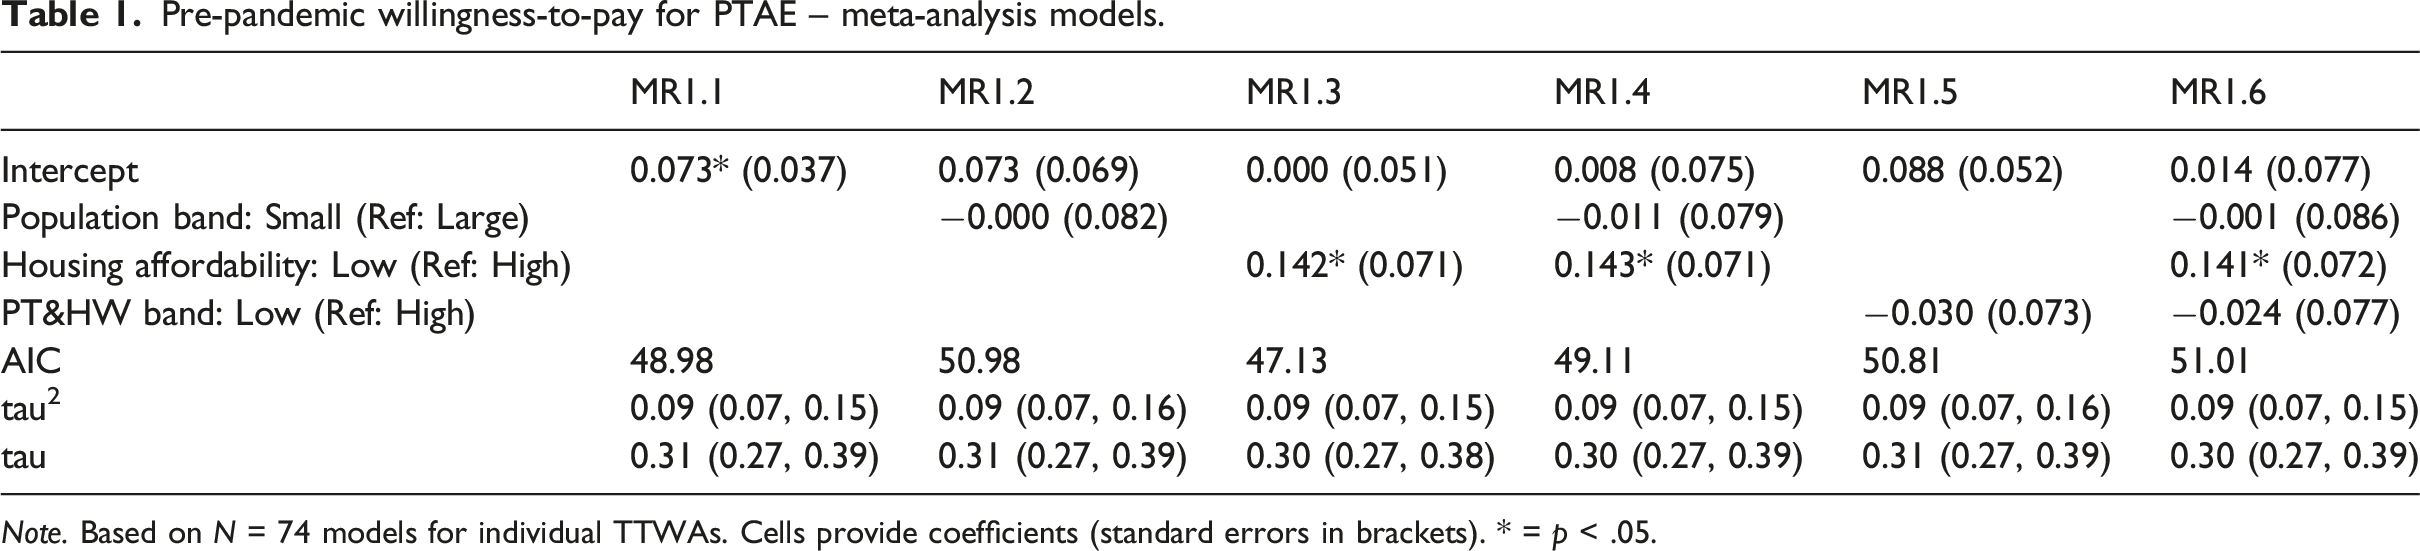
Note. Based on N = 74 models for individual TTWAs. Cells provide coefficients (standard errors in brackets). * = p < .05.
Post-pandemic change in willingness-to-pay for PTAE – meta-analysis models.
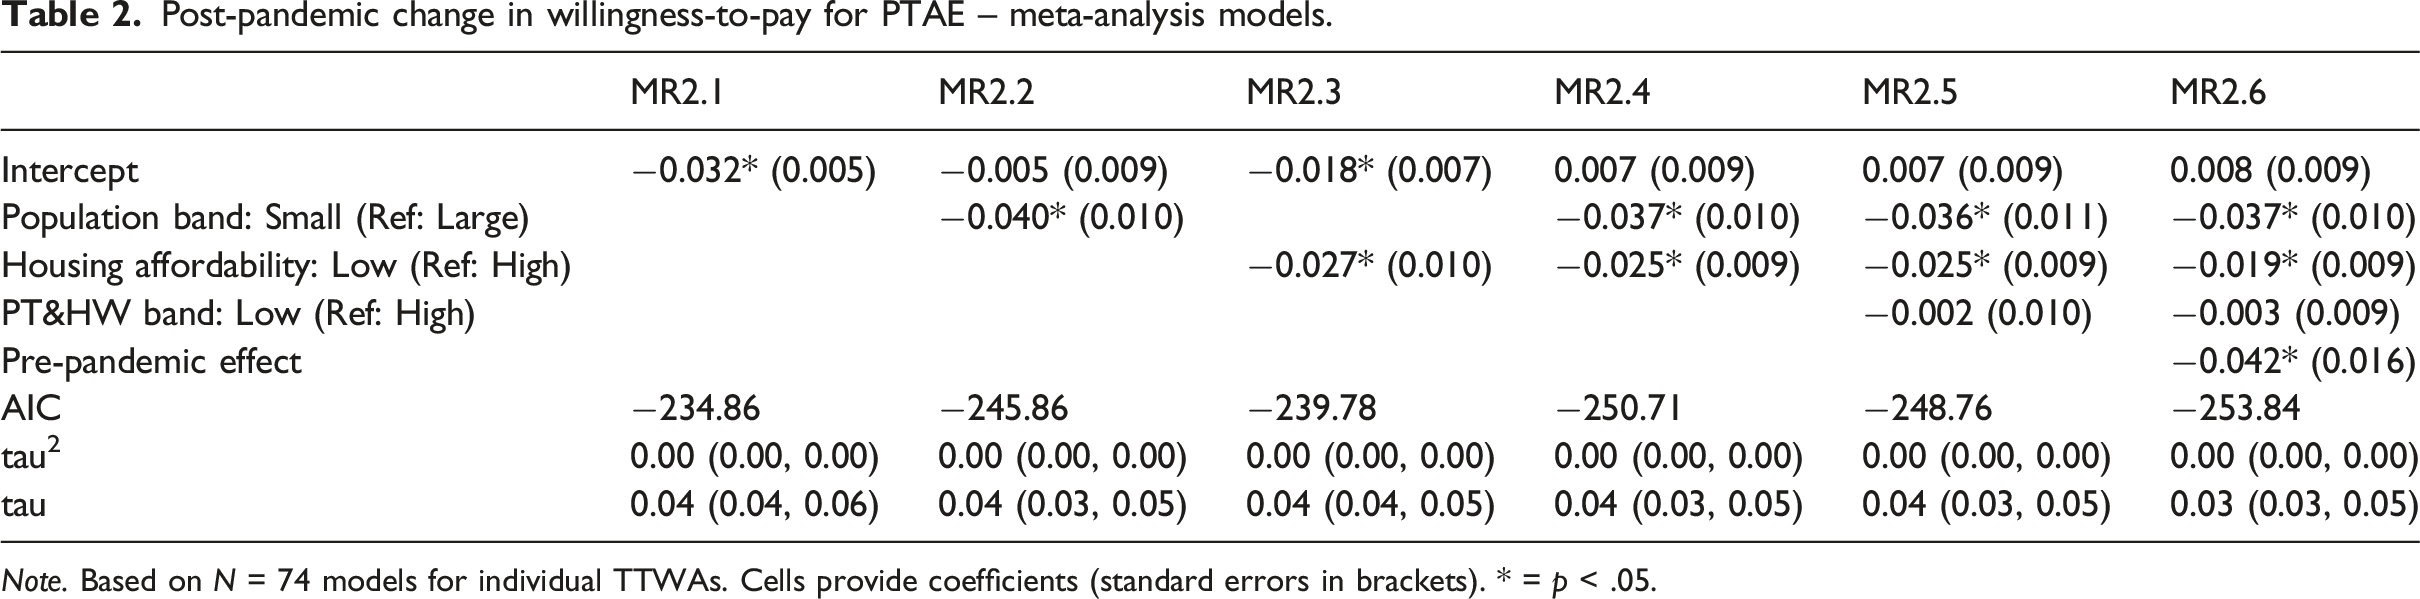
Note. Based on N = 74 models for individual TTWAs. Cells provide coefficients (standard errors in brackets). * = p < .05.
Pre-pandemic, the meta-analysis models confirm a positive willingness-to-pay for PTAE across our set of cities with one unit increase in PC1 associated with a 7.3% increase in house prices on average (MR1.1 in Table 1). PC1 has a standard deviation of 2.45 so one standard deviation increase would be associated with a 17.9% increase in house prices. This is no different in smaller cities compared with larger (MR1.2) but does appear to be confined to cities with less affordable housing (MR1.3). This persists when we consider both together (MR1.4) and when we separate out cities with greater use of public transport for commuting and higher concentrations of the occupations more able to work from home from others (MR1.6).
Post-pandemic, there is the expected reduction in willingness-to-pay for PTAE (MR2.1 in Table 2). The reduction is greater in smaller cities (MR2.2) and those with lower housing affordability (MR2.3) and these effects are separate and additive (MR2.4). After those factors are taken into account, there is no difference between cities with higher public transport use and greater potential for homeworking, and others (MR2.5).
Figure S4 (SM) shows a negative relationship between the estimated effect of PC1 pre-pandemic and the change post-pandemic, raising concerns that results reflect (at least in part) regression to the mean; in cities where the estimated pre-pandemic is high due to noise/error, we are more likely to see a negative change. In model 2.6, we therefore add a further control for the pre-pandemic estimate (MR2.6). This has the expected negative sign but, crucially, the previous findings related to size and affordability remain little changed.
Variations between neighbourhoods
Intra-TTWA variations in pre-pandemic willingness-to-pay for PTAE – meta-analysis.
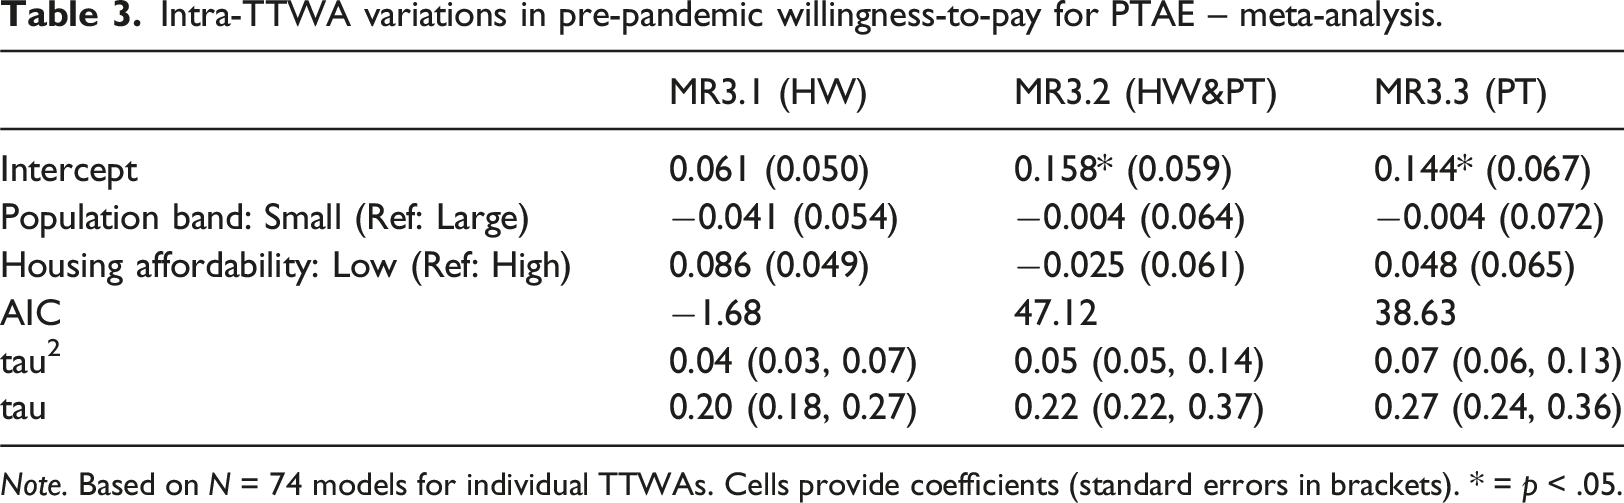
Note. Based on N = 74 models for individual TTWAs. Cells provide coefficients (standard errors in brackets). * = p < .05.
Intra-TTWA variations in post-pandemic change in willingness-to-pay for PTAE – meta-analysis.
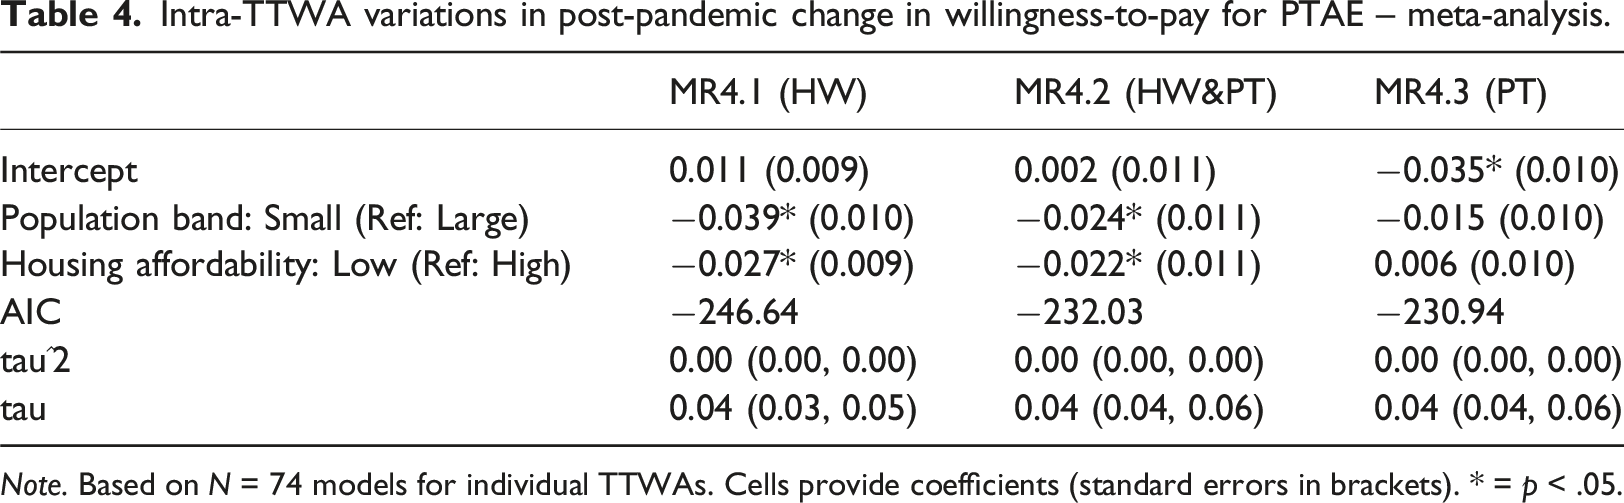
Note. Based on N = 74 models for individual TTWAs. Cells provide coefficients (standard errors in brackets). * = p < .05.
Results from the meta-analysis models for the pre-pandemic situation (Table 3) identify whether the willingness-to-pay for PTAE was greater in high HW, PT or HW&PT neighbourhoods pre-pandemic. In general, these show positive effects which are consistent across TTWAs regardless of size or housing affordability, at least for two of the measures (MR3.2/3.3). In neighbourhoods with greater potential for home/hybrid working only (MR3.1), the effect is not significant.
Results for the post-pandemic change also show expected effects with some caveats (Table 4). In neighbourhoods where there was a higher reliance on public transport for commuting, there is a greater reduction in willingness-to-pay for PTAE post-pandemic, consistent across all TTWAs (MR4.3). In neighbourhoods with more people able to work from home/hybrid, the reductions are confined to smaller cities or with low affordability (MR4.1). The same applies in neighbourhoods with both features (MR4.2).
Discussion
This paper examines the impact of the COVID-19 pandemic on the willingness-to-pay for PTAE in house prices and explores whether these effects vary between and within 74 cities in England. It is the first to cover such a wide range of urban contexts, enabling a detailed analysis of variations between and within cities. Our findings indicate an overall decrease in the value of PTAE post-pandemic, albeit that this was limited to smaller cities and those with lower housing affordability. When controlling for city size and housing affordability, there was no difference between cities with higher public transport use for commuting or higher potential for homeworking and others. Within cities, reductions were more pronounced in neighbourhoods with higher reliance on public transport for commuting pre-pandemic and those with more residents able to work from home/hybrid, albeit that the latter was also confined to smaller cities or those with lower affordability.
The finding in relation to housing affordability is easily explained as residents who are able to work from home can capture greater benefits from relocating out of these cities. There is some evidence at least from Singapore that, post-pandemic, households may be more sensitive to some of the disamenities of higher-density areas such as road traffic noise, providing additional incentives to relocate (Wang et al., 2023). The greater declines in smaller cities might be explained in different ways. In physical terms, it may be easier to move out of a smaller city and still retain access to employment since the distances are smaller. Alternatively, the more durable attraction of public transport in larger cities might reflect higher quality networks in these locations which continue to be valued for accessing a wider range of opportunities and services. Public transport services in smaller English cities tend to be less frequent, cover fewer destinations and offer lower quality (Allen, 2020; Verduzco-Torres and McArthur, 2023). Under the UK model with its reliance on private operators, networks in these cities may also have been less resilient to loss of revenues through the pandemic (Campaign for Better Transport, 2022). International research suggests that, for public transport systems to be resilient, they must be recognised for their fundamental value as a public service with government oversight, long-term planning and sustained investment (ITDP, 2024).
The results of this study have important implications. First, our findings suggest an overall shift in housing demand post-pandemic towards locations less well-served by public transport services. Given the concentration of services in larger, higher-density urban areas, the locations less well-served by public transport will tend to be lower density, suburban and ex-urban locations. This shift is therefore indicative of counter-urbanisation processes, where households move down the urban hierarchy from larger metropolitan cores and cities towards smaller towns and rural or peri-urban areas. A lower housing market premium for public transport access indicates reduced relative demand for central, well-connected locations, suggesting that households are moving outwards. Our finding on these dynamics aligns well with previous UK and wider European evidence suggesting the pandemic accelerated trends of counter-urbanisation (Gallent et al., 2023; Wolff and Mykhnenko, 2023). As a corollary, although home/hybrid working may mean that people commute less frequently, any potential energy and emissions savings may be offset by a rise in total commuting distances and/or greater car dependence overall. These trends are therefore moving in the opposite direction to international planning policy for sustainable cities and would appear to hinder efforts towards achieving the UN Sustainable Development Goals (OECD, 2012, OECD, 2018, UK Government, 2023, United Nations, 2015).
Second, this reduction in demand for PTAE also signals a potential fall in the value of land close to public transport hubs, particularly in smaller cities or those with low housing affordability. Infrastructure providers will see lower revenues from associated property, given lower footfall at transport hubs. Any reductions in services will only exacerbate effects to promote public transport use and create a vicious cycle well-known in the field (Bar-Yosef et al., 2013). The reduction in real estate values around hubs may also reduce the potential to fund infrastructure investment through land value capture strategies (Aveline-Dubach and Blandeau, 2019; Salon et al., 2017).
Third, and more generally, our results suggest that planning policy will need to pay greater attention to growing disparities between cities post-pandemic. As Florida et al. (2023) argue, the pandemic is unlikely to bring fundamental change to the global city system, but it does bring new challenges which are likely to be uneven in their impacts. Our work suggests that smaller cities, and particularly those with less affordable housing, appear to be at greater risk of losing some of their agglomerative advantages with declines in public transport a potential mechanism reinforcing decline. Planning and transport policies may need to be more nuanced in future to reflect the different challenges cities face.
Our work comes with some limitations. One lies in the relatively short follow-up period of the analysis post-pandemic. Although we capture the immediate effects on the housing market value of PTAE, these effects may be reversed or enhanced as the market recovers in the future. A second is that we examine the changes in one national context which has its own specific features, notably in terms of relatively low reliance on public transport for commuting combined with institutional arrangements which emphasise market-driven provision of public transport services.
This in turn suggests a number of directions for future research. The first would be the replication of our approach across a broader range of national and urban contexts. Such work could focus on areas with greater use of public transport than is apparent in most UK cities or with public transport provision underpinned by a social rather than a market model. More studies are also needed which cover a wide range of urban areas using a consistent approach, as we have done here. Second, more research with a longer follow-up period post-pandemic would be useful to progress understanding of the long-term challenges public transport operators will face in the future. Third, research could examine changes in the willingness-to-pay for public transport accessibility across a wider range of dimensions. We focus on employment accessibility here but the indices we use include measures of public transport access to a range of services and to amenities such as open spaces. They would support a more multi-dimensional analysis of changes in housing preferences, with potentially further insights for future urban form. Fourth, in relation to sustainability, future studies could directly investigate how changes in housing location lead to associated changes in mobility behaviour and mode choices, and hence affect progress towards sustainability goals (United Nations, 2015).
Conclusion
This paper offers valuable insights into the impact of the COVID-19 pandemic on the housing market value of PTAE in 74 English cities, through a fine-grained analysis of variations in impacts between and within a diverse set of city contexts. Overall, the findings suggest that there was a drop in willingness-to-pay for PTAE post-pandemic but this was confined to smaller cities and those with lower housing affordability. Within cities, reductions were greater in locations better served by public transport and with greater potential for home/hybrid working though the latter was also confined to smaller cities and those with lower affordability. These findings reinforce work on increases in counter-urbanisation post-pandemic. In a context of market-driven public transport, there is a clear risk that they will be self-reinforcing as lower revenues drive service reductions. Overall, they threaten to undermine progress towards sustainable urban development and planning.
Supplemental material
Supplemental material - The housing market value of public transport accessibility to employment in post-pandemic England
Supplemental material The housing market value of public transport accessibility to employment in post-pandemic England by Michail Georgiou, Nick Bailey, Annamaria Nizi and Jose Rafael Verduzco Torres in Environment and Planning B: Urban Analytics and City Science
Footnotes
Acknowledgements
Census and housing affordability data are Crown copyright. Zoopla property listings data are copyright Zoopla Property Group PLC, processed by and accessed through the Urban Big Data Centre (UBDC), University of Glasgow. The authors are grateful for the support provided by UBDC staff for data licensing, acquisition and processing.
Ethical considerations
This study did not involve human or animal participants.
Author contributions
Conceptualisation: M.G., N.B., A.N., and J.R.V.T.; Methodology: M.G., N.B., A.N., and J.R.V.T.; Formal analysis: M.G., N.B., and J.R.V.T.; Data curation: M.G.; Writing – original draft: M.G., N.B., and J.R.V.T.; Writing – review and editing: M.G., N.B., A.N., and J.R.V.T.
Funding
The authors disclosed receipt of the following financial support for the research, authorship, and/or publication of this article: This work has funding support from ESRC (ESRC-funded Urban Big Data Centre (UBDC) [ES/L011921/1 and ES/S007105/1]). The funders had no role in study design, data collection and analysis, decision to publish, or preparation of the manuscript.
Declaration of conflicting interests
The authors declared no potential conflicts of interest with respect to the research, authorship, and/or publication of this article.
Data Availability Statement
Supplemental material
Supplemental material for this article is available online.
Author biographies
References
Supplementary Material
Please find the following supplemental material available below.
For Open Access articles published under a Creative Commons License, all supplemental material carries the same license as the article it is associated with.
For non-Open Access articles published, all supplemental material carries a non-exclusive license, and permission requests for re-use of supplemental material or any part of supplemental material shall be sent directly to the copyright owner as specified in the copyright notice associated with the article.