
Abstract
This study uses a computer vision-based approach to identify manufactured home parks (MHP) across North Carolina, addressing the critical lack of comprehensive public records for these vulnerable housing communities. Using high-resolution aerial imagery, a custom-trained YOLOv8 object detection model, building footprints, and parcel records, we identified 8460 MHP—more than three times the size of the largest current public dataset. The precision and recall of our model are over 93%, in detecting individual manufactured housing units. Results reveal that while large and medium-sized MHP are predominantly an urban phenomenon, small MHP (fewer than 50 units) constitute 95% of all identified parks, with over 67% of these small parks located in rural areas, and are concentrated in southeastern, central, and southwestern counties. This approach enabled comprehensive identification of MHP, supporting better-informed planning for these often overlooked but critical affordable housing options.
Introduction
Manufactured housing plays a significant role in providing affordable housing in the US (Durst and Sullivan, 2019). Over 22 million (7%) people in the US residing in Manufactured Housing Units (MHU) face high natural hazard risks due to their placement, structural integrity, and residents’ socio-economic status (Ash, 2015; Baker et al., 2014; Pierce et al., 2022). Despite long-standing calls to focus research and policy efforts on these communities (Flynn, 1982; Genz, 2001; Lamb et al., 2023), research on climate adaptation and mitigation planning for the communities remains understudied; we lack comprehensive, public, and spatially precise records, which would enable improved risk quantification. A systematic approach to develop the most comprehensive dataset possible with existing scattered sources of information is urgently needed to identify, study, and plan for these communities (Durst et al., 2021). We demonstrate such an approach that can be scaled up by leveraging large geospatial datasets and computational capacity.
Identifying and monitoring these communities has implications beyond basic recordkeeping, as the communities face multiple challenges. Regulatory tools like exclusionary zoning and ordinances, combined with market pressures from private equity ownership, often push these communities toward more hazardous places with less oversight (Rumbach et al., 2022; Sullivan et al., 2022; Townsend, 2021). The current data landscape compounds these challenges. Available data sources, including DHS’s 53,000 Mobile Home Park (MHP) database, are outdated (Department of Homeland Security, 2022). Private datasets are non-comprehensive and costly. Recordkeeping is further complicated by the informal nature of manufactured housing transactions and their ability to be quickly built and moved (Durst et al., 2021), thereby hindering emergency management, planning, and housing protection efforts.
Recent advances in Machine Learning (ML) techniques offer an opportunity to address several of these challenges (e.g., Durst et al., 2021; Lunga et al., 2018). While previous studies focus on smaller areas (county-level), we implement our approach state-wide. We demonstrate the usefulness of computer vision in identifying MHP. 1 Using high-resolution aerial imagery and a purpose-built training dataset, we train an object detection model to locate MHU in aerial imagery and process them to identify MHP.
Background
Developing strategies to protect affordable housing stock will be needed to account for Manufactured Housing Communities. They are mostly prevalent in the South and Southwest United States, where land use regulations are more permissive and climatic conditions are milder. In a county-level analysis, Brooks and Mueller (2020) identified employment in natural resource industries and moderate temperatures as key factors associated with high concentrations of MHU. Over half of the MHU in the US are in rural areas (Prosperity Now, 2019), and are more likely to be occupied by low-income households, elderly individuals, and people of color (Durst and Sullivan, 2019).
Unlike formal subdivisions, various tenure arrangements are observed in manufactured housing communities (see Figure S1). For example, in a MHP, residents own the housing unit and often lease the land. In Manufactured Home Subdivisions, residents own both the land and the housing unit. In informal subdivisions, residents own both the land and the housing unit, but the subdivision is not formally recognized by the local government. The tenure arrangements affect the affordability, stability, and resilience of the communities. For example, MHP are more likely to be in urban areas, are more exposed to flood risk, and have less access to urban utility services compared to other types of communities (Sullivan et al., 2022).
These tenuous arrangements bar residents from traditional mortgages and force predatory mechanisms like chattel loans to finance the housing units (Durst and Sullivan, 2019). Treating manufactured housing as individual property, not real estate, creates differences in financial opportunities among residents of conventional and unconventional housing (Sullivan, 2022). The precarity of tenure arrangements is exacerbated by the lack of protections in the US. For example, even long-term residents in a MHP can be evicted with little notice (<30 days), and the land can be redeveloped for other uses without any documentation by the local and state bodies (Sullivan, 2017).
The affordability of MHU is due to economies of scale in factory-based manufacturing and the separation of land and housing unit ownership. However, these factors also contribute to their vulnerability, as they are often placed in areas with less stringent regulations and are more exposed to natural hazards (Dawkins and Koebel, 2009; Durst and Wegmann, 2017). This vulnerability stems from market dynamics in which lower-cost land tends to have higher environmental risks, while the classification of MHU as private property rather than real estate can result in different regulatory requirements than site-built homes. Their physical characteristics and installation methods further compound their susceptibility to natural hazards, creating a complex relationship between affordability, placement decisions, and climate vulnerability. For example, MHU built before 1994 were more severely affected by hurricanes in Florida in 2004 compared to those built to higher standards (Grosskopf, 2005). In addition, local governments can use tools such as exclusionary zoning, floodplain regulations, ordinances related to aesthetics, amenities, dimensions, maintenance, and safety to direct the placement, growth, and closure of these communities (Rumbach et al., 2022).
While manufactured homes represent a consequential proportion of affordable housing, local exclusionary policies aided by stigma, risk pushing them out towards areas with even less regulatory oversight and higher risk of natural hazards (Rumbach et al., 2022; Sullivan et al., 2022). Private equity ownership has also been driving the cost of ownership and evictions (Townsend, 2021). This precarity for residents is also a public policy challenge, as emergency managers and urban planners need to have up-to-date information about the locations, sizes, and compositions of the MHP so that they can better prepare and respond to acute disasters and provide adequate services such as education and public transportation.
Identification of manufactured home parks
No publicly available, comprehensive, granular dataset of MHP at the state or national level exists. The largest source is the MHP database created by the Department of Homeland Security (DHS) (Department of Homeland Security, 2022). These data, while providing precise geographic coordinates of over 53,432 parks in the US, have incomplete data on MHP characteristics. Furthermore, visual analysis of aerial images suggests this database is outdated. Similarly, cadastral datasets can indicate the presence of manufactured structures, or a zoning category or a land use designation that allows MHP. These cadastral datasets are neither comprehensive nor current and are often inconsistent across counties. Private real estate databases contain information about manufactured housing, but are costly.
Among a variety of methods to identify MHP, Ward & Peters (2007) combined geospatial analysis and visual interpretation of aerial/multispectral imagery to identify informal settlements, including MHP in selected US regions. Durst (2016, 2019) used a similar approach to identify Colonias in Texas. Shakib et al. (2024) use crowdsourcing using a mobile application named MapSwipe to activate a volunteer community of OpenStreetMap mappers to identify MHP in Arizona. While these techniques helped fill critical data gaps, the time- and labor-intensive nature of the studies limits their large-scale applicability.
Supervised machine learning can enable large-scale identification of manufactured housing with less manual labor and resources. Durst et al. (2021) used landscape metrics derived from building footprints to train Support Vector Machine models to identify and classify mobile homes in Hidalgo County, Texas. The approach was effective, with 91% accuracy without adding parcel information and 99% accuracy after adding parcel information. Despite widespread availability of building footprints, this approach has generalizability concerns if applied to different landscape and land-use contexts, necessitating separate models and training datasets. Lunga et al. (2018) used a multi-level semantic extraction approach to identify MHU, in which patch-level classification was followed by pixel-level classification. The approach shows promising results (91% classification accuracy on a validation dataset), but detailed methods, scope, and outcomes are not publicized.
The studies demonstrate the potential of large-scale applied machine learning to identify MHCs, while also highlighting potential challenges with the availability of data as well as generalization across geographies (Maxwell et al., 2021). This suggests that a regional-level analysis combining geospatial datasets (such as aerial imagery, building footprints, and parcel records) can be promising in identifying MHP using machine learning. We build on these techniques and use large-scale datasets to identify MHP at a state-wide scale in North Carolina (NC).
Data sources
This study focuses on the entire state of North Carolina, United States (∼140,000 sq. km.). The region is at elevated risk from natural hazards, including flooding, coastal storms, rising sea levels, and heavy rainfall (Kunkel et al., 2020). The state houses 10 million people and had the second-highest number of MHU shipments among the states (∼325 k) between 1994 and 2023.
Aerial imagery
Between 2020 and 2023, we acquired high-resolution aerial imagery (15 cm) through the North Carolina Orthoimagery Program (NCGIA, 2024). The program captures aerial imagery for one-quarter of the state annually using specialized survey aircraft (see Figure S2 for a county-wise map of imagery collection years), which enforces strict imaging standards for smoke and cloud coverage percentages per square mile and minimum sun angles. All imagery is captured during leaf-off conditions in winter to minimize vegetation interference. 56,020 GeoTIFF tiles (30 TB) of the imagery are stored on Amazon S3. Each 10,000 × 10000 pixel tile has four bands: Red, Green, Blue, and Near-Infrared.
MHP records
We used Mobile Home Park records made publicly available as part of Homeland Infrastructure Foundation Level Datasets (HIFLD) (Homeland Security 2022) to create training data and evaluate our results. The dataset includes 53,412 Mobile Home Parks, residential trailer parks, and recreational vehicle parks in the continental US and Alaska, with information on name, address, geo-coordinates, source, and size. We filtered this dataset to NC. NC has 2971 MHP: 2517 small (<50 units), 369 medium (51–100), and 85 large (>100). However, information about the exact number of units within each park is unavailable.
Parcel records
The parcel records span all 100 counties in the state, containing 5.6 million records (NCOneMap, 2016). The dataset was first created in 2016 and is continually updated. Dataset attributes, including georeferenced parcel polygons, standardized address information, parcel use codes and descriptions, and the number of structures, are defined by the Integrated Cadastral Data Exchange project.
Building footprints
We use the Microsoft US Building Footprints dataset (Microsoft 2018) for training data. This dataset was created using semantic segmentation and polygonization. The dataset contains 129 million footprints in the US, and 4.7 million footprints in NC. We also used Overture Foundation (2023) building footprints data in post-processing.
Home sales records
We used records of homes listed for sale to identify single-wide and double-wide MHU for training data creation. CoreLogic’s Multiple Listings Enterprise Solutions (MLS) dataset contains 157 million US listings spanning decades, constituting 80% of the total (CoreLogic, n.d). There are 3.5 million records in NC for the period between 1994 and 2022. The data includes details on address, property type and type of manufactured home (single wide vs double wide). However, significant data cleanup was necessary to identify manufactured homes listings. We identified 20,452 listings in North Carolina that are likely to be MHU, of which 6.25% are likely repeated or duplicated listings based on the property identifier used in the dataset.
Methods
We trained an object detection model on a custom training dataset and applied multiple post-processing steps to identify MHP from the inferred MHU (see Figure S3).
Object detection
We frame the identification of MHU from aerial imagery as an object detection problem. Object detection is an approach in computer vision in which a bounding box and category are assigned to objects of interest in an image, typically using Convolutional Neural Networks (CNN). A CNN is a neural network that uses a kernel filter that convolves over an image to identify locally relevant features (O’shea and Ryan, 2015). Object detection was selected over segmentation or classification approaches for several key reasons. First, object detection provides precise spatial localization through bounding boxes, enabling accurate geospatial mapping essential for our analysis. Unlike semantic segmentation, which classifies pixels but struggles with overlapping objects, object detection can distinguish individual MHU even when they’re closely spaced within parks. Unlike patch-level classification approaches used in previous studies, object detection offers superior scalability across diverse geographic contexts. Individual MHU exhibit more consistent visual characteristics (size, shape, reflectance) than entire parks, making them ideal training targets.
We used a YOLOv8 architecture model pre-trained on the Common Objects in Context (COCO) dataset by retraining it using a custom training dataset (Wang et al., 2023). YOLOv8 is an openly licensed state-of-the-art model that has been used with aerial imagery (Wang et al., 2023). It is a single-stage object detector that detects an object of interest in an image with a single pass, in contrast to classical two-stage object detectors in which regions of interest are first identified and later classified, allowing faster inference, at the expense of accuracy for smaller objects (Redmon et al., 2016). The YOLOv8 single-stage architecture provides computational efficiency crucial for processing tens of thousands of high-resolution imagery tiles. While two-stage detectors might offer marginally better accuracy, YOLO’s speed enables state-wide analysis within reasonable timeframes. Additionally, object detection’s confidence scoring facilitates post-processing workflows, allowing us to filter detections and aggregate individual units into parks systematically. We split images into overlapping tiles to better detect small objects using an open-source tool named Slicing Aided Hyper Inference (SAHI), improving recall performance on small-object detection (Akyon et al., 2022).
The YOLOv8 architecture mainly consists of two parts: the backbone and the head (Jocher et al., 2023). (See Figure S6 for the architecture diagram.) The CSPDarknet backbone includes the SPPF (Spatial Pyramid Pooling Faster) module that extracts features at various scales through max pooling (Sohan et al., 2024). The head processes the backbone features into object presence, location, and classification.
Training data creation
Manual annotation for computer vision is labor-intensive (Man and Chahl, 2022). We created training data programmatically by geospatially linking aerial imagery, building footprints, and parcel datasets, followed by manual validation. We matched geocoordinates of buildings known to be MHU from MLS and HIFLD data with Microsoft building footprints using a Python script. An image slice around the center of the georeferenced bounding box is saved and a text file with category and bounding box in the YOLOv5 data annotation format is saved. The image file and text file saved with the same filename together make one training image-annotation pair.
Since single-wide mobile/manufactured housing is under-represented in the CoreLogic dataset, we created additional training data for the category by using the HIFLD dataset. The HIFLD data only has point locations of the parks. We identified GeoTIFF corresponding to MHP geocoordinates in HIFLD and filtered building footprints that are likely to be MHU based on size (length between 40 and 80 ft and width between 12 and 18 feet). The programmatically created training dataset had issues such as miscategorization, missing annotations, misalignment of bounding boxes, and missing objects. Substantial human effort was dedicated to ensuring data quality by visually verifying the objects within the annotation boundaries (see Figure S4). The Roboflow web portal was used to edit incorrect annotations.
We included Null images in the training dataset. These images have objects that look like but are not mobile/manufactured housing from an aerial view. Examples of such images include, roads, warehouses, subdivision homes, trees, and fields. These images accompanied by no annotated bounding boxes, are useful to train the model to distinguish those from MHU. From the parcel attributes, we identified parcels from different regions in the state that have the potential to contain these different objects. For each of the parcels, we sliced the smallest square enclosing the parcel from the corresponding aerial imagery.
The final training dataset consists of 4674 images, including 3134 instances of single wide MHU, 1613 instances of double wide MHU, and 126 null instances. The dataset was split into Train, Validation, and Test sets, roughly at 70:20:10 proportions. A detailed breakdown of the training dataset is shown in Table S1.
Training used an NVIDIA L4 24GB GPU for 223 epochs (0.99 h). The best results on the validation set were obtained at Epoch 173. We evaluated the performance of the trained model on the held-out test set, representing the in-distribution performance of the model.
Inference and post-processing
To improve recall on the 10,000 × 10,000 pixel imagery, we used a tiled inference approach with Slicing Aided Hyper Inference (SAHI) on top of the YOLOv8 model. Imagery was split into tiles of preset size (360 pixels × 360 pixels) and percentage overlap (30%) before inference. Non-maximum suppression removed redundant detections during aggregation, favoring high confidence overlaps. A default of 0.7 is used as Intersection over Union (IoU) threshold for non-maximum suppression, and a confidence threshold of 0.3 for object presence. Each image was processed in a single-CPU environment, representing 56,020 jobs in the computational cluster. We geolocated the bounding boxes detected by the YOLOv8 model by using the coordinate system of the underlying inference image.
We followed the following post-processing steps to remove potential false positives. First, we removed any inference smaller or larger than realistic sizes for MHU. Based on the minimum and maximum dimensions of single and double-wide homes, we calculated the diagonal length of permissible sizes of minimum-rotated bounding boxes for each category (i.e., 37 to 96 ft for single-wide and 41 to 82 ft for double-wide). This step removes objects such as large warehouses that might look stylistically like MHU because of comparable reflectivity but are substantially larger. We removed inferences outside parcel geometries, eliminating the objects detected in and around roads. Roads have spectral characteristics similar to MHU, leading to incorrect detections.
Finally, we visually inspected the parcels with multiple detections and validated that they contained at least 3 MHU. This threshold was chosen based on the observation that many parcels with three or fewer detections were primarily used for agricultural and industrial purposes, and not as a manufactured housing park/subdivision in which most of the parcel is used by housing units. We selected parcels with at least one detection and at least one Foundation (2023) building footprint for validation to select parcels with a high chance of being an MHP without having to manually validate all parcels with detections. Manual validation entails slicing out aerial imagery corresponding to the parcel geometry as an image and deciding whether the image represents an MHP. The validation was performed by two of the authors. To address inter-rater reliability, four counties were first validated by both authors, with an Intersection over Union (IoU) score of 0.72.
Results
Object detection performance
We obtained an in-distribution performance of over 93% recall (the number of detections out of the total count in ground truth) on both single-wide and double-wide MHU on the test dataset. Similarly, we obtained over 93% bounding-box precision (overlap between the bounding boxes of detection and ground truth) for both classes. Minimum Average Precision at 50% (correct categorization with at least 50% bounding box overlap with ground truth) was 96% for single wide and 94% for double wide MHU (see Table S2). Comparable performance in both classes across the metrics suggests a balanced training set composition.
We observed differences between in-distribution and out-of-distribution performance. While we observed comparable in-distribution precision and recall across the two classes of MHU, out-of-distribution performance suggests the model performed better with single wide MHU than double wide MHU. False positives, such as larger warehouses or other types of buildings, are prevalent in the out-of-distribution inferences (see Figure 1). The model sometimes falsely detected apartment buildings, industrial containers, tennis/pickleball courts, forests, parking lots, roads/railway tracks, utility-scale solar, and sheds, with MHU (see Figure 1). These objects share visual characteristics such as color, shape, and other features, resulting in false-positive detections. Model detections in aerial imagery. (a) Out-of-distribution detections showing higher recall for single wide MHU (red boxes detected by the model) compared to double wide MHU (missed by the model, annotated by the authors in yellow boxes), with some false-positives like warehouses and other building types. (b) Eight examples of spuriously detected objects including apartment buildings, industrial containers, tennis courts, forests, parking lots, railroads, solar farms, and sheds with corrugated roofs.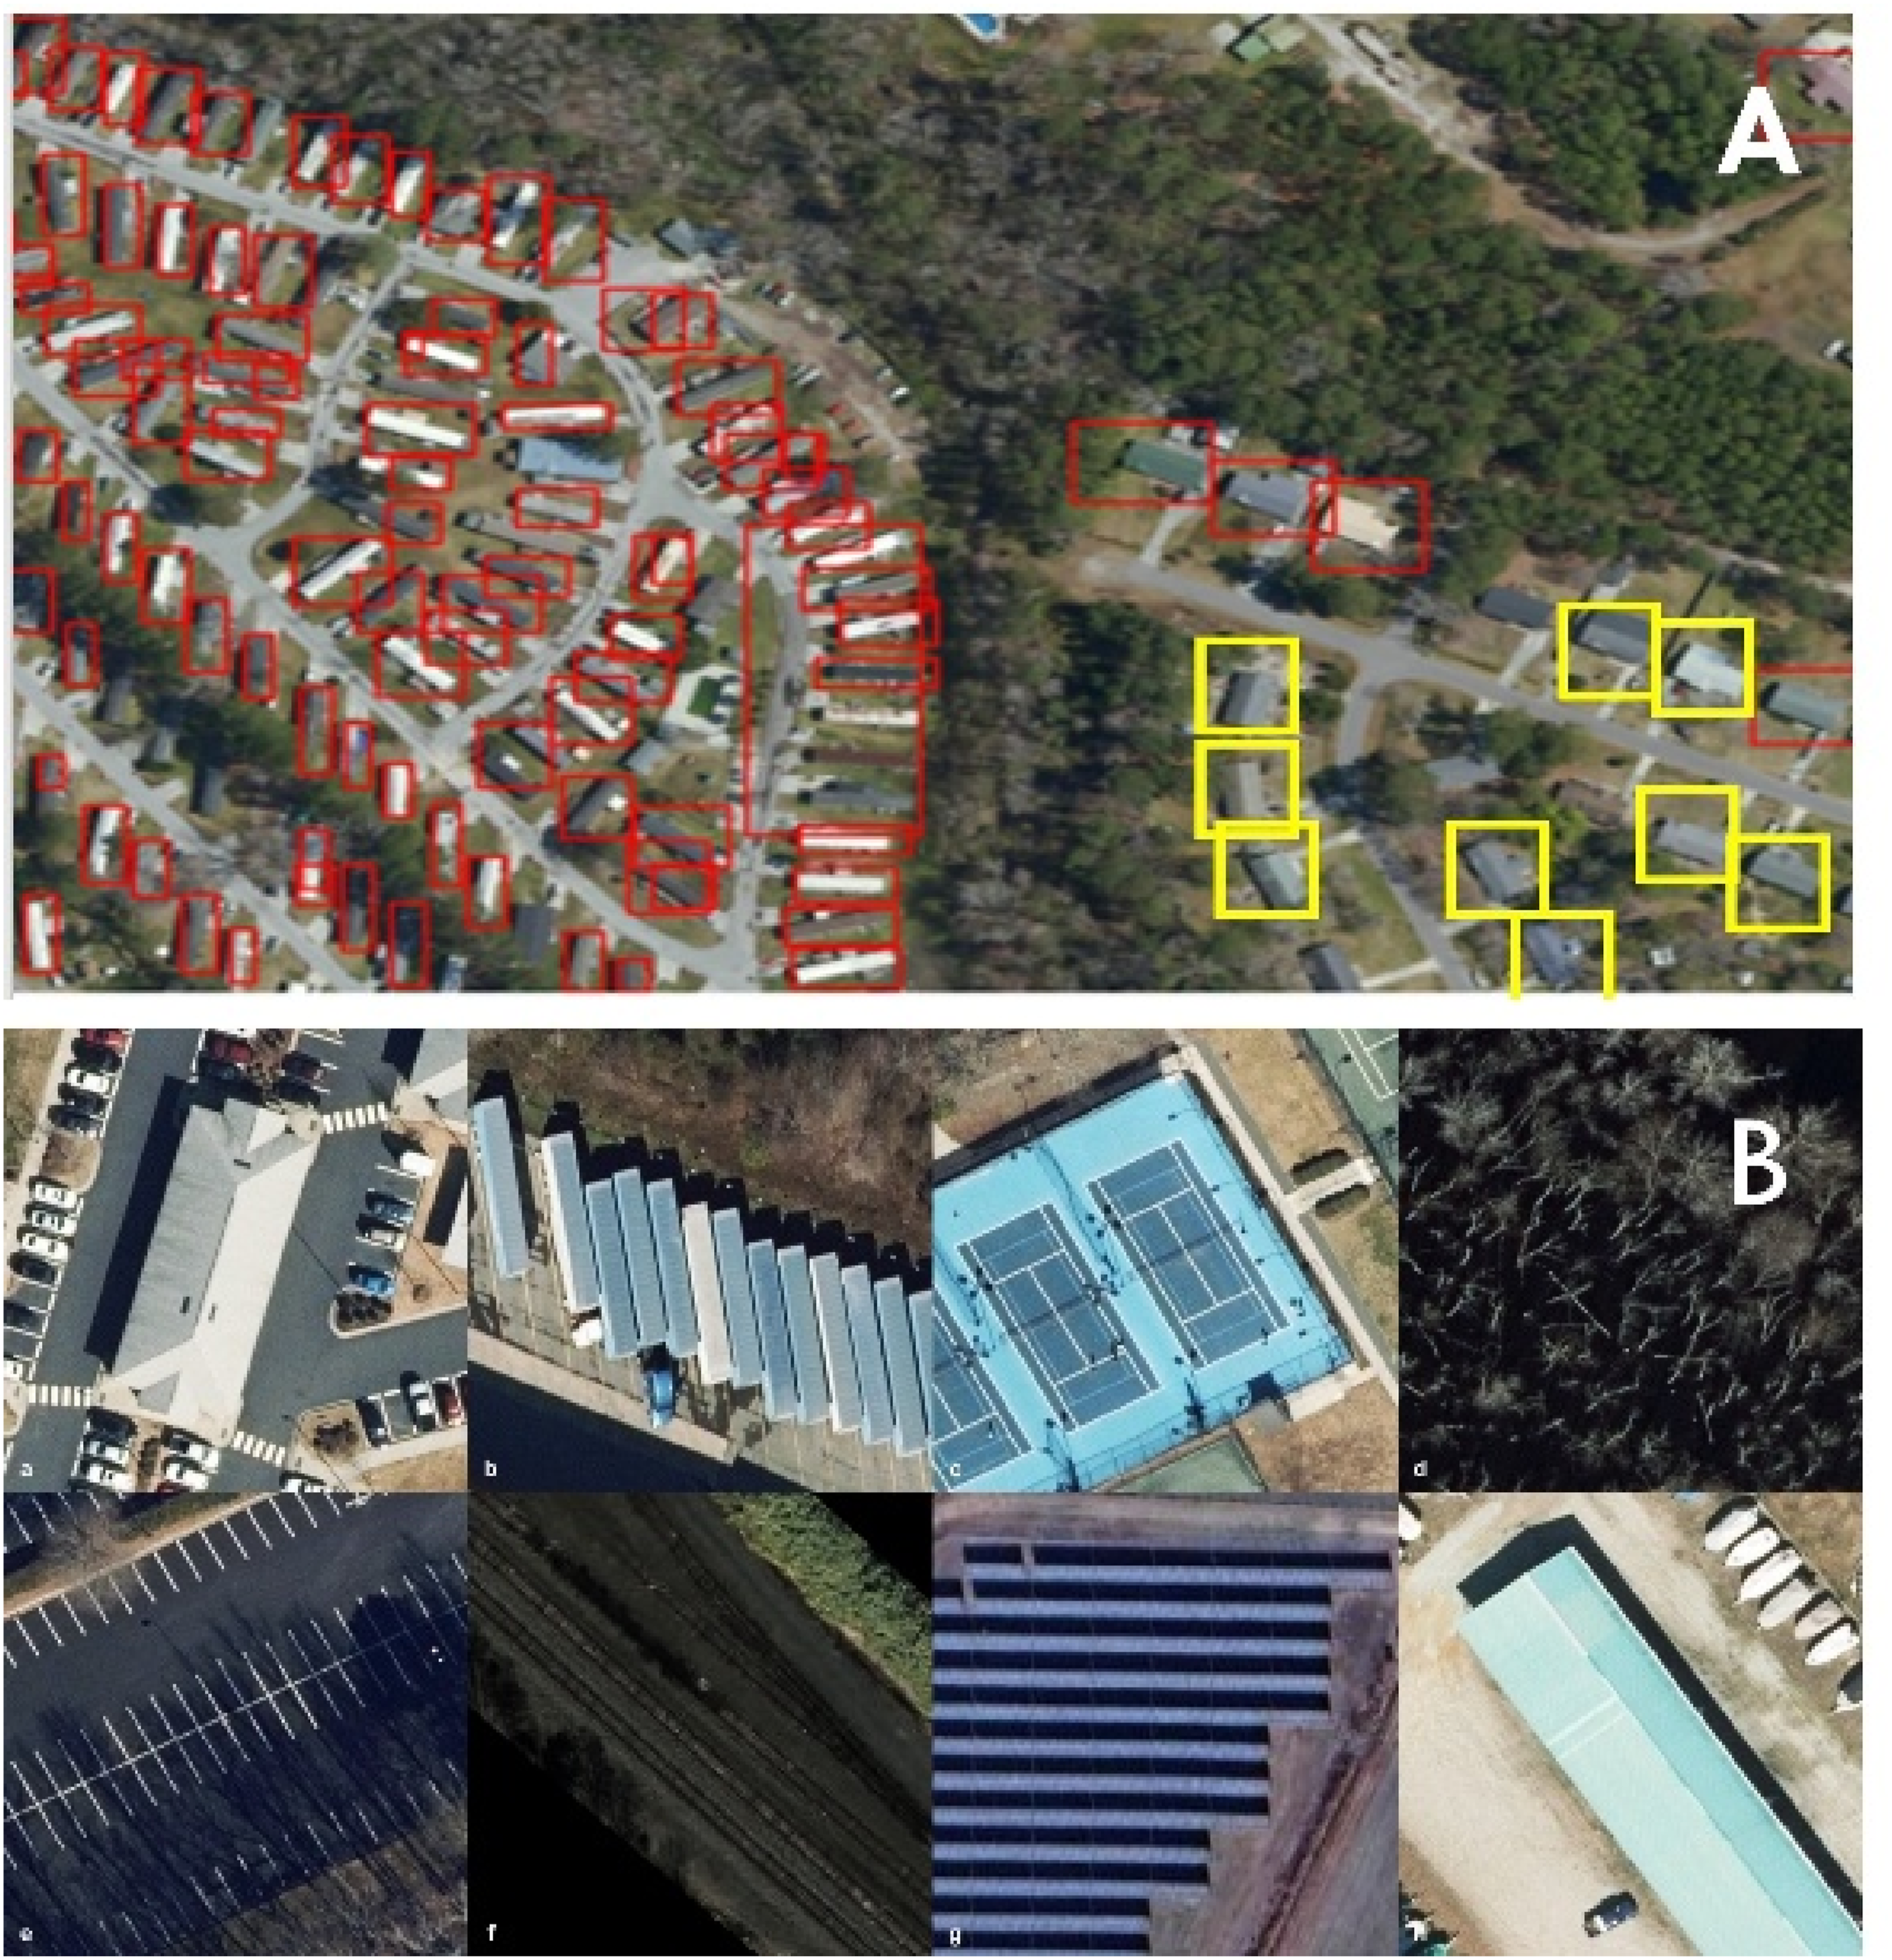
Following the post-processing steps, we found that nearly 79% of detections were outside the range of expected size (refer to Table S3). Filtering by expected size removed smaller objects such as small solar arrays, small sheds, boats, and cars and larger objects such as large sheds, elongated water bodies, and different housing types such as apartments and formal subdivision homes (see Figure S5). Matching with parcels removed another 6.77%, removing roads and vehicles falsely detected as MHU. After manually validating the imagery respective to matched parcels with multiple detections, about 15% of the remaining MHU belong to MHP.
Geographic distribution of MHP
We identified 8460 MHP in North Carolina, including 6653 isolated parcels, 592 paired clusters, and 172 groups of 3+ contiguous parcels. Since it is not possible to determine if the contiguous parcels are functionally different MHP without extensive validation, we treat each parcel as a separate MHP. Counties average 84.6 MHPs (median: 66). Southeastern, central, and southwestern counties in the State have higher numbers of MHP (see Figure 2(a)). The five counties with the highest number of MHP are Buncombe, Wake, Robeson, Onslow, and Davidson. Five counties contain fewer than 10 MHP. (a) Spatial distribution of MHP in North Carolina counties. MHP are most prevalent in southeastern coastal counties and western counties. Counties identified elsewhere in the text are labeled. (b) Spatial distribution and urban/rural locations of different MHP size classes. While large and medium MHP are predominantly an urban phenomenon, small MHP are largely rural and more prevalent.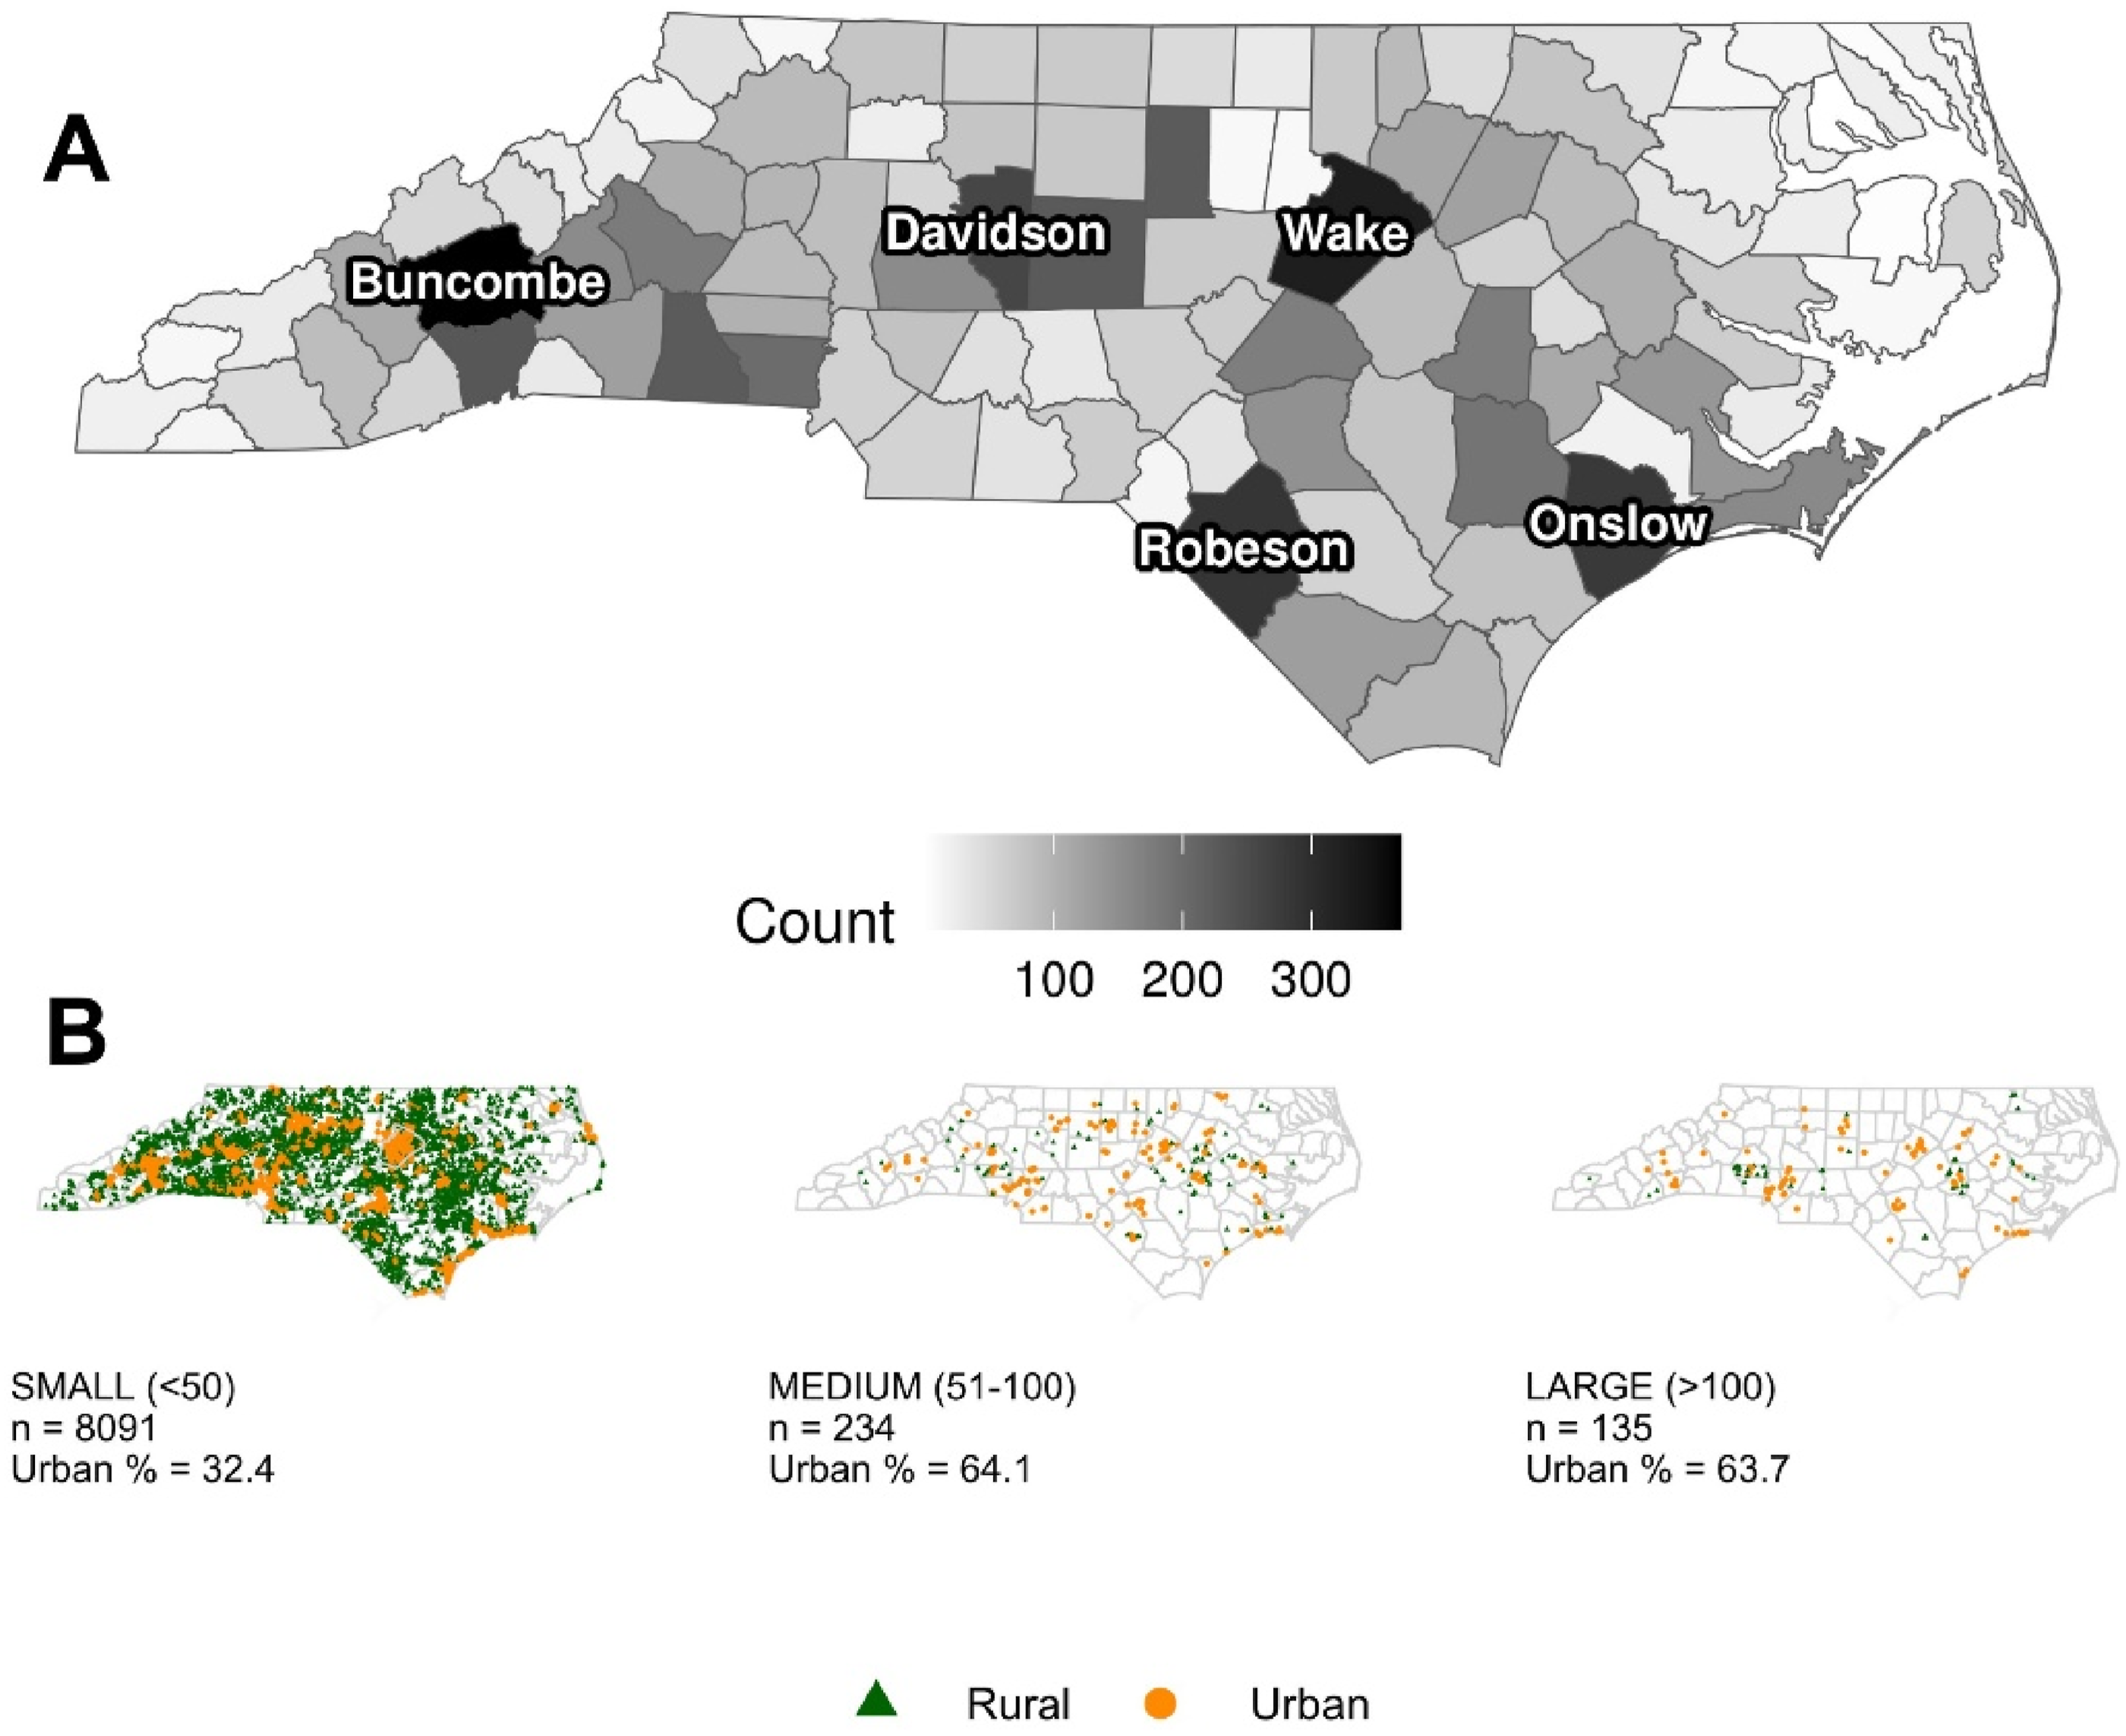
Large MHP are concentrated in the south-central (Lincoln and Mecklenburg) and central (Wake and Wayne) and eastern (Onslow) counties. Two counties with these concentrations have large military installations nearby and significant seasonal work in the agricultural and farming industries. Mecklenburg (home to Charlotte) and Wake (home to Raleigh) are the two biggest counties in North Carolina with high housing costs. Urban areas contain 33.7% of MHPs (predominantly large and medium-sized parks). We use the urban area 2020 definition from the US Census to distinguish urban and rural MHP. A large proportion of MHP are at the fringes of urban areas, both outside and inside the borders of the clusters (see Figure 2(b)). MHP are abundant in the fringes of large urban areas in Charlotte and Greensboro, two large cities in North Carolina. In smaller urban areas (such as Fayetteville and Asheville), MHP are also prevalent in central as well as fringes of the urban areas.
The prevalence of small MHP in rural areas is striking. Over 67% of the MHP with less than 50 units are found in rural areas and they are prevalent across the state. These small MHP make up 95% of the MHP in the state. Counties with the highest number of small MHP are Buncombe, Wake, and Robeson. In Buncombe County, 74% of small MHP are urban, whereas in Robeson County, 86% are rural.
Discussion
Computer vision can be effective in identifying MHU from high-resolution aerial imagery (precision & recall of approximately 0.93). The performance metrics are comparable to similar studies. While our precision and recall values are slightly lower than those reported in Microsoft (2018), they are higher than those reported in Shakib et al. (2024). Microsoft (2018) building footprints had higher precision (0.99 vs 0.93) because their approach was based on pixel-level semantic segmentation, compared to the bounding box-based object detection used in our approach. However, the recall values were similar (0.92 vs 0.93). The crowdsourced approach in Shakib et al. (2024) to identify whether tiles contained MHU had lower recall values (0.09 to 0.28), suggesting a substantial number of false-positive detections in their work. Our precision metrics, however, were comparable to theirs.
We identified considerably more MHP than is currently documented in Homeland Security (2022), the largest publicly available record of MHP in the US. We identified more MHP than the HIFLD data for all but three counties in the state. In Buncombe, Wake, Robeson, Onslow, and Davidson counties, we have identified substantially more MHP than HIFLD. The number of additional MHP identified becomes more pronounced in counties with a higher number of these communities (see Figure 3). More interestingly, we identify many MHP in counties that the HIFLD dataset completely misses (Y-axis on Figure 3). Comparison of county-level counts of MHP identified by us relative to counts in the HIFLD dataset. Size classes rely upon the HIFLD categories. The 1:1 line is shown. Points above the line are counties where more MHP are identified than the HIFLD dataset and vice versa. We identify substantially more smaller-sized MHP in almost every instance. In specific instances, there are more medium and larger MHP in HIFLD data. Distinctive differences in urban and rural MHP counts are not observed.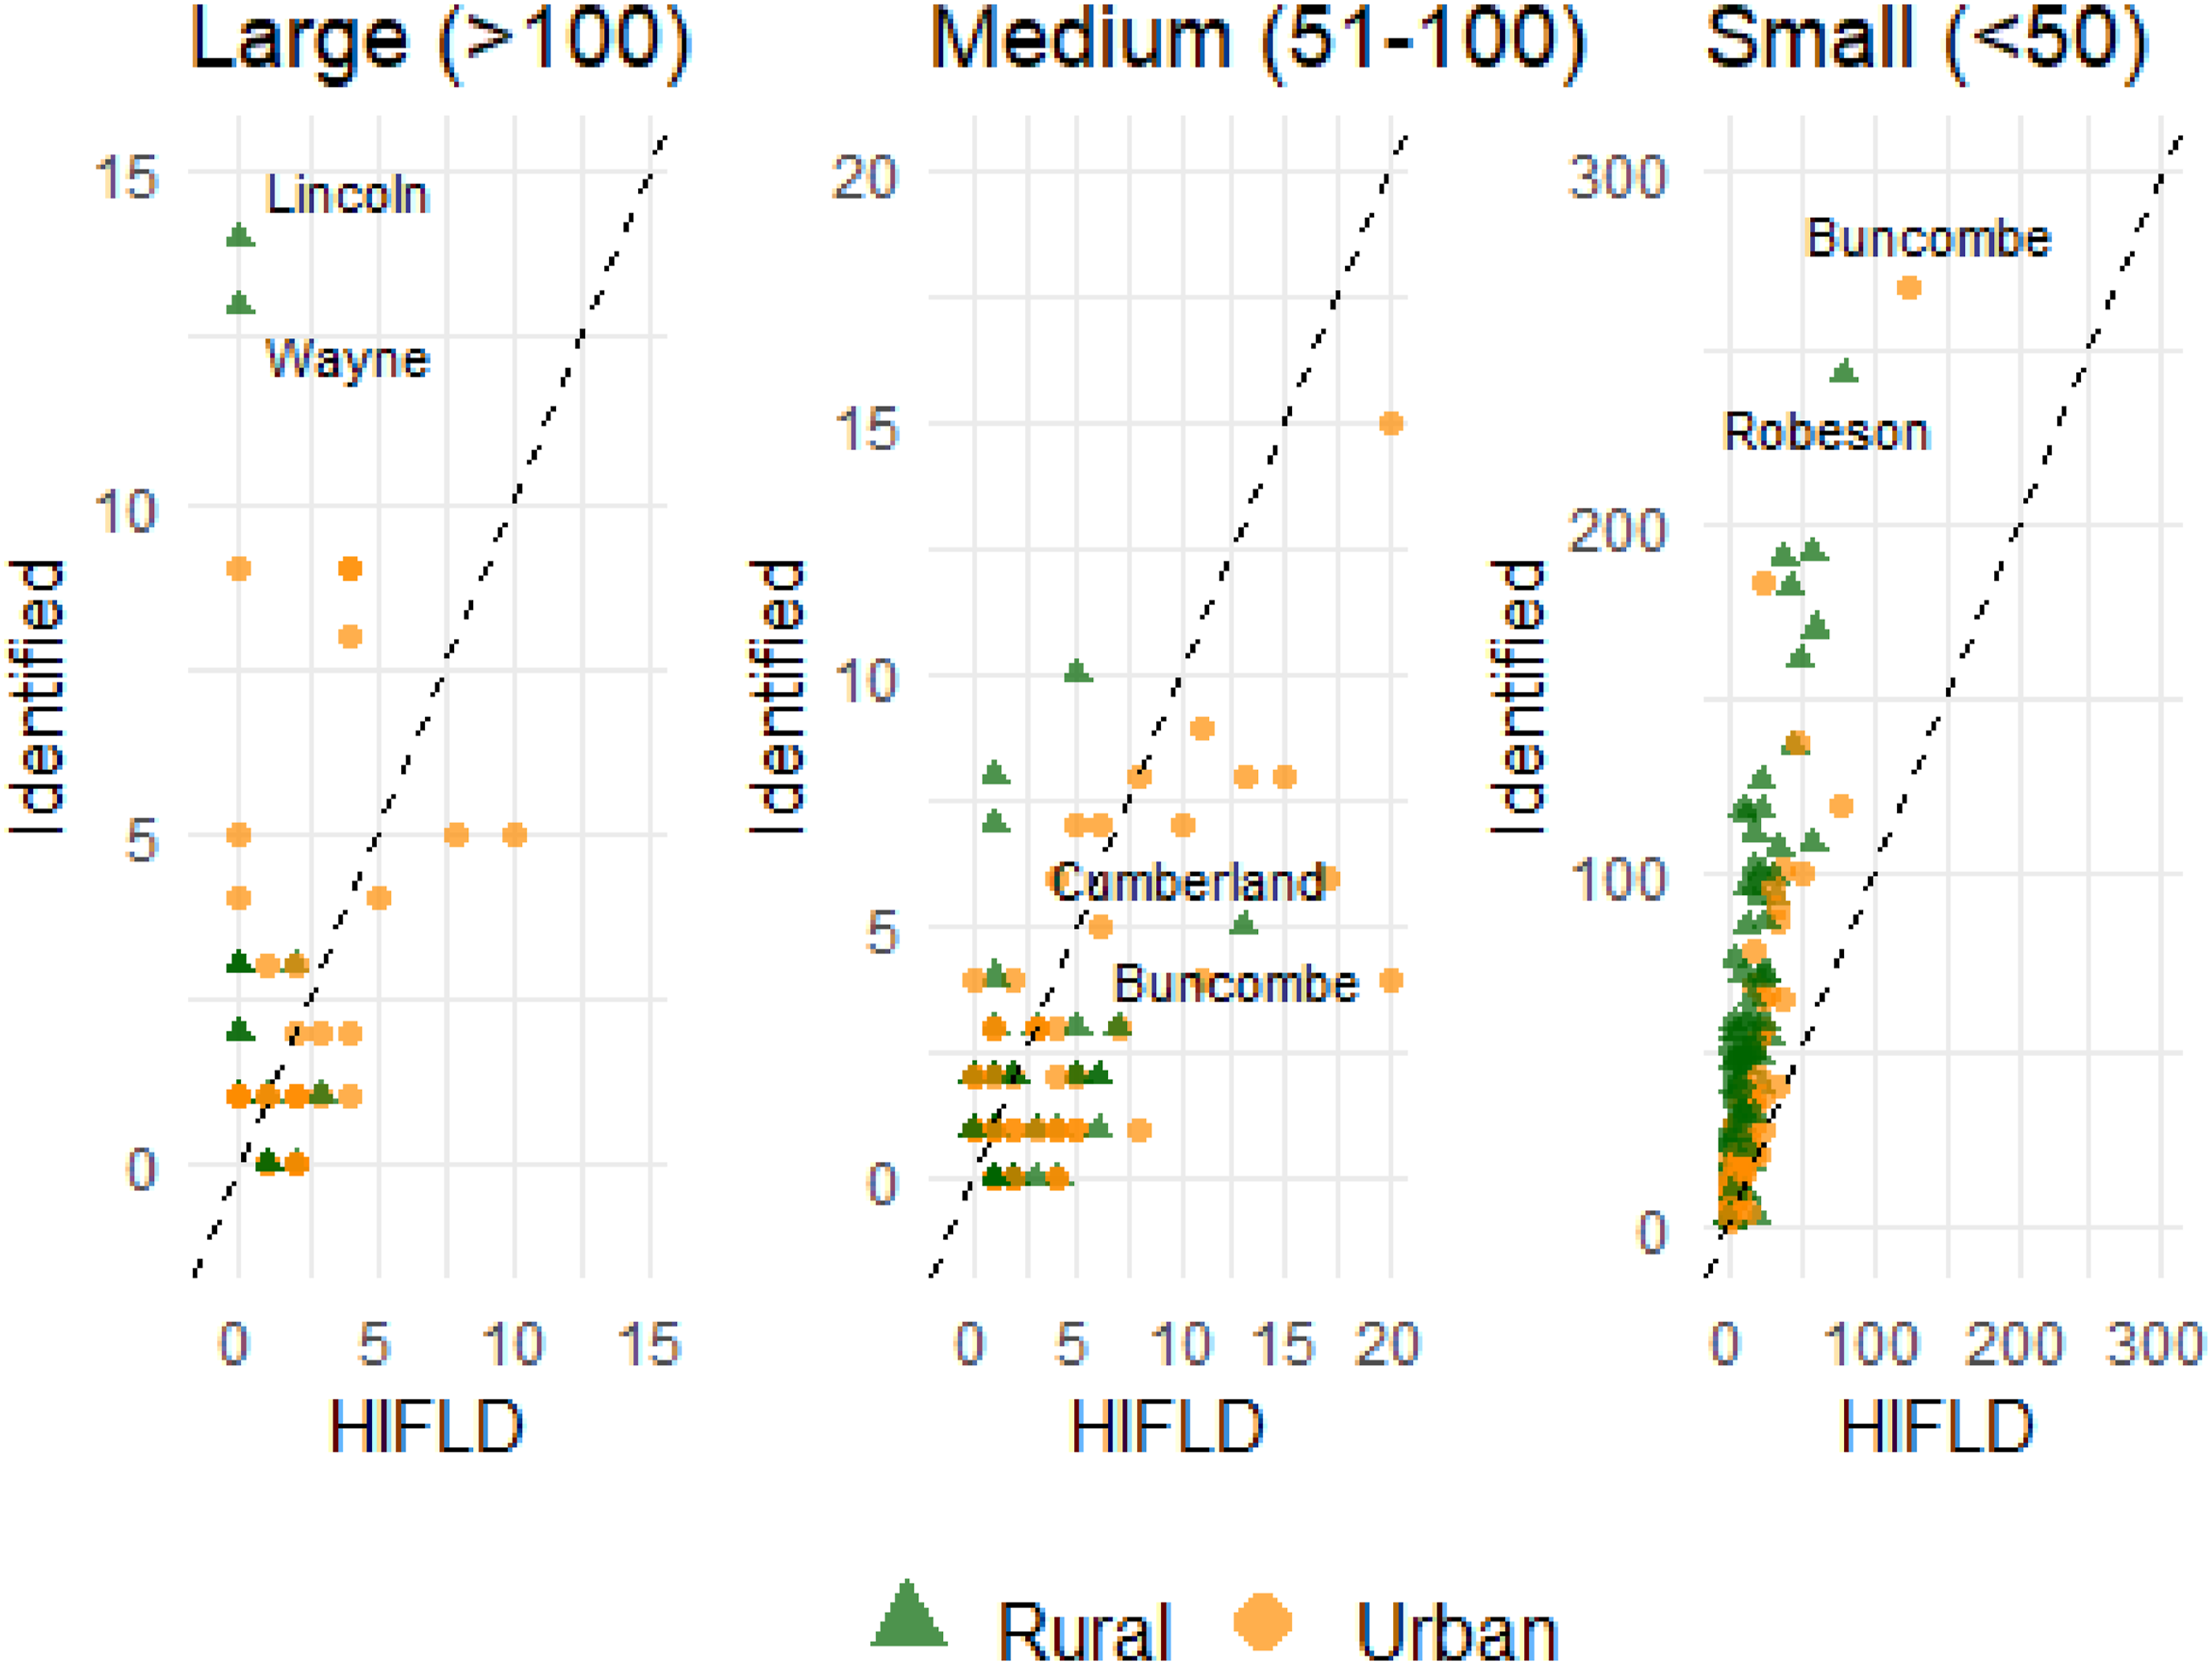
In three counties, Orange, Scotland, and Perquimans, we identified fewer MHP overall compared to the Homeland Security (2022) dataset. Our approach identifies fewer medium-sized MHP, and substantially more smaller-sized MHP. While this is difficult to ascertain without ground-truthing each MHP identified, potential reasons for the deficit include the limitations of computer vision and the vintage and non-concurrency of datasets. Most NC HIFLD validations (1838/2971) occurred in 2014, with updates in 2020 and 2024. MHP might have relocated or been displaced. In areas where we identify none when the HIFLD dataset has records (X-axis on Figure 3), the HIFLD data is out of date. Other reasons for discrepancies include an HIFLD MHP record not currently being an MHP, empty lots in the MHP, or the absence of a residential community altogether.
False negatives (areas in which this approach was unsuccessful in identifying an existing MHP) were identified by inspecting the MHP in Orange County. The county is also one of the counties in which we found fewer MHP than HIFLD (eight compared to 36 MHP in HIFLD). We looked at all 36 HIFLD MHP in Google Maps satellite view for the most recent publicly accessible imagery, as well as the high-resolution imagery we used. We observed inaccuracies in the geocoordinates in the HIFLD dataset. We identified vegetation cover as the most common reason for underperformance in Orange County. For example, pine trees, because of their evergreen nature and other trees can reduce the visibility of MHU in aerial images even when imagery is typically captured in months with reduced vegetation cover. Since North Carolina has one of the highest acreages of forest cover in the United States (NCFS, 2017), we can assume this is a pertinent state-wide limitation.
Comparison of the count of parcels that can be associated with MHP with the MHP identified using computer vision approach. Twelve counties have such parcels identifiable from text descriptions of parcel records. In counties with 100+ parcels with MHP, the computer vision approach identifies fewer MHP, and in counties with below 100 parcels associated with MHP, computer vision approach identifies typically more MHP.
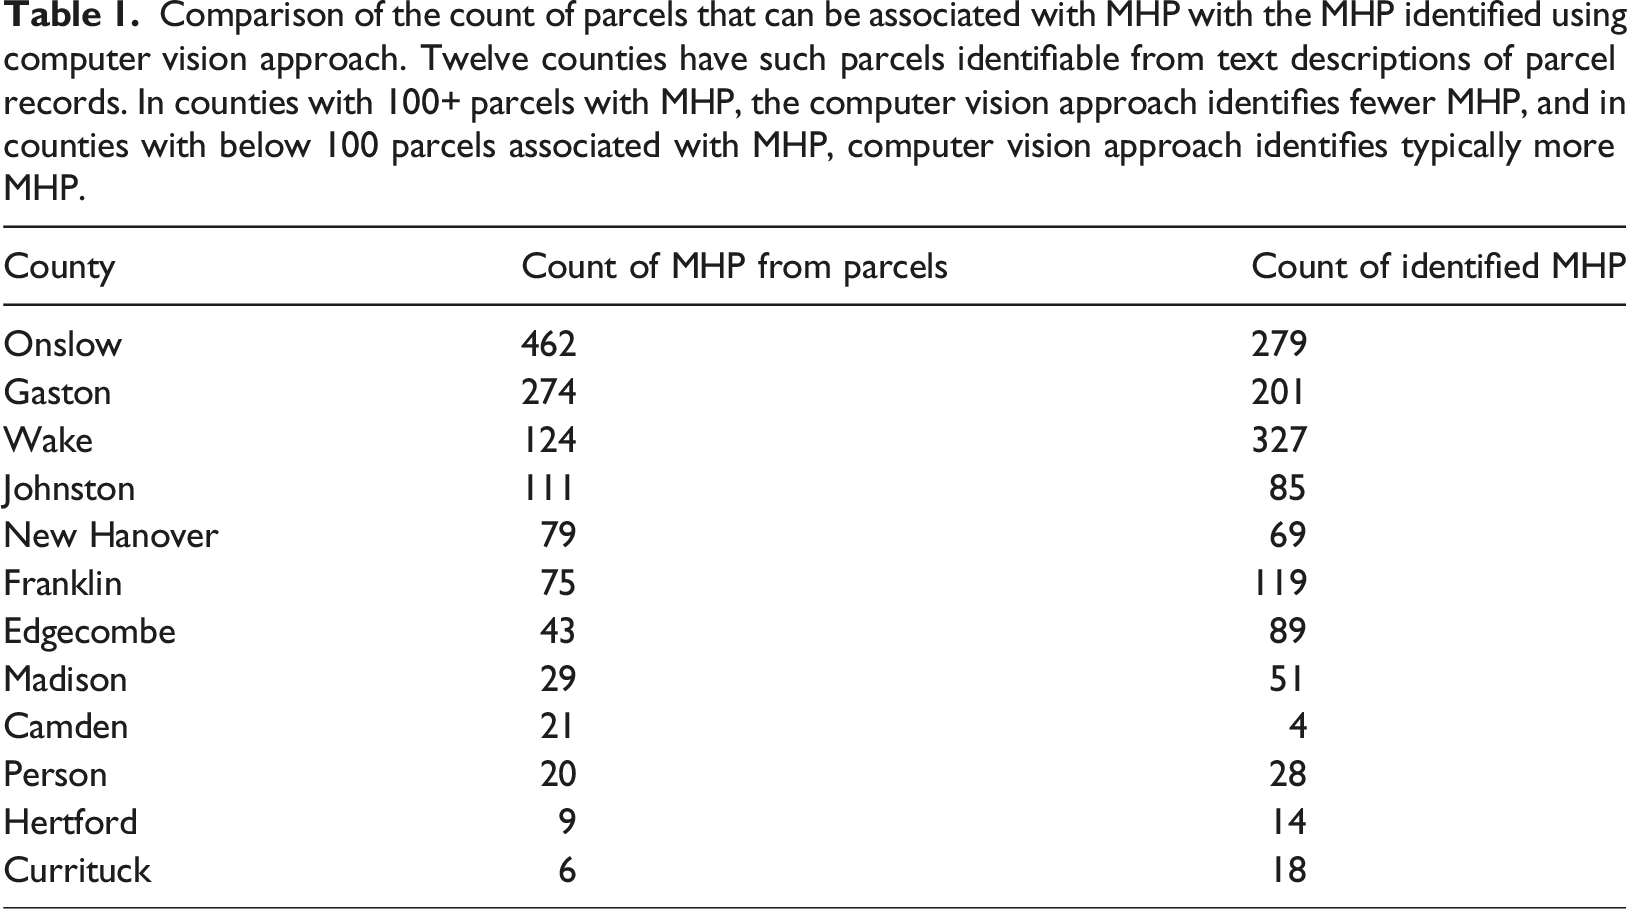
Our observed counts of manufactured home parks (MHP) differed notably from parcel records across counties. In Onslow County, we identified 183 fewer MHP than parcel records. Through manual verification using Google Maps’ Satellite View, we found that dense tree cover reduced the detections. Varying definitions of MHP made comparison more difficult. For instance, we encountered parcels classified as MHP serving additional commercial purposes, such as a carpentry business, challenging our residential-focused MHP criteria. Wake County presented the opposite scenario, where we detected 203 more MHP than listed in parcel records, where many parcels with three or more MHU were not designated as MHP, due to outdated record-keeping. These findings underscore two critical needs: establishing standardized MHP definitions across datasets and implementing a multi-source verification approach to ensure accurate MHP documentation.
Open data can be transformative in urban analytics and planning (Liu and Ying, 2016). Openly available datasets, even when incomplete, such as HIFLD and building footprints databases, were instrumental in this effort. We hope that our results will spur further efforts into building better models and monitoring the evolution of MHP over time. This MHP dataset enables multiple critical applications for climate resilience and emergency management. For example, emergency managers can leverage the dataset to conduct vulnerability assessments at the household, housing structure, and park community levels, addressing the current data gaps that leave manufactured housing communities invisible in disaster planning and response (Hamshaw and Baker, 2024). Climate researchers can use the dataset to assess tornado vulnerability and flood risk exposure, enabling targeted studies of protective decision-making and anchoring behaviors among vulnerable populations (Rumbach et al., 2020). Hazard preparedness studies can utilize the dataset to identify at-risk communities, supporting research on protective behaviors and anchoring decisions among mobile home residents (Shivers-Williams and LaDue, 2022). Additionally, the dataset supports longitudinal disaster recovery research by enabling before-and-after comparisons of MHP locations and characteristics following extreme weather events, building on established methodologies for studying the vulnerability of this often-overlooked “third housing type” in disaster research (Rumbach and Sullivan, 2018).
Our approach represents more than simply the output of a computer vision model. It combines domain expertise, geospatial datasets, and human validation. This approach enables us to locate MHP more comprehensively than is available in current records. While computer vision techniques were useful, limitations resulting from vegetation/shades in aerial images, as well as the size/diversity of the training dataset, resulted in a less-than-ideal number of detections. Using ancillary datasets helped us address the limitations. By merging the locations of MHU with parcels, followed by post-processing and human validation, we were able to identify MHP even when not all MHU in the parcel were detected. This approach is scalable and can be used to identify MHP in other states or countries.
The main contribution of this paper is to demonstrate the usefulness of a computer vision-based approach to identify urban artifacts at a large geographic scale. This study implements computer vision to systematically identify manufactured home parks across an entire state, demonstrating that automated detection can fill critical gaps in housing data at a much larger scale than previous efforts. While the specific application focuses on North Carolina’s MHP, the methodology provides a template that could be adapted to identify similar housing types in other regions or states, offering a practical tool for emergency planners, researchers, and policymakers. The approach identified three times more manufactured home parks than existing databases, highlighting both the potential of computer vision and the significant data gaps that currently exist for this important source of affordable housing. Furthermore, this study adds nuance to the understanding of the geographic distribution of MHP and MHU by operating at a state-wide level, compared to county-level studies, such as those in Los Angeles in California (Pierce et al., 2018), and Hildago County in Texas (Durst et al., 2021). This study also sheds light on understudied rural, smaller MHP.
Limitations and future work
While this study demonstrates that computer vision can be useful, adopters should recognize the labor-intensive nature of computer vision. Implementing computer vision for urban applications requires thorough consideration of time, computational resources, availability of satellite and aerial imagery and ancillary datasets, and technical capabilities. In the future, a more crowdsourced approach could improve the quantity and quality of the training data. Recent developments in zero-shot segmentation and vision language models could streamline training data creation and validation (Ravi et al., 2024).
The major limitations in identifying MHP resulted from applying computer vision methods to a large geographic area. Environmental factors (e.g., trees, shades) reduce visibility and impact recall. While we used aerial imagery collected in the months with the least amount of tree cover, tree cover remains a persistent challenge. The use of aerial images bypasses cloud cover; however, satellite imagery would have to account for clouds.
The training dataset may not be fully representative of the MHU in North Carolina, leading to sub-optimal out-of-sample performance. The diverse geography of North Carolina compounds the challenge of creating a representative training dataset, with limited ground-truthing. We addressed low recall arising from foliage by validating cropped imagery of parcels containing mobile housing units instead of individual housing unit inferences, but this approach fails if all housing units in a parcel are covered by foliage or shading.
This work validates that computer vision can help identify specific housing/building types. While we use high-resolution aerial imagery, medium-resolution satellite imagery (50 cm–1 m) can also be used. The training dataset we created can be used in other geographies.
Conclusion
The lack of comprehensive, publicly available records of MHP is a major challenge in their climate resilience planning. We used a computer vision-based approach to detect individual manufactured housing from satellite imagery and identify more MHP than any other dataset. We find that while MHP represent an urban-fringe phenomenon, as noted in past literature, they are not exclusively so. The prevalence of MHP in the urban fringes reflects a trade-off between economic opportunity and affordability, pushing residents toward areas with fewer amenities and oversight. Spatial and economic factors that make manufactured housing affordable also render it vulnerable to a lower quality of life and make it less climate resilient. This paper thus makes both methodological and domain-specific contributions to equitable housing literature. These housing types are overlooked by policy and research, and we hope that by highlighting the pervasiveness of this housing type, we can reduce the vulnerability of the residents.
Supplemental Material
Supplemental Material - Characterizing manufactured home parks in North Carolina: A computer vision based approach
Supplemental Material for Characterizing manufactured home parks in North Carolina: A computer vision based approach by Kshitiz Khanal, Nikhil Kaza, Miyuki Hino, Antonia Sebastian in Environment and Planning B: Urban Analytics and City Science
Footnotes
Funding
The authors disclosed receipt of the following financial support for the research, authorship, and/or publication of this article: This work was supported by the 2023 School of Data Science and Society Seed Grant.
Declaration of conflicting interests
The authors declared no potential conflicts of interest with respect to the research, authorship, and/or publication of this article.
Data Availability Statement
The dataset generated as part of the study is released publicly. It is available at https://doi.org/10.5281/zenodo.16317705 (Khanal et al., 2025a). The model can be accessed at https://github.com/kshitizkhanal7/NC_MHP_YOLO (Khanal et al., 2025b).
Supplemental Material
Supplemental material for this article is available online.
Note
Author biographies
References
Supplementary Material
Please find the following supplemental material available below.
For Open Access articles published under a Creative Commons License, all supplemental material carries the same license as the article it is associated with.
For non-Open Access articles published, all supplemental material carries a non-exclusive license, and permission requests for re-use of supplemental material or any part of supplemental material shall be sent directly to the copyright owner as specified in the copyright notice associated with the article.